Category: Demographics

  • The Costs of Smart Growth Revisited: A 40 Year Perspective

    “Soaring” land and house prices “certainly represent the biggest single failure” of smart growth, which has contributed to an increase in prices that is unprecedented in history. This  finding could well have been from our new The Housing Crash and Smart Growth, but this observation was made by one of the world’s leading urbanologists, Sir Peter Hall, in a classic work 40 years ago. Hall led an evaluation of the effects of the British Town and Country Planning Act of 1947 (The Containment of Urban England) between 1966 and 1971. The principal purpose of the Act had been urban containment, using the land rationing strategies of today’s smart growth, such as urban growth boundaries and comprehensive plans that forbid development on large swaths of land that would otherwise be developable.

    The Economics of Urban Containment (Smart Growth): The findings of Hall and his colleagues were echoed later by a Labour Government report in the mid-2000s which showed housing affordability had suffered under this planning regime. Author Kate Barker was a member of the Monetary Policy Committee of the Bank of England, which like America’s Federal Reserve Board, is in charge of monetary policy. Among other things, the Barker Reports on housing and land use found that urban containment had driven the price of land with "planning permission" to many multiples (per acre) above that of comparable land where planning was prohibited. Under normal circumstances comparable land would have similar value.

    Whether coming from the left or right, economists have demonstrated that prices tend to rise when supply is restricted, all things being equal.  Certainly there can be no other reason for the price differentials virtually across the street that occur in smart growth areas. Dr. Arthur Grimes, Chairman of the Board of New Zealand’s central bank (the Reserve Bank of New Zealand), found the differential on either side of Auckland’s urban growth boundary at 10 times, while we found an 11 times difference in Portland across the urban growth boundary. 

    House Prices in America: The Historical Norm: Since World War II, median house prices in US metropolitan areas have generally been between 2.0 and 3.0 times median household incomes (a measure called the Median Multiple). This included California until 1970 (Figure 1). After that, housing became unaffordable in California, averaging nearly 1.5 times that of the rest of the nation during the 1980s and 1990s (adjusted for incomes). Even after the huge price declines from the peak of the bubble, house prices remain artificially high in Los Angeles, San Francisco, San Diego and San Jose, with median multiples of six or higher.

    William Fischel of Dartmouth University examined a variety of justifications for the disproportionate rise of California housing prices and dismissed all but more restrictive land use regulation. He noted that "growth controls (restrictive land use regulations) have the undesirable effect of raising housing prices." Throughout the rest of the nation, more restrictive land use regulations have been present in every market where house prices rose substantially above the historic Median Multiple norm, even during the housing bubble. No market without smart growth has ever reached these heights.

    Setting Up for the Fall: Excessive Cost Increases in Smart Growth Markets: The Housing Crash and Smart Growth, published by the National Center for Policy Analysis, examined the causes of house price increase during the housing bubble. The analysis included all metropolitan areas with more than 1,000,000 population. It focused on 11 metropolitan areas in which the greatest cost increases occurred (the "ground zero" markets), comparing them to cost increases in the 22 metropolitan areas with less restrictive land use regulation (Note 1).

    • Less Restrictively Regulated Markets: In the less restrictively regulated markets, the value of the housing stock rose approximately $560 billion, or 28 percent from 2000 to the peak of the bubble (Note 2). In nearly all of these markets, the Median Multiple remained within the historical range of 2.0 to 3.0 and none approached the high Median Multiples that occurred in the "ground zero" markets.
    • Ground Zero Markets The value of the housing stock rose $2.9 trillion from 2000 to the peak of the bubble in the "ground zero" markets, all of which have significant land use restrictions (Note 3). The 112 percent increase in the "ground zero" markets was four times that of the less restrictively regulated markets. The Median Multiple rose to unprecedented levels in each of the "ground zero" markets, peaking at from 5.0 to more than 11.0, four times the historic norm.

    The 28 percent increase in relative house value that occurred in the less restrictively regulated markets (those without smart growth) is attributed to the influence of loosened lending standards. The excess above 28 percent, which amounts to $2.2 in the "ground zero" markets is attributed to to the supply restricting strategies of smart growth (Figure 2).

    The Fall: Smart Growth Losses

    The largest house price drops occurred in the markets that had experienced the greatest cost escalation, both because prices were artificially higher but also because prices in smart growth markets are more volatile.  The "ground zero" markets, with only 28 percent of the owner occupied housing stock, accounted for 73 percent of the pre-crash losses ($1.8 trillion). Thus, much of the cause of the housing crash, which most analysts date from the Lehman Brothers bankruptcy (September 15, 2008), can be attributed to these 11 metropolitan areas.

    By contrast, the 22 less restrictively regulated markets accounted for only six percent ($0.16 trillion) of the pre-crash losses. These 22 markets represented 35 percent of the owned housing stock (Figure 3).

    If the losses in the ground zero markets had been limited to the rate in the less restrictively regulated markets (the estimated impact of cheap credit), losses would have been $1.6 trillion less (Note 4). The Great Recession might not have been so "Great."

    Economic Denial and Acknowledgement: In his writing forty years ago, Dr. Hall noted that English planners denied the connection between the unprecedented house price increases and urban containment. This same denial also informs smart growth advocates today. This is perhaps to be expected, because, as Hall noted 40 years ago, an understanding of the longer term consequences would have undermined support for these policies.

    To their credit, some advocates recognize that smart growth raises house prices. The Costs of Sprawl – 2000¸ a volume largely sympathetic to smart growth, also indicates that urban containment strategies can raise housing prices. The only question is how much smart growth raises house prices. The presence of urban containment policy is the distinguishing characteristic of metropolitan markets where prices have escalated well beyond the historic norm.

    The Social Costs of Smart Growth: Moreover, the social impacts of smart growth are by no means equitable. Peter Hall says that the "less affluent house-owner … has paid the greatest price for (urban) containment" (Note 5). He continues: "there can be little doubt about the identity of the group that has got the poorest bargain. It is the really depressed class in the housing market: the poorer members of the privately-rented housing sector." Finally, Hall laments as well the impact of these policies on the "ideal of a property owning democracy."

    Hall’s four decades old concern strikes a chord on this side of the Atlantic. Just last week, a New York Times/CBS News poll found that nine out of ten respondents associated home property ownership with the American Dream. Planning needs to facilitate people’s preferences, not get in their way.

    ——–

    Note 1: The housing stock value uses a 2000 base, which adjusts house prices based upon the change in household incomes to the peak.

    Note 2: The underlying demand for housing was substantial in some of the less restrictively markets, which is illustrated by the strong net domestic migration to metropolitan areas such as Atlanta, Austin, Dallas – Fort Worth, Houston, Raleigh and San Antonio. At the same time, some more restrictive markets (smart growth) that hit historically experienced strong demand were experiencing huge domestic outmigration, indicating little in underlying demand. This includes Los Angeles, San Francisco, San Diego and San Jose. Demand, however is driven upward in more restrictively metropolitan areas by speculation which, according to the Federal Reserve Bank of Dallas is attracted by supply constraints.

    Note 3: The 11 "ground zero" metropolitan markets were Los Angeles, San Francisco, San Diego, San Jose, Sacramento, Riverside-San Bernardino, Las Vegas, Phoenix, Tampa-St. Petersburg, Miami and the Washington, DC area.

    Note 4: The pre-crash losses in the 18 other restrictively regulated markets were $0.5 trillion. These markets accounted for 37 percent of owner occupied housing in the metropolitan areas of more than 1,000,000 population, compared to 35 percent in the less restrictively regulated markets, yet had losses three times as high.

    Note 5: The Containment of Urban England also indicates that new house sizes have been forced downward by the planning regulations (see photo at the top of the article).

    Photograph: New, smaller exurban housing in the London area (by author)

    Wendell Cox is a Visiting Professor, Conservatoire National des Arts et Metiers, Paris and the author of “War on the Dream: How Anti-Sprawl Policy Threatens the Quality of Life

  • The Next Boom Towns In The U.S.

    What cities are best positioned to grow and prosper in the coming decade?

    To determine the next boom towns in the U.S., with the help of Mark Schill at the Praxis Strategy Group, we took the 52 largest metro areas in the country (those with populations exceeding 1 million) and ranked them based on various data indicating past, present and future vitality.

    We started with job growth, not only looking at performance over the past decade but also focusing on growth in the past two years, to account for the possible long-term effects of the Great Recession. That accounted for roughly one-third of the score.  The other two-thirds were made up of a a broad range of demographic factors, all weighted equally. These included rates of family formation (percentage growth in children 5-17), growth in educated migration, population growth and, finally, a broad measurement of attractiveness to immigrants — as places to settle, make money and start businesses.

    We focused on these demographic factors because college-educated migrants (who also tend to be under 30), new families and immigrants will be critical in shaping the future.  Areas that are rapidly losing young families and low rates of migration among educated migrants are the American equivalents of rapidly aging countries like Japan; those with more sprightly demographics are akin to up and coming countries such as Vietnam.

    Many of our top performers are not surprising. No. 1 Austin, Texas, and No. 2 Raleigh, N.C., have it all demographically: high rates of immigration and migration of educated workers and healthy increases in population and number of children. They are also economic superstars, with job-creation records among the best in the nation.

    Perhaps less expected is the No. 3 ranking for Nashville, Tenn. The country music capital, with its low housing prices and pro-business environment, has experienced rapid growth in educated migrants, where it ranks an impressive fourth in terms of percentage growth. New ethnic groups, such as Latinos and Asians, have doubled in size over the past decade.

    Two advantages Nashville and other rising Southern cities like No. 8 Charlotte, N.C., possess are a mild climate and smaller scale. Even with population growth, they do not suffer the persistent transportation bottlenecks that strangle the older growth hubs. At the same time, these cities are building the infrastructure — roads, cultural institutions and airports — critical to future growth. Charlotte’s bustling airport may never be as big as Atlanta’s Hartsfield, but it serves both major national and international routes.

    Of course, Texas metropolitan areas feature prominently on our list of future boom towns, including No. 4 San Antonio, No. 5 Houston and No. 7 Dallas, which over the past years boasted the biggest jump in new jobs, over 83,000. Aided by relatively low housing prices and buoyant economies, these Lone Star cities have become major hubs for jobs and families.

    And there’s more growth to come. With its strategically located airport, Dallas is emerging as the ideal place for corporate relocations. And Houston, with its burgeoning port and dominance of the world energy business, seems destined to become ever more influential in the coming decade. Both cities have emerged as major immigrant hubs, attracting on newcomers at a rate far higher than old immigrant hubs like Chicago, Boston and Seattle.

    The three other regions in our top 10 represent radically different kinds of places. The Washington, D.C., area (No. 6) sprawls from the District of Columbia through parts of Virginia, Maryland and West Virginia. Its great competitive advantage lies in proximity to the federal government, which has helped it enjoy an almost shockingly   ”good recession,” with continuing job growth, including in high-wage science- and technology-related fields, and an improving real estate market.

    Our other two top ten, No. 9 Phoenix, Ariz., and No. 10 Orlando, Fla., have not done well in the recession, but both still have more jobs now than in 2000. Their demographics remain surprisingly robust. Despite some anti-immigrant agitation by local politicians, immigrants still seem to be flocking to both of these states. Known better s as retirement havens, their ranks of children and families have surged over the past decade. Warm weather, pro-business environments and, most critically, a large supply of affordable housing should allow these regions to grow, if not in the overheated fashion of the past, at rates both steadier and more sustainable.

    Sadly, several of the nation’s premier economic regions sit toward the bottom of the list, notably former boom town Los Angeles (No. 47). Los Angeles’ once huge and vibrant industrial sector has shrunk rapidly, in large part the consequence of ever-tightening regulatory burdens. Its once magnetic appeal to educated migrants faded and families are fleeing from persistently high housing prices, poor educational choices and weak employment opportunities. Los Angeles lost over 180,000 children 5 to 17, the largest such drop in the nation.

    Many of L.A.’s traditional rivals — such as Chicago (with which is tied at No. 47), New York City (No. 35) and San Francisco (No. 42) — also did poorly on our prospective list.  To be sure,  they will continue to reap the benefits of existing resources — financial institutions, universities and the presence of leading companies — but their future prospects will be limited by their generally sluggish job creation and aging demographics.

    Of course, even the most exhaustive research cannot fully predict the future. A significant downsizing of the federal government, for example, would slow the D.C. region’s growth. A big fall in energy prices, or tough restrictions of carbon emissions, could hit the Texas cities, particularly Houston, hard. If housing prices stabilize in the Northeast or West Coast, less people will flock to places like Phoenix, Orlando or even Indianapolis (No.11) , Salt Lake City (No. 12) and Columbus (No. 13). One or more of our now lower ranked locales, like Los Angeles, San Francisco and New York, might also decide to reform in order to become more attractive to small businesses and middle class families.

    What is clear is that well-established patterns of job creation and vital demographics will drive future regional growth, not only in the next year, but over the coming decade.  People create economies and they tend to vote with their feet when they choose to locate their families as well as their businesses.  This will prove   more decisive in shaping future growth   than the hip imagery and big city-oriented PR flackery that dominate media coverage of America’s changing regions.

    Cities of the Future Rankings
    Rank Metropolitan Area
    1 Austin, TX
    2 Raleigh, NC
    3 Nashville, TN
    4 San Antonio, TX
    5 Houston, TX
    6 Washington, DC-VA-MD-WV
    7 Dallas-Fort Worth, TX
    8 Charlotte, NC-SC
    8 Phoenix, AZ
    10 Orlando, FL
    11 Indianapolis, IN
    12 Salt Lake City, UT
    13 Columbus, OH
    14 Jacksonville, FL
    15 Atlanta, GA
    16 Las Vegas, NV
    16 Riverside, CA
    18 Portland, OR-WA
    19 Denver, CO
    20 Oklahoma City, OK
    21 Baltimore, MD
    22 Louisville, KY-IN
    22 Richmond, VA
    24 Seattle, WA
    25 Kansas City, MO-KS
    26 San Diego, CA
    27 Miami, FL
    28 Tampa, FL
    29 Sacramento, CA
    30 Birmingham, AL
    31 New Orleans, LA
    32 Philadelphia, PA-NJ-DE-MD
    33 Minneapolis, MN-WI
    34 St. Louis, MO-IL
    35 Cincinnati, OH-KY-IN
    35 New York, NY-NJ-PA
    37 Boston, MA-NH
    38 Memphis, TN-MS-AR
    39 Pittsburgh, PA
    40 Virginia Beach, VA-NC
    41 Rochester, NY
    42 Buffalo, NY
    42 San Francisco, CA
    44 Hartford, CT
    45 Milwaukee, WI
    45 San Jose, CA
    47 Chicago, IL-IN-WI
    47 Los Angeles, CA
    49 Providence, RI-MA
    50 Detroit, MI
    51 Cleveland, OH

    This piece originally appeared at Forbes.com.

    Joel Kotkin is executive editor of NewGeography.com and is a distinguished presidential fellow in urban futures at Chapman University, and an adjunct fellow of the Legatum Institute in London. He is author of The City: A Global History. His newest book is The Next Hundred Million: America in 2050, released in February, 2010.

    Photo by Exothermic Photography

  • Living and Working in the 1099 Economy

    We used to call it “Free Agent Nation.”  Now, it seems like the new term of art will be “The 1099 Economy.”   While the names may change, they all point to a phenomenon of rising importance: the growing number of Americans who don’t have a “regular job” but instead work on individual contracts with employers or customers.   These folks don’t get the traditional W-2 paystub at the end of the year; they report their taxes with the IRS form 1099.

    The 1099ers are a growing part of our economy.   There are a number of ways to slice the data.  If you look at US Census Bureau figures on the self-employed, we find 21.4 million self-employed Americans in 2008.  Recent data from EMSI suggests that the figures might be even higher.   Tracking workers who are not covered by unemployment insurance, the EMSI researchers suggest that more than 40 million Americans operate in the 1099 economy.   This represents about 1/5 of the total US workforce.

    As someone who has operated in the 1099 Economy for a decade, I can state that there are many benefits to this status:  more flexibility, more opportunities for unique and creative work, and more control over one’s work circumstances.    And, 1099 status can be profitable. Many fast growing ventures operate as sole proprietorships.  For example, in 2008, the Inc. 500 list looked at the ownership structures of firms on this list of US’s fast growing companies.  The largest sole proprietorship, Milwaukee’s Service Financial, had $11 million in revenue, but only one employee, its owner. 

    While the freedom of operating in Free Agent Nation can be tempting, there are downsides.  The data suggests that for many people, operating in the 1099 Economy may not be their first choice.  The EMSI research cited above found that the number of non-covered jobs in the US grew by 4 million between 2005 and 2009.   The fastest growth occurred in the mining, quarrying, and oil/gas extraction sectors where more than half of all workers are now non-covered.  Other areas with high concentrations of 1099 workers are in real estate (74% of workers are non-covered) and agriculture/forestry (74%).  This non-covered status creates a more flexible labor market, but it also creates potential challenges for these workers operating in notoriously unstable industries. 

    The 1099 Economy has emerged somewhat below the radar over the past decade.  Few economic development organizations have devoted much thought or research to the needs of this segment of the economy.  And, that’s not a good thing if 20% of the local workforce is invisible to community leaders.   Based on my experience, I see several segments within the broad category of the 1099 economy:  the reluctant 1099ers, the entrepreneurial 1099ers, and the “gig economy” work force. 

    The Reluctant 1099ers:  This group includes those who operate in the 1099 economy because they have no choice.   This group includes those sectors that have previously operated with traditional employment contracts, but have now shifted to the new structures.  Examples include mining, utilities, finance and insurance, and some administrative fields.  While individuals in these specific jobs may be happy with their circumstances, the workers, in a collective sense, face a more uncertain and probably less profitable work situation as 1099 contractors.

    The Entrepreneurial 1099ers:   Many budding entrepreneurs operate in the 1099 economy.  Sole proprietorships and LLCs/LLPs may have numerous workers under contract, yet appear in government statistics as a self-employment venture.  While most sole proprietorships are quite small and generate limited revenue, a sizable portion does generate significant incomes and may be poised for rapid revenue and job growth.  These individuals and their firms are the invisible portion of many local entrepreneurial ecosystems.

    The “Gig Economy” Workforce:   Last but not least, the gig economy workforce refers to those who operate in industries that traditionally operate on a project or “gig” basis.  Perhaps the best known example is film-making where crews come together for a film and then break up for other projects.  Other examples include the arts, theatre, writing, web design, and construction.  These sectors have a long history of operating via these structures.  It is clear that more industries are moving in this direction as well.   In response, a host of new kinds of support organizations, such as New York’s Freelancer’s Union, are emerging.  If current trends continue, we can expect to see similar groups arising across the US.

    Regardless of how one classifies these workers, they remain largely invisible to policy makers and to economic and workforce developers.   That needs to change.  In addition to recognizing the importance of this part of the workforce, we also need to develop a more nuanced understanding of their concerns and needs.   At a minimum, providing a stronger safety net—as suggested by the Freelancer’s Union and others—makes sense.   It also makes sense to develop work spaces that support the 1099ers.   Here, the recent growth in co-work spaces is a positive trend.    Finally, we need new kinds of support and services for the 1099ers.  These might include traditional training in business development, but other supports, such as networking or peer-to-peer lending or on-line tools to find customers and partners should also be part of the mix.    It’s time to recognize that the 1099 economy is here to stay and will be an important part of every community’s workforce for decades to come.

    Erik R. Pages is the President of EntreWorks Consulting, an economic development consulting and policy development firm focused on helping communities and organizations achieve their entrepreneurial potential.

  • The Evolving Urban Area: Seattle

    Lunching at Seattle’s Space Needle, the casual observer might imagine that one of the nation’s most dense urban areas is spread out below. To the immediate south of the Space Needle is one of the nation’s premier downtown areas. In 2000 downtown Seattle had the seventh largest employment base in the country and was one of the most dense. Its impressive, closely packed buildings witness a storied past. For more than 60 years, between 1914 and 1990, downtown Seattle has had the tallest building on the West Coast, Smith Tower, and was the fourth tallest building in the world when built. It held the title for an impressive 55 years, from 1914 to 1969, when another Seattle building briefly took the title (1001 4th Avenue). Later (1985), Seattle’s Columbia Center became the first building on the West Coast to exceed 75 floors, but by 1990 had been passed by the U.S. Bank Tower in Los Angeles (see Elliot Bay photograph and Note 1).

    However, looks can be deceiving.  In 2000, Seattle ranked last in urban population density out of the 11 urban areas in the 13 western states with more than 1 million population (just behind Portland, which ranked next-to-last).  The Seattle urban area’s density was approximately 60 percent below that of Los Angeles, the US’s  densest urban area. Even the Houston and Dallas-Fort Worth urban areas, famous for their great expanse, were denser than Seattle. Updated urban area density data from the 2010 census will not be available for at least a year.

    Nor is the historical core municipality of Seattle particularly closely packed. With a population density of 7,200 per square mile, the city of Seattle is considerably less dense than a number of Los Angeles suburbs such as Santa Ana (12,000) and Garden Grove (9,500). Even so, the city of Seattle is nearly two-thirds more dense than the city of Portland (4,400), despite the latter’s densification claims.

    The 2010 Census: The 2010 census indicates a continuing dispersion of population in the Seattle metropolitan region (Figure 1). The Seattle metropolitan region, formally the Seattle combined statistical area (Note 2) is composed of the core Seattle metropolitan area (King, Pierce and Snohomish counties) and five exurban statistical areas, Bremerton (Kitsap County), Olympia (Thurston County), Mount Vernon (Skagit County), Oak Harbor (Island County) and Shelton (Mason County).

    Seattle Combined Statistical Area: Population 2000-2010
    Area 2000 2010 Change % Share of Growth Share of Population
    City of Seattle        563,374        608,660           45,286 8.0% 9.2% 14.5%
    Balance: King County     1,173,660     1,322,589        148,929 12.7% 30.3% 31.5%
    Pierce & Snohomish Counties     1,306,844     1,508,560        201,716 15.4% 41.0% 35.9%
    Metropolitan Area Outside Seattle    2,480,504    2,831,149        350,645 14.1% 71.2% 67.4%
    Metropolitan Area     3,043,878    3,439,809        395,931 13.0% 80.4% 81.9%
    Exurban Metropolitan Areas        663,260        759,503           96,243 14.5% 19.6% 18.1%
    Combined Statistical Area    3,707,138    4,199,312        492,174 13.3% 100.0% 100.0%
    Calculated from US Census data


    City of Seattle (Historical Core Municipality): Overall, the historical core city of Seattle grew 8.0 percent, from 564,000 to 609,000 between 2000 and 2010, which was one of the healthiest increases among major cities. In adding 45,000, the city still only accounted for 9.2 percent of the Seattle metropolitan region population growth.  The city of Seattle now constitutes less than 15 percent of the metropolitan region population, down from 36 percent 1950 (same geographic area). In 1950, the city of Seattle had nearly two thirds of the population of King County. By 2010, the city of Seattle was less than one third of King County’s population, despite annexations. As the city has continued to decline in its share of the metropolitan region’s population, the impressive downtown area has also lost its dominance and by 2009 had fallen to 8 percent of the metropolitan region’s employment.

    Inner Suburbs: Areas outside the city of Seattle accounted for more than 90 percent of growth in the metropolitan region. The inner suburbs, which include the residential development to the south, north and east of Seattle in King County grew more than 50 percent faster than the city of Seattle, at 12.7 percent between 2000 and 2010. The inner suburbs grew from 1,170,000 to 1,320,000, adding nearly 150,000 new residents, more than three times the city of Seattle increase. King County outside Seattle also captured 30 percent of the metropolitan region’s growth and now has 32 percent of the metropolitan region’s population. The eastern suburbs of King County are home to one of the nation’s largest, most diverse and successful edge cities, Bellevue, as well as the Microsoft campus in neighboring Redmond.

    Outer Suburbs: The outer suburbs, which include Pierce County (Tacoma is the county seat) and Snohomish County grew 15.4 percent, nearly double the growth rate of the city of Seattle. The outer suburbs grew from 1.3 million to 1.5 million, adding 200,000 new residents, more than four times the city of Seattle’s increase. Pierce and Snohomish counties captured 41 percent of the metropolitan region’s growth and now account for 36 percent of the metropolitan region’s population.

    Exurban Areas:  The exurban statistical areas grew nearly as quickly as the outer suburbs. Between 2000 and 2010, the exurban areas increased their population by 14.5 percent.  The exurban statistical areas accounted for 20 percent of the metropolitan region’s population growth. These more distant areas grew from 660,000 to 760,000 people, adding nearly 100,000 new residents. This is more than double the increase in the city of Seattle population. Approximately 18 percent of the population in the metropolitan region lives in the exurban statistical areas, a larger number than residing in the city of Seattle.

    The Dispersion Continues: The dispersion of Seattle, like that of metropolitan regions around the nation and the world, has been going on for decades. The city of Seattle has accounted for only 5 percent of the metropolitan region’s population since 1950 (Figure 2) with suburbs and exurbs accounting for the vast majority of the nearly 3,000,000 increase.

    Despite the pre-2010 census media and academic drumbeat to the effect that metropolitan areas were no longer dispersing, the census revealed a totally different and even inconvenient truth. This does not mean that both residents of the entire metropolitan region, suburbs and core city, should not be proud of an attractive urban area in an incomparable natural setting. Yet, the vast majority of the region’s population and employment growth is taking place outside the core. Seattle is following the national and international pattern to ever greater dispersion.

    _________

    Note 1: Downtown Seattle is on a hill and the newer buildings are generally on higher ground than Smith Tower, which makes the difference in height look greater.

    Note 2: "Combined statistical areas" were formerly "consolidated metropolitan statistical areas."

    Top Photograph: Downtown Seattle from the Space Needle (by author)

    Wendell Cox is a Visiting Professor, Conservatoire National des Arts et Metiers, Paris and the author of “War on the Dream: How Anti-Sprawl Policy Threatens the Quality of Life

  • Will J.R. Recognize the New Dallas?

    In the sixties and seventies, Dallas’s prime tourist attraction was an assassination site. The town seriously needed a new image. It got one in a soap opera that revealed a city besieged by blonds, big  hair and big homes. “Dallas,” which premiered in 1978, did for Big D what “Sex in the City” and “Seinfeld” did for New York: it painted a portrait of the city for the world.

    The last “Dallas” episode aired in 1991, but TNT recently resurrected the hit show. This iteration features a new crop of Ewings beside originals Larry Hagman, Linda Gray, and Patrick Duffy. Dallas, of course, was never like “Dallas.” Since the series premiered, Dallas evolved. From its residents to its politics, Dallas today bears little resemblance to the city the show depicted. Which Dallas will J.R. come home to?

    When the series debuted, Dallas was a conservative place. In 1980, Reagan took 59 percent in Dallas County, the anchor of the much larger Dallas-Fort Worth metroplex, now home to more than 6 million people. As the county grew, it became more diverse, and consequently, more Democratic.  No one would mistake it for San Francisco, politically and demographically, but it more resembles present-day Los Angeles than old Dallas.    

    In 2008, for example, Obama won 57 percent in Dallas County. Since “Dallas” first aired, Dallas elected two female Jewish mayors and an African-American, current U.S. Trade Representative Ron Kirk. Although voters rejected gay marriage in 2005, they sent openly gay city councilor Ed Oakley to a mayoral runoff two years later (Oakley lost). If a real J.R. today causes trouble, he’ll contend with Sheriff Lupe Valdez, who’s also gay.     

    Minority growth transformed Dallas County politics. In 1980, there were two white residents for each non-white resident. Now, it’s the other way around. After “Dallas,” whites fled to northern exurbs. African-Americans, Hispanics, and other minorities spread throughout the urban core and inner-ring suburbs. Dallas votes Democratic; the surrounding counties don’t. Southfork Ranch, the white mansion in the “Dallas” opening, sits in rock-Republican Collin County, a mostly white, upper-middle class area with more than five times the residents as were there in 1980. In many respects, this is where “Dallas” culture – as defined by the old series – still thrives.

    Outposts of the exclusive “Dallas” lifestyle still exist in much of North Dallas. George W. Bush settled into his post-presidency in an 8,500 sq. ft. Preston Hollow estate. Old-moneyed enclaves Highland Park and University Park draw the ire and envy of the metroplex. In Good Christian Bitches, socialite Kim Gatlin dishes about Botoxed beauties and Bible belt back-stabbers. These clichés sell: ABC used her Park Cities-inspired tale for their upcoming series “Good Christian Belles.”

    Besides the population, the economy has also diversified: oil is now an ensemble player, not the lead. Exxon Mobil has headquarters near Dallas, but Houston is the energy superstar, despite not getting its own show. The metroplex hosts twenty Fortune 500 companies, including Southwest Airlines, Texas Instruments, and GameStop. This mix, along with the fact the region mostly avoided the housing crisis, explains why the recession hurt Dallas less than other cities.

    If you only saw “Dallas,” you’d suspect shoulder pads and cowboy boots pass for high-fashion. But Dallas was always more cosmopolitan than the series let on. Neiman Marcus started in Dallas. Dallasites who can afford to—and many who can’t—gather at upscale eateries, fashion premiers, and charity galas.  J.R. Ewing-types may fill Cowboys Stadium suites, but they also fill box-seats at the $354 million AT&T Performing Arts Center. It’s not all BBQ, rodeos, and pageant queens in Big D.

    That perception, nonetheless, persists as does the idea of J.R. as the archetypal Texan. On a trip to Spain, his name came up after I told my hosts I was from Texas. Who knew Sevillanos loved Aaron Spelling productions? As Dallas transforms, it can’t shake the cowboy/oilman stereotype. Like a Hollywood starlet, Dallas has been typecast.

    But still I hope the next “Dallas” includes a broader cast of characters. An uptown Indian high-tech executive or feisty female mayor would be nice. Producers must show off the city’s grandiosity. Dallas strives for bigger and best, for bragging rights if no more; it never lets up. The same year it lost a quixotic Olympic bid, it opened the colossal American Airlines Center. Ridiculed in the nineties, the Dallas Mavericks stand as N.B.A. champs today. Always scouting for new business, Dallas lured AT&T from San Antonio in 2008.

    “Dallas” left fans wondering, “Who shot J.R.?” The real mystery, three decades later, is why a multi-layered city retains a one-note reputation. Dallas, after all, has remade itself.          

    Writer Jason Thurlkill grew up near Dallas. He reported for “The Hotline” and a “New York Observer” publication. Previously, he worked for a Washington D.C. political consulting firm. He studied government at the University of Texas and earned his Master of Public Policy at the University of Chicago.

    Photo by david.nahas.

  • Outlawing New Houses in California

    UCLA’s most recent Anderson Forecast indicates that there has been a significant shift in demand in California toward condominiums and apartments. The Anderson Forecast concludes that this will cause problems, such as slower growth in construction employment because building multi-unit dwellings creates less employment than building the detached houses that predominate throughout California and most of the nation. The Anderson Forecast says that this will hurt inland areas (such as the Riverside-San Bernardino area and the San Joaquin Valley) because their economies are more dependent on construction than coastal areas, such as Los Angeles, the San Francisco Bay Area and San Diego.

    Detached Housing Permits Remain Strong in the Historic Context: The Anderson Forecast reports that multi-unit building permits have recovered more quickly than building permits for detached housing. However, any such shift is likely to be highly volatile. Since the peak of the bubble, the distribution of building permits between detached and multi-unit in California has been on a roller coaster. Indeed the Anderson Forecast characterizes the "2010 US Census" as "showing a significant shift in demand toward condominiums and apartments." Actually, the 2010 US Census asked no question from which such a conclusion about housing types or any question from which such a conclusion could be drawn.

    The trends in the building permit data are not completely clear. In 2005, the year before prices started to collapse, 75 percent of building permits in California were for detached housing. This trended downward, reaching a low of 52 percent in 2008. In 2009, the detached housing recovered to account for 73 percent of all housing building permits. Then the figure fell back to 59 percent in 2010.

    With these erratic trends, it is tricky to forecast longer term market trends and consumer demand.  Economic projections in 1934 would have suffered from a similar problem, as the Great Depression was continuing and no one could really tell when it would end. Today’s continuing housing depression may be similar.

    Moreover, as the Anderson Forecast notes, detached housing construction declined in the early 1980s, dropping to 42 percent in 1985. In fact, over the 25 years between 1960 and 1985, detached houses accounted for an average of only 54 percent of new housing construction in California, well below the 2010 figure of 59 percent (Figure 1).

    Equally important, the condominium market remains in a deep depression. In 2010, less than four percent of houses built for sale in the United States were multi-unit buildings, including condominiums (Figure 2), as an increasing majority of multi-unit buildings have been built as rentals (Figure 3). Comparable California data is not available, but from the peak of the bubble (2006/7) to 2009, there was a loss of more than 3,000 owner occupied  multi-unit dwellings with 10 or more units, while owner occupied detached houses increased by nearly 100,000 (Note 1).

    If there is an intrinsic pent-up preference for condominium living, it is not evident in the poor performance of high-density developments even in such theoretically desirable places as Santa Monica, San Francisco, Oakland, San Jose and North Hollywood. Condominium prices, for example, have fallen 52 percent in the major California metropolitan areas, compared to 48 percent for single-family houses (Figure 4). Naïve developers, relying too much on the much promoted notion that suburban empty-nesters were chomping at the bit to move to new housing in the core area, often watched their empty units liquidated at $0.50 or less on the dollar or turned into rentals.  Further, if people are moving to apartments, it’s not for love of density but more likely due weakening economic circumstances.

    Inland California Continues to Grow Faster: The Anderson Forecast also suggests that growth in interior California will suffer because "workers are less likely to move inland into an apartment and commute toward the coast." This assumption of slower inland growth reflects the conventional wisdom that areas outside the large coastal metropolitan areas have stopped growing since the burst of the housing bubble as people flock towards the coastal urban core (Note 2). The reality is different, as interior California and the peripheral metropolitan areas of the larger metropolitan regions (Note 3) continue to grow more strongly even in bad economic times. After the burst of the bubble, from 2008 to 2010 (Figure 5):

    • In the Los Angeles area, the adjacent Riverside-San Bernardino ("Inland Empire") and Oxnard metropolitan areas, combined, have grown at seven times the rate of the core Los Angeles metropolitan area.
    • In the San Francisco Bay area, the adjacent Napa, Santa Cruz, Santa Rosa and Vallejo metropolitan areas, combined, have grown nearly twice as quickly as the core San Francisco and San Jose metropolitan areas.
    • California’s deep interior, the San Joaquin Valley has grown even faster than the exurban areas of Los Angeles and San Francisco.

    One key reason: most people who move to interior areas do not commute toward the core.  For example, less than 10 percent of workers in the Riverside-San Bernardino metropolitan area commute into Los Angeles County, a market share that declined 15 percent between 2000 and 2007. Many also simply cannot afford the higher cost of living in the coastal metropolitan areas, which likely will continue to retard growth in the core metropolitan areas.

    The Policy Threat to New Houses : A survey by the Public Policy Institute of California suggests a vast preference (70%) for detached housing among the state’s consumers.  This continuing preference is demonstrated by detached housing prices that are generally two times historic norms relative to incomes in the coastal metropolitan areas (Los Angeles, San Francisco, San Diego and San Jose).

    Yet now, this choice is under a concerted assault by both the state and many local governments, cheered on by most media and the academic community.  For years, planning regulations have driven land prices so high that house prices have risen to well above the rest of the nation (Figure 5) under regulations referred to by terms such as "smart growth" and "urban containment." The regulations and the inevitably resulting speculation propelled a disproportionate rise (nearly $2 trillion) in California house prices compared to national norm. If California house prices had risen at the same rate relative to incomes as in more liberally regulated areas, the loss to financial markets could have been hundreds of billions of dollars less when the bubble burst (Figure 6).

    Planning for Crowding and Density: California’s assault on detached housing is taking on a distinctly religious fervor.  The state’s global warming law (Assembly Bill 32) and urban planning law (Senate Bill 375) is providing a new basis to impose draconian limits on the construction of detached housing. For example, in the San Francisco Bay area, it has been proposed that 97 percent of new housing be built within the existing urban footprint. That would mean an emphasis on multi-unit housing and little or no new housing on the urban fringe. The option of a single family home will be all but non-existent for   even solidly middle income Californians.

    Planning authorities in the Bay Area seem oblivious to the fact that destroying affordability also destroys growth, already evident by the state’s poor economic performance and ebbing demographic vigor.    Planners rosily project 2 million more people between 2010 and 2035 in the San Francisco Bay area. The growth rate over the past 10 years suggests a number less than half that (Figure 7) and given the rapid aging of the area, even this estimate may be too high. The planners also project more than 1.2 million   new jobs, something difficult to believe given the more than 300,000 job loss (Note 4) that occurred in the Bay Area between 2000 and 2010 (Figure 8).

    The Environmental "Fig Leaf:" The environmental justification for these policies is fragile . Research supporting higher density housing has routinely excluded the greater emissions from construction material extraction and production, building construction itself and common greenhouse gas emissions from energy consumption that does not appear on consumer bills. Further, higher densities are associated slower and more erratic speeds, which retards fuel efficiency and increases greenhouse gas emissions, a factor not sufficiently considered.

    The report seems to ignore any other options besides rapid densification, which as McKinsey Global Institute has pointed out is not at all necessary to reduce GHG emission reductions. They point to other factors as more fuel efficient cars.   

    Oddly, the San Francisco Bay Area proposal does not even mention working at home (much of it telecommuting), the most environmentally friendly way of accessing employment. Working at home has grown six times the rate of transit since 2000 in the Bay Area.

    Outlawing New Houses Detached housing remains the overwhelming choice of Californians. There is no indication that this preference is about to be replaced by a preference for high-density housing.  Current and future middle class Californians could be corralled into more crowded conditions, because questionable planning doctrines mandate that detached housing should be outlawed.

    —-

    Notes:

    1. Calculated from 2006, 2007 and 2009 American Community Survey data. The over ten unit category is used because is more generally reflective of the dense condominium development generally favored by densification advocates (Latest data available).

    2.  Another questionable tenet of conventional wisdom is that the price declines in the outer suburbs were greater than in the cores. When the price declines reached their nadir, core California markets were generally at least as depressed from their peak prices as suburban markets.

    3. Metropolitan region refers to combined statistical areas, which have a core metropolitan area, such as the Los Angeles MSA and include surrounding metropolitan areas, such as the Riverside-San Bernardino MSA and the Oxnard MSA.

    4. Annual, 2000 to 2010, calculated from California Economic Development Department data.

    Lead photo: Houses in Los Angeles. Photograph by author.

    Wendell Cox is a Visiting Professor, Conservatoire National des Arts et Metiers, Paris and the author of “War on the Dream: How Anti-Sprawl Policy Threatens the Quality of Life

  • Enterprising States: Hard choices now, hard work ahead: State Strategies to Renew Growth and Create Jobs

    This is an excerpt from "Enterprising States: Creating Jobs, Economic Development, and Prosperity in Challenging Times" authored by Praxis Strategy Group and Joel Kotkin. The entire report is available at the National Chamber Foundation website, including highlights of top performing states and profiles of each state’s economic development efforts.

    Read the full report.

    Read part one in this series.

    America has the world’s largest economy, the world’s leading universities, the most robust entrepreneurial culture and many of its biggest companies—yet many see this as a diminishing advantage.31 Stagnation, many predict, will extend into the foreseeable future because the economy’s low-hanging fruit has disappeared and so the pace of innovation has slowed; by this argument we are now on a “technological plateau” that will make further growth challenging.32 The United States remains a leader in global innovation, but better-funded, higher-performing hubs of innovation are emerging among determined competitors, notably China.

    In contrast, we believe America’s prospects for competing with other countries are better than commonly assumed, and we are convinced that our strategy for the future is unlikely to be found elsewhere. Unlike our major competitors, we enjoy a huge base of natural resources—such as food and energy—which are likely to become ever more in demand as countries like China and India grow their economies. Most important of all, the United States, particularly in contrast with Europe and East Asia, enjoys relatively youthful demographics, promising an expanding workforce, new consumers and a new flood of entrepreneurs.

    Yet our demographics and resources require intelligent policies that fit our particular situations. As a young country, we will have to find employment for an additional 20 million Americans in this decade. Slow growth, which could be accommodated in rapidly aging Japan or Germany, is not an option for the United States. We will also need to harness all forms of energy, from renewables to fossil fuels. Today, half of our trade deficit consists of energy, and yet we have the oil and gas resources to supply the vast majority of our needs. As we invest in renewables for the long run, the country needs to use the resources that are readily available in order to reduce the deficit and spark job growth.

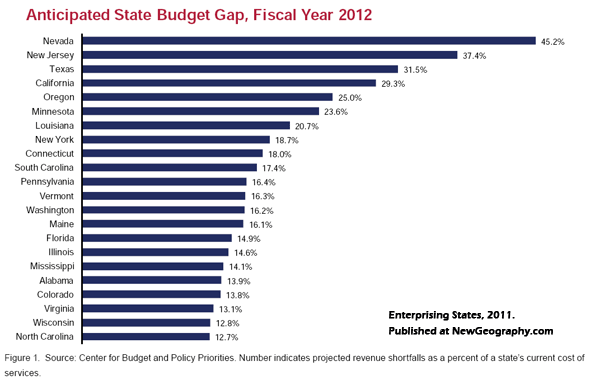
    Our ability to compete, particularly on the state level, could be compromised by an inability to address our budgetary challenges. According to the Center on Budget and Policy Priorities, states are struggling with budget shortfalls for fiscal 2012 that add up to $112 billion. The most recent Fiscal Survey of the States anticipates considerably more financial stress in the states as the substantial funding made available by the American Recovery and Reinvestment Act of 2009 will no longer be available.

    Most states have already taken actions to streamline and downsize government to meet the new economic realities. This has proven to be challenging given the increased demand for state services during the national recession. Surely, more redesign, streamlining and reform is on the way. To recoup lost revenue, states have taken such actions as eliminating tax exemptions, broadening the tax base, and in some cases increasing rates as well as raising a number of fees. Low tax rates by themselves are not a silver bullet for growth, but it has become clear that outdated state tax systems can undercut economic vitality.

    States are the fulcrum of change in key areas of education, infrastructure, energy, innovation and skills training—something that was confirmed on many fronts in the first Enterprising States study. States and localities are far better positioned than the federal government to foster strategic investment, regulations, taxes and incentives that encourage private sector prosperity. In large part, this is because they are more responsive to local conditions.

    Equally important, a diversified portfolio of opportunity agendas implemented by the individual states will go a long way toward renewing growth and prosperity in the national economy.

    New Era of Leadership by the States?

    As the 2010 Enterprising States study was being completed, the states were implementing sweeping changes to deal with a growing number of challenges. Since then twenty-nine new governors have started their terms. Governors of every state, along with their legislative counterparts, are taking steps to grow their states’ economies, create jobs and compete globally. They want to help businesses prosper, to produce an educated and skilled workforce, and to provide other essential services and infrastructure that foster the entrepreneurship and innovation that will lead to greater productivity and competitiveness.

    The dramatic shortage of job opportunities has driven up the unemployment rate, pushed a large number of workers into part-time jobs, increased underemployment problems, and reduced the number of people who were expected to be active participants in the labor force. There is universal agreement that we need policies and programs that create jobs now, alongside investments to lay the foundations for long-term economic growth. “To keep the American dream of widely shared prosperity alive,” one commentator has argued, “we need to choose entrepreneurship and competition over the vested interests of the status quo.”

    Restoring confidence in the economy by creating a meaningful and compelling plan for moving forward is a top priority for elected officials as well as leaders from business, education, and labor groups throughout the country.

    There is also a stark recognition among the states that solving their fiscal problems is directly connected to creating an economic climate that will foster job creation. Any state with a budget tilting towards insolvency is in a weak position to make and maintain investments in its workforce and economic infrastructure. A state’s fiscal health also has immediate consequences by affecting its credit rating and, thereby, the cost of borrowing money. Unfunded pension obligations, viewed historically as soft debt, are now being considered together with the total value of state bonds to come up with a credit rating.

    Many governors and state legislatures are attempting to strike a balance between budget cuts that could hold back the recovery by putting more people out of work, and spending cuts and government reforms that would create a more business-friendly environment, leading to greater business confidence, private-sector investment and job creation. How this balance is achieved depends on each state’s unique set of circumstances and available assets. Moreover, at their core, these debates reflect the fundamental tensions between the two major visions of American progress, namely: creating equality of condition by boosting wages, improving working conditions, and guaranteeing basic services, and creating equality of opportunity, by creating the conditions whereby individuals can elevate themselves through industry, perseverance, talent, and righteous behavior.

    As noted in The Economist, private capital is mobile and it goes where government works. So while political considerations and ideological rationalizations certainly do influence the mix of austerity measures and public investments, the real opportunity today is for states to redesign government for the 21st century. That means cutting programs that do not spur economic growth and shifting resources, where possible, to those existing or planned programs that will.

    While spending cuts will help control deficient budgets, so will increased revenue brought by economic growth. As states enact budget austerity measures, what job creation initiatives are surviving or receiving increased investment? What are the new priorities for job creation? How are states balancing cuts with critical job-creating initiatives that will stimulate innovation, build infrastructure, provide skills training, and unleash the dynamism of small business?

    Job-Centric States Are Redesigning Government and Investing in Opportunity

    Determining where to cut and where to invest40 is the central challenge of the day. States must carry out short-term strategies to jump-start and/or sustain an as-of-yet lackluster recovery, and cut costs to make state government more efficient and to avoid financial calamity. Simultaneously, though, they must craft and invest in innovations and structural solutions that will foster long-term economic growth while reining in taxes and regulations that stifle job creation.

    In most states, revenues remain stubbornly down from where they were before the recession, and job growth is proving to be more elusive than in most previous recoveries. The strategies now being planned or undertaken by each state are based on their unique sets of interests, resources and capabilities, aligned with the opportunities that they see on the horizon and believe are conceivably within their grasp. Yet all states “will likely need a new network of market-oriented, private-sector-leveraging, performance-driven institutions”41 to restore and revitalize their economies.

    The 2011 Enterprising States study highlights state-driven initiatives to 1) redesign government, including measures to deal with excessive debt levels that inhibit economic growth and job creation, and 2) forward-looking, enterprise-friendly initiatives whose primary goal is to create the conditions for job creation and future prosperity.

    The policy initiatives and programmatic efforts are related to the five policy areas that were included in the original Enterprising States report.

    • Entrepreneurship and Innovation
    • Exports, International Trade and Foreign Direct Investment
    • Workforce Development and Training
    • Infrastructure
    • Taxes and Regulation

What’s different in 2011 and for the foreseeable future is that for many states the imperative for change is real. The choice is simple. To remain a job-creating, fiscally robust economy, states will either change on their own or change will continue to be forced upon them.

Investing In Opportunity

States are taking a hard look at making investments in and implementing initiatives to create and sustain high-growth, higher-wage, 21st century industries.States play a key role in the higher education landscape, so there is considerable support for and investment in programs that educate the future talent pool and foster collaboration between business, education and government on science and technology, technology transfer and entrepreneurial programs. As states evaluate their return on investment, performance-based funding has become a best practice for aligning colleges and universities as partners in workforce preparation and sources of opportunity, growth, and competitive advantage.

High-growth start-ups are the best generators of new jobs, accounting for nearly all net job creation in America in the last twenty-plus years. They are also the firms most likely to raise productivity, a basis for economic growth. They also create jobs that did not previously exist, and solve problems in a way that makes a difference in people’s lives.

States have stepped up their efforts to help companies scale up and grow in order to capture growing domestic and international markets. A number of states have established or expanded seed and growth-stage financing funds. Some have implemented economic gardening programs deliberately designed to focus on expanding existing second-stage companies that have viable growth opportunities. Several states have undertaken initiatives to fix deficiencies in the market that inhibit private-sector investment and entrepreneurial activity. Tax credits for angel investors and state-backed venture capital funds are just two examples.

Companies with a global reach that bring together multiple technologies or complex expertise—such as advanced manufacturing, investment banking, construction and engineering, and natural resources—are likely to drive the nation’s global competitiveness in the next few years, along with more focused technology companies that are part of complex virtual networks.44 For that reason, several states are implementing, and having considerable success with, programs to help companies expand into global markets by assisting in the development of a customized international growth plan. And, some states have made significant headway using focused and purposeful strategies to attract foreign direct investment.

Public-private partnerships and privatization initiatives for economic development and the provision of infrastructure are proliferating throughout the states. Building funds and bonding programs that involve private-sector investors are now widely used to construct specialized facilities for research, demonstration, and technology transfer in key economic sectors. Building on the lessons of the past, states have become considerably more adept at avoiding what Robert Fogel has called “hothouse capitalism,” in which government assumes much of the risk while private contractors and financiers take the profit.

While unemployment remains high, many currently available jobs go unfilled. America faces a shortfall of almost two million technical and analytical workers in the coming years, a situation that stands to thwart economic growth.45 Painfully cognizant of this dilemma, many states are establishing workforce training and development programs that address structural unemployment problems and the mismatch between available jobs and the skills of the existing workforce. The goal is to align training and academic programs with in-demand regional occupations, and to add greater flexibility to workforce training programs that have left some re-trainable individuals slipping through the cracks.

Forward-looking states are modernizing their education and workforce training initiatives by developing people-focused approaches that help and train workers in navigating their careers, provide assistance for entrepreneurs, make lifelong learning loans, and offer wage insurance plans. The goal is to empower people to find better jobs and/or to create new ones. Plainly, making America more globally competitive is vital, but the increasingly obvious gap in our economic discussions is an agenda for making Americans more personally competitive. In this view, forging a new economics for the Individual Age will require rethinking our economy from the bottom up in order to realize future growth and prosperity.

Finally, because energy issues, both current and future, have become such critical factors in business and for economic growth, states are getting serious about policies, initiatives and investments to provide clean, secure, safe and affordable energy tailored to regional, state and local resources. These include renewable energy standards, investments in research, development and commercialization of energy technologies and processes, and the establishment of new financing authorities to build the infrastructure that will extract and transport energy to the places where it will fuel new growth.

Redesigning Government

The fiscal situation of many states has caused them to reconsider the level of services they are providing and, certainly, the way that they deliver them. According to the Government Accountability Office, “Because most state and local governments are required to balance their operating budgets, the declining fiscal conditions shown in our simulations suggest the fiscal pressures the sector faces and foreshadow the extent to which these governments will need to make substantial policy changes to avoid growing fiscal imbalances.”

In The Price of Government: Getting the Results We Need in an Age of Permanent Fiscal Crisis, David Osborne and Peter Hutchinson contend that Industrial Age government is just not up to the tasks and challenges at hand. Centralized bureaucracies, hierarchical management, rules and regulations, standardized services, command-and-control methods, and public monopolies are simply not aligned to Information Age realities. Today, government must be restructured and prepared for rapid change, global competition, the pervasive use of information technologies, and a public that expects quality and has lots of choices.

The keys, according to Osborne and Hutchinson, are to 1) get rid of low-value spending, 2) move money into higher-value, more cost-effective strategies and programs and 3) motivate all managers to find better, cheaper ways to deliver results. In sum, government needs to provide incentives, expect accountability, and allow the freedom to innovate.48
Government redesign efforts that are now underway or in the planning stages often follow the simple guidelines outlined above. Yet various approaches are now being used by state governments, including:

  • Consolidation, reorganization, or elimination of agencies, boards and commissions.
  • Regionalization of governance to decentralize decision-making and to customize and align service delivery with local circumstances.
  • Streamlining and modernizing bureaucratic processes to increase productivity and improve service delivery, often by deploying services online.
  • Experimenting with charter agencies that commit to producing measurable benefits and to saving money—either by reducing expenditures or increasing revenues—in exchange for greater authority and flexibility.

Steps to curb spending and reform taxation in the states have varied widely. States with the most serious fiscal problems are laying off workers, imposing hiring freezes, reducing spending for education and health care and ending or curtailing social services. Aid to local governments has been cut. For many states, current obligations for public pension funds and health insurance costs are unaffordable and future obligations represent a
looming financial disaster. Cuts, concessions and larger contributions from employees are now a necessary part of balancing the state’s checkbook.

Taxes and tax policies vary considerably among the states. To make up for lost revenues, most states have taken such actions as eliminating tax exemptions, broadening tax bases, and in some cases increasing rates as well as raising a number of fees. States have enacted increases in all of the major taxes they levy, including personal income taxes, general sales taxes, business taxes, and excise taxes. However, many states did reduce business taxes with new credits or expanded existing credits to encourage investment and growth in targeted industries.
Uncertainty, above all, is the antagonist of growth, investment, and job creation. States that cannot rid themselves of onerous DURT49 (delays, uncertainty, regulations and taxes) are in peril of putting the heaviest burdens on new and small businesses and on entrepreneurs, the real job creators in a growing economy. In a tight economy these considerations become more stringent for entrepreneurs and companies that are making economic decisions simply because the levels of uncertainty and the stakes are so much higher. Eliminating employment regulations and time-consuming processes that place unreasonable burdens on business can have a significant impact on job creation.

Moreover, the competitive identity of a state today relies increasingly on the degree to which the actions of the private, public and civic sectors are aligned with and corroborate the identity claimed or brand promise. A story must be backed up by actions: to simply proclaim an enterprise-friendly environment is no longer adequate.
States that are doing it right today are responsive and are taking a cooperative, supportive approach to dealing with new and existing companies. Their attitude and operating systems are customer-centric and their emphasis is on streamlining processes for obtaining permits, licenses, and titles.

Many state governments across the country are adopting a fast-track approach to achieving a better balance between the requirements of regulation and the need for new jobs and industry, so that that results have a higher priority than rules. This is the mindset that must guide the interface between government and business.
operating budgets, the declining fiscal conditions shown in our simulations suggest the fiscal pressures the sector faces and foreshadow the extent to which these governments will need to make substantial policy changes to avoid growing fiscal imbalances.”

In The Price of Government: Getting the Results We Need in an Age of Permanent Fiscal Crisis, David Osborne and Peter Hutchinson contend that Industrial Age government is just not up to the tasks and challenges at hand. Centralized bureaucracies, hierarchical management, rules and regulations, standardized services, command-and-control methods, and public monopolies are simply not aligned to Information Age realities. Today, government must be restructured and prepared for rapid change, global competition, the pervasive use of information technologies, and a public that expects quality and has lots of choices.

The keys, according to Osborne and Hutchinson, are to 1) get rid of low-value spending, 2) move money into higher-value, more cost-effective strategies and programs and 3) motivate all managers to find better, cheaper ways to deliver results. In sum, government needs to provide incentives, expect accountability, and allow the freedom to innovate.48

Government redesign efforts that are now underway or in the planning stages often follow the simple guidelines outlined above. Yet various approaches are now being used by state governments, including:

  • Consolidation, reorganization, or elimination of • agencies, boards and commissions.
  • Regionalization of governance to decentralize • decision-making and to customize and align service delivery with local circumstances.
  • Streamlining and modernizing bureaucratic processes • to increase productivity and improve service delivery, often by deploying services online.
  • Experimenting with charter agencies that commit • to producing measurable benefits and to saving money—either by reducing expenditures or increasing revenues—in exchange for greater authority and flexibility.

Steps to curb spending and reform taxation in the states have varied widely. States with the most serious fiscal problems are laying off workers, imposing hiring freezes, reducing spending for education and health care and ending or curtailing social services. Aid to local governments has been cut. For many states, current obligations for public pension funds and health insurance costs are unaffordable and future obligations represent a
looming financial disaster. Cuts, concessions and larger contributions from employees are now a necessary part of balancing the state’s checkbook.

Taxes and tax policies vary considerably among the states. To make up for lost revenues, most states have taken such actions as eliminating tax exemptions, broadening tax bases, and in some cases increasing rates as well as raising a number of fees. States have enacted increases in all of the major taxes they levy, including personal income taxes, general sales taxes, business taxes, and excise taxes. However, many states did reduce business taxes with new credits or expanded existing credits to encourage investment and growth in targeted industries.
Uncertainty, above all, is the antagonist of growth, investment, and job creation. States that cannot rid themselves of onerous DUR (delays, uncertainty, regulations and taxes) are in peril of putting the heaviest burdens on new and small businesses and on entrepreneurs, the real job creators in a growing economy. In a tight economy these considerations become more stringent for entrepreneurs and companies that are making economic decisions simply because the levels of uncertainty and the stakes are so much higher. Eliminating employment regulations and time-consuming processes that place unreasonable burdens on business can have a significant impact on job creation.

Moreover, the competitive identity of a state today relies increasingly on the degree to which the actions of the private, public and civic sectors are aligned with and corroborate the identity

States that are doing it right today are responsive and are taking a cooperative, supportive approach to dealing with new and existing companies. Their attitude and operating systems are customer-centric and their emphasis is on streamlining processes for obtaining permits, licenses, and titles.

Many state governments across the country are adopting a fast-track approach to achieving a better balance between the requirements of regulation and the need for new jobs and industry, so that that results have a higher priority than rules. This is the mindset that must guide the interface between government and business.

Read the full report, including highlights of top performing states and profiles of job creation efforts in all 50 states.

Praxis Strategy Group is an economic research, analysis, and strategic planning firm. Joel Kotkin is executive editor of NewGeography.com and author of The Next Hundred Million: America in 2050

  • Enterprising States: Recovery and Renewal for the 21st Century

    This is an excerpt from "Enterprising States: Creating Jobs, Economic Development, and Prosperity in Challenging Times" authored by Praxis Strategy Group and Joel Kotkin. The entire report is available at the National Chamber Foundation website, including highlights of top performing states and profiles of each state’s economic development efforts.

    Read the full report.

    Read part two in this series.

    Restoring Growth and Upward Mobility: A Call to the States

    Over a year and a half into the recovery, the condition of the American economy is far from satisfactory. For the vast majority of Americans, conditions have improved only marginally since the onset of the Great Recession. Unemployment remains high, job creation meager, and American workforce participation has dropped to near record depths — the lowest rate in a quarter of a century.

    Not surprisingly, this spring’s Washington Post-ABC poll revealed that far more Americans feel the economy is getting worse than getting better. There seems to be what the New York Times described as “a darkening mood” among Americans about the future. Confidence in the Federal Reserve’s policies on the money supply has eroded among economists, as few benefits have accrued to smaller businesses and middle-class households.3 Times are particularly tough for entry level workers, including those with educations, and have been worsening since at least the mid-2000s.

    This stress is felt keenly by state and local officials, even in areas that aren’t suffering from the highest rates of indebtedness or pension liabilities. Without pension reform, the state of Utah, for example, would have seen its contributions to government workers’ pensions rise by about $420 million a year, an amount equivalent to roughly 10 percent of Utah’s spending from its general and education funds. The states often must deal with declining revenues at a time when the demand for services caused by the recession has increased. And, unlike the federal government, states can neither print their own money nor buy their own bonds.

    In the past, states could look to Washington for assistance. Now, whatever the intentions or real achievements of the stimulus package, future increases in federal spending seem likely to be meager at best. The 2010 election effectively ended the nation’s experiment with massive fiscal stimulus from Washington. Indeed, leaders of both parties, President Obama, and perhaps most importantly the capital markets, now acknowledge that deficit reduction will be a priority in the coming years.

    This presents a new, and perhaps unprecedented, challenge for the states. With Washington effectively forced to the sidelines, states will now have to address fundamental economic issues relating to growth and employment on their own. Most will have to do so without significantly increasing their own spending.

    For many states, the short-term prognosis is dire. Altogether, 44 states and the District of Columbia are projecting budget shortfalls for 2012 amounting to $112 billion. The upcoming fiscal year, according to the Center on Budget and Policy Priorities, will be “one of the states’ most difficult budget years on record. Retiree benefits for state employees add yet another strain, with the states facing a $1.26 trillion shortfall.”

    As a result, states and localities increasingly find themselves forced to impose tough, even draconian cuts in spending. This affects not only newly minted conservative Republicans, but new liberal Democratic governors such as California’s Jerry Brown and New York’s Andrew Cuomo. The only real debate now is how much to rely on taxes and how much on cuts in spending to address the fiscal issues ahead. One casualty: infrastructure spending, which was boosted by the stimulus, now seems to be winding down as well.

    This report will try to address the nature of this dilemma and suggest ways to best deal with it. Although we agree with the notion of fiscal probity, ultimately, states can deal with the fundamental problems only by spurring growth and upward mobility. This will not only create new revenues, but also dampen the demand for social services.

    A state can neither cut nor tax itself into prosperity. Weak public infrastructure combined with low taxes has failed through history to create strong state economies, as was long the case in the Southeast. But at the same time many large states—California, New York, Illinois—have raised taxes and spending and have suffered a strong out-migration of middle class citizens and jobs for decades.

    Now, faced with enormous deficits, there is a temptation to reduce those very “crown jewels,” such as the California public university system, into what University of California President Mark Yudof describes as “tatters.” In trying to balance their budgets, states run the risk of undermining their own long-term recoveries.

    The great danger that looms here, in our estimation, is not bankruptcy. Rather, it is long-term stagnation, in which growing demands for social services, combined with weak revenues. foster pressure for more taxes, reduced services or a deadly combination of both. This represents something of a existential problem in a country where the prospect for a better future has long been a hallmark.

    The founders of the republic understood the critical importance of maintaining this aspiration, and European observers were struck by the remarkable social mobility in America’s cities. In the 19th century, American factory workers and their offspring had a far better chance of entering the middle or upper classes than their European counterparts. In politics and in daily life, expansion of opportunity was seen as essential to the American experiment. Writing in 1837, one Whig lawyer in Pittsburgh suggested, “If you deny the poor man the means to better his condition . . . you have destroyed republican principles in their very germ.”

    Today, this traditional faith is being sorely tested in much of the country. Although both stock prices and corporate profits have rebounded, little has been done that has stimulated employment. Large companies may be sitting on large caches of cash, in part due to low interest rates and a buoyant stock market, but capital remains scarce for the small businesses that create most of America’s new jobs. Indeed, entrepreneurial growth, as the Kauffman Foundation recently found, has now slowed down among most segments of the population.

    Of course, there have been remarkable stories of wealth creation and success despite these hard times. But even in Silicon Valley—home to such high-fliers as Google, Apple and Facebook—the overall impact on jobs has been minimal. Of the nation’s 51 largest metropolitan regions, San Jose, the Valley’s heartland, has suffered the largest net loss of jobs over the past decade of any major metropolitan region outside Detroit. The San Francisco area suffered job losses only slightly lower, on a percentage basis, than hard-hit Cleveland.11 Due in part to financial controls, investment in promising new companies has become ever more undemocratic, with the bulk of new money pouring into firms like Facebook coming not from public markets, but from a small, well-heeled cadre of private investors. Venture-backed technology companies, notes Intel co-founder Andy Grove, now find it expensive to “scale” their operations and add employees in California or even the United States. As a result, he suggests, companies tend to indulge in “an undervaluing of manufacturing” that erodes employment. This contrasts with, for example, China, where job creation is considered “the number one objective of state economic policy.”

    Much the same can be said of New York, where the paper economy has been boosted by Fed policy but the creation of middle-income jobs continues to lag. New York City’s current financial boom—Wall Street pay hit a new record in 2011—simply reinforces a level of income inequality that is the highest in the nation. Unemployment in the toniest Manhattan precincts reaches barely five percent, while it’s 20 percent in working-class Brooklyn. Not surprisingly, the city’s distribution of wealth is now twice as unequal as in the rest of the nation. It may seem a model recovery on Wall Street, but it is less so on the streets of the nation’s premier city.

    In contrast, the states that have fared best in creating middle-class jobs have been either those close to the expanding federal government, another major beneficiary of the stimulus, or those that have attended to more basic industries, such as energy production, agriculture and manufacturing. These industries have propelled widespread expansions in the Great Plains, parts of the Intermountain West, Alaska and Texas.

    More interestingly, many of these states have also experienced a surge in STEM—science, technology, engineering and mathematics—related employment. In some states, this has come as a result of continuing state investment in education and training; in most cases, these states have simply tended to create a business-friendly atmosphere for companies of all sorts. They have also generally kept housing costs low, something critical to young families.

    Perhaps the best way to look at our evolving economy is not so much from the point of view of companies or industries, but of individuals. States often focus on their largest employers, but those companies have been cutting jobs for the past decade. Since 2000, large corporations—which employ roughly one-fifth of American workers— have stopped hiring, as they did in the previous decade, and actually reduced their payrolls by nearly three million while adding 2.4 million jobs abroad.

    Andrei Cherny, an Arizona Democrat writing in the journal Democracy, suggests that “both progressives and conservatives have offered little in the way of new answers as their long-held orthodoxies run headlong into new realities.” Cherny admits that the stimulus and the Fed’s strategy of loose money—what he calls “government by hot check”—failed to address the needs of the nation’s large class of small entrepreneurs.

    Left out of the equation are the small businesses that, according to the Bureau of Labor Statistics, employ half of all workers and create 65 percent of all new jobs. Most of these firms are small, under-capitalized, and run by single proprietors or families.

    In this environment, notes economist Ying Lowery, “Business creation is job creation.” The states that will do best are those that create the conditions to lure and retain those who start companies or who are selfemployed. Policies that target managers of hedge funds, venture firms, or large corporations have their place, but the real action—particularly in a world of ever-changing technology and declining long term employment—lies in the movement of individuals.

    Under these conditions, where individuals migrate or decide to settle will have a critical impact on which states or regions grow. Three dynamic population segments— educated workers, immigrants and downshifting boomers—illustrate the factors that drive their migration patterns. In many ways they represent the “canaries in the coal mine”; where they go is generally where the air is good for entrepreneurship.

    The movement of educated workers has become a much discussed topic among pundits and economic developers in recent years. One common assumption is that “the best” migrants tend to move to “hip and cool” locales, generally on one of the coasts. These workers then form the core of growing industries and, more importantly, new ones. Yet the evidence tells a somewhat different, perhaps surprising, story. An analysis of recent Census data on the migration of educated workers finds that the biggest net growth has taken place not in New York, San Francisco and Boston, but in places like Nashville, Houston, Dallas, Austin, and Kansas City. Indeed, many of the leading “creative class” states, notably California, Massachusetts and New York, fared considerably worse than regions in states such as Missouri, Kansas, Texas and Tennessee in terms of net migration numbers.

    These location choices have to do with how individuals make decisions: people move primarily for reasons related to jobs, family, and housing. An analysis of the migration of educated workers, for example, reveals that, for the most part, these workers are moving away from expensive, dense regions to more affordable, generally less dense places. This migration also tends to parallel moves to those states that generally impose fewer regulatory burdens on business.

    Perhaps even more surprisingly, we see a similar pattern in minority and immigrant entrepreneurship. These groups now constitute a growing percentage of business startups. Overall, according to the Kauffman Foundation, foreignborn immigrants in 2010 constituted nearly 30 percent of all new businesses owners, up from 13.4 percent in 1996. This has also been the one outstanding segment of the population whose entrepreneurship rate has grown throughout the current recession.

    As with the case of educated migrants, minority entrepreneurs tend to establish themselves in less expensive, more business-friendly, and generally less heavily regulated metropolitan regions. A recent survey of minority migration and self employment by Forbes found that the best conditions for non-white entrepreneurs were in metropolitan areas in Georgia (Greater Atlanta), Tennessee (Nashville), Arizona (Phoenix), Oklahoma (Oklahoma City), and several Texas cities (Houston, Dallas, San Antonio and Austin). In contrast, most regions in California and the Northeast, outside of the Washington, D.C. metropolitan area, did quite poorly.

    Jonathan Bowles, president of the New York-based Center for an Urban Future, has traced this poor performance to a myriad of factors including sky-high business rents, which stymie would-be entrepreneurs in minority communities. “[Entrepreneurs] face incredible burdens here when they start and try to grow a business,” Bowles suggests. “Many go out of business quickly due to the cost of real estate and things like high electricity costs. It’s an expensive city to do business in without a lot of cash.”

    Boomers are unique compared to traditional senior populations. According to the Kauffman Foundation, they tend to be more likely to start businesses than are younger age groups. In 1996, people between 55 and 64 years of age accounted for 14 percent of entrepreneurs; in 2010 they represented 23 percent.

    Less is known about the migration of aging boomers, a large segment of the population, but evidence so far suggests that they, too, are moving to such states. According to AARP, most boomers prefer to stay close to where they live—mostly in suburbs—or where their children tend to move, that is, to the low-regulation states of the South and West.

    States can draw on these migration patterns in developing their economic policies. Generally, people migrate to states with jobs, and states with population gains generally produce more employment than those with slower growth. Indeed, despite the great disruptions of the mortgage crisis, regions such as Orlando, San Bernardino-Riverside and Las Vegas all recorded double-digit employment gains over the last decade.

    More recent developments suggest that future growth may depend on several critical factors. It is clear, for example, that investments in education—for example in Austin, Raleigh-Durham and parts of the Great Plains—have paid off by attracting both individuals and industries, and have made these areas among the healthiest employment markets in the country. Some of these states have suffered less fiscal distress than states elsewhere in the nation, and have benefited from their educational investment through hard times. Investments in community colleges may prove to be particularly essential, since their role in providing skilled workers has been critical in many states.

    States that have invested in new infrastructure such as ports, airports, roads and improved transit tend to have a leg up on others that have failed to do so. Even relatively low-tax states such as Texas have invested heavily in recent years in roads and port facilities, which are critical to industries locating there. Even during the recession, many industries—from manufacturing and environmental firms to health care and information technology—have had trouble hiring skilled workers. States are responding by creating job-oriented training programs in states like Ohio, New York, Tennessee, Washington and Wisconsin, which have all established technical institutions separate from community colleges. Tennessee alone has 27 such “technical centers” offering one-year certificates for certain jobs.

    Overall, as Delaware Governor Jack Markell has pointed out, businesses generally do not want to eliminate government, but rather want it to be useful for economic growth. Markell, who has done some considerable budgetcutting himself, believes that the focus needs to be on expanding the economy, which will requires improvements not only in schools, but in transportation infrastructure that will make the free market work better.

    Perhaps even more important has been creating a favorable business climate. California, for example, possesses the greatest basic economic attributes of any state: a mild climate, location on the Pacific Rim, a world-class university system, and a legacy of strong infrastructure investment. Yet today, despite the presence of leading global industrial zones such as Hollywood and Silicon Valley, as well as the country’s richest agricultural sector, California’s unemployment remains well above the national average and job growth has remained relatively tepid. After many years in denial, even some of the state’s most progressive politicians realize that something is amiss. In a remarkable development, for example, California leaders including Lieutenant Governor Gavin Newsom recently visited Texas to learn from the large state that has fared best during the long recessionary period. Given the political gap between Californians like Newsom, a former mayor of San Francisco, and Texas Governor Rick Perry, this represents something of a “Nixon in China” moment.

    This is not to say that California, or any other state, should draw its economic policy from another state. Those states that attempt to use tax incentives to “lure” industries with no overwhelming need to relocate — as shown in recent findings about Illinois incentives to movie-makers — are often disappointed. In many cases, the incentive game becomes a classic “race to the bottom,” in which the benefits of new jobs often prove transitory. Since the 1990s, just two percent of job growth and decline has been due to businesses relocating across state borders, yet the costly practice of using unfocused tax expenditures to poach companies continues.

    Nor can states reliably predict which industries will need more workers over the long term. In the 1990s, economist Michael Mandell predicted that cutting-edge industries like high-tech would create 2.8 million new jobs; in reality, notes a 2010 New America Foundation report, they actually shed 68,000.30 Each state and each region has its own peculiar economic DNA. States with exportable products—for example the Great Plains or the Upper Midwest—may need to focus on ways to get their output efficiently to market. Already affordable, they may also choose to increase their attractiveness to high value-added companies and educated individuals by boosting their education systems and making their metropolitan regions more congenial to well-educated migrants.

    In other states such as New York or Massachusetts, the economy is focused on intangible exports like financial services and software. Making themselves more affordable for both individuals and companies may be the best way for states to improve competitiveness. Over the long term, no state economy can sustain its people if it only focuses on the “luxury” sectors; the large number of unemployed and underemployed workers will drain state resources. As those state resources become more limited, decisions about how to structure tax incentives or where to place education and infrastructure investments must be based upon a deep understanding of this economic DNA. Strategic investments will limit wasteful spending and maximize impact in the economic sectors where a state is most likely to grow.

    Ultimately, there is only one route to sustainable state economies, and that is through broad-based economic growth. The road to that objective can vary by state, but the fundamental goal needs to be kept in mind if we wish to see a restoration of hope and American optimism about the future.

    Read the full report, including highlights of top performing states and profiles of job creation efforts in all 50 states.

    Praxis Strategy Group is an economic research, analysis, and strategic planning firm. Joel Kotkin is executive editor of NewGeography.com and author of The Next Hundred Million: America in 2050

  • Sweden: A Role Model for Capitalist Reform?

    Sweden is often held up as a role model for those wishing to expand the size of government in the U.S. and other nations. The nation is seen as combining a large public sector with many attractive features, such as low crime rates, high life expectancy and a high degree of social cohesion.

    But in actuality the success of the Swedish society lies not with the extent of its welfare state, but as the result of cultural and demographic factors as well as a favourable business environment throughout most of Sweden’s modern history.

    First, it should be noted that Sweden experienced even higher rates of growth and impressive social outcomes well before the start of the Social Democratic era in 1936. Sweden was an impoverished nation before the 1870s, as evidenced by the massive emigration to the United States. As a capitalist system evolved out of the agrarian society, the country grew richer.

    Property rights, free markets and the rule of law in combination with an increasingly well-educated workforce created an environment in which Sweden enjoyed an unprecedented period of sustained and rapid economic development. Famous Swedish companies like IKEA, Volvo, Tetra Pak and Alfa Laval were all founded during this period, aided by business friendly economic reforms and low taxes.

    Between 1870 and 1936, the start of the Social Democratic Era, Sweden had the highest growth rate in the industrialized world. In contrast, between 1936 and 2008 the growth rate was merely the 18th highest of 28 industrialized nations.

    Second, more attention needs to be paid to social and cultural factors. This reflects factors
    such as the Lutheran work ethic and the cohesion of a largely homogeneous population with
    particular social values. The perceived advantage of Swedes over other countries rose before
    the rise of the welfare state. In 1950, before the rise of the high-tax welfare state, Swedes
    lived 2.6 years longer than Americans. Today the difference is 2.7 years. Sweden’s lower
    income inequality also stems back to at least the 1920s.

    These same factors can be seen in the success of Swedes abroad. The approximately 4.4 million Americans with Swedish origins are considerably richer than the average American, as are other immigrant groups from Scandinavia. If Americans with Swedish ancestry would form their own country their per capita GDP would be $56,900, more than $10,000 above the earnings of the average American and 53 percent above the Swedish GDP level of $36 600.

    A Scandinavian economist once stated to Milton Friedman: “In Scandinavia we have no poverty.” Milton Friedman replied, “That’s interesting, because in America among Scandinavians, we have no poverty either.” Indeed, the poverty rate for Americans with Swedish ancestry is only 6.7 percent, half the U.S. average. Economists Geranda Notten and Chris de Neubourg have calculated the poverty rate in Sweden using the American poverty threshold, finding it to be an identical 6.7 percent.

    Critically, those Swedes who immigrated to the U.S., predominately in the 19th century, were anything but elite. Many were escaping poverty and famine. What has made Sweden uniquely successful is not the welfare state, as much as the hard-won Swedish stock of social capital.

    Third, the recent strong performance of the Swedish economy has its roots in labor market and other reforms enacted by center-right governments. Perhaps least appreciated, Sweden has dramatically scaled back the size and scope of government starting in the 1990s, which spurred the recovery of the growth rate.

    Indeed, modern Sweden’s success can be seen as more a shift away from the far left policy that predominated from the 1960s till the end of the century. During recent years Swedish policies have shifted strongly to the center-right, placing the once dominant Social Democrats in deep crisis.

    An important explanation is that the Swedish electorate wishes to again strengthen the ethical norms that have been eroded during the high tax regime. The center-right government that took office in 2006 and was re-elected in 2010 has implemented stepwise and rather large tax reductions.

    Few other nations demonstrate as clearly the phenomenal economic growth that results from adopting free-market economic policies. School vouchers have successfully been introduced, creating competition within the frame of public financing. Similar systems are increasingly being implemented also in other public programs, such as health care and elderly care. Another example is that the pension system has been partially privatized, giving citizens some control over their mandated retirement savings.

    Where is Sweden headed?

    Yet this is not to say Sweden can not go further into a free market direction. Although taxes have been lowered, research publication reveal they still impact to the level of entrepreneurship and crowding out private sector job creation. One study has for example shown that for each additional Swedish Kronor levied and spent by the government, the efficiency losses in the private sector can be as high as 1-3 additional Kronor.

    One particular challenge lies with immigrants. In the past Sweden was highly successful in integrating immigrants. In 1950 the level of employment for foreign-born was 20 percent higher than the average citizen. In 2000 the level of employment was 30 percent lower for the foreign-born.

    In 1968 foreign citizens living in Sweden had 22 percent higher income from work compared to those born in Sweden. In 1999 foreign citizens had 45 percent lower incomes. While racism had decreased significantly as time had passed, the situation of those born abroad in the labour market had worsened dramatically.

    A government study has shown that in 1978 foreign born from outside the Nordic nations had an employment level that was only seven percent lower than ethnic Swedes. In 1995 the gap had expanded to 52 percent.

    Looking forward, it’s clear that Sweden’s great advantages lie not in socialism, but in circumstances. In addition to its considerable human capital, Sweden has an abundance of natural resources, another that the nation was not involved in either of the worlds wars, which tore up other industrialized nations.

    There remain many problems connected to the welfare state. Amongst others Jan Edling, former economist at the labor union LO which has close ties to the Social Democratic party, has discussed this high hidden unemployment and the connection to over-utilization of welfare systems. Around one fifth of the working age population in Sweden are supported by one form or another of government handouts rather than work.

    The Swedish welfare state, of course, does create some social good, by for example providing relatively generous social security nets. But it is clearly not solely responsible for the low poverty and long lifespan in the nation.

    Many in the United States and elsewhere who tend to see Sweden as a social democratic role model fail to understand the history and trajectory of Swedish society. Indeed, much of the success of Sweden, and other Scandinavian nations, relate to strong norms and entrepreneurship.

    To be sure, Swedish society is not necessarily moving away from the idea of a welfare state, but continuous reforms implemented towards economic liberty have strengthened the society. The rise of government has been stopped and clearly reversed during the past years. Sweden is again returning to the free market policies which have served it so well in the past.

    Nima Sanandaji, is President of the Swedish think-tank Captus.

    Photo by Hector Melo A.

  • Hey, Dad: Family Still Matters!

    America is getting older. Those over the age of 65, which currently account for 12% of the population, are expected to make up 20% of the population by 2030. People are marrying later, and a growing group, though still a distinct minority, is choosing not to have children. So if there are proportionately fewer traditional households, do families still matter in determining how places and regions grow?

    The answer is yes. Using Census data, with the help of demographer Wendell Cox, we determined the regions in the U.S. with the biggest increases in children ages 5 to 17 (See table below). These family hot spots, which include Raleigh, N.C. (No. 1), Austin, Texas (No. 3) and Charlotte, S.C. (No. 4), are also some of the country’s biggest job generators. Many rank highly in the fastest-growing cities in the U.S. And seven of the ten leading regions for kids also have the fastest-growing foreign-born populations.

    Take the region with the biggest increase in children, Raleigh. The North Carolina powerhouse experienced a nearly 50% jump in residents between ages 5 to 17 over the past decade. There are 70,000 more kids in the Triangle now than a decade ago. The region also experienced the second-highest overall population increase, the second-biggest surge in educated migrants and the third-highest job growth over the past two decades. It also ranked among those regions seeing the biggest jump in new immigrants.

    Texas boasts many of the strongest economies in the country, which helps make it home to many of the leading metros for kids, including Austin (No. 3), Dallas (No. 7),  Houston (No. 9) and San Antonio (No. 10). These areas have emerged as major magnets for migrants from both within the country and abroad. Dallas and Houston, for example, now get more immigrants per capita than Washington, Chicago or Boston.

    The rest of our top ten areas for kids were superstars in employment and population growth during the early years of this decade. Despite tougher times, Las Vegas (No. 2), Charlotte, S.C. (No. 4), Phoenix, Ariz. (No. 5), Atlanta (No. 6) and Orlando, Fla. (No. 8)” were all among leaders in overall population and also saw large increases in their numbers of immigrants.

    One thing these regions share is affordable housing. Throughout the real estate bubble, housing prices in Raleigh, the Texas cities and Atlanta remained low. Today, prices have also plummeted in virtually all the other markets in our top ten, reinforcing their relative affordability.

    A look at the bottom of the list also tells two stories. Some 28 of the 50 largest regions — we took out New Orleans due to the unusual circumstance of Hurricane Katrina — actually experienced an absolute decrease in the number of kids. Buffalo’s youth population dropped by almost 30,000 — a 13.6% decline. Many of the other cities at the bottom of the list came from the familiar ranks of slow- or negative-growth Rust Belt cities, including   Pittsburgh (No. 49), Rochester, N.Y. (No. 48) Cleveland (No. 47) and Detroit (No. 46).

    Other areas losing youngsters included the nation’s three legitimate megacities — Los Angeles (No. 44), New York (No. 38) and Chicago (No. 35) — as well as areas long associated with the migration of the “young and restless,” including Boston (No. 37) and San Francisco (No. 36). Unlike young adults who move to Austin and Raleigh, the “young and restless” in these “hip and cool” centers may not hang around long enough to have children.

    Jobs certainly are a big factor. Like the Rust Belt towns, most of these areas have experienced stagnant job growth or even lost employment over the decade. Another reason young families aren’t staying could be housing costs; all these cities rank among the most unaffordable in the nation. Even if you’re a family with a job, or two, it’s hard to raise the capital to make a down payment unless you have loads of stock in Google, or more likely, well-to-do parents.

    Overall, the places with the absolute fewest kids ages 5 to 17 tend to be dense core cities. Children constitute barely 1 in 10 residents in the city of Seattle.  The urban cores of San Francisco, Washington and Boston show similar low rates.

    The few kids in these regions are mostly in the suburbs.  The Seattle suburbs, for example, have 75% more kids than the city. This difference is driven both by growth in immigrants to more affordable, less dense suburban areas as well as the movements of people of child-bearing age out of the city.

    So what do the numbers suggest about the link between families and regional dynamism? Some demographers and urbanists see the shrinking percentage of families as a sign of their increasing irrelevance to regional growth. One prominent demographer even called traditional families a kind of “endangered species,” although an awfully large one given that they still number one in five households and constitute, with their kids, roughly 90 million people, or almost 30% of the population.

    In reality families are unlikely to go the way of the Dodo. As the large millennial generation, born between 1982 and 2003, enters their late 20s and early 30s, they will naturally begin to spawn. Generational researchers Morley Winograd and Mike Hais have studied millennial attitudes and have found that these young adults are much more family-oriented than Gen Xers and even their own baby boomer parents. Some 85% plan on getting married, and some 77% are inclined toward having children of their own.

    It’s also critical to expand our definition of families. Once children leave their home, parents do not suddenly become footloose, fancy-free singles; they remain parents. Often they end up moving closer to their children, or sometimes the children make a “U-turn” to be close to Mom and Dad: Grandparents, after all, make excellent, and cheap, babysitters.

    Of course, many of the more affluent and educated young adults will initially head to urban centers like New York, San Francisco or Boston as they seek potential spouses and begin their careers. But as they age, Winograd and Hais note, many of the older millennials want to establish roots in more affordable suburbs that are often closer to their work, especially ones with good schools. According to a survey by Frank Magid and Associates, a large plurality of millennials name suburbs as their “ideal” place to settle, more so than earlier generations.

    The surprising uptick in the percentage of multigenerational households also suggests a growing role for extended families. Rather than shrinking, household size is beginning to grow again for the first time in decades.

    According to the Pew Foundation, multi-generational households now make up 15% of households, up from 12% in 1980. If hard times continue this trend likely will accelerate. The percentage of single households has also started to flatten and has actually dropped among the elderly.

    So what’s the lesson here? Ignore the claims of pundits on right and left who long have predicted the demise of the family. The family will prove more important than ever in determining where people live, work and, especially, settle.

    None of this suggests a reprise of the Ozzie and Harriet 1950s. As social historian Stephanie Coontz points out, that era was an outlier created by peculiar circumstances including the Depression and the Second World War, which suppressed child-bearing, followed by a huge and sustained economic boom. For most of our history, Coontz notes, family relations in America have been far less orthodox, with grandparents, aunts, uncles, divorced parents and even siblings raising kids.

    Margaret Mead once wrote, “No matter how many communes anybody invents, the family always comes back.” Those who have children, not those who do not, define and create the future. It’s a lesson companies and economic developers would do well to learn.

    Fastest Growing Areas for 5-17 Year Olds
    Rank
    2000
    2010
    Change
    % Change
    1
    Raleigh 143,369 214,124 70,755 49.4%
    2
    Las Vegas 248,469 349,636 101,167 40.7%
    3
    Austin 223,958 307,256 83,298 37.2%
    4
    Charlotte 243,784 329,495 85,711 35.2%
    5
    Phoenix 619,044 794,609 175,565 28.4%
    6
    Atlanta 813,107 1,016,643 203,536 25.0%
    7
    Dallas-Fort Worth 1,035,311 1,276,916 241,605 23.3%
    8
    Orlando 300,729 367,908 67,179 22.3%
    9
    Houston 988,463 1,190,078 201,615 20.4%
    10
    San Antonio 353,599 418,439 64,840 18.3%
    11
    Riverside-San Bernardino 756,033 893,468 137,435 18.2%
    12
    Nashville 235,779 278,122 42,343 18.0%
    13
    Indianapolis 293,728 332,189 38,461 13.1%
    14
    Denver 402,259 453,645 51,386 12.8%
    15
    Tampa-St. Petersburg 387,074 432,851 45,777 11.8%
    16
    Salt Lake City 210,272 232,331 22,059 10.5%
    17
    Columbus 297,323 327,153 29,830 10.0%
    18
    Washington 878,018 957,157 79,139 9.0%
    19
    Sacramento 361,875 390,940 29,065 8.0%
    20
    Oklahoma City 205,122 221,354 16,232 7.9%
    21
    Jacksonville 216,124 233,109 16,985 7.9%
    22
    Portland 356,220 381,928 25,708 7.2%
    23
    Louisville 212,078 224,638 12,560 5.9%
    24
    Kansas City 356,234 376,038 19,804 5.6%
    25
    Richmond 204,359 215,599 11,240 5.5%
    26
    Memphis 249,261 255,755 6,494 2.6%
    27
    Seattle 548,711 562,461 13,750 2.5%
    28
    San Jose 309,422 317,055 7,633 2.5%
    29
    Minneapolis-St. Paul 580,592 593,309 12,717 2.2%
    30
    Miami 870,894 881,916 11,022 1.3%
    31
    Birmingham 192,830 195,263 2,433 1.3%
    32
    San Diego 525,040 520,745 -4,295 -0.8%
    33
    Hartford 205,814 204,130 -1,684 -0.8%
    34
    Cincinnati 390,704 387,109 -3,595 -0.9%
    35
    Chicago 1,772,051 1,745,047 -27,004 -1.5%
    36
    San Francisco-Oakland 676,544 660,471 -16,073 -2.4%
    37
    Boston 751,049 726,366 -24,683 -3.3%
    38
    New York 3,269,939 3,144,025 -125,914 -3.9%
    39
    Milwaukee 292,713 279,371 -13,342 -4.6%
    40
    Philadelphia 1,074,283 1,023,024 -51,259 -4.8%
    41
    Baltimore 479,250 455,157 -24,093 -5.0%
    42
    St. Louis 528,319 493,153 -35,166 -6.7%
    43
    Virginia Beach 306,209 284,872 -21,337 -7.0%
    44
    Los Angeles 2,482,750 2,301,383 -181,367 -7.3%
    45
    Providence 281,358 257,614 -23,744 -8.4%
    46
    Detroit 869,661 784,176 -85,485 -9.8%
    47
    Cleveland 403,465 360,365 -43,100 -10.7%
    48
    Rochester 200,620 177,981 -22,639 -11.3%
    49
    Pittsburgh 406,762 353,740 -53,022 -13.0%
    50
    Buffalo 213,785 184,816 -28,969 -13.6%
    51
    New Orleans 261,362 195,664 -65,698 -25.1%
    Total 28,485,719 29,560,594 1,074,875 3.8%
    Source:  U.S. Census 2000, U.S. Census 2010.   Analysis by Wendell Cox.

    This piece originally appeared at Forbes.com.

    Joel Kotkin is executive editor of NewGeography.com and is a distinguished presidential fellow in urban futures at Chapman University, and an adjunct fellow of the Legatum Institute in London. He is author of The City: A Global History. His newest book is The Next Hundred Million: America in 2050, released in February, 2010.

    Photo by shutterBRI