Category: Demographics

  • Getting Married Naked

    One of my girlfriends just invited me to attend her wedding ceremony next month. In our short conversation, I learned that she and her husband have already moved into their brand new, three-bedroom condo (we barely have any detached houses, called villas, in China), purchased a new car, and will have three separate wedding ceremonies: in the groom’s hometown, the bride’s hometown, and the city where they currently live. Based on this description, you are probably picturing a couple in their late 30s who must hold high-paying respectable jobs.

    But that assumption would be wrong. They are an average young Chinese couple in their mid-20s who’ve only just graduated from university a couple of years ago.  However, what they are planning for their wedding is typical in China today.

    So how can they afford all this? Even in go-go China, many in reality can’t afford, and increasingly some are eschewing, the wedding-related expenses.

    But how did we end up in the first place with a situation where pressures force some Chinese couples to disappoint their families, their friends and maybe themselves?  Why have the wedding game become so patently insane even for the relatively affluent.

    To answer this question, we must first become familiar with some Chinese wedding traditions. Primarily when it comes to the cost of a wedding, the groom’s family is expected to provide accommodations for the couple and pay for the wedding ceremony, while the bride’s family provides what could be loosely referred to as a dowry.

    For my parents’ generation (those born between 1955 to 1965), the above mentioned wedding traditions translate into:

    • The newlyweds live with the groom’s parents after getting married. Since housing was provided by the state owned companies in the 1980s, and younger generations were expected to show their filial obedience through living with their parents, no couple would even consider having a place of their own.
    • In respect that China was still going through an extreme resource insufficiency phase in the early 1980s, my mother’s dowry only consisted of two brand new red quilts.  
    • Wedding ceremonies usually took place in the courtyard where people lived. Good friends would come to help cook a “feast” for a relative handful of guests.


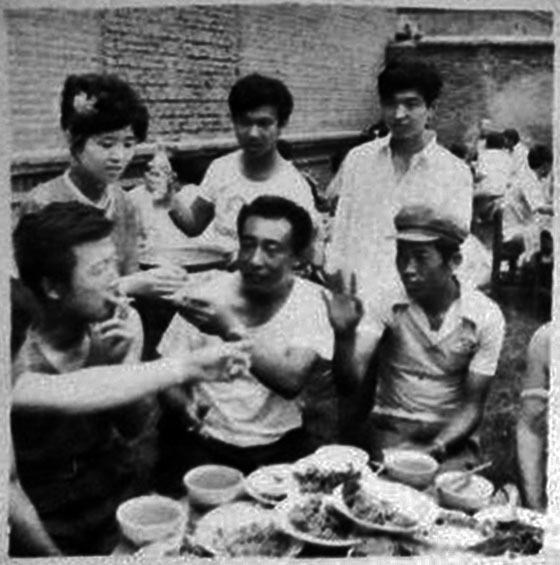
    Wedding ceremony in the 1980s


    Now, after the massive economic changes that have happened over the past two decades, these three wedding traditions tend to follow a somewhat different pattern:

    • The new couple absolutely must have their own home. In most cases the groom’s parents pay for this housing. It does not matter whether it is a three-story villa or a 40 square meter (425 square feet) bachelor apartment, whether it’s brand new or 20 years old. The key thing is that the property be ready for the new couple to move into. Depending on the family’s financial status, they either pay the full amount or at least the down payment on a mortgage, with the ownership under the new couple’s name. To pay for this, parents usually start saving as soon as their son is born.
    • The dowry given by the bride’s family is either in the form of a brand new car, a hefty deposit into the newlywed’s bank account, or payment of the cost of interior decoration for their new home (new properties in China are usually delivered as little more than a concrete shell).
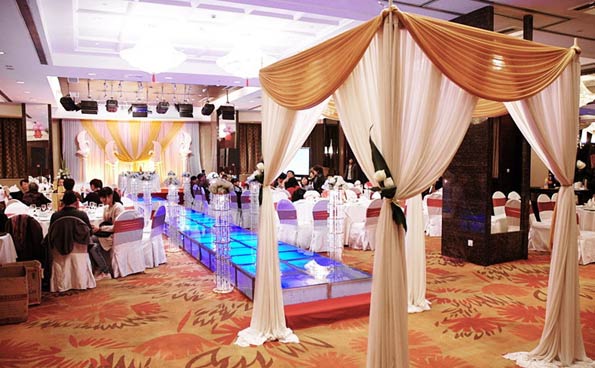
    • Wedding ceremonies are commonly held at the best hotels in town, often with about 500 guests in attendance. The guests will be seated at tables of 10, while the new couple spends most of the time standing on a stage in front.  Chinese wedding ceremonies have shifted from pure traditional Chinese style to a kind of bizarre formality. It is neither traditionally Chinese nor Western and typically includes: wedding rings, glamorous wedding pictures taken at a professional studio, multiple dresses worn by the bride, a lavishly decorated dining room and reception area in the hotel, fancy cars to transport the newlyweds and their entourage, hiring a famous host (MC), a huge feast, copious quantities of alcohol, firecrackers, and party favors that include chocolate and cigarettes.


    Modern wedding ceremony

    Don’t feel surprised if you are feeling dizzy just glancing at the list, you are not alone. Newlyweds often start preparing for their wedding ceremony several months in advance. Whether decorating their condo or taking wedding photos, or huddling with the wedding planner about the details of the ceremony, there’s pressure to get everything ready for the big day.  By the time they can go on honeymoon, most couples would rather just stay home and rest.

    The reality is, everybody knows and complains about how tiring it is to organize a wedding, yet most couples still repeat the same motions. Are they sacrificing their efforts for tradition? Not at all. They do it because weddings have become a way for people to show off their social status.

    For the newlyweds it is like a competition with their peers. For the parents however, a fancy wedding ceremony seems to have more symbolic meaning. Due to the fact that they barely had anything when they got married, and most families only have one child, this seems a chance to realize their fantasies in ways virtually impossible for them to achieve 25 years ago. It is also a perfect occasion to show their old friends what a great life they have now.

    Yet, no matter how exciting a Chinese wedding might sound, we all have to face a cold fact: there are many people in China – even among those ensconced in the middle class – who cannot afford these new wedding traditions.

    According to some unofficial calculations, in 2009 the total expenditure directly related to weddings was 600 billion CNY (92 billion USD). In 2010 the average wedding expenditure (excluding housing costs) for a Shanghai couple was 187,000 CNY (28,600 USD).

    For people who do not have the luxury of being able to afford such tremendous costs, it is not uncommon for them to borrow from their friends and relatives in order to have an “unforgettable” ceremony.

    Others see the problem from a different angle. If their daughter were to fall in love with a poor boy, some parents would not grant their permission for them to get married. At the same time, arranged marriages, blind dates and nationwide broadcast dating shows have started to pick up in popularity. The most frequently asked question for the involved parties is: do you have a house under your name?

    Still others are attempting to break free from those so called social norms and traditions, by standing up and saying no to the modern social pressure.

    A new word – “Luohun” (which directly translates as “getting married naked”) – emerged in 2008. It means that two people get married without buying a house, a car, wedding rings, having a fancy wedding ceremony or an exotic honeymoon. Instead, they spend only 9 CNY (1.4 USD) to get registered and obtain their marriage license from the state. Considering two people only get recognized in the community as a couple after their wedding ceremony in the old days, this represents a monumental shift in thinking.

    Over the past 3 years, “Luohun” has won more favour, especially with those born after 1980. According to an online survey regarding marriage trends, 60% of those polled aged 20 to 35 indicated that they can accept this new concept. It’s a matter perhaps of re-adjusting to the realities of an economy that, while growing rapidly, has also become more expensive.

    And there’s certainly some benefit in getting hitched without all the debts and encumbrances that are hard to bear for a young couple. After all, who wouldn’t want to get married naked?

    Lisa Gu is a 26-year old Chinese national. She grew up in Yangzhou (Jiangsu) and lives and works in Nanjing (Jiangsu).

    Photo by sheilaz413

  • The Census’ Fastest-Growing Cities Of The Decade

    Over the past decade urbanists, journalists and politicians have hotly debated where Americans were settling and what places were growing the fastest. With the final results in from the 2010 Census, we can now answer those questions, with at least some clarity.

    Not only does the Census tell us where people are moving, it also gives us clues as to why. It also helps explain where they might continue to go in the years ahead.  This information is invaluable to companies that are considering where to expand, or contract, their operations.

    For Forbes’ evaluation of the Census’ winners and losers, we have focused not on individual cities, but on metropolitan areas, which represent the most accurate designation for measurement. Take Atlanta, No. 10 on our list. While the city’s population grew by 1,000 over the last decade (2010 boundaries), the region, according to the Census grew, by roughly 1 million, the largest numerical increase among the country’s 51 largest metro areas. The city itself represents less than one-tenth the total metro area population.

    Las Vegas continued to be the nation’s fastest-growing major metropolitan area per capita, adding 41.8% to its population between 2000 and 2010. But the Las Vegas margin was very thin. Raleigh, N.C. (which ranked second) also gained 41.8%, and the difference between the two could only be measured at the third decimal point. If Raleigh had added just 10 more people, it would have been the leader.

    Overall, some 15 of the big metros grew at more than twice the 9.7% rate experienced by the entire country. One key reason — for at least some cities — was job growth. Las Vegas, which added 575,000 residents, and Raleigh grew their economies despite the tough recession. Sin City is still a top flight tourist destination, and its business-friendly policies are still attractive to other industries, particularly from highly regulated California.  The Texas metros Austin (No. 3), Houston (No. 8),  San Antonio (No. 9 ) and Dallas-Fort Worth (No. 11) all had strong job growth — as did Nashville, Tenn. (No. 12).

    However, not all the top growing regions in the country share the same economic trajectory. Many of the other leaders grew their job bases rapidly at the beginning of the decade but gave back some of their gains after the collapse of the mortgage market. This happened in places like Las Vegas Riverside-San Bernardino, Calif. (No. 5), Orlando , Fla., (No. 6), Phoenix, Ariz., (No. 7), Jacksonville, Fla. (No.13) and Sacramento, Calif. (No. 14).

    Yet all of the top ten — with the exception of Atlanta — expanded their job base during the decade.

    So if job growth itself is not a single determining indicator, what else has swelled these populations? Two things seem to stand out. One major factor seems to be affordability of housing. Throughout the decade people have moved primarily to those areas with cheaper house price relative to incomes.

    Take the movement of people from expensive coastal California not only to the interior parts of the state but especially to the Texas metropolitan areas, such as Dallas-Fort Worth and Houston. To put this in context, the median house price today as a share of median household income (the “median multiple”) averaged at 2.7 in Dallas-Fort Worth and 2.8 in Houston, compared with 7.2 in the No. 41 ranked Los Angeles or 8.1 in ultra-pricey San Francisco, which ranked No. 37.

    During the bubble, coastal California housing prices were even higher, peaking at a median multiple over 10, while Dallas-Fort Worth and Houston remained at 3.0 or below. There was also strong migration from coastal California to closer metropolitan areas in the West, where house prices were high by national standards, but far more affordable than in coastal California. Examples of this trend were No. 1 Las Vegas (which averaged 4.0 and peaked at 5.9), No. 7 Phoenix (averaged 3.4 and peaked at 4.7) and No. 15 Denver (averaged 4.1 and peaked at 4.5).

    A similar phenomenon can be seen on the east coast. To understand the rapid growth of a place like Raleigh, you have to look to the migration of people from the Northeast, notably the No. 44 New York area and No. 43 Boston. Housing costs seem to be a leading factor here. The ratio of median house price to median household income   in Raleigh averaged 3.6 (peaked at 4.2) — well below that of its primary talent sources like New York, which averaged 6.3, peaking at 7.7, and Boston, which averaged 5.2 and peaked at 6.1.

    Among the 20 fastest-growing regions, No. 16 Washington, D.C. region had relatively expensive housing, with an average median multiple of 4.2, after peaking at 5.7. Washington must be regarded in this sense as the great exception, a place whose steady employment growth has defied all market logic, since it is largely tethered to the ever-expanding scope of the federal government and its similarly growing legions of parasitic private corporations.

    The other major factor determining growth seems to be urban area density and size. Despite all the triumphant celebration of the glories and attraction of dense big city urbanism, almost all the fastest-growing metropolitan areas have low-density core cities and are predominately suburban in form. Indeed not one of the top 15 growing regions has a core city with a density of over 5,000 per square mile and only three, the Dallas-Fort Worth, Houston and Atlanta metropolitan areas, have more than 5 million residents.

    In contrast, the regions with the densest core cities–such as Boston and San Francisco–all grew at about half or less than the national average, despite core densities of 12,000 or above. All three of America’s largest metropolitan areas–New York, Los Angeles and Chicago, with populations nearing or above 10 million–grew far below the national average.  However thrilling and alluring dense large cities might be to pundits, academics and policy wonks, they are proving not so beguiling to Americans who, for the most part, continue to seek out “the American dream” wherever they can best afford it.

    Yet the very bottom of our list does include cities that are neither expensive nor particularly dense. These include the long-standing declinapolises that actually managed to lose population while the rest of the country was gaining. These include No. 47 Buffalo, N.Y., No. 48 Pittsburgh, Pa., No. 49 Cleveland, Ohio and ever-suffering No. 50 Detroit.

    The only non-rust belt core city to lose population this decade was No. 51 – New Orleans-Metarie-Kenner, La.  Of course, the Big Easy’s decline stems in large part from both nature’s depredations and what appears to be only a limited restoration of its basic infrastructure. But amazingly, the job loss in New Orleans was less than that of perennial loser Detroit and former perennial winner San Jose, which ranked 35th.

    So in our minds, NOLA’s last place finish may be a bit unfair, but then again so is life — and  sometimes demographics.

    Population 2000-2010 Employment 2000-2010
    Geography Change Pct Change Change Pct Change
    Las Vegas-Paradise, NV 575,504 41.83% 103,800 14.88%
    Raleigh-Cary, NC 333,419 41.83% 59,500 13.62%
    Austin-Round Rock-San Marcos, TX 466,526 37.33% 93,800 13.94%
    Charlotte-Gastonia-Rock Hill, NC-SC 427,590 32.14% 34,000 4.43%
    Riverside-San Bernardino-Ontario, CA 970,030 29.80% 122,800 12.42%
    Orlando-Kissimmee-Sanford, FL 489,850 29.79% 92,300 10.15%
    Phoenix-Mesa-Glendale, AZ 941,011 28.94% 108,400 6.87%
    Houston-Sugar Land-Baytown, TX 1,231,393 26.11% 278,600 12.38%
    San Antonio-New Braunfels, TX 430,805 25.17% 96,200 12.91%
    Atlanta-Sandy Springs-Marietta, GA 1,020,879 24.03% -30,900 -1.35%
    Dallas-Fort Worth-Arlington, TX 1,210,229 23.45% 101,400 3.67%
    Nashville-Davidson–Murfreesboro–Franklin, TN 278,145 21.20% 34,900 5.00%
    Jacksonville, FL 222,846 19.85% 15,900 2.81%
    Sacramento–Arden-Arcade–Roseville, CA 352,270 19.60% 10,700 1.34%
    Denver-Aurora-Broomfield, CO 364,242 16.71% -20,000 -1.65%
    Washington-Arlington-Alexandria, DC-VA-MD-WV 785,987 16.39% 285,700 10.67%
    Tampa-St. Petersburg-Clearwater, FL 387,246 16.16% -42,000 -3.63%
    Salt Lake City, UT 155,339 16.03% 41,600 7.36%
    Portland-Vancouver-Hillsboro, OR-WA 298,128 15.46% -7,800 -0.80%
    Indianapolis-Carmel, IN 231,137 15.16% 16,600 1.95%
    Richmond, VA 161,294 14.70% 14,000 2.38%
    Oklahoma City, OK 157,566 14.38% 20,500 3.83%
    Columbus, OH 223,842 13.88% -11,400 -1.25%
    Seattle-Tacoma-Bellevue, WA 395,931 13.01% -10,700 -0.65%
    Miami-Fort Lauderdale-Pompano Beach, FL 557,071 11.12% 27,900 1.29%
    Kansas City, MO-KS 199,296 10.85% -16,600 -1.69%
    Minneapolis-St. Paul-Bloomington, MN-WI 311,027 10.48% -59,000 -3.38%
    Louisville/Jefferson County, KY-IN 121,591 10.46% -29,500 -4.75%
    San Diego-Carlsbad-San Marcos, CA 281,480 10.00% 26,400 2.21%
    Memphis, TN-MS-AR 110,896 9.20% -36,700 -5.88%
    Birmingham-Hoover, AL 75,809 7.20% -27,400 -5.30%
    Baltimore-Towson, MD 157,495 6.17% 21,600 1.73%
    Virginia Beach-Norfolk-Newport News, VA-NC 95,313 6.05% 13,100 1.82%
    Cincinnati-Middletown, OH-KY-IN 120,519 6.00% -35,800 -3.52%
    San Jose-Sunnyvale-Santa Clara, CA 101,092 5.82% -191,900 -18.38%
    Hartford-West Hartford-East Hartford, CT 63,763 5.55% -24,400 -4.38%
    San Francisco-Oakland-Fremont, CA 211,651 5.13% -243,100 -11.43%
    Philadelphia-Camden-Wilmington, PA-NJ-DE-MD 278,196 4.89% -47,300 -1.72%
    St. Louis, MO-IL 114,209 4.23% -48,200 -3.60%
    Chicago-Joliet-Naperville, IL-IN-WI 362,789 3.99% -323,300 -7.07%
    Los Angeles-Long Beach-Santa Ana, CA 463,210 3.75% -340,400 -6.23%
    Milwaukee-Waukesha-West Allis, WI 55,167 3.68% -60,000 -6.91%
    Boston-Cambridge-Quincy, MA-NH 161,058 3.67% -112,900 -4.45%
    New York-Northern New Jersey-Long Island, NY-NJ-PA 574,107 3.13% -99,100 -1.18%
    Rochester, NY 16,492 1.59% -27,700 -5.22%
    Providence-New Bedford-Fall River, RI-MA 17,855 1.13% -35,500 -6.16%
    Buffalo-Niagara Falls, NY -34,602 -2.96% -21,300 -3.81%
    Pittsburgh, PA -74,802 -3.08% -23,300 -2.03%
    Cleveland-Elyria-Mentor, OH -70,903 -3.30% -144,700 -12.74%
    Detroit-Warren-Livonia, MI -156,307 -3.51% -470,900 -21.38%
    New Orleans-Metairie-Kenner, LA -148,746 -11.30% -98,300 -15.91%


    Sources: U.S. Census 2000, U.S. Census 2010, U.S. Bureau of Labor Current Employment Survey

    This piece originally appeared in Forbes.

    Joel Kotkin is executive editor of NewGeography.com and is a distinguished presidential fellow in urban futures at Chapman University, and an adjunct fellow of the Legatum Institute in London. He is author of The City: A Global History. His newest book is The Next Hundred Million: America in 2050, released in February, 2010.

    Wendell Cox is a Visiting Professor, Conservatoire National des Arts et Metiers, Paris and the author of “War on the Dream: How Anti-Sprawl Policy Threatens the Quality of Life

    Photo by justin fain

  • The Evolving Urban Form: Dallas-Fort Worth

    The Dallas-Fort Worth metropolitan area (Note 1), which corresponds to the Dallas-Fort Worth urban area, provides a casebook example of expanding urbanization. Dallas-Fort Worth has been one of the fastest growing major metropolitan areas in the nation for decades. Dallas-Fort Worth was among only three US metropolitan areas adding more than 1,000,000 residents between 2000 and 2010. Only Houston’s addition of 1,230,000 exceeded that of Dallas-Fort Worth, which grew by 1,210,000, a 23.4 percent growth rate. Atlanta was the third metropolitan area to add more than one million residents, at 1,021,000. During the 2000s, Dallas-Fort Worth passed Philadelphia to become the nation’s fourth largest urban area, with a population of 6,372,000. Only New York, Los Angeles and Chicago are larger.

    On an international scale, the United Nations estimates indicate that only Singapore, Houston and Atlanta had greater percentage growth between 2000 and 2010 among high-income world urban areas that exceed 4,000,000 in population.

    The Core: The core of the metropolitan area experienced the earliest growth and has since seen its share of growth and its growth rate decline significantly. Dallas County, which includes the historical core municipality of Dallas (Note 2), had a growth rate of 6.7 percent between 2000 and 2010, approximately one third less than the national growth rate of 9.7 percent. Nearly all of the growth in Dallas County was outside the city of Dallas, which added only 0.8 percent to its population, less than one-tenth of the national rate. The city of Dallas added 9,000 residents, while the suburbs within Dallas County added 140,000 residents.

    Overall, Dallas County accounted for 12 percent of the metropolitan area’s growth between 2000 and 2010. This is down from 41 percent between 1950 and 2000. Between 1900 and 1950, Dallas County accounted for an even larger share (66 percent) of growth (Figure 1). Dallas County’s annual growth rate fell from 4.1 percent between 1900 and 1950 to 2.6 percent between 1950 and 2000 to 0.7 percent in the last decade (Figure 2).


    Inner Suburban Counties: During the 2000s, the greatest growth was experienced in the inner suburban counties (those abutting the core county, Dallas). These six counties (Collin, Denton, Ellis, Kaufman, Rockwall and Tarrant, where Fort Worth is located) experienced a population gain of 38.9 percent. Inner suburban counties now contain 56 percent of the metropolitan area population. Between 2000 and 2010, the inner suburban counties captured 82 percent of the metropolitan area, up from 53 percent between 1950 and 2000 and 38 percent between 1900 and 1950. The inner suburban counties grew 1.7 percent annually from 1900 to 1950, increasing to 3.2 percent between 1950 and 2000 and 3.3 percent in the 2000s.

    Outer Suburban Counties: The outer suburban counties represent a comparatively small portion of the metropolitan area’s population. These five counties (Delta, Hunt, Jasper, Parker and Wise) accounted for only 7 percent of the metropolitan area population. The 2000 to 2010 growth rate was 20.9 percent, somewhat below the metropolitan area rate of 23.4 percent, and more than double the national population growth rate of 9.7 percent national growth rate.

    Between 2000 and 2010, the outer suburban counties captured 6 percent of the metropolitan area growth, the same share as between 1950 and 2000. However, perhaps surprisingly, their combined 1950 population was 19 percent below that of 1900. This illustrates the declining fortunes in the early part of the 20th century of counties that were dominated by agriculture, as the farm population and population of many small farm dependent communities declined. Of course, the 1900 to 1950 losses have since been compensated many times over by the post 1950 suburbanization. Nonetheless, one outer suburban county, Delta is unique in continuing to lose population through the 2010 census. Delta County’s 2010 population of 5,200 is approximately one third of its 1900 population of 15,200.

    The outer suburban counties lost 0.4 percent of their population annually from 1900 to 1950, but turned around to gain 2.1 percent from 1950 to 2000. Between 2000 and 2010, the growth rate fell back to 1.9 percent.

    The City of Dallas: The historical core municipality of Dallas illustrates of the dynamics of aggressive annexation policies. In 1910, Dallas covered only 16 square miles (41 square kilometers) and had a population of 92,000. Even at this early date, the city of Dallas was not very dense, with 5,700 residents per square mile (2,200 per square kilometer). The city reached its peak density of 7,300 (2,800 per square kilometer) in 1940, after having expanded to 41 square miles (106 square kilometers) and a population of 295,000.. Even at this peak density, the city of Dallas remained well below the densities of other core cities, especially in the East and Midwest, most of which had densities exceeding 10,000 per square mile (3,900 per square kilometer).

    By 1950, the city had expanded to 112 square miles (289 square kilometers) and with a population of 334,000, the population density had fallen to 3,900 (1,500 per square kilometer). Larger annexations were to follow, with the city reaching 343 square miles (885 square kilometers) by 2010. With a population of 1,198,000, the population density was 3,500 per square mile (1,350 per square kilometer), less than one-half the 1940 peak. Virtually all new owned housing was built consistent with the post-World War II suburban form, as occurred in metropolitan areas around the nation. The city’s addition of 9,000 residents between 2000 and 2010 was far less than the 182,000 gain between 1990 and 2000. By 2000, there was little greenfield land left to develop in the city and the population could be peaking. Indeed, the population could decline in future censuses, as has happened in geographically constrained urban cores around the world. Any such decline could, however, be counteracted by immigration, as has occurred in some urban cores.

    Ethic Trends in the Metropolitan Area: As would be expected in a state bordering Mexico, the Latino population of Dallas-Fort Worth grew substantially between 2000 and 2010, at a 43 percent rate. Overall, Latinos accounted for 42 percent of the metropolitan area’s growth. The Latino population increase was nearly 520,000, more people than live in the core city of Atlanta.

    However, unlike a number of other metropolitan areas, there was strong growth in the African-American population, which added 33 percent to its count. African-Americans accounted for 19 percent of the metropolitan area’s growth.

    This growth was strongest in the core county of Dallas, where Latino and African-American growth made up for a decline in the rest of the population.  In the inner suburban counties, 53 percent of the growth was Latino or African-America, while the lowest share of Latino and African American growth was in the outer suburban counties, at 30 percent.

    Overall, 75 percent of Latino growth and 69 percent of African-American growth took place in the suburban counties, which is a substantial change from the past (Figure 3).

    The Urban Area: Urban area data has not been released from the 2010 census. However, it is clear that Dallas-Fort Worth has become less dense since 1950. Between 1950 and 2000, the population density of the urban area declined approximately 10 percent.   Even so, it is surprising to some that the Dallas-Fort Worth urban area, with its low-density reputation, was only 12 percent less dense that Portland urban area in 2000, despite the aggressive densification strategies employed by Portland.

    The Expanding Metropolitan Area: The story in Dallas-Fort Worth is little different (Table) from what has emerged in metropolitan areas around the world, in places like Seoul, Mexico City and Mumbai. Dallas-Fort Worth also illustrates a trend only now becoming more obvious, that middle-sized and smaller metropolitan areas are generally growing faster than the megacities within their own countries (see the report by the McKinsey Global Institute). The United States has two megacities, the New York metropolitan area, which grew 3.1 percent from 2000 to 2010 and Los Angeles, which grew 3.7 percent. Dallas-Fort Worth’s far higher growth rate of 23.4 percent translated into an actual population increase of 175,000 more than the combined increase of the two megacities, despite their having five times the population.

    Dallas-Fort Worth: Population Trend by Sector and County 
    1900-2010
    1900 1950 2000 2010
    CORE COUNTY
    Dallas County       82,756    614,799  2,218,899  2,368,139
    INNER SUBURBAN COUNTIES    222,747    527,281  2,596,623  3,585,286
    Collin County       50,087      41,692    491,675    782,341
    Denton County       28,318      41,365    432,976    662,614
    Ellis County       50,059      45,645    111,360    149,610
    Kaufman County       33,376      31,170      71,313    103,350
    Rockwall County         8,531        6,156      43,080      78,337
    Tarrant County       52,376    361,253  1,446,219  1,809,034
    OUTER SUBURBAN COUNTIES    149,302    120,754    346,022    418,348
    Delta County       15,249        8,964        5,327        5,231
    Hunt County       47,295      42,731      76,596      86,129
    Johnson County       33,819      31,390    126,811    150,934
    Parker County       25,823      21,528      88,495    116,927
    Wise County       27,116      16,141      48,793      59,127
    METROPOLITAN STATISTICAL AREA    454,805  1,262,834  5,161,544  6,371,773

    The Future? It is an open question whether the rapid growth of Dallas-Fort Worth will continue. As it continues to grow, the stagnation that now afflicts the nation’s two megacities and its near-megacity, Chicago could spread to Dallas-Fort Worth. On the other hand, Dallas-Fort Worth has advantages that could permit its growth to continue for multiple decades into the future. Texas has a favorable business climate, low taxes and less heavy handed regulation than New York, California and Illinois. Dallas-Fort Worth has plenty of developable land as well as a political culture not cowed by development. The economic advance of its growing population, particularly the burgeoning Latino population, depends upon public policies that favor housing affordability and urban expansion. If it continues on its current course, Dallas-Fort Worth could pass the Chicago metropolitan area in population by 2050 and could even challenge Los Angeles later in the century.

    —-

    Note 1: As currently defined by the Census Bureau. Officially titled the Dallas-Fort Worth-Arlington metropolitan statistical area. Metropolitan areas are essentially labor markets and include a principal urban area and rural (non-urban) areas and may include smaller urban areas.

    Note 2: Fort Worth is not considered a historical core municipality, based upon the discussion in Perspectives on Urban Cores and Suburbs, though the Census Bureau considers Fort Worth and Arlington to be principal cities (which are a different thing). The "Dallas-Fort Worth" terminology is used because of its wide acceptance and to make the geographical expanse of the metropolitan area more clear.

    Wendell Cox is a Visiting Professor, Conservatoire National des Arts et Metiers, Paris and the author of “War on the Dream: How Anti-Sprawl Policy Threatens the Quality of Life

    Photo by Trey Ratcliff

  • Local Stakeholders Debate Changes to San Francisco Neighborhood Demographics

    Despite one of the highest population densities in California and a prohibitive cost of living, San Francisco keeps packing them in. Figures released by the U.S. Census last month show that “the City” added 28,502 people during the last ten years, a modest population bump of 3.7 percent from 2000.

    The racial composition of the city changed significantly during the “naughts.” The 2010 Census numbers indicate that the city lost nearly a quarter of its black population with 14,000 fewer residents than in 2000. Although still the largest group as described by race, there were 48,000 fewer white residents than in 2000, a 14 percent decrease. Both the number of Asian and Hispanic residents increased by 11 percent, constituting 33 and 15 percent of the city’s population, respectively.

    Additionally, San Francisco saw its already small percentage of children sink further: there were 5,000 fewer residents under the age of 18 residing in the city than in 2000. Although the former head of the city’s Department Children, Youth and Their Families believes that this number is low due to the number of undocumented children, the findings confirm the anecdote familiar to all San Francisco residents that there very well may be more dogs than children.

    Although the Census has not yet released data more specific smaller geographic units to help decipher the precise demographic shifts, Castro neighborhood stakeholders believe the area has changed in the last ten years. Despite the findings of the Census, many neighborhood observers have seen an increase in the number of children in the area, anecdotally suggesting that the increase in youngsters was absorbed by decreases in other neighborhoods. Perhaps families who can afford to raise children in such an expensive city are choosing to do so among the plush hills and restored Victorians of the Castro and nearby areas – nearby Noe Valley has long derisively been called “Stroller Valley” by the city’s hipsters.

    “The Castro has always been diverse in a number of ways,” Supervisor Scott Wiener said. “I think the biggest demographic changes over the past decade have been an increase in the number of parents, gay and straight, with children, and fewer young people because of the cost of housing in the neighborhood.”

    The 2000 Census showed the 94114 zip code with markedly different demographics than the rest of the City. For instance, 83 percent of the population was white, compared to nearly 50 percent citywide in 2000, and nearly 60 percent of residents in the zip code were male.

    “I do think that the area has become more diverse,” Mark Dicko, a realtor based at Herth Real Estate on Castro Street, said, agreeing with Wiener.

    However, the realtor did not share the same opinion on the area becoming grayer. “I’ve seen quite a few younger people moving into the area, many of the Google, Facebook, Apple employees have been able to purchase homes and condos or just want to rent in the area to be in the city. I have seen all ethnicities and sexual orientations deciding that they want to live in this area which is just fantastic.”

    “Certainly up in Buena Vista Park in the last 10-15 years, many families who had been there for a long time have moved out,” Richard Magary, chair of the Buena Vista Neighborhood Association, said. “Lots of upper-middle class houses changed hands to families with kids. It’s nice to see the fresher and younger families coming in.”

    Overall, the state added almost 4.5 million new residents, an increase of 10 percent from 2000. Much of this growth occurred in the Inland Empire and other counties in the San Joaquin Valley.

    Nationwide, the population grew by 9.7 percent to nearly 309 million.

    A version of this article was originally published in the Castro Courier neighborhood newspaper in San Francisco. Andy Sywak is the former publisher of the Courier. He now lives in Sacramento.

    Photo by stephanie vacher

  • Cities and the Census: Cities Neither Booming Nor Withering

    For many mayors across the country, including New York City’s Michael Bloomberg, the recently announced results of the 2010 census were a downer. In a host of cities, the population turned out to be substantially lower than the U.S. Census Bureau had estimated for 2010—in New York’s case, by some 250,000 people. Bloomberg immediately called the decade’s meager 2.1 percent growth, less than one-quarter the national average, an “undercount.” Senator Charles Schumer blamed extraterrestrials, accusing the Census Bureau of “living on another planet.” The truth, though, is that the census is very much of this world. It just isn’t the world that mayors, the media, and most urban planners want to see.

    Start with the fact that America continues to suburbanize. The country’s metropolitan areas have two major components: core cities (New York City, for example) and suburbs (such as Westchester County, Long Island, northern New Jersey, and even Pike County in Pennsylvania). During the 2000s, the census shows, just 8.6 percent of the population growth in metropolitan areas with more than a million people took place in the core cities; the rest took place in the suburbs. That 8.6 percent represents a decline from the 1990s, when the figure was 15.4 percent. The New York metropolitan area was no outlier: though it did better than the national average, with 29 percent of its growth taking place within New York City, that’s still a lot lower than the 46 percent that the center region saw in the 1990s.

    This may be shocking to some. For years, academics, the media, and big-city developers have been suggesting that suburbs were dying and that people were flocking back to the cities that they had fled in the 1970s. The Obama administration has taken this as gospel. “We’ve reached the limits of suburban development,” Housing and Urban Development secretary Shaun Donovan opined in 2010. “People are beginning to vote with their feet and come back to the central cities.” Yet of the 51 metropolitan areas that have more than 1 million residents, only three—Boston, Providence, and Oklahoma City—saw their core cities grow faster than their suburbs. (And both Boston and Providence grew slowly; their suburbs just grew more slowly. Oklahoma City, meanwhile, built suburban-style residences on the plentiful undeveloped land within city limits.)

    All this suburbanization means that the best unit for comparison may not be the core city but the metropolitan area, and the census shows clearly which metropolitan areas are growing and which are not. The top ten population gainers—growing by 20 percent, twice the national average or more—are the metropolitan areas surrounding Las Vegas, Raleigh, Austin, Charlotte, Riverside–San Bernardino, Orlando, Phoenix, Houston, San Antonio, and Atlanta. These areas are largely suburban in form. None developed the large, dense core cities that dominated America before the post–World War II suburban boom began. By contrast, many of the metropolitan areas that grew at rates half the national average or less—San Francisco, Los Angeles, Philadelphia, Boston, New York—have core areas that are the old, dense variety. Planners and pundits may like density, but people, for the most part, continue to prefer more space.

    If you do look at cities themselves, rather than at larger metropolitan areas, you’ll see that the census reveals three different categories. The most robust cities, with population growth over 15 percent for the decade—Raleigh, Austin, Charlotte, Las Vegas, Jacksonville, and Orlando—were located within the kind of metropolitan area that urbanists tend to dislike: highly suburbanized, dominated by single-family homes, and with few people using public transit. That’s partly because these cities developed along largely suburban lines by annexing undeveloped land and low-density areas. This has been the case in virtually all the fastest-growing cities. Raleigh has expanded its boundaries to become 12 times larger than it was in 1950; Charlotte and Orlando are nine times larger, and Jacksonville an astounding 25 times larger.

    At the opposite end of the spectrum are core cities, mostly in the Midwest and Northeast and often land-constrained, that have continued to shrink. These include longtime disaster zones like Detroit and Cleveland as well as newer ones like Birmingham in the South. They include Pittsburgh, a city much praised for its livability but one that is aging rapidly and whose city government, based disproportionately on revenue from universities and nonprofits, is among the nation’s most fiscally strapped. They even include Chicago, which lost some 200,000 people during the 2000s, its population falling to the lowest level since the 1910 census. The reasons aren’t hard to identify: despite all the hype about Chicago’s recovery and the legacy of Mayor Richard M. Daley, the Windy City is among the most fiscally weak urban areas in the country, its schools are in terrible shape, and its economy is struggling.

    Finally, there are cities that have grown, but not quickly. New York City’s population, for example, inched to a record high in the 2000s, but that growth was less than the national average. The population of Los Angeles grew a mere 97,000—the smallest increase since the 1890s. Many of the slow-growing cities (New York, San Francisco, and Boston, for example) suffer from high housing costs, which inhibit population growth. But they also host high-end industries—finance, technology, and business services—and enough well-paid workers in these industries to afford pricey housing and sustain a small rate of growth. The cities also attract already wealthy people from elsewhere.

    The census provides information on a smaller level, too, telling us not just which cities have grown, but where the growth has taken place within cities. Often, it has been in and around the historic downtowns. This is a trend in many cities that otherwise differ starkly (New York, St. Louis, Chicago, Los Angeles), and it reflects a subtle shift in the role of the downtown. Rather than reasserting themselves as dominant job centers, downtowns are becoming residential and cultural—a change that H. G. Wells predicted when he wrote that by 2000, the center of London would be “essentially a bazaar, a great gallery of shops and places of concourse and rendezvous.” What may have been an office, industrial, or retail zone morphs into a gentrified locale attractive to the migratory global rich, to affluent young people, and to childless households.

    This downtown recovery (which many cities subsidized heavily) was partly why so many urbanists and developers identified a broader back-to-the-city movement; but in reality, the phenomenon was usually limited to a relatively small population and a relatively small area. Since 1950, for example, St. Louis has lost a greater share of its population than any American city ever boasting 500,000 or more residents. The area from downtown to Central West End experienced strong growth during the 2000s, however, adding more people than Portland’s Pearl District, a favorite of urban planners. Yet this gain of 7,000 people was far from enough to offset the loss of 36,000 in the rest of St. Louis.

    It’s also worth noting that in economic terms, downtowns are losing their hold. For example, though the residential population of Chicago’s Loop tripled to 20,000 in the past decade, that famed business district lost almost 65,000 jobs; its share of the metropolitan area’s employment also fell. Los Angeles’s downtown, whose population has likewise grown, lost roughly 200,000 jobs from 1995 to 2005. Manhattan is losing employment share to the other four boroughs, as it has been for decades; but as a recent report from the Center for an Urban Future reveals, the process accelerated over the last ten years. From 2000 to 2009, Manhattan lost a net 41,833 jobs, while other boroughs saw net increases. This employment dispersion is even more evident in the suburbs. Of commuters who live in the inner-ring suburbs (such as Yonkers and East Orange), 60 percent work in their home counties and only 14 percent in Manhattan. Of commuters from such outer-ring suburbs as Haverstraw and Morristown, 73 percent work in their home counties and 6 percent in Manhattan.

    What, in the end, does the census tell us about America’s cities today? Certainly not that they’re dying, as they threatened to do in the 1950s, but equally certainly that they aren’t roaring back. Cities remain a successful niche product for a relatively small percentage of the population. Most people, though, even in the New York metropolitan area, continue to move toward the periphery rather than the core. That said, New York’s continuing growth over the past decade suggests that its recovery will likely prove durable. As for Senator Schumer’s “another planet” allegations, the census is simply confirming the fact that terrestrial Americans continue to disperse, both within and among metropolitan areas. So far, there’s little that planners, policy makers, and urban boosters can do about that.

    This piece originally appeared in City Journal.

    Joel Kotkin is executive editor of NewGeography.com and is a distinguished presidential fellow in urban futures at Chapman University, and an adjunct fellow of the Legatum Institute in London. He is author of The City: A Global History. His newest book is The Next Hundred Million: America in 2050, released in February, 2010.

    Wendell Cox is a Visiting Professor, Conservatoire National des Arts et Metiers, Paris and the author of “War on the Dream: How Anti-Sprawl Policy Threatens the Quality of Life

    Photo by caruba

  • The Evolving Urban Form: Mumbai

    The continuing dispersion of international metropolitan areas is illustrated by recently released 2011 Census of India preliminary data for the Mumbai "larger" metropolitan area. The historical core, the "island" district of Mumbai (Inner Mumbai) lost population between 2001 and 2011, while all growth was in suburban areas outside the historic core. Indeed, since 1981, Inner Mumbai lost 140,000 residents, while suburban areas gained 13.2 million.

    The larger metropolitan area is defined by district boundaries, the census division level below that of the state. The Mumbai Metropolitan Region Development Authority has a more "tight" definition, composed of smaller administrative units (municipalities), however that data is not yet available on the internet (Note). The larger metropolitan area includes four districts, two of which compose the city of Mumbai, Inner Mumbai (the historic core), and Outer Mumbai. The larger metropolitan area also includes the district of Thane, which is to the east and north of Mumbai and the district of Raigarh, which is to the south of Mumbai. The overwhelming majority of growth outside the city of Mumbai has been in Thane, which is accessible by land and bridge to Mumbai. Raigarh is less accessible from Mumbai and requires travel through Thane to reach.

    The historic population trends of these four districts are described below. The evolution of the Mumbai urban form is illustrated by the following:

    (1) The population growth rate peaked first in the core, Inner Mumbai, Outer Mumbai later and then fell substantially. Recent growth has been concentrated in the outlying districts of Thane and Raigarh. Figure 1 shows the population growth rate by district for each decade since the 1901 census.

    (2) Much of the population growth was in Inner Mumbai until 1961. From 1961 through 1981, the bulk of the population growth moved to Outer Mumbai. By the 1981 to 1991 period, Thane emerged to virtually equal Outer Mumbai in its share of growth and has been dominant since 1991. Figure 2 indicates the share of the larger metropolitan area growth by district since 1901.

    (3) The population of Inner Mumbai has risen comparatively little since 1961, with nearly all growth occurring first in Outer Mumbai and later in Thane. These two suburban areas now account for 90 percent of the larger metropolitan area population, double the 44 percent of 1961. Figure 3 illustrates the actual population, by district, of the larger metropolitan area from 1901 to 2011.

    Inner Mumbai: The historic core (Inner Mumbai) registered 3.146 million residents, down from 3.327 million in 2001. The historic core now contains only 12 percent of the larger metropolitan area population, down from 40 percent in 1961, adding approximately 375,000 residents during that forty year stretch. Overall, since 1960, the island district has captured only 2 percent of the larger metropolitan area growth. This contrast with the period before 1951; Inner Mumbai had captured approximately 60 percent of the larger metropolitan region population growth between 1931 and 1941, and 49 percent between 1941 and 1951. However, Inner Mumbai’s share dropped to a 26 percent share in 1951 to 1961 and an 11 percent share in 1961-1971. This is consistent with the overall trend in urban core population growth in metropolitan areas around the world, with population stalling or even declining once there is little greenfield land remaining for development. Inner Mumbai had lost population in the 1981-1991 census period, however recovered to reach its population peak in 2001. The 2011 population for Inner Mumbai was the lowest since the 1971 census. These population losses have occurred despite an unprecedented building boom of high-rise residential towers.

    Outer Mumbai: The Mumbai Suburban district (Outer Mumbai) became a part of the city of Mumbai through a 1950 consolidation. As Inner Mumbai became fully developed, population growth shifted sharply to Outer Mumbai. By 2011, Outer Mumbai grew to 9.33 million residents, an increase of 7.95 million from its 1961 total of 1.38 million. Outer Mumbai captured 41 percent of the larger metropolitan area growth from 1961 to 2011. However, as the supply of greenfield land has been reduced, Outer Mumbai’s growth has also slowed considerably. In each of the three decades from 1941 to 1971, Outer Mumbai grew by more than 100 percent. Outer Mumbai attracted only 19 percent of the larger metropolitan area growth, down from a 58 percent peak in the 1971-1981 period. The 2001-2011 increase of 744,000 (8.7 percent) was the lowest since the 1951-1961 census period, and was substantially below the 27.2 percent from rate from 1991 to 2001.

    Thane: During the last 10 years, Thane has become the largest district in the Mumbai larger metropolitan area, with a population of 11.1 million, passing Outer Mumbai. Thane is now the largest district in India. In 2001 Thane had 8.1 million residents in 2001 and grew 35 percent to 2011. This, however, is down from a 55 percent growth rate between 1991 and 2001, reflecting a decline in the overall growth rate of the larger metropolitan area (see below). Thane has steadily increased its share of growth in the larger metropolitan area, from 24 percent between 1961 and 1971 to 55 percent between 1991 and 2001. Thane reached a peak in the 2001-2011 census period, capturing 74 percent of the larger metropolitan area growth. Since 1961, Thane has captured 49 percent of the growth in the larger metropolitan area and added 9.4 million residents. In each of the last two census periods, Thane has added 2.9 million residents, equal nearly to the population of the urban core, Inner Mumbai.

    Raigarh: More remote from the core, Raigarh has experienced considerably slower growth than Thane, and until recently slower than Outer Mumbai. Raigarh grew 19 percent, from 2.21 million in 2001 to 2.64 million in 2011, an increase of 19 percent. This was the only census period since 1901 in which Raigarh grew more quickly than Outer Mumbai. Raigarh accounted for 11 percent of the larger metropolitan area growth between 2001 and 2011 and 8 percent since 1960. Raigarh added approximately 1.575 million residents from 1961 to 2001, more than four times that of larger Inner Mumbai (the urban core).

    Overall Population Growth: Consistent with the general population growth rate declines witnessed in less affluent nations, the Mumbai larger metropolitan area is growing less quickly than in previous decades. Between 2001 and 2011, the area grew 17.3 percent, which is down from 30.9 percent between 1991 and 2001.  The greatest growth had been between 1941 and 1951 (49 percent), with rates from 30 percent to 39 percent in each of the decades from 1951 to 1991 (Figure 4).

    Mumbai: Penultimate Density, Yet Representative: The core urban area (area of continuous urban development) of Mumbai represents approximately 80 percent of the larger metropolitan area population. Mumbai is the third most dense major urban area in the world at nearly 65,000 residents per square mile (25,000 per square kilometer), trailing Dhaka (Bangladesh) and Hong Kong. Yet even at this near penultimate density, Mumbai exhibits the general trends of dispersion and declining density that are occurring in urban areas around the world, from the most affluent to the least. In the two Mumbai city districts, as in other megacities, housing has become so expensive that population growth is being severely limited. Overall, the Mumbai larger metropolitan area may also be experiencing slower growth as smaller metropolitan areas outperform larger ones, a trend identified in a recent report by the McKinsey Global Institute. Finally, the over-crowded, slum conditions that prevail for more than one-half of the city’s residents could be instrumental in driving growth to more the distant suburbs of Thane and Raigarh.

    —-

    Note: This "larger metropolitan area" definition is consistent with the cruder US Bureau of the Census delineation for metropolitan areas, which is based upon counties (in 44 states), rather than tighter definitions, such as municipalities or census tracts.

    Photo: Chhatrapati Shivaji Terminus, formerly Victoria Terminus, Mumbai (by author)

    Wendell Cox is a Visiting Professor, Conservatoire National des Arts et Metiers, Paris and the author of “War on the Dream: How Anti-Sprawl Policy Threatens the Quality of Life

  • The Problem With Megacities

    The triumphalism surrounding the slums and megacities frankly disturbs me. It is, of course, right to celebrate the amazing resilience of residents living in these cities’ massive slums. But many of the megacity boosters miss a more important point: that the proliferation of these sorts of communities may not be desirable or even necessary.

    Cities may be getting larger, particularly in the developing world, but that does not make them better. Megacities such Kolkata (in India), Mumbai, Manila, Sao Paolo, Lagos and Mexico City — all among the top 10 most populous cities in the world — present a great opportunity for large corporate development firms who pledge to fix their problems with ultra-expensive hardware. They also provide thrilling features for journalists and a rich trove for academic researchers.

    But essentially megacities in developing countries should be seen for what they are: a tragic replaying of the worst aspects of the mass urbanization that occurred previously in the West. They play to the nostalgic tendency among urbanists to look back with fondness on the crowded cities of early 20th Century North America and Europe. Urban boosters like the Philadelphia Inquirer’s John Timpane speak fondly about going back to the “the way we were” — when our parents or grandparents lived stacked in small apartments, rode the subway to work and maintained a relatively small carbon footprint.

    Unfortunately such places were often not so nice for the people who actually lived in them. After all, they have been moving from higher to lower density locations for over fifty years, a trend still noticeable in the new Census. As my mother, who grew up a slum-dweller, says of her old Brooklyn neighborhood: “Brownsville was a crappy neighborhood then, and it’s a crappy neighborhood now.”

    My mother considers herself a tried and true New Yorker, but she and my late father chose to raise their kids on Long Island. She now lives in an apartment in Rockville Centre, somewhat farther out on the Island. One could imagine many slum-dwellers in developing countries would also choose a less crowded environment for themselves and their children, if that option existed.

    Most slum-dwellers, at least from what I have seen in India, move to the megacity not for the bright lights, but to escape hopeless poverty in their village. Some argue that these migrants are better off than previous slum-dwellers since they ride motorcycles and have cell phones.

    But access to the wonders of transportation and “information technology” is unlikely to compensate for physical conditions that are demonstrably worse than those my mother endured.  At least Depression-era poor New Yorkers could drink water out of a tap and expect consistent electricity, something not taken for granted by their modern day counterparts in Mexico City, Manila or Mumbai.

    More serious still, the slum-dwellers face a host of health challenges that recall the degradations of Dickensian London. Residents of mega-cities face enormous risks from such socially caused maladies as AIDS and other sexually transmitted diseases, urban violence, unsafely built environments, and what has been described as  ”the neglected epidemic” of road-related injuries. According to researchers Tim and Alana Campbell, developing countries now account for 85% of the world’s traffic fatalities.

    One telling indication of the difficulties the newcomers face is the relatively low level of life expectancy in the city — roughly 57 years — which is nearly seven years below the national average.

    Even with solid economic growth, these megacities are not necessarily becoming better places to live. In 1971, slum dwellers accounted for one in six Mumbai-kers; now they constitute an absolute majority. Inflated real estate prices drive even fairly decently employed people into slums. A modest one-bedroom apartment in the Mumbai suburbs, notes R. N.  Sharma of the Mumbai-based Tata Institute of Social Sciences, averages around 10,000 rupees a month, double the average worker’s monthly income.

    Traffic congestion is also worsening. Nearly half of Mumbai commuters spend at least one or two hours to get to work, far more than workers in smaller rivals such as Chennai, or Hyderabad. Fifty percent of formal sector workers expressed the desire to move elsewhere, in part to escape brutal train or car commutes; only a third of workers in other cities expressed this sentiment.

    What does this say about the future for megacities?  When conditions become oppressive enough, people generally respond by finding a better place to live. Poor village dwellers in Bihar may not all stay in the countryside, but they — and many better-skilled immigrants — may find other, less intense urban options.

    Recent research suggests that these immigrants will increasingly move to the urban fringe or to smaller cities. A massive research effort published earlier this year for the Lincoln Institute of Land Policy found that since 1990 “built-up area densities” have been dropping by roughly 2% a year, including in the developing world.

    An impressive new study by the McKinsey Global Institute, called “Mapping the Economic Power of Cities,” has found that “contrary to common perception, megacities have not been driving global growth for the past 15 years.” Many, the report concludes, have not grown faster than their host economies.

    McKinsey predicts these cities will underperform economically and demographically as growth shifts to   577 “fast growing middleweights,” many of them in China and India.  We can see this already in the shift of industrial growth to smaller cities in India. There may be an additional 25 million jobs added to the Indian auto industry by 2016, according to recent estimates, it appears most will go to other states, such as Gujarat, West Bengal and Tamil Nadu, enriching cities such as Chennai and Ahmedabad, nut not Mumbai.

    These realities lead some advocates in developing countries to question the logic of promoting megacities. Tata’s Sharma notes that as manufacturing and other industries move to smaller, more efficient cities, they remove many middle-income opportunities. Instead, the gap between the megacity’s rich and poor expands more rapidly.   “The boom that is happening is giving more to the wealthy.  This is the ’shining India’ people talk about,” Sharma says. “But the other part of it is very shocking, all the families where there is not even food security. We must ask: The ‘Shining India’ is for whom?

    Ashok R. Datar, chairman of the Mumbai Environmental Social Network and a long-time advisor to the Ambani corporate group, suggests that Asian megacities should stop emulating the early 20th Century Western model of rapid, dense urbanization. “We are copying the Western experience in our own stupid and silly way,” Datar says. “The poor gain on the rich. For every tech geek, we have two to three servants.

    Datar suggest that developing countries need to better promote the growth of more manageable smaller cities and try bringing more economic opportunity to the villages.  One does not have to be a Ghandian idealist to suggest that Ebenezer Howard’s “garden city” concept — conceived as a response to miserable conditions in early 20th Century urban Britain — may be better guide to future urban growth.

    Rejecting gigantism for its own sake, “the garden city” promotes, where possible, suburban growth, particularly in land-rich countries. It also can provide a guide to more human-scale approach to  dense urban development. The “garden city” is already a major focus in Singapore, where I serve as a guest lecturer at the Civil Service College. Singaporean planners are embracing bold ideas for decentralizing work, reducing commutes and restoring nearby natural areas.

    These ideas may be most relevant to cities on the cusp of rapid growth, such as Hanoi. As we walk through the high-density slums on the other side of the dike that protects Hanoi from the Red River, Giang Dang, founder of the nonprofit Action for the City, tells me that rapid growth is already degrading the quality of Hanoi’s urban life, affecting everything from the food safety to water to traffic congestion. Houses that accommodated one family, she notes, now often have two of three.

    Expanding Hanoi’s current 6 million people — already at least twice its population in the 1980s — to megacity size — say between 10 million and 15 million — may thrill urban land speculators but may not prove  so good for city residents.  Like Datar, Dang favors expanding conditions both smaller cities, and the Vietnamese countryside.

    “The city is already becoming unlivable,” she  insists. “More people, more high-rises will not make it better. Maybe it’s time to give up the stupid dream of the megacity.”

    Such voices are rarely heard in the conversation about urban problems.  But the urban future requires radical  new thinking.  Rather than foster an urban form that demands heroic survival, perhaps we should focus on ways to create cities that offer a more a healthful and even pleasant life for their citizens.

    This piece originally appeared in Forbes.com

    Joel Kotkin is executive editor of NewGeography.com and is a distinguished presidential fellow in urban futures at Chapman University, and an adjunct fellow of the Legatum Institute in London. He is author of The City: A Global History. His newest book is The Next Hundred Million: America in 2050, released in February, 2010.

    Photo by Dey Alexander

  • Hanoi’s Underground Capitalism

    Along the pitted elegance of Pho Ngo Quyen, a bustling street in Hanoi, Vietnam, you will, predictably, find uniformed men in Soviet-style uniforms, banners with Communist Party slogans, and grandfatherly pictures of Ho Chi Minh. Yet, capitalism thrives everywhere else in this community — in the tiny food stalls, countless mobile phone stores and clothing shops  offering everything from faux European fashion to reduced-price children’s wear,  sandals and sneakers.

    Outside a ministry office, someone is cutting hair on the street. Nearby a woman is drying squid to sell to customers. Internet cafes proliferate, filled with young people.  Virtually every nook and cranny has a small shop or workplace for making consumer goods.

    In some ways, Hanoi seems very much a third-world city in terms of its infrastructure and cracking sidewalks, and it shares some characteristics with the slums featured in this Megacities project, such as underground economies and a growing population migrating from rural areas. But its poverty pales compared to places like Mumbai or Rio. The poor sections are rundown and crowded, but you don’t see people sleeping on the streets. This is a city clearly on the way up — in a country with nearly 95% literacy and a countryside that not only feeds itself but remains the largest source of export earnings.

    Of course, many rural residents — still roughly 70% of the population — continue to pour into Hanoi and other cities, but without the same desperation that characterizes, for example, people moving from Bihar to New Dehli or Mumbai. There is nothing of the kind of criminal elements that fester in the favelas of Brazil or Mexico City colonias.

    In Hanou, even for the poor, it’s not just about survival. There’s a sense of Wild West in the East. With very un-socialistic frenzy, motorcyclists barrel down the streets like possessed demons, with little regard to walking lanes or lights. Everyone not on the government payroll seems to have hustle, or is looking for one.

    Modern-day Hanoi reminds me most of China in the 1980s, when I first started going there. But there are crucial differences. State-owned companies in Vietnam lack the depth and critical mass of their Chinese counterparts, for example.  Still, as in China, foreign firms are moving in: Panasonic plants dot the outskirts, and Nokia is planning to build a $200 million factory on the city’s edge.

    Hanoi is not Singapore either, where an enlightened state has allowed flashes of street capitalism, particularly in the hawker’s stalls that make the city a foodie’s delight. In Singapore business remains highly deliberate and world-class, enabled by a much envied and skilled Mandarinate. As you walk around Hanoi, peak inside a cavernous building and you’ll see not a sleek Singapore-style mall, but a cluttered collection of small boutiques. It reminds one of nothing more than the Vietnamese outposts in Orange County, Calif., or in Los Angeles’ Chinatown, which is now largely dominated by Chinese from Vietnam.

    Le Dang Doanh, one of the architects of Vietnam’s economic reforms, which were  known as (Doi Moi) and launched in 1986, estimates the private sector now accounts for 40% of the country’s GDP, up from virtually zero. But Le Dang estimated as much as 20% more occurs in the “underground” economy where cash — particularly U.S.  dollars — reigns as king.

    “You see firms with as many as 300 workers that are not registered,” the sprightly, bespectacled 69-year-old economist explains. “The motive force is underground. You walk along the street. I followed an electrical cable once and it led me to a factory with 27 workers making Honda parts and it was totally off the system.”

    After years as a Communist apparatchik, Le Dang now has more faith in markets than is commonly found in the American media or U.S. college campuses. Trained in the Soviet Union and the former East Germany, Le Dang saw up close the “future” of a state-guided economy and concluded it doesn’t work. He noted that in agriculture farmers produce 50% of the cash income on the 5% of land that they can call their own. He also mentions proudly that his son, born in 1979, works for a private Hanoi-based software firm.

    Other Vietnamese also have developed a taste for self-interest — and display considerable ingenuity finding their way. One clear inspiration, and source of capital, for the rapid acceleration toward capitalism comes from the over 3.7 million overseas Vietnamese. Ironically many of these are former stalwart opponents to the nominally capitalist rulers who fled the Communist takeover in 1975.

    Today you see these ties at Vietnamese banks and trading companies nestled in various U.S. communities, including the largest in Orange County.  Overall, the U.S. community — also strong in Houston, Northern Virginia and San Jose –  accounts for roughly 40% of the total diaspora.

    These communities have prospered, after a shaky start following the end of the Vietnam War. They are particularly prominent in fields such as information technology, science and engineering, with percentage representation in the workforce in those fields higher than most other immigrant groups.

    For years the Communist homeland had little contact and shared no common purpose with this  largely successful, intensely capitalist diaspora. Strengthening ties between these upwardly mobile communities and the mother country are changing both. As UC Davis researcher Jane Le Skaife has found,Vietnam now ranks sixteenth in the world in remittances from abroad, with over $8 billion in 2010, nearly three-fifths come from the U.S.  This amounts to roughly 8% of the country’s GDP and is a larger amount than investment from international aid donors.  Skaife and others believe this number may be much too small given the Vietnamese penchant for  running beneath the official radar — a skill honed over the centuries.

    Although hardly fans of the official Marxist-Lenninist regime, many Vietnamese , notes Le Skaife, now take great pride — and see great opportunity — in Vietnam’s rapid growth and growing affluence.  According to the  CIA World Factbook, the country’s poverty rate has dropped from 75% in the 1980s to  10.6% of the population in 2010 . In terms of economic output, a brief on Vietnam by the World Bank reported that between the years 1995 and 2005 real GDP increased by 7.3% per year and per capita income by 6.2% per year.

    The growing symbiosis of   Vietnam with its diaspora, particularly in the U.S., will shape the rapid development of the country, notes Le Dang. This parallels the roles played earlier by the Indian and Chinese diaspora in the development of their home countries over the past two decades.

    Nowhere will this impact be felt more than in major cities such as Hanoi, Danang and especially Ho Chi Minh City (the former Saigon). “We are seeing more of the expatriates here, and they are bringing management skill and capital through their family networks,” Le Dang says. “They are a key part of the changes here.”

    For Americans, these changes should be welcomed both for economic and geopolitical reasons. Although much of our intelligentsia welcomes the onset of a “post-American” world, the perspective in Hanoi could not be more different. To Vietnam’s leaders, the United States, for all memories of the devastating war there, remains a critical counterweight to the country that has been their historic rival, China. Americans are more welcomed in Hanoi these days than in Berlin or Paris, or maybe even Toronto.

    Even in the ramshackle working class wards along the Red River, you see signs in English and the dollar is welcome. It’s not that these fiercely independent people want to become Americans, but that they are acting like Americans — or at least those who still favor grassroots capitalism as the best way to secure the urban future.

    This piece originally appeared in Forbes.

    Joel Kotkin is executive editor of NewGeography.com and is a distinguished presidential fellow in urban futures at Chapman University, and an adjunct fellow of the Legatum Institute in London. He is author of The City: A Global History. His newest book is The Next Hundred Million: America in 2050, released in February, 2010.

    Photo by Gerry Popplestone

  • The Accelerating Suburbanization of New York

    Some of the best evidence that the tide has not turned against dispersion and suburbanization comes from an unlikely source:  New York’s 2010 census results. If dense urbanism works anywhere in America, it does within this greatest of US traditional urban areas.

    Before the actual count, the Census Bureau estimated, in large part as a result of a successful historical core municipality (city of New York) challenges, that as of Census Day (April 1, 2010), the city would have added 413,000 residents since 2000 and would have accounted for more than one-half of the metropolitan area growth. But the numbers turned out startlingly different. In fact, the city’s census count came in nearly 250,000 below projections and accounted for the lowest share of New York metropolitan area growth since the 1970s.

    Overall the 2010 census figures paint a picture of continuing dispersion in the nation’s largest metropolitan area, New York. The metropolitan area stretches from Manhattan, with the world’s second largest business district (after Tokyo) to the four outer boroughs of the city of New York, more than 100 miles to the eastern end of Long Island, north to Putnam and Rockland counties, completely across northern New Jersey, jumping the Delaware River to include Pike County, Pennsylvania and south to Ocean County (New Jersey), nearly all the way to Atlantic City. In all, this 23 county metropolitan area has the nation’s largest population and actually extended its margin over second place Los Angeles, which has been converted from a growth leader to a laggard giant growing slower than most Midwestern metropolitan areas. New York added 574,000 residents, while Los Angeles added 473,000. If New York continues to add more people than Los Angeles in future censuses, its position as the nation’s largest metropolitan area be secure.

    Major metropolitan areas in general did poorly in terms of growth in the new cesusus. This was particularly true in New York. Between 2000 and 2010, the New York metropolitan area population rose from 18,323,000 to 18,897,000, a modest growth rate of 3.1 percent, one of the slowest among major metropolitan areas in the country. The national growth rate was three times as high

    Suburbanization Accelerating Again: If you had read the New York Times and other Manhattan-based media over the last decade you would have assumed the suburbs were in decline and cities ascendant, particularly in the New York area. Yet in reality over the past decade, the suburban counties captured their largest share of New York metropolitan area growth in three decades. During the 2000s, the suburbs accounted for 71 percent of growth, up from 54 percent during the 1990s and 48 percent in the 1980s. The outer suburbs grew the fastest, while the inner suburbs – some of which are denser than historical core municipalities in other metropolitan areas – grew faster than the historical core municipality, the city of New York (Figure 1 and Table)


    NEW YORK METROPOLITAN AREA
    POPULATION TREND BY COUNTY: 2000 TO 2010
    2000 2010 Change %
    HISTORIC CORE MUNICIPALITY (New York)
    Bronx County, NY       1,332,650       1,385,108        52,458 3.9%
    Kings County, NY       2,465,326       2,504,700        39,374 1.6%
    New York County, NY       1,537,195       1,585,873        48,678 3.2%
    Queens County, NY       2,229,379       2,230,722          1,343 0.1%
    Richmond County, NY         443,728         468,730        25,002 5.6%
    Subtotal       8,008,278       8,175,133       166,855 2.1%
    INNER SUBURBAN
    Bergen County, NJ         884,118         905,116        20,998 2.4%
    Essex County, NJ         793,633         783,969         (9,664) -1.2%
    Hudson County, NJ         608,975         634,266        25,291 4.2%
    Middlesex County, NJ         750,162         809,858        59,696 8.0%
    Nassau County, NY       1,334,544       1,339,532          4,988 0.4%
    Passaic County, NJ         489,049         501,226        12,177 2.5%
    Union County, NJ         522,541         536,499        13,958 2.7%
    Westchester County, NY         923,459         949,113        25,654 2.8%
    Subtotal       6,306,481       6,459,579       153,098 2.4%
    OUTER SUBURBAN
    Hunterdon County, NJ         121,989         128,349          6,360 5.2%
    Monmouth County, NJ         615,301         630,380        15,079 2.5%
    Morris County, NJ         470,212         492,276        22,064 4.7%
    Ocean County, NJ         510,916         576,567        65,651 12.8%
    Pike County, PA           46,302           57,369        11,067 23.9%
    Putnam County, NY           95,745           99,710          3,965 4.1%
    Rockland County, NY         286,753         311,687        24,934 8.7%
    Somerset County, NJ         297,490         323,444        25,954 8.7%
    Suffolk County, NY       1,419,369       1,493,350        73,981 5.2%
    Sussex County, NJ         144,166         149,265          5,099 3.5%
    Subtotal       4,008,243       4,262,397       254,154 6.3%
    SUBTOTAL: SUBURBAN     10,314,724     10,721,976       407,252 3.9%
    TOTAL     18,323,002     18,897,109       574,107 3.1%


    Critically, the city of New York did worse than at any time since the 800,000 population loss that was sustained in the 1970s, representing all of the loss since 1950. Between 1950 and 1980 the suburbs added 3.9 million residents. The city’s fortunes had improved measurably in the 1980s and 1990s, with approximately one-half of the metropolitan area’s growth. The last decade’s share of metropolitan area growth – only 29 percent – in the historical core municipality indicates a startling acceleration of dispersion, although fortunately not a return to the population decline of the 1970s (Figure 2).

    City of New York: The city of New York grew from 8,008,000 to 8,175,000 between 2000 and 2010, a rate of 2.1 percent.

    Staten Island (Richmond County), which is largely suburban in form, was the fastest growing of New York’s boroughs, with a growth rate of 5.6 percent. The Bronx grew the second fastest, at a rate of 3.9 percent. Only Staten Island and Queens (below) reached their population peaks in the 2010 census (Figure 3).

    The Bronx has experienced perhaps the nation’s most successful urban turn-arounds, after a disastrous period in the 1970s and 1980s, when large swaths of the South Bronx were literally leveled. The population fell from 1,472,000 in 1970 to 1,204,000 in 1990. By 2010, the population had recovered nearly two-thirds of the loss, to 1,385,000.

    Manhattan (New York County) added 3.2 percent to its population (49,000) and reached 1,586,000. This is approximately one-third below its population peak of 2,232,000 in 1910.   Manhattan’s population, however, remained approximately 45,000 below the Census Bureau estimates.

    Brooklyn (Kings County) continues to be the largest borough in New York, with 2,505,000 residents, an increase of 39,000 (1.6 percent) between 2000 and 2010. Brooklyn reached its population peak of 2,738,000 in 1950. Brooklyn’s population proved approximately 75,000 below the Census Bureau’s estimates.

    The slowest growing borough was Queens, which added only 2,000 residents (a 0.1 percent population increase), yet reached its population peak of 2,231,000. Queens had added more residents than any other borough since 1950 and added approximately 275,000 residents in the 1990 to 2000 census period.

    Inner Ring Suburbs: The inner ring counties (Nassau, Westchester, Bergen, Passaic, Essex, Hudson, Union and Middlesex) grew 2.4 percent from 6,306,000 to 6,460,000. Growth rates varied significantly, from a loss of 1.2 percent in Essex County (where Newark is located) to 8.0 percent in Middlesex County. Middlesex County includes newer suburban areas further away from the core than in any other inner ring county. Much of the Middlesex County growth occurred in these areas. The inner ring suburbs captured 26.7 percent of the metropolitan area growth.

    Outer Ring Suburbs: By far the e fastest growth was in the outer ring counties, with a population increase of 6.3 percent, from 4,008,000 to 4,262,000. Monmouth County was the slowest growing outer ring county, adding 2.5 percent to its population. Pike County, Pennsylvania, which is the farthest to the west of any county in the metropolitan area, had by far the highest growth rate, at 23.8 percent. Ocean County, New Jersey, had the second fastest growth rate, at 12.8 percent. Ocean County lies at the extreme southern end of the metropolitan area. The outer ring counties captured 44.3 percent of the metropolitan area growth.

    Suburban Growth and Projections: Overall suburban growth was from 10,314,000 to 10,712,000, for a gain of 407,000 (4.0 percent). This was above the Census Bureau estimate of 392,000. The suburbs now contain 57 percent of the metropolitan area population.

    New York’s Continuing Dispersion: The dispersion of the 2000s is an extension of the overall metropolitan area trend since 1950 (Note). The historical core municipality, New York, has added less than 300,000 residents, or 3.6 percent. The suburbs have added 5.3 million residents, nearly doubling their population. Approximately 95 percent of the metropolitan area’s growth was in the suburbs between 1950 and 2010 (Figure 4).

    The dispersion is apparent even in the city of New York. Since 1950, Queens, the outermost of the inner four boroughs, added nearly 700,000 residents, while the more inner boroughs of Manhattan, Brooklyn and the Bronx, lost nearly as many residents. Overall these four inner boroughs gained only 6,000 residents since 1950. Staten Island, which is largely post-war suburban, grew 277,000, while the city overall was growing by 283,000, leaving only a net gain of 6,000 for the four inner boroughs of New York.

    A recent newgeography.com article documents similar patterns in employment dispersion and commuting during the 1990 to 2008 period.

    Consistency with the National Trend: The accelerating suburbanization of New York is consistent with the national trends in major metropolitan areas in the new census data. Between 1990 and 2000, historical core municipalities accounted for 15 percent of metropolitan area growth. Between 2000 and 2010, the share of historical core municipality growth had fallen to 9 percent.

    Note: This analysis is based upon the metropolitan area boundaries as currently defined.

    Wendell Cox is a Visiting Professor, Conservatoire National des Arts et Metiers, Paris and the author of “War on the Dream: How Anti-Sprawl Policy Threatens the Quality of Life

    Photo by Mike Lee

  • Vietnam, No Longer an Underdeveloped Country

    The most recent estimates for 2010 indicate that Vietnam is no longer among the underdeveloped countries of the world and has moved onto the ranks of middle-income countries.  Financial remittances – better known as money being sent back to the home country – have lent a critical hand in accomplishing this major triumph in the country’s formerly depressed economy.

    The influx of money by overseas Vietnamese, many of whom fled as political refugees, has dramatically changed the economic landscape of the country in terms of poverty levels and development.

    Development Since the War

    The aftermath of the war had left Vietnam among the five poorest countries in the world with 75 percent of the population living in poverty in 1984. Since then, the poverty level had dramatically decreased to 37 percent in 1998 and later to 29 percent in 2002, according to the World Bank.

    The CIA World Factbook more recently estimated Vietnam as having only 10.6 percent of the population living below the poverty line in 2010, a far cry from the 75 percent just 26 years earlier. In terms of economic output, a brief on Vietnam by the World Bank reported that the real GDP increased by 7.3 percent per year during 1995-2005 and per capita income by 6.2 percent per year.

    Vietnam was expected to enter the ranks of other middle-income countries by reaching the $1,000 GDP per capita marker by 2010, which it did according to the International Monetary Fund (IMF). The IMF estimated Vietnam’s GDP per capita as $1,155 for the 2010 fiscal year. Since then, the country’s Ministry of Planning and Investment (MPI) has set a new target that nearly doubles Vietnam’s current GDP per capita over the next four years. An expected GDP per capita of $2,100 by 2015 will allow Vietnam to surpass India’s GDP per capita in the global economy and be among the ranks of the Philippines.

    The target GDP per capita, however, is still well below its communist competitor, China, which now boasts an average GDP per capita of $4,520. Even though China presently holds the title as the “Red Dragon of the East,” Vietnam, with its enormous potential for economic growth, has recently been referred to as the “Rising Dragon” and the “New Asian Dragon” by various scholars.

    The World Bank avowed, “Vietnam is one of the best performing economies in the world over the last decade.” It further stated, “Vietnam’s poverty reduction and economic growth achievement in the last 15 years are one of the most spectacular success stories in economic development.”

    Remittances Over the Years

    Financial remittances have had a notable influence on the improved economic conditions in Vietnam over the years. This has been especially evident since the U.S. rescinded the embargo against Vietnam in 1995, which allowed for greater opportunities to remit money through formalized channels.

    In the years immediately following the Vietnam War, it was close to impossible for Vietnamese-Americans to send money directly to their home country. The majority of remittances that were successfully sent back to the home country were primarily conducted through informal money transfers.

    The gradual increase in official remittances over the past few decades, however, has been attributed to a combination of key events, which include but are not limited to: the Vietnamese government launch of a renovation process (Doi Moi) in 1986, the U.S. lifting of the embargo against Vietnam in 1995, and Vietnam’s membership into the World Trade Organization in 2007.

    In 2008, Vietnam emerged as the tenth leading recipient of migrant remittances among developing countries with $7.2 billion received during that year alone. The U.S. neighbor to the south, Mexico, with $26.3 billion, was third behind India and China.

    Later in 2009, Vietnam’s financial remittances fell slightly to $6.8 billion despite predictions of a greater drop among all developing countries. The slight decline during the considerable global economic downturn illustrated the resilience of money being sent to Vietnam from abroad, particularly from troubled economies such as the United States, France and in Eastern Europe.

    In addition, remittances appear again on an upswing.  By the end of the 2010 fiscal year, Vietnam set a new total inward remittance record of more than $8 billion through official channels. This $8 billion represented about 8 percent of the overall GDP for the country that year.

    The Role of remittances on development

    Although there have been no notable studies that directly connect migrant remittances and development specifically in Vietnam,  the effects of financial remittances on the Vietnamese economy are likely to be profound.

    Existing studies on other countries in the world have already illustrated the significant relationship between migrant remittances and development in the home country in terms of balance of payments, saving and investment, structural changes in the economy, and other channels influencing development and growth. In recent decades, these links between mother country and expatriates have played a critical role in the rise of both China and India.

    Such ties are particularly critical for developing countries which see remittances as a reliable long-term source of foreign capital. In 2000, the United Nations reported that financial remittances had increased the GDPs of El Salvador, Jamaica, Jordan, and Nicaragua by 10 percent. The World Bank in 2004 further revealed that financial remittances accounted for 31 percent, 25 percent, and 12 percent of the GDP in Tonga, Haiti, and Nicaragua, respectively.

    More recent data from the Migration Policy Institute (MPI) in 2009 astonishingly showed that remittances constituted 49.6 percent, 37.7 percent, and 31.4 percent of the overall GDP for Tajikistan, Tonga, and Moldova, respectively. Although Vietnam’s inward formal remittances comprise less than 10 percent of the country’s overall GDP, it was still ranked 16th among the top 30 remittance receiving countries by the World Bank in 2010.

    The existing potential of remittances on development has been notable in Vietnam and continues to grow exponentially – even despite the slowing of the economy in the rest of the world.

    Whether or not these effects are positive or negative may be a matter of ideology and politics. The Vietnamese government clearly wants to maximize the benefits of remittances. But there is concern about such issues as “dollarization” of the economy and the role such transfer may play in worsening the growing inequality between the rich and poor widely decried in Vietnam. Yet overall remittances should be seen as a net positive, helping to spark entrepreneurial ventures critical to the country’s movement from a third world to a solidly second world status.

    Jane Le Skaife is a doctoral candidate in the Department of Sociology at the University of California, Davis. She is currently conducting her dissertation research involving a cross-national comparison of Vietnamese refugees in France and the United States.

    Photo by Yen H Nguyen