In the wake of the Trumpocalypse, many in the deepest blue cores have turned on those parts of America that supported the president’s election, developing oikophobia—an irrational fear of their fellow citizens.
Category: Demographics
-
The Arrogance of Blue America
The rage against red America is so strong that The New York Time’s predictably progressive Nick Kristoff says his calls to understand red voters were “my most unpopular idea.” The essential logic—as laid out in a particularly acerbic piece in The New Republic—is that Trump’s America is not only socially deplorable, but economically moronic as well. The kind-hearted blue staters have sent their industries to the abodes of the unwashed, and taken in their poor, only to see them end up “more bitter, white, and alt-right than ever.”
The red states, by electing Trump, seem to have lost any claim on usually wide-ranging progressive empathy. Frank Rich, theater critic turned pundit, turns up his nose at what he calls “hillbilly chic.” Another leftist author suggests that working-class support for Brexit and Trump means it is time “to dissolve” the “more than 150-year-old alliance between the industrial working class and what one might call the intellectual-cultural Left.”
The fondest hope among the blue bourgeoise lies with the demographic eclipse of their red-state foes. Some clearly hope that the less-educated “dying white America,“ already suffering shorter lifespans, in part due to alcoholism and opioid abuse, is destined to fade from the scene. Then the blue lords can take over a country with which they can identify without embarrassment.
Marie Antoinette Economics
In seeking to tame their political inferiors, the blue bourgeoisie are closer to the Marie Antoinette school of political economy than any traditional notion of progressivism. They might seek to give the unwashed red masses “cake” in the form of free health care and welfare, but they don’t offer more than a future status as serfs of the cognitive aristocracy. The blue bourgeoisie, notes urban analyst Aaron Renn, are primary beneficiaries of “the decoupling of success in America.” In blue America, he notes, the top tiers “no longer need the overall prosperity of the country to personally do well. They can become enriched as a small, albeit sizable, minority.”
Some on the left recognize the hypocrisy of progressives’ abandoning the toiling masses. “Blue state secession is no better an idea than Confederate secession was,” observes one progressive journalist. “The Confederates wanted to draw themselves into a cocoon so they could enslave and exploit people. The blue state secessionists want to draw themselves into a cocoon so they can ignore the exploited people of America.”
Ironically, many of the most exploited people reside in blue states and cities. Both segregation and impoverishment has worsened during the decades-long urban “comeback,” as even longtime urban enthusiast Richard Florida now notes. Chicago, with its soaring crime rates and middle class out-migration, amidst a wave of elite corporate relocations, epitomizes the increasingly unequal tenor of blue societies.
In contrast the most egalitarian places, like Utah, tend to be largely Trump-friendly. Among the 10 states (and D.C.) with the most income inequality, seven supported Clinton in 2016, while seven of the 10 most equal states supported Trump.
If you want to see worst impacts of blue policies, go to those red regions—like upstate New York—controlled by the blue bourgeoise. Backwaters like these tend to be treated at best as a recreational colony that otherwise can depopulate, deindustrialize, and in general fall apart. In California, much of the poorer interior is being left to rot by policies imposed by a Bay Area regime hostile to suburban development, industrial growth, and large scale agriculture. Policies that boost energy prices 50 percent above neighboring states are more deeply felt in regions that compete with Texas or Arizona and are also far more dependent on air conditioning than affluent, temperate San Francisco or Malibu. Six of the 10 highest unemployment rates among the country’s metropolitan areas are in the state’s interior.
Basic Errors in Geography
The blue bourgeoisie’s self-celebration rests on multiple misunderstandings of geography, demography, and economics. To be sure, the deep blue cites are vitally important but it’s increasingly red states, and regions, that provide critical opportunities for upward mobility for middle- and working-class families.
The dominant blue narrative rests on the idea that the 10 largest metropolitan economies represents over one-third of the national GDP. Yet this hardly proves the superiority of Manhattan-like density; the other nine largest metropolitan economies are, notes demographer Wendell Cox, slightly more suburban than the national major metropolitan area average, with 86 percent of their residents inhabiting suburban and exurban areas.
In some of our most dynamic urban regions, such as Phoenix, virtually no part of the region can be made to fit into a Manhattan-, Brooklyn-, or even San Francisco-style definition of urbanity. Since 2010 more than 80 percent of all new jobs in our 53 leading metropolitan regions have been in suburban locations. The San Jose area, the epicenter of the “new economy,” may be congested but it is not traditionally urban—most people there live in single-family houses, and barely 5 percent of commuters take transit. Want to find dense urbanity in San Jose? You’ll miss it if you drive for more than 10 minutes.
Urban Innovation
The argument made by the blue bourgeoisie is simple: Dense core cities, and what goes on there, is infinitely more important, and consequential, than the activities centered in the dumber suburbs and small towns. Yet even in the ultra-blue Bay Area, the suburban Valley’s tech and STEM worker population per capita is twice that of San Francisco. In southern California, suburban Orange County has over 30 percent more STEM workers per capita than far more urban Los Angeles.
And it’s not just California. Seattle’s suburban Bellevue and Redmond are home to substantial IT operations, including the large Microsoft headquarters facility. Much of Portland’s Silicon Forest is located in suburban Washington County. Indeed a recent Forbes study found that the fastest-growing areas for technology jobs outside the Bay Area are all cities without much of an urban core: Charlotte, Raleigh Durham, Dallas-Fort Worth, Phoenix, and Detroit. In contrast most traditionally urban cities such as New York and Chicago have middling tech scenes, with far fewer STEM and tech workers per capita than the national average.
The blue bourgeois tend to see the activities that take place largely in the red states—for example manufacturing and energy—as backward sectors. Yet manufacturers employ most of the nation’s scientists and engineers. Regions in Trump states associated with manufacturing as well as fossil fuels—Houston, Dallas-Fort Worth, Detroit, Salt Lake—enjoy among the heaviest concentrations of STEM workers and engineers in the country, far above New York, Chicago, or Los Angeles.
Besides supplying the bulk of the food, energy, and manufactured goods consumed in blue America, these industries are among the country’s most productive, and still offer better paying options for blue-collar workers. Unlike a monopoly like Microsoft or Google, which can mint money by commanding market share, these sectors face strong domestic and foreign competition. From 1997-2012, labor productivity growth in manufacturing—3.3 percent per year—was a third higher than productivity growth in the private economy overall.
For its part, the innovative American energy sector has essentially changed the balance of power globally, overcoming decades of dependence on such countries as Saudi Arabia, Russia, and Venezuela. Agriculture—almost all food, including in California, is grown in red-oriented areas—continues to outperform competitors around the world.
Exports? In 2015, the U.S. exported $2.23 trillion worth of goods and services combined. Of the total, only $716.4 billion, or about a third, consisted of services. In contrast, manufactured goods accounted for 50 percent of all exports. Intellectual property payments, like royalties to Silicon Valley tech companies and entrepreneurs, amounted to $126.5 billion—just 18 percent of service exports and less than 6 percent of total exports of goods and services combined, barely even with agriculture.
Migration and the American Future
The blue bourgeoisie love to say “everyone” is moving back to the city; a meme amplified by the concentration of media in fewer places and the related collapse of local journalism. Yet in reality, except for a brief period right after the 2008 housing crash, people have continued to move away from dense areas.
Indeed the most recent estimates suggest that last year was the best for suburban areas since the Great Recession. In 2012, the suburbs attracted barely 150,000 more people than core cities but in 2016 the suburban advantage was 556,000. Just 10 of the nation’s 53 largest metropolitan regions (including San Francisco, Boston, and Washington) saw their core counties gain more people than their suburbs and exurbs.
Overall, people are definitively not moving to the most preferred places for cosmopolitan scribblers. Last year, all 10 of the top gainers in domestic migration were Sun Belt cities. The list was topped by Austin, a blue dot in its core county, surrounded by a rapidly growing, largely red Texas sea, followed by Tampa-St. Petersburg, Orlando, and Jacksonville in Florida, Charlotte and Raleigh in North Carolina, Las Vegas, Phoenix, and San Antonio.
Overall, domestic migration trends affirm Trump-friendly locales. In 2016, states that supported Trump gained a net of 400,000 domestic migrants from states that supported Clinton. This includes a somewhat unnoticed resurgence of migration to smaller cities, areas often friendly to Trump and the GOP. Domestic migration has accelerated to cities between with populations between half a million and a million people, while it’s been negative among those with populations over a million. The biggest out-migration now takes place in Los Angeles, Chicago, and New York.
Of course, for the blue cognoscenti, there’s only one explanation for such moves: Those people are losers and idiots. This is part of the new blue snobbery: Bad people, including the poor, are moving out to benighted places like Texas but the talented are flocking in. Yet, like so many comfortable assertions, this one does not stand scrutiny. It’s the middle class, particularly in their childbearing years, who, according to IRS data, are moving out of states like California and into ones like Texas. Since 2000, the Golden State has seen a net outflow of $36 billion dollars from migrants.
Millennials are widely hailed as the generation that will never abandon the deep blue city, but as they reach their thirties, they appear to be following their parents to the suburbs and exurbs, smaller cities, and the Sun Belt. This assures us that the next generation of Americans are far more likely to be raised in Salt Lake City, Atlanta, the four large Texas metropolitan areas, or in suburbs, than in the bluest metropolitan areas like New York, Seattle, or San Francisco—where the number of school-age children trends well below the national average.
This shift is being driven in large part by unsustainable housing costs. In the Bay Area, techies are increasingly looking for jobs outside the tech hub and some companies are even offering cash bonuses to those willing to leave. A recent poll indicated that 46 percent of millennials in the San Francisco Bay Area want to leave. The numbers of the “best and brightest” have been growing mostly in lower-cost regions such as Austin, Orlando, Houston, Nashville, and Charlotte.
Quality of Life: The Eye of the Beholder
Ultimately, in life as well as politics, people make choices of where to live based on economic realities. This may not apply entirely to the blue bourgeoisie, living at the top of the economic food chain or by dint of being the spawn of the wealthy. But for most Americans aspiring to a decent standard of living—most critically, the acquisition of decent living space—the expensive blue city simply is not practicable.
Indeed, when the cost of living is taken into consideration, most blue areas, except for San Jose/Silicon Valley, where high salaries track the prohibitive cost of living, provide a lower standard of living. People in Houston, Dallas, Austin, Atlanta, and Detroit actually made more on their paychecks than those in New York, San Francisco, or Boston. Deep-blue Los Angeles ranked near the bottom among the largest metropolitan areas.
These mundanities suggest that the battlegrounds for the future will not be of the blue bourgeoisie’s choosing but in suburbs, particularly around the booming periphery of major cities in red states. Many are politically contestable, often the last big “purple” areas in an increasingly polarized country. In few of these kinds of areas do you see 80 to 90 percent progressive or conservative electorates; many split their votes and a respectable number went for Trump and the GOP. If the blue bourgeoisie want to wage war in these places, they need to not attack the suburban lifestyles clearly preferred by the clear majority.
Blue America can certainly win the day if this administration continues to falter, proving all the relentless aspersions of its omnipresent critics. But even if Trump fails to bring home the bacon to his supporters, the progressives cannot succeed until they recognize that most Americans cannot, and often do not want to, live the blue bourgeoisie’s preferred lifestyle.
It’s time for progressives to leave their bastions and bubbles, and understand the country that they are determined to rule.
This piece first appeared on The Daily Beast.
Joel Kotkin is executive editor of NewGeography.com. He is the Roger Hobbs Distinguished Fellow in Urban Studies at Chapman University and executive director of the Houston-based Center for Opportunity Urbanism. His newest book, The Human City: Urbanism for the rest of us, was published in April by Agate. He is also author of The New Class Conflict, The City: A Global History, and The Next Hundred Million: America in 2050. He lives in Orange County, CA.
Photo: Rafał Konieczny (Own work) [CC BY-SA 4.0], via Wikimedia Commons
-
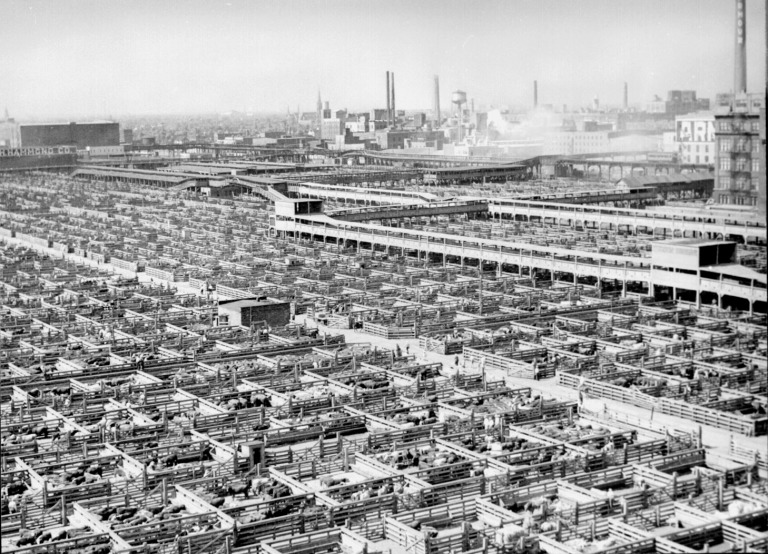
The Jungle
Upton Sinclair’s 1906 novel The Jungle was intended to inform the larger American public of the miserable working environment and sub survival wages of Chicago’s meat packing employees. The popular response was huge and lead to new government agencies and protections, but not the kind Sinclair had hoped for. By describing the dangerous and unhealthy conditions in slaughterhouses he meant to elicit sympathy for the workers who were denied adequate pay and were routinely maimed or killed on the job with no recourse to improved safety, medical care, or compensation.
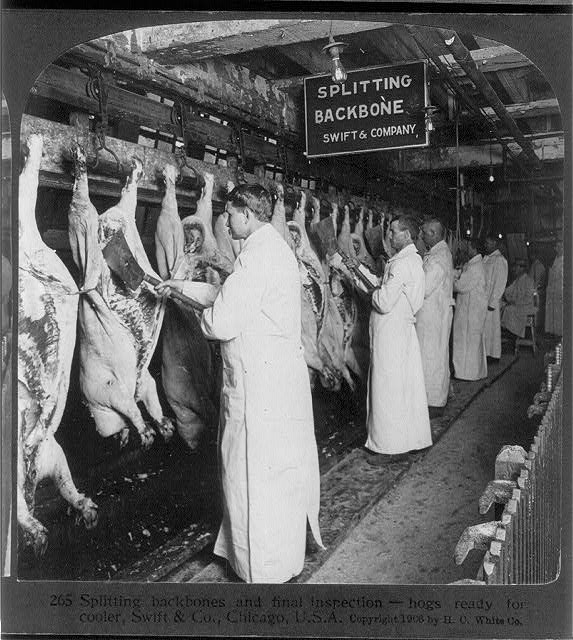
What the outraged American public focused on instead was tainted meat from unsanitary facilities. The general population was far less interested in the plight of the Lithuanian immigrant workers Sinclair described than the wholesomeness of the food supply. The Federal Food and Drug Administration was signed in to law by President Theodore Roosevelt in direct response to the uproar over the novel. Making life better for the underclass wasn’t nearly as gripping as making sure fingers weren’t getting ground up into the sausages.


It wasn’t until the Great Depression of the 1930’s that government – at the insistence of American voters – actually began to create serious labor laws to lift the status of ordinary workers. The pain of being on the wrong end of the stick had migrated from an unloved minority to too many people who thought they were better off – until they weren’t. And it wasn’t until the onset of World War II when labor became scarce relative to the need for wartime production that wages began to rise.
Americans don’t actually care about the poor and never have. It’s important to keep this in mind. I recently found this comment on an economics website. It sums up the standard response to today’s struggle over increasing inequality.
“Millions of very decent and good people can’t afford to live in upper middle class cocoon cities like what San Francisco is becoming. We need to allow the responsible members of the shrinking middle class and growing lower classes to isolate themselves from the worst members of the lower classes. People who lack the buying power to move to nice protected towns full of professional workers need ways to separate themselves from social pathology. Our current elites inflict section 8 housing and a growing immigrant lower class on the responsible people who can’t afford bubble city life. This is just so wrong of them. Our elites are our enemies.” Source
So the problem is that elites are segregating themselves from the declining middle class – and the proposed solution is to provide a separate bubble for the squeezed former middle class to retreat to so they can segregate themselves from people lower down the ladder. Huh? I suppose I have to ask… who decides who is struggling but worthy and who is part of the “social pathology”? And what mechanism might deliver the protection the commentator desires?
As a society we don’t reach for solutions that might address the underlaying structural flaws that create the underclass or the elites. Instead we look for ways deserving individuals can distance themselves from the effects of those structural defects. We assume a big chunk of the population will be left behind and we don’t mind so long as it’s the undeserving that get screwed. That’s always been our de facto national policy.
This piece first appeared on Granola Shotgun.
John Sanphillippo lives in San Francisco and blogs about urbanism, adaptation, and resilience at granolashotgun.com. He’s a member of the Congress for New Urbanism, films videos for faircompanies.com, and is a regular contributor to Strongtowns.org. He earns his living by buying, renovating, and renting undervalued properties in places that have good long term prospects. He is a graduate of Rutgers University.
-
Driving Alone Hits High, Transit Hits Low in “Post-Car” City of Los Angeles
According to The New York Times, the car used to be “king” in the city (municipality) of Los Angeles. “’A Different Los Angeles’, The City Moves to Alter its Sprawling Image,” was another story that seeks to portray the nation’s second largest municipality as having fundamentally changed. Following this now popular meme, a Slate story in 2016 referred to Los Angeles becoming “America’s next great transit city.” Los Angeles has surely become America’s greatest transit tax city, with Los Angeles County voters in 2016 approving a fourth half-cent sales tax increase principally for transit since 1980. Yet transit’s market share has fallen, not only in the nation’s largest county but even in the city of Los Angeles.
The Ascent of Transit: A False Narrative
The Los Angeles political establishment and media is virtually unanimous in its praise for the now quarter century old rail system. Yet, despite more than $15 billion being spent on rail transit the already meager levels of transit commuting in the city have fallen further, while solo driving has risen to an all time high. Unless platitudes are more important than results, rail’s success is a false narrative. People are driving more and using transit less according to the American Community Survey for 2015.
The share of city of Los Angeles residents commuting by transit fell from 11.2 percent in 2010 to 9.5 percent in 2015 (Figure 1, note truncated axis). The 2010 figure was the highest decennial census year transit figure in the period starting in 1980. Just five years later, in 2015, however, the city of Los Angeles transit commuting share had fallen below 1980 levels.
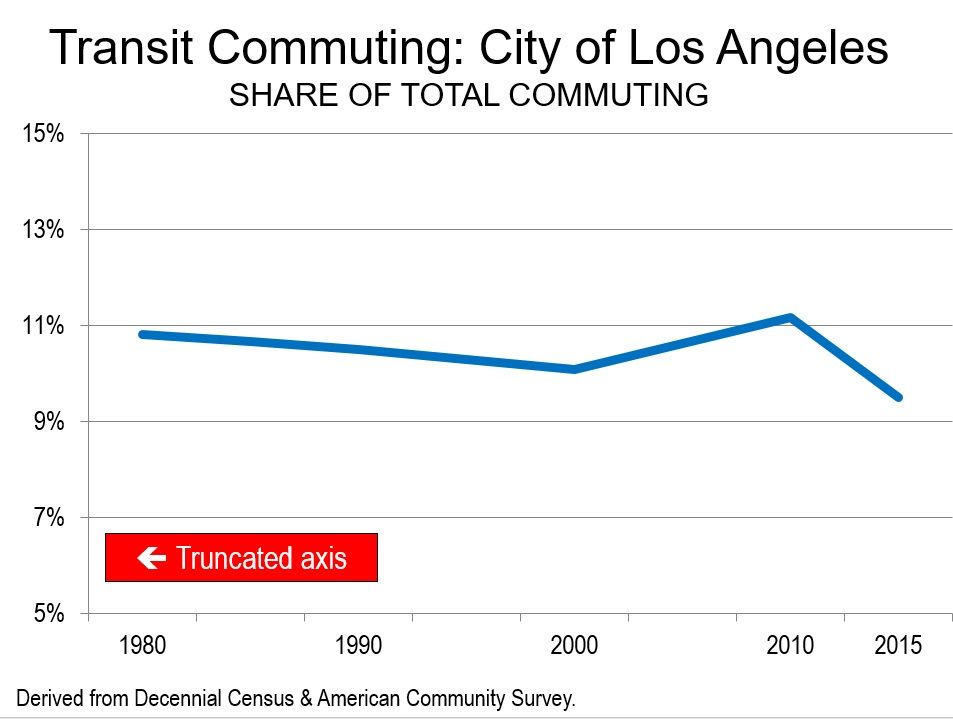
In 1980, 10.8 percent of the city’s commuters used transit, a figure that fell to 10.5 percent just before the initial Long Beach “Blue Line” opened in 1990. While new light rail lines and the Metro (subway) line opened after 1990, transit’s market share fell further, to 10.1 percent by 2010. During the 2000s, transit commuting rose 1.1 percentage points to the 11.2 percent figure, propelled by unprecedented gasoline price increases. But progress was short-lived as the share dropped to 9.5 percent in 2015.
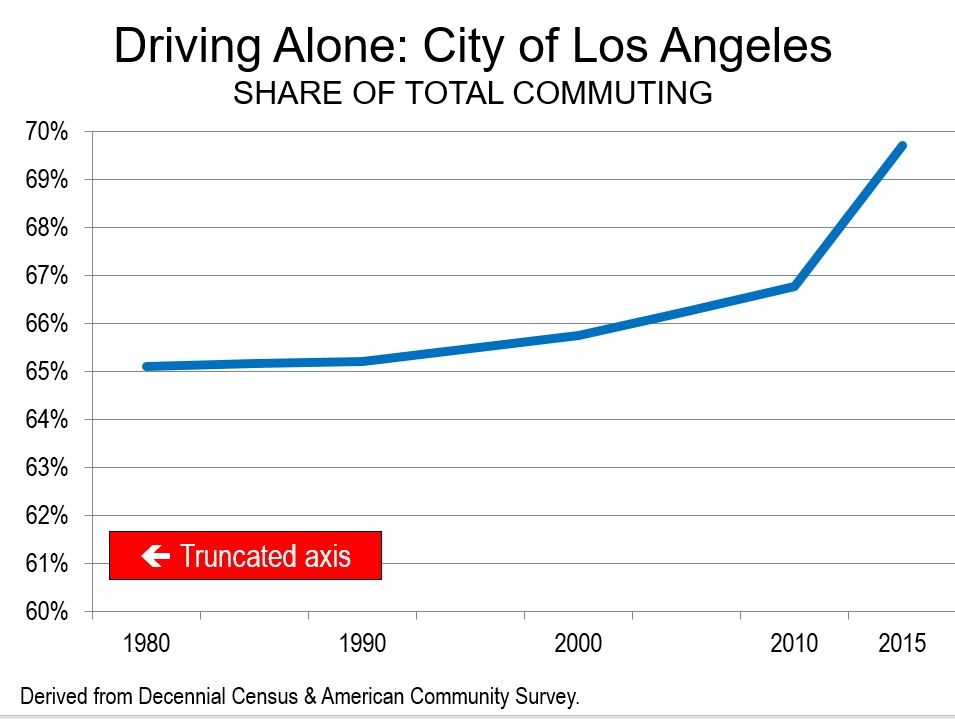
City of Los Angeles Surge in Driving Alone
At the same time, commuters were turning even more to driving alone. In 2015, 69.8 percent of work trip access was by solo drivers. This represents a substantial increase from the 66.8 percent drive alone share in 2010. From 1980 to 2010, driving alone edged up slightly, much less than the increase in the last five years. In 1980, 65.1 percent of commuters drove alone. In 1990, a nearly identical 65.2 percent drove alone. In the last five years, driving alone has risen more than the entire previous 30-year increase in the city of Los Angeles.
The news could get worse. According to new American Public Transportation (APTA) data, total ridership on all Los Angeles County MTA services dropped more than five percent from 2016. The APTA reported decline is astounding, since the highly touted extension of the Expo light rail line to downtown Santa Monica opened in 2016. Even more astounding is that the expensive, at least seven line (counted at radial line ends plus the transverse Green Line) system has added not a soul to transit ridership on the Los Angeles MTA bus and rail system since 1985. Not all MTA service is in the city of Los Angeles, however, the APTA data could presage a further transit market share decline in the city with the American Community Survey data due in the Autumn.
All of this is consistent with the larger trend in the Los Angeles metropolitan area (which includes Los Angeles and Orange Counties). Overall, the transit work trip market share in the metropolitan area fell from 6.1 percent in 2010 to 5.1 percent in 2015. The MTA 2016 decline is likely to push this figure lower.
The Illusion of a “Different Los Angeles”
Yet to read the press and media accounts in Los Angeles, one might be inclined to believe an alternate reality that LA transit is ascendant.
Christopher Hawthorne, who teaches urban and environment policy at Occidental College told The New York Times that the recent defeat of a development moratorium, along with approval of the transit tax and an affordable housing measure is “a very clear statement from the voters that they want a different Los Angeles.”
The voters may want a different Los Angeles, but apparently commuters are sufficiently happy with driving and have been for the more than a quarter century since rail transit was restored to Los Angeles. This is not surprising, since the average commuter can reach 60 times as many jobs by car in 30 minutes in the Los Angeles metropolitan area as by transit. (30 minutes is the average one-way commute time in the metropolitan area). Data is not available for the city of Los Angeles (see: “Access in the City”).
However, it is a generally hopeless task for transit to be an alternative to the automobile, except for trips to and from the urban core (downtown and nearby). The reality is that it could take as much as the total income, every year, of a metropolitan area to provide transit that could effectively compete with the car throughout a metropolitan area for work and other trips.
Platitudes do not ride, people do. At least with respect to the implied transit ridership increases and forsaken cars, the “different” Los Angeles is an illusion, completely inconsistent with reality.
Wendell Cox is principal of Demographia, an international public policy and demographics firm. He is a Senior Fellow of the Center for Opportunity Urbanism (US), Senior Fellow for Housing Affordability and Municipal Policy for the Frontier Centre for Public Policy (Canada), and a member of the Board of Advisors of the Center for Demographics and Policy at Chapman University (California). He is co-author of the “Demographia International Housing Affordability Survey” and author of “Demographia World Urban Areas” and “War on the Dream: How Anti-Sprawl Policy Threatens the Quality of Life.” He was appointed to three terms on the Los Angeles County Transportation Commission, where he served with the leading city and county leadership as the only non-elected member. He served as a visiting professor at the Conservatoire National des Arts et Metiers, a national university in Paris.
Photo: Los Angeles City Hall (by author)
-
The Politics of Migration: From Blue to Red
Democratic “blue” state attitudes may dominate the national media, but they can’t yet tell people where to live. Despite all the hype about a massive “back to the city” movement and the supposed superiority of ultra-expensive liberal regions, people are increasingly moving to red states and regions, as well as to suburbs and exurbs.
This is the basic takeaway from the most recent IRS data and Census Bureau estimates, which have been widely ignored in the established media. Essentially, Americans are rejecting what Walter Russell Mead has labelled “the blue model,” and relocating to cities, states and regions that are less dense, less heavily taxed, and less regulated.
This suggests not an intrinsic political calculation so much as a series of very personal decisions by individuals and families. People move for varied reasons — cheaper homes, lower taxes, employment opportunities, better schools, more value to the paycheck — but the upshot is that they are settling in states that tend to be red or, at least, purple in political coloration.
In 2016 alone, states that supported Donald Trump gained 400,000 domestic migrants from states that supported Hillary Clinton. This came on top of an existing advantage in net domestic red state migration of 1.45 million people from 2010 through 2015. Contrary to popular perception, these blue state emigres aren’t all fleeing economically challenged places such as upstate New York or inland California. Mostly, they have left the biggest cities, which are the electoral base of the Democratic Party. Metropolitan New York has led the way in out-migration, followed by Los Angeles and Chicago. Since 2000, these metropolitan areas have lost a net 5.5 million domestic migrants to other parts of the country.
Even economic boom conditions have failed to reverse this trend. Overall, many big blue core cities now have overall population growth rates well below the somewhat tepid national average of 0.7 percent. So, who’s growing? Last year, all 10 of the top gainers in domestic migration were Sunbelt metropolitan areas: Austin, Tampa-St. Petersburg, Raleigh, Jacksonville, Las Vegas, Charlotte, Orlando, Nashville, Phoenix and San Antonio.
Perhaps most surprising, given the almost universal dismissal of their prospects, has been a shift to smaller cities, a more Trump-oriented part of the urban archipelago. Domestic migration has accelerated to cities between 500,000 and 1 million population, while declining in those above 1 million.
The Suburban Resurgence
More important still has been the revival in the suburbs, particularly in Sunbelt metropolitan areas. The most recent estimates suggest that last year was the best for suburban areas since the Great Recession. In 2012, the suburbs of the major metropolitan areas (over 1 million) attracted barely 150,000 more people than core counties, an edge that grew to 556,000 last year. Between 2010 and 2015, suburban counties of major metropolitan areas added 825,000 net domestic migrants, while the urban core counties lost nearly 600,000.
Critically, since 2010 more than 80 percent of all new jobs in our 53 leading metropolitan regions have been created in suburban locations. Many of the leading tech areas of the country –from Silicon Valley and Raleigh-Durham to tech centers surrounding the big Texas cities — are primarily suburban. The economic future, contrary to the common media memes, will be primarily occurring in the periphery of the hip urban cores.
This trend may accelerate as millennials begin to enter their 30s and look for safe, affordable places to live. We already see this in the behavior of their predecessors, the X generation. Using census data of those 35-49 as our measurement, since 2000 the percentage of Gen-Xers living in the urban core has dropped by one percentage point, while the percentage living new suburbs and exurbs has grown by six percentage points. The latest estimates indicate over 80 percent of Xers in the 53 largest metropolitan areas lived in suburban areas.
Gen-Xer shares grew most dramatically in the affordable Sunbelt, like almost completely suburban Raleigh, which saw a 50 percent growth in the share of Xers relative to the national rate. Rapid growth also took place in Las Vegas, Charlotte, Phoenix, Orlando and Salt Lake City as well as the big four Texas cities: Austin, Houston, Dallas-Fort Worth, and San Antonio.
In contrast the Gen-X population share has remained stagnant in the San Francisco and San Jose areas, while the Los Angeles, New York, Boston, Chicago and Philadelphia areas have all seen declines in their Xer shares both since 2000 and since 2010. This could be a harbinger of millennial behavior. Like the Xers, millennials are beginning to move into the suburbs, contradicting all predictions to the contrary. Since 2010, the biggest gains in millennial share have been in heavily suburban Orlando, Austin and San Antonio.
Generally speaking, notes economist Jed Kolko, the peak years for living in higher density multi-family neighborhoods take place between ages 18 and 30. Kolko calculates that while almost a quarter of these under-30 urban dwellers live in these higher density neighborhoods, by age 40 this drops well below 20 percent, and stays there until people are into their 70s. Given that the 30-something population is destined to grow far faster than 20-somethings in the coming decades, the move to suburbia, with its detached housing — particularly in regions with lower home prices — is expected to continue for the foreseeable future.
This shift is likely to be driven in large part by unsustainable housing costs. In the San Francisco Bay Area, techies are increasingly looking for jobs outside the region, and some companies are offering cash bonuses for those willing to leave. A recent poll indicated that 46 percent of millennials want to leave the Bay Area. Meanwhile, these “best and brightest” have been gravitating to lower cost areas such as Austin, Orlando, Houston, Nashville, and Charlotte.
The basics that drive people to the suburbs remain: cheaper real estate, a preponderance of single family housing, better schools, a poverty rate roughly half that of core municipalities as well as far lower incidence of violent crime than in urban cores. This trend will be accelerated, as a recent policy analysis released by the consulting firm Bain shows, by services such as Uber or Lyft, the appeal of working at home as well as the development of automated vehicles.
Political Implications
Ultimately, the key political battlegrounds for the future will not be in blue cities but in purple suburbs, particularly in the booming periphery of major cities in red states. No matter how loud and pervasive the voices emanating from the urban core, or for that matter, ungentrified countryside, Trump won the election by taking by a significant five percentage point suburban margin nationally, improving on Romney’s two-point edge, and by more outside the coastal regions.
This contradicts the confident assertions by the New York Times and other establishment voices that Trump would get his clock cleaned in suburbia, particularly among college-educated voters in upscale communities. Suburban voters made the difference in the crucial Midwestern states of Michigan, Wisconsin and Pennsylvania, and Trump came close to winning in supposedly deep blue Minnesota.
In Michigan, Trump lost Wayne County (including Detroit) by more than 2-1, but captured four of the five surrounding suburban counties by margins that greatly exceeded that of Michigan native Romney. The pattern was similar in Pennsylvania where Clinton won in the Philadelphia metropolitan area – and Pittsburgh’s urban Allegheny County, while Trump was flipping the state with majorities in nearly every other county. Much the same can be said about Wisconsin and Ohio, states critical as well to the Trump win and the GOP future.
This pattern is not set in stone. Trump, as the New York Times recently enthused, does suffer from continuing problems with educated suburban voters. Perhaps even more threatening to the GOP is that minorities now account for more than 40 percent of all suburban and exurban residents, growing far faster in the periphery than non-Hispanic whites. Trump lost traditionally right-leaning but rapidly diversifying places such as Orange County, Calif., and Fort Bend County outside of Houston.
Yet, winning over suburbia in the long run may not be easy for the Democrats. As millennials and Xers, as well as minorities, begin to own property and earn more money, their attitudes on taxes tend to shift to a more conservative perspective, notes a recent Reason poll. Similarly many first-generation Asian immigrants tend to be far more conservative than second- or third-generation Chinese- or Korean-Americans, many of whom have been through college indoctrination and are comfortably ensconced in the generally Democratic-leaning high-end professional class.
Perhaps the biggest problem for the left lies in their embrace of policies that reject suburban lifestyles and, as we see in California, make housing hard to build and all but unaffordable. Most millennials and Xers, not to mention minorities, cannot afford to live in places like brownstone Brooklyn or San Francisco. In adopting policies to curb “sprawl,” blue state politicians are assaulting the suburban lifestyles clearly preferred by the clear majority. This leftist urban policy does not constitute an ideal strategy to appeal to those, including minorities, who want nothing more than to live comfortable lives on the periphery.
Right now, the demographic trends do not clearly favor either party. The new generation now forming families — and heading towards the red states — may not be as conservative as boomers but their politics are less lock-step progressive than many believe, even on gender-related issues. They may want health-care reform, good schools, and cleaner environments. But they also want jobs, would like to hold onto more of their paychecks, and cherish the same suburban amenities they enjoyed as children.
Ultimately, it’s a matter of which politicians can delineate the best path toward greater opportunity and homeownership for middle-class families. The political party that addresses these aspirations is likely to be the one that wins the race in the long run.
This piece first appeared on Real Clear Politics.
Joel Kotkin is executive editor of NewGeography.com. He is the Roger Hobbs Distinguished Fellow in Urban Studies at Chapman University and executive director of the Houston-based Center for Opportunity Urbanism. His newest book, The Human City: Urbanism for the rest of us, was published in April by Agate. He is also author of The New Class Conflict, The City: A Global History, and The Next Hundred Million: America in 2050. He lives in Orange County, CA.
Wendell Cox is principal of Demographia, an international public policy and demographics firm. He is a Senior Fellow of the Center for Opportunity Urbanism (US), Senior Fellow for Housing Affordability and Municipal Policy for the Frontier Centre for Public Policy (Canada), and a member of the Board of Advisors of the Center for Demographics and Policy at Chapman University (California). He is co-author of the “Demographia International Housing Affordability Survey” and author of “Demographia World Urban Areas” and “War on the Dream: How Anti-Sprawl Policy Threatens the Quality of Life.” He was appointed to three terms on the Los Angeles County Transportation Commission, where he served with the leading city and county leadership as the only non-elected member. He served as a visiting professor at the Conservatoire National des Arts et Metiers, a national university in Paris.
Photo: Mark Turner (Own work) [Public domain], via Wikimedia Commons
-
Leaving California? After slowing, the trend intensifies
Given its iconic hold on the American imagination, the idea that more Americans are leaving California than coming breaches our own sense of uniqueness and promise. Yet, even as the economy has recovered, notably in the Bay Area and in pockets along the coast, the latest U.S. Census Bureau estimates show that domestic migrants continue to leave the state more rapidly than they enter it.
First, the good news. People may be leaving California, but, overall, the rate of leaving is about three-quarters less than that experienced in the first decade of the millennium. In the core, booming San Francisco metropolitan area, there was even a shift toward net domestic migration after 2010, something rarely seen since the 1980s.
Outmigration dropped with the initial economic slowdown of the last recession, particularly as housing prices in some areas, notably the Inland Empire and the Sacramento area, drifted toward the national norm of three times incomes by 2010, having been twice that high or more in the boom times. The initial recovery after 2010 may also have encouraged people to stay as well.
Back to mounting outmigration
The San Francisco Bay Area lost more than 600,000 net domestic migrants between 2000 and 2009 before experiencing a five-year respite. Now, sadly, the story seems to be changing again. Housing prices, first in the Bay Area and later in other metropolitan areas, have surged mightily, and are now as high as over nine times household incomes. In 2016, some 26,000 more people left the Bay Area than arrived. San Francisco net migration went from a high of 16,000 positive in 2013 to 12,000 negative three years later.
Similar patterns have occurred across the state. Between 2010 and 2015, California had cut its average annual migration losses annually from 160,000 to 50,000, but that number surged last year to nearly 110,000. Losses in the Los Angeles-Orange County area have gone from 42,000 in 2011 to 88,000 this year. San Diego, where domestic migration turned positive in 2011 and 2012, is now losing around 8,000 net migrants annually.
The major exceptions to this trend can be found in the somewhat more affordable interior regions. Sacramento has gained net migration from barely 1,800 in 2011 to 12,000 last year. Even some still-struggling areas, like Modesto and Stockton, have seen some demographic resurgence as people move farther from the high-priced Bay Area.
Read the entire piece at The Orange County Register.
Joel Kotkin is executive editor of NewGeography.com. He is the Roger Hobbs Distinguished Fellow in Urban Studies at Chapman University and executive director of the Houston-based Center for Opportunity Urbanism. His newest book, The Human City: Urbanism for the rest of us, was published in April by Agate. He is also author of The New Class Conflict, The City: A Global History, and The Next Hundred Million: America in 2050. He lives in Orange County, CA.
Wendell Cox is principal of Demographia, an international public policy and demographics firm. He is a Senior Fellow of the Center for Opportunity Urbanism (US), Senior Fellow for Housing Affordability and Municipal Policy for the Frontier Centre for Public Policy (Canada), and a member of the Board of Advisors of the Center for Demographics and Policy at Chapman University (California). He is co-author of the “Demographia International Housing Affordability Survey” and author of “Demographia World Urban Areas” and “War on the Dream: How Anti-Sprawl Policy Threatens the Quality of Life.” He was appointed to three terms on the Los Angeles County Transportation Commission, where he served with the leading city and county leadership as the only non-elected member. He served as a visiting professor at the Conservatoire National des Arts et Metiers, a national university in Paris.
Photo: Marco Varisco, CC License
-
The 37 Megacities and Largest Cities: Demographia World Urban Areas: 2017
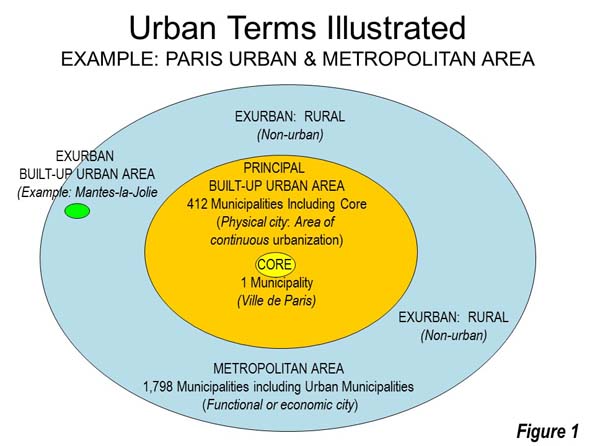
Many of the world’s biggest cities are getting bigger still. In 2017, the number of megacities — urban areas with better than ten million people — increased to 37 in 2017, as the Chennai urban area entered their ranks. Chennai becomes India’s fourth megacity, along with Delhi, Mumbai and Kolkota. These are among the major findings in the just released 13th annual edition of Demographia World Urban Areas, which provides population, land area and population density estimates for the 1,040 identified built-up urban areas (cities) in the world. Built-up urban areas are the physical form of the city, a definition which separates out the urban, or constructed form of the city from the rural and smaller town areas with which they form a metropolitan area or labor market (Figure 1).
The World’s Largest Cities
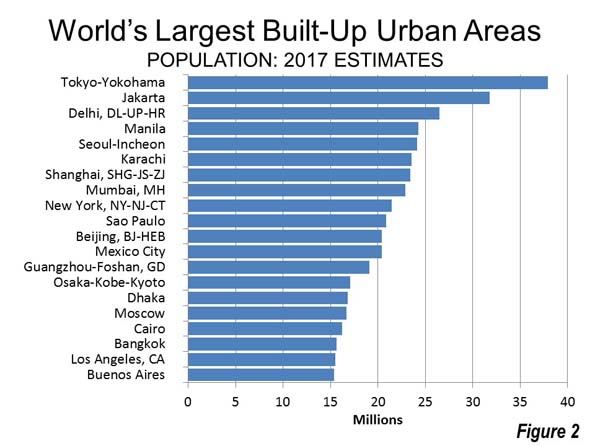
Asia increasingly dominates the ranks of the world’s most populous cities. Tokyo-Yokohama continues to be the largest urban area in the world (Figure 2), a ranking it has held for more than six decades. It is estimated the Tokyo Yokohama house a population of 37.9 million, living in approximately 3300 square miles (8,500 square kilometers) with a population density of 11,500 per square mile (4,400 per square kilometer).
Jakarta is the second largest urban area, with a population of 31.8 million 9,600 per square kilometer). Delhi, India’s capital held onto third position, with a population of 26.5 million. Delhi has now opened up a more than 3.5 million lead on 8th ranked Mumbai, which had been India’s largest urban area before and which some experts had considered likely to become the world’s largest city. This prediction, like a similar ones made with respect to Mexico City in the 1980s has not come to fruition and it seems unlikely that either urban area will ever be, the world’s largest.
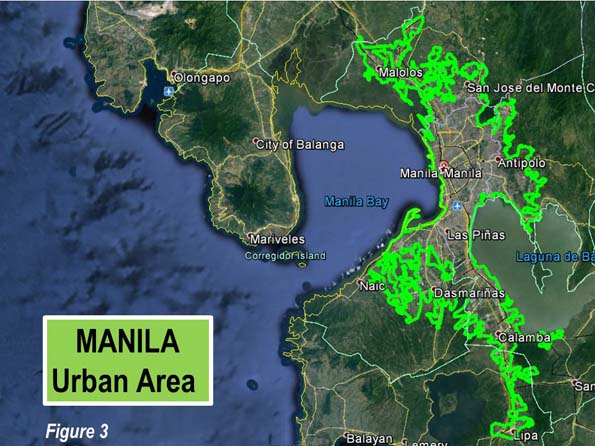
Manila moved up from fifth position to fourth position, passing Seoul-Incheon (Figure 3). Manila’s population is estimated at 24.3 million, in an area of 690 square miles (1,790 square kilometers) in a population density of 35,100 per square mile (13,600 per square kilometer), the highest density among the top five built-up urban areas.
Seoul-Incheon remains the only high income city, besides Tokyo, in the top five. Seoul-Incheon is estimated to have a population of 24.1 million and an urban population density of 22,700 per square mile (8800 per square kilometer).
The second five includes Karachi, Shanghai, Mumbai, New York and Sao Paulo, with only New York in the high income world. Thus, seven of the largest 10 cities in the world are now outside the high income world. New York was the largest city in the world from the 1920s until the mid-1950s. London, which was the largest city in the world from the early 19th century to the 1920s is now ranked 34th, while Beijing, which preceded London as largest ranks 11th. Among the next ten largest urban areas, only two — Osaka-Kobe-Kyoto, at 14th and Los Angeles, at 19th are in the high-income world. Formerly rapidly growing Los Angeles seems likely to drop out of the top 20 before long.
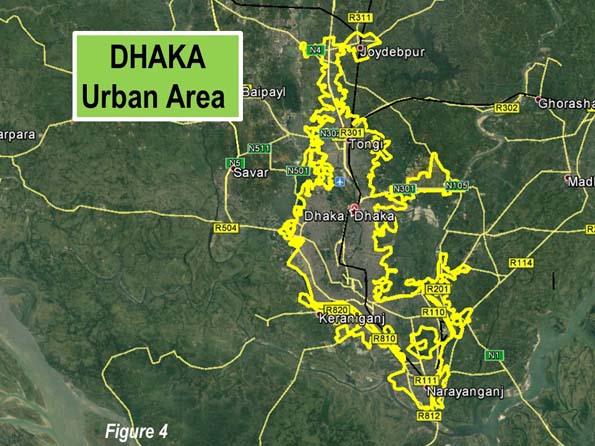
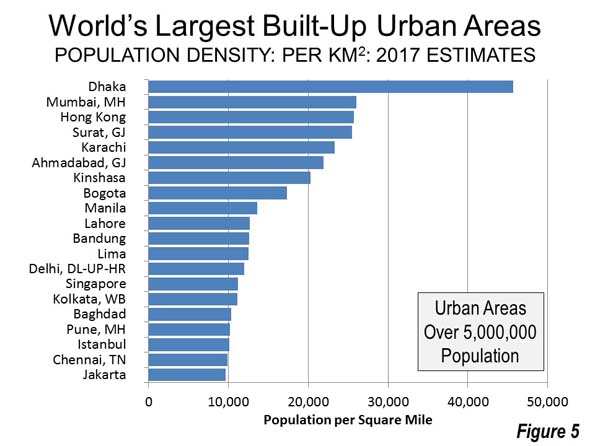
Dhaka’s High Density
Dhaka (Figure 4) remains far and away the highest density built-up urban area in the world (Figure 5), Dhaka has an urban density of 118,500 per square mile (45,700 per square kilometer). No other urban area exceeds 70,000 per square mile (27,000 per square kilometer). Yet, Dhaka is not dense enough for some critics, who perceive it to sprawl too much. Notably, Dhaka is about 50 percent denser than Mumbai or Hong Kong (the high income world’s densest city) and more than 30 times as dense as international densification model Portland, Oregon. Portland ranks 963rd in population density out of the 1040 built-up urban areas.
A Half Urban World?
In recent years, the population of the world has become majority urban for the first time. Yet, most people do not live in the largest urban areas. For example, only 15 percent of the urban population resides in the 37 megacities. The middle of the urban population distribution is at a population of approximately 680,000. People who live in urban areas such as Shizuoka (Japan), Mangalore (India), not to be confused with Bangalore, Qitaihe (China) and Allentown (United States) are the average. The population of the urban areas that are larger have half of the urban population, while the smaller includes the other half.
Distribution of the Population
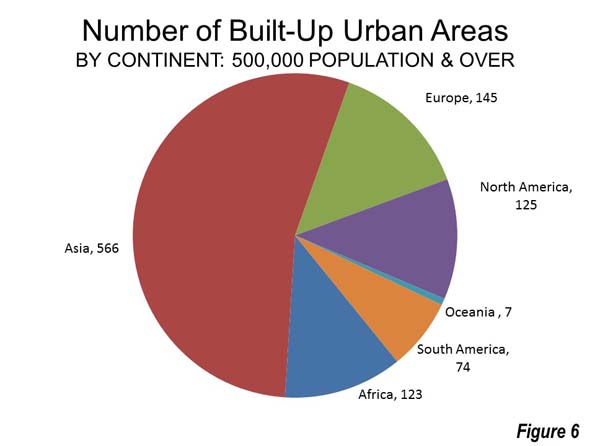
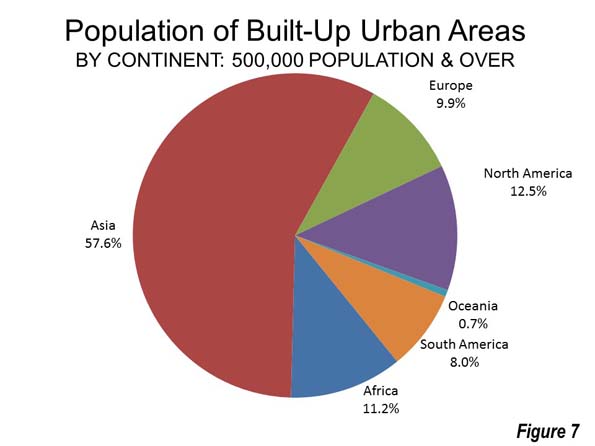
World urbanization is dominated by Asia, which has a majority (54 percent) of the built-up urban areas with at least 500,000 population. Asia’s dominance is even greater in population, with 58 percent of the residents in urban areas of 500,000 or more. North America has the second largest share of urban area population, at 12.5 percent, followed by Africa (11.2 percent) and Europe (9.9 percent). By contrast, Europe has the second largest number of urban areas of 500,000 population or more, reflecting the generally smaller population of its cities (Figures 6 and 7).
Concentration of Future Growth in Asia and Africa
The latest data underscores the substantial changes that have occurred in urbanization in recent decades. In 1950, 11 of the 20 largest cities were in the high income world, according to the United Nations. On average these cities had 5 million population. Today, only five of the 20 largest cities are in the high income world and their average population is 21.5 million.
In the decades to come, Asia seems likely to continue its dominance, while Africa will capture an increasing share of urban population growth. By 2050, the United Nations projects that approximately 1.2 billion residents will be added to Asian urban areas, while nearly 900 million will be added to the urban areas of Africa. This would leave only about 125 million, or five percent of total urban growth for the rest of the world. Of course, projections can be wrong, but the strength of current trends make these forecasts all the more credible.
Note: Demographia World Urban Areas uses base population figures, derived from official census and estimates data, to develop basic year population estimates within the confines of built-up urban areas. These figures are then adjusted to account for population change forecasts, principally from the United Nations or national statistics bureaus for a 2016 estimate.
Built-up urban areas are continuously built-up development that excludes rural lands. Built-Up urban areas are the city in its physical form, as opposed to metropolitan areas, which are the city in its economic or functional form. Metropolitan areas include rural areas and secondary built-up urban areas that are outside the primary built-up urban area. These concepts are illustrated in Figure 1 (above), which uses the Paris built-up urban area (unité urbaine) and metropolitan area ("aire urbaine") as an example.
Wendell Cox is principal of Demographia, an international public policy and demographics firm. He is a Senior Fellow of the Center for Opportunity Urbanism (US), Senior Fellow for Housing Affordability and Municipal Policy for the Frontier Centre for Public Policy (Canada), and a member of the Board of Advisors of the Center for Demographics and Policy at Chapman University (California). He is co-author of the “Demographia International Housing Affordability Survey” and author of “Demographia World Urban Areas” and “War on the Dream: How Anti-Sprawl Policy Threatens the Quality of Life.” He was appointed to three terms on the Los Angeles County Transportation Commission, where he served with the leading city and county leadership as the only non-elected member. He served as a visiting professor at the Conservatoire National des Arts et Metiers, a national university in Paris.
Photo: Cover of Demographia World Urban Areas: 13th Annual Edition.
-
Welcome to South Chicago
If you’ve been reading my stuff here long enough, you probably know that cringe when I hear people talk about Chicago’s South Side as a monolith, as code for black and poor. The truth is, there are many facets to the South Side. It is largely black, but not exclusively so; it is less wealthy than other parts of the city and region, but with pockets of wealth also. It has its very troubled spots, but it has places of promise. I’ve written about one part of the South Side here, and recently wrote about a nearby but very different part of the South Side too. With that in mind, I’m adding another entry into my “Welcome To” series. Today, I’ll talk about one of the oldest parts of the South Side, and indeed Chicago — the neighborhood of South Chicago.
Others in the “Welcome To” Series:
Welcome To Mount Greenwood
Welcome To Rosemont
Welcome To The South Side, JRW StyleSouth Chicago does indeed fit one image of the South Side: it is a classic late 19th/early 20th century industrial neighborhood, and that sense is captured in the image above. Virtually from its inception, steel production, port activities and rail transportation defined the community. Situated at the mouth of the Calumet River as it enters Lake Michigan, the neighborhood was well suited to produce manufactured goods and deliver them to the entire nation.
Had things gone a little differently, South Chicago could’ve been at the center of Chicagoland, rather than on the periphery. The Calumet is in fact a larger river than the Chicago River, closer to the centerpoint for today’s metropolitan area. There are historical reports that suggest that the early U.S. government nearly established Fort Dearborn where the river empties into Lake Michigan, but later opted for the less flood-prone area further north.
The swampy areas around South Chicago may have inhibited early development but never diminished its importance. Settlement of the area began in the 1830’s, and happened independently of Chicago’s settlement and growth, ten miles to the north. The Chicago Fire (1871), the establishment of the South Works steel mill (1880), annexation into Chicago (1889), the acquisition of South Works by U.S. Steel (1901), and the creation of the Calumet Harbor/Port of Chicago (1921) all served as catalysts for growth that started in South Chicago and spread to its surrounding communities.
South Chicago has a unique physical and demographic character derived from its growth independent of Chicago and relative isolation because of the surrounding swampy land. To the north, west and south of South Chicago, most residential and commercial development consists of structures built between about 1925-1955. But within South Chicago itself, you can find plenty of blocks that look like this:

92nd and Brandon, South Chicago or like this:

90th and Houston, South Chicago that have much more of the 1890’s/1900’s/1910’s-era construction that could be found in places much closer to the Loop, like Bucktown or Bridgeport. When driving into the area, it gives a sense of stepping back in time.
South Chicago’s commercial heart, the aptly named Commercial Avenue, also has the rather dusty appearance. Here’s the primary commercial intersection of 91st and Commercial (presumably scrubbed of all cars and pedestrians just for this Google Earth pic):

South Chicago is also served by a spur of the Metra Electric line that provides transit service to much of the South Side. The South Chicago branch begins (or ends, I guess, depending on your perspective) at 93rd and Baltimore, just east of the Commercial Avenue view you see above. The only electrified train line in Metra’s transit system, and the only one that does not share its tracks with freight lines, South Chicago has regular service that connects it to the Loop within 35 minutes.
I had the pleasure of working with the South Chicago Chamber of Commerce during my time with the City of Chicago about 25 years ago. It was then that I found out another unique characteristic of the community — a substantial and long-established Latino community, mostly Mexican, that’s been based in South Chicago for more than 100 years. Significant Mexican immigration to Chicago began around 1910, with immigrants drawn (or recruited) to the city to work in steel plants and packinghouses, and also pushed by the upheaval of the Mexican Revolution that began around the same time. Steel mill jobs were plentiful at the time, but so were worker strikes. Mexican workers were often cast as strike breakers, putting them at odds with recent European immigrants. By 1960 Latinos made up more than one-third of South Chicago’s population, even as it was less than ten percent citywide. Today, blacks are the largest racial/ethnic group in the community, but Latinos still make up nearly one-fourth of the population there.
Developers are trying to bring South Chicago into the 21st century by parlaying its lakefront location into new development. The former U.S. Steel South Works site, closed in 1992, is the single largest vacant site on the Chicago lakefront. A development team is working out the details of a purchase of the 430-acre site to build as many as 12,000 residential units and new retail on the site. This effort comes on the heels of a failed joint venture attempt by U.S. Steel and a developer that fell apart in 2004, and considerable infrastructure investment by the city into the area (remediation of the U.S. Steel site, an extension of Lake Shore Drive, and the creation and upgrade of lakefront parks).
I’m guessing that there will come a time when South Chicago sheds its industrial past and embraces its potential. A key lakefront location, with nearby parks and excellent transit options, and a funky, authentic building stock that might appeal to urban pioneers might mean that South Chicago could get discovered. We’ll see.
Pete Saunders is a Detroit native who has worked as a public and private sector urban planner in the Chicago area for more than twenty years. He is also the author of “The Corner Side Yard,” an urban planning blog that focuses on the redevelopment and revitalization of Rust Belt cities.
Lead photo: A freighter leaves Lake Michigan and enters the Calumet River Turning Basin in South Chicago, near 95th Street and Lake Shore Drive. Source: still from youtube.com
-
The other California: A flyover state within a state
California may never secede, or divide into different states, but it has effectively split into entities that could not be more different. On one side is the much-celebrated, post-industrial, coastal California, beneficiary of both the Tech Boom 2.0 and a relentlessly inflating property market. The other California, located in the state’s interior, is still tied to basic industries like homebuilding, manufacturing, energy and agriculture. It is populated largely by working- and middle-class people who, overall, earn roughly half that of those on the coast.
Over the past decade or two, interior California has lost virtually all influence, as Silicon Valley and Bay Area progressives have come to dominate both state politics and state policy. “We don’t have seats at the table,” laments Richard Chapman, president and CEO of the Kern Economic Development Corporation. “We are a flyover state within a state.”
Virtually all the polices now embraced by Sacramento — from water and energy regulations to the embrace of sanctuary status and a $15-an-hour minimum wage — come right out of San Francisco central casting. Little consideration is given to the needs of the interior, and little respect is given to their economies.
San Francisco, for example, recently decided to not pump oil from land owned by the city in Kern County, although one wonders what the new rich in that region use to fill the tanks of their BMWs. California’s “enlightened” green policies help boost energy prices 50 percent above those of neighboring states, which makes a bigger difference in the less temperate interior, where many face longer commutes than workers in more compact coastal areas.
The new Bantustans
Fresno, Bakersfield, Ontario and San Bernardino are rapidly becoming the Bantustans — the impoverished areas designed for Africans under the racist South African regime — in California’s geographic apartheid. Poverty rates in the Central Valley and Inland Empire reach over a third of the population, well above the share in the Bay Area. By some estimates, rural California counties suffer the highest unemployment rate in the country; six of the 10 metropolitan areas in the country with the highest percentage of jobless are located in the central and eastern parts of the state. The interior counties — from San Bernardino to Merced — also suffer the worst health conditions in the state.
This disparity has worsened in recent years. Until the 2008 housing crash, the interior counties served, as the Kern EDC’s Chapman puts it, as “an incubator for mobility.” These areas were places that Californians of modest means, and companies no longer able to afford coastal prices, could get a second shot.
But state policies, notably those tied to Gov. Jerry Brown’s climate jihad, suggests Inland Empire economist John Husing, have placed California “at war” with blue-collar industries like homebuilding, energy, agriculture and manufacturing. These kinds of jobs are critical for regions where almost half the workforce has a high school education or less.
Read the entire piece at The Orange County Register.
Joel Kotkin is executive editor of NewGeography.com. He is the Roger Hobbs Distinguished Fellow in Urban Studies at Chapman University and executive director of the Houston-based Center for Opportunity Urbanism. His newest book, The Human City: Urbanism for the rest of us, was published in April by Agate. He is also author of The New Class Conflict, The City: A Global History, and The Next Hundred Million: America in 2050. He lives in Orange County, CA.
Photo: Michael Patrick, CC License.
-
The End of the Asian Era
For the past 40 years, the Pacific Rim has been, if you will, California’s trump card. But now, in the age of President Donald Trump and decelerating globalization, the Asian ascendency may be changing in ways that could be beneficial to our state.
Rather than President Barack Obama’s famous “pivot to Asia,” it now might be more accurate to speak of Asians’ pivot to America. Once feared as a fierce competitor, East Asia is facing an end to its period of relentless growth, and now many interests appear to find that the United States offers a more secure, and potentially lucrative, alternative.
This era reflects profound changes in East Asia’s prospects. They increasingly are coping with many of the demographic, social and economic challenges that have bedeviled the West since the 1970s — competition from cheaper countries, technological obsolescence, a demoralized workforce and diminishing upward mobility. The verve of the late 20th century is being supplanted by the anxieties of the early 21st.
Demographic decline
Forty years ago, overpopulation constituted the big issue facing East Asia. Governments from Singapore to Korea and, most importantly, China, imposed anti-natalist policies, fearing that their economic success would be overcome by a tide of new citizens. Today, East Asia confronts the world’s most stagnant demography.
By 2030, according to the United Nations, Japan, still the world’s third-largest economy, will have more people over 80 than under 15, and, by 2050, it is expected to see its population fall by 15 percent. Many of the other Asian “tigers,” which followed Japan’s model, are saddled with a fertility rate so low that, over the next 35 years, they will join the island nation among the most elderly nations on earth.
East Asia’s demographic crisis will hit critical mass once China, the planet’s second-largest and most dynamic large economy, feels the full impact of its super-low fertility rate. By 2050, China’s population will have a demographic look like ultraold Japan’s today — but without the higher affluence levels of its Asian neighbor to pay for all of the retirees.
Technology and the challenge of Trumpism
The rise of the Pacific Rim was driven, in large part, by manufacturing growth. Following the model of Japan, Asian countries grew by keeping imports out and building enormous surpluses of manufactured goods. The resulting imbalances were accepted by American administrations even when exacerbated by mercantilist policies directed against our own producers.
The acceptance of such an arrangement ended in 2016 with the election of economic nationalist Donald Trump. But the new trade environment also includes the effective capture of the Democratic Party by elements close to Vermont’s Sen. Bernie Sanders, now America’s most popular politician. Sanders is fiercely skeptical on free trade, and his candidacy even forced Hillary Clinton, a long-time globalist, to back protectionist policies.
Trump’s proposals to match China’s import fees and to hector companies into keeping jobs in the United States represent a huge threat to the mercantilist Asian economic model. This, at a time when new automation technology, cheaper energy and rising wage rates also are persuading Asian producers to shift production to the United States.
Read the entire piece at The Orange County Register.
Joel Kotkin is executive editor of NewGeography.com. He is the Roger Hobbs Distinguished Fellow in Urban Studies at Chapman University and executive director of the Houston-based Center for Opportunity Urbanism. His newest book, The Human City: Urbanism for the rest of us, was published in April by Agate. He is also author of The New Class Conflict, The City: A Global History, and The Next Hundred Million: America in 2050. He lives in Orange County, CA.
Photo: Gage Skidmore from Peoria, AZ, United States of America (Donald Trump) [CC BY-SA 2.0], via Wikimedia Commons
-
What Do We Do With Shrinking Cities?
Shrinking Cities: Understanding Urban Decline in the United States
By Russell Weaver, Sharmistha Bagchi-Sen, Jason Knight, and Amy E. Frazier
Routledge (2017)Cities like Detroit, St. Louis, and Cleveland have lost stunning percentages of their peak population since 1950. Yet these are all in metro areas whose regional populations are much higher than in 1950, even if not at their all time peak high in all of them.
Some cities like Youngstown have gone so far as to try to plan for shrinkage and a permanently reduced population future. Detroit did something similar with its Detroit Future City plan, though that has subsequently been scrapped.
How do we think about shrinkage? How do we define a shrinking city? What should shrinking cities do? These are questions that have been swirling around for the decade I’ve been writing about cities here.
The new academic book Shrinking Cities aims to put some rigor around those questions. The first half of the book is devoted to an examination of shrinkage in the United States. The authors note that any measure designed to identify shrinking cities has a note of the arbitrary about it. The measure they select is population decline of 25% or more over the 40 year period from 1970 to 2010. They look at both census tracts and cities. Surprisingly, they find the shrinking census tracts are very widespread in America, and are on the rise in the Sun Belt. Shrinkage in terms of population loss is not a Rust Belt only phenomenon, though shrinking municipalities as a whole are concentrated in that region.
The authors look at economic decline separately, examining census tracts where there were increasing levels of concentrated disadvantage (which include include such measures as female headed household, unemployment rate, and low educational attainment as disadvantage indicators). Unsurprisingly, economic decline is more common and more severe in shrinking tracts, though there is not complete overlap. They find that social distress is more associated with economic decline whereas physical distress (e.g., vacant housing) is associated more with population decline.
After a presentation of the data, the book reviews various theories of what causes shrinkage and decline such as suburbanization. One that was particularly interesting was the social capital theory. Is low social capital associated with shrinkage and economic decline? It is. One of the indicators of social capital is homeownership. The book observes:
In other words, relative to tracts that shrank and did not decline, tracts that experienced coupled shrinkage and decline witnessed a substantial drop in homeownership rates that cannot be explained by chance alone. If homeownership is a useful indicator of social capital, then his result implies that social capital may have decreased in these shrinking-declining tracts as well. Thus, tracts that are able to keep their homeownership rates steady during population shrinkage may be more resistant to decline via social capital.
The second half of the book looks more at potential strategies for countering or adapting to change. These include various pro-growth policies, “rightsizing”, regional government, community development initiatives, etc. While some of these have had success in isolated cases, none of them have had systemic, replicable success. This makes for a bit of depressing reading. As one person told me about this aspect of the book, “Shrinking cities theory is at a dead end.”
Because of its academic nature, and high price tag, this book is not for everyone. But policy developers in shrinking areas should certainly ground themselves in this summary of shrinking cities research and academic theories found in it.
Aaron M. Renn is a senior fellow at the Manhattan Institute, a contributing editor of City Journal, and an economic development columnist for Governing magazine. He focuses on ways to help America’s cities thrive in an ever more complex, competitive, globalized, and diverse twenty-first century. During Renn’s 15-year career in management and technology consulting, he was a partner at Accenture and held several technology strategy roles and directed multimillion-dollar global technology implementations. He has contributed to The Guardian, Forbes.com, and numerous other publications. Renn holds a B.S. from Indiana University, where he coauthored an early social-networking platform in 1991.
Photo of Brush Park, Detroit by Stephen Harlan, CC BY-SA 2.0


.jpg)