Category: Demographics

  • A Leg Up: World’s Largest Cities No Longer Homes of Upward Mobility

    Throughout much of history, cities have served as incubators for upward mobility. A great city, wrote René Descartes in the 17th century, was “an inventory of the possible,” a place where people could lift their families out of poverty and create new futures. In his time, Amsterdam was that city, not just for ambitious Dutch peasants and artisans but for people from all over Europe. Today, many of the world’s largest cities, in both the developed and the developing world, are failing to serve this aspirational function.

    Though leading urban theorists love to celebrate the most rarified parts of the city economy—Saskia Sassen refers to “urban glamour zones” that thrive in what New York Mayor Michael Bloomberg proudly calls the “luxury city”—they tend to forget about working- and middle-class residents. Unfortunately, these urban ideas appear to be contagious, as they’re being applied to the expanding cities of Asia and other developing regions. A recent World Bank report argued that large urban concentrations—the denser, the better—are the most prodigious creators of opportunity and wealth. “To spread out economic growth,” the report claimed, is to discourage it.

    A closer look, however, suggests a more nuanced reality. Cities in the developing world are growing, but largely because they’re the only alternative to poverty and even starvation in the countryside. These cities are not only failing to provide opportunities for upward mobility; they’re producing the class inequalities found in “luxury cities” such as London and New York.

    Once rigidly egalitarian, China now has some of the world’s highest rates of income inequality. The central cores of Beijing and Shanghai employ legions of well-paid European and American architects and planners, but few concern themselves with the camps inhabited by poor, often temporary workers, who constitute roughly one-fifth of the population and live in conditions more reminiscent of a Brazilian favela than an “urban glamour zone.”

    This same stratification is also happening in India. Mumbai, one of the fastest-growing cities, is creating wealth at the top of the economic spectrum but leaving millions of others scrambling for mere subsistence. The New York–based author Suketu Mehta has described his hometown of Mumbai (formerly known as Bombay) as “an urban catastrophe,” an example of the mounting woes of rapidly expanding cities in the developing world. “Bombay is the future of urban civilization on the planet,” he wrote. “God help us.”

    A majority of Mumbai’s population now lives in slums, up from one-sixth in 1971—a statistic that reflects a lack of decent affordable housing, even for those gainfully employed. Congested, overcrowded, and polluted, Mumbai has become a difficult place to live. The life expectancy of a Mumbaikar is now seven years shorter than an average Indian’s, a remarkable statistic in a country still populated by poor villagers with little or no access to health care.

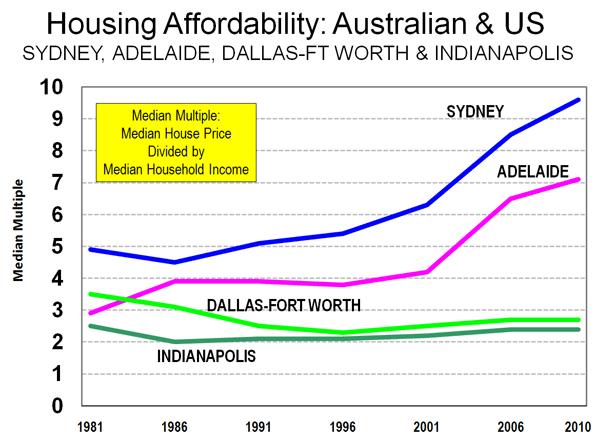
    In spite of World Bank proclamations, the most rapid urban growth in India is actually occurring in smaller, less dense cities, such as Bangalore and Ahmedabad, places with lower living costs and more business friendly governments. This mirrors a trend occurring in the United States. In the last decade, middle-income people have been moving out of our megacities. Between 2000 and 2008, according to the demographer Wendell Cox, regions of more than ten million people suffered a 10 percent rate of net domestic out-migration. (Often the only reason for population growth in these cities was immigration.) The big gainers were cities between 100,000 and 2.5 million residents: the business-friendly Texas cities Dallas, Houston, and San Antonio; Raleigh and Durham, North Carolina, which now form the fastest-growing metro area in the nation; and the heartland cities of Columbus, Indianapolis, Des Moines, Omaha, Sioux Falls, and Fargo.

    One reason for this movement has been the shift of jobs away from the coasts to lower-cost, less dense cities. The fastest growth in middle-income jobs has been concentrated in many of the places listed above: Houston, Dallas, Austin, Raleigh-Durham, and Salt Lake City. This pattern also includes high-tech, science-oriented employment. In contrast, those jobs have been stagnant or shrinking in such cities as New York, Los Angeles, San Francisco, and Chicago.

    As a result, America’s largest cities are increasingly divided into three classes: the affluent, the poor, and the nomadic class of young people who generally come to the city for a relatively brief period and then leave. New York, the aspirational city of my grandparents, now has the smallest share of middle-income families in the nation, according to a recent Brookings Institution study, with Los Angeles and San Francisco not far behind. In 1980 Manhattan, New York’s wealthiest borough, ranked 17th among U.S. counties for social inequality; by 2007 Bloomberg’s “luxury city” was first, with the top fifth earning 52 times the income of the lowest fifth, a disparity roughly comparable to that of Namibia.

    Similar patterns can be found in Europe, despite its countries’ more developed welfare states. The U.K. has witnessed a relentless centralization of urban functions in London, as once proud cities such as Manchester, Liverpool, Glasgow, and Birmingham have continued their long slide into obscurity and irrelevance. The bulk of London’s growth, however, has not taken place in the central core but in what the historian James Heartfield calls “the greater southeast.” This vast “conurbation” stretches from west of Heathrow Airport to the booming coastal city of Brighton, roughly an hour’s train ride from the“ city center.

    As the middle class has decamped, central London has become more stratified. Residents and workers there and in the West End account for some of the most concentrated wealth on the planet. At the same time, prospects for London’s middle class have weakened, with many fleeing to the suburbs or even leaving the country. (Britain remains a large exporter of educated workers to the rest of the world.) The major issue here is the high cost of housing. Even in its poorest neighborhoods, London now ranks as one of the most unaffordable places for middle-income people to buy a home.

    Still, life is much tougher for the city’s poor, many of whom live less than an hour’s walk from the wealthiest neighborhoods. Take a stroll just a mile or two from the Thames and you enter a very different London. It is here where you’ll see why the financial capital of the European Union also has the highest incidence of child poverty in Great Britain (more even than in the beleaguered North East). Thirty-six percent of children in London live in poverty, a figure that rises to more than one-half when the city’s housing costs are factored in.

    The same split has emerged in other countries considered far more open than class stratified Britain. A recent University of Toronto study found that between 1970 and 2001, the portion of middle-income neighborhoods in the city had dropped from two-thirds to one-third; poor districts had more than doubled to 40 percent. By 2020, middle-class neighborhoods could fall to less than 10 percent, with the balance made up of poor and affluent residents.

    Much the same can be seen in continental Europe, a trend greatly exacerbated by the growth of immigration. Unlike Amsterdam in Descartes’s time, Europe’s great cities are failing in their historic mission of incorporating newcomers, as German Chancellor Angela Merkel recently conceded. In Berlin, one fourth of the workforce earns less than 900 euros a month, while 36 percent of children are poor. The city once known as “Red Berlin” has emerged as “the capital of poverty and the ‘working poor’ in Germany,” Emma Bode, a left-wing journalist, wrote in 2008.

    Given these global realities, it might be time for our urban boosters to curb their enthusiasm for the “luxury city” and refocus on how to meet the aspirations of their middle- and working-class residents. If they don’t, lack of opportunity will drive more and more of this crucial aspirational class farther and farther away, mostly to smaller cities and suburbs that still offer “an inventory of the possible.”

    This piece originally appeared in Metropolis Magazine.

    Joel Kotkin is executive editor of NewGeography.com and is a distinguished presidential fellow in urban futures at Chapman University, and an adjunct fellow of the Legatum Institute in London. He is author of The City: A Global History. His newest book is The Next Hundred Million: America in 2050, released in February, 2010.

    Photo by Premshree Pillai

  • China Housing Market More Stable Than You May Think

    The sensationalist reporting of rising China tends to celebrate the country’s ascent. But there is one area where both economists and casual observers see a potential disaster: the real estate market.  Media reports of skyrocketing housing prices in first tier cities like Beijing and Shanghai and photo essays of Chinese ‘ghost cities’ inject sober skepticism into the otherwise bewildering reality of rapid growth.

    The claims about real estate, however, are as exaggerated as the breathless accounts of the country’s path towards world economic domination. It is absurd to argue that all it will take for China to fall would be a bust in the housing market. In reality, the country has too many economic fundamentals working for this one sector to wreak too much havoc.   

    Above everything, China remains a manufacturing powerhouse, providing the developed world with everything from children’s toys and athletic shoes to iPads and other electronic devices. Yes, the Great Recession did have a negative impact on China’s export business; this is why the Central Government took steps to direct massive amounts stimulus money towards infrastructure and real estate development.

    Far from being limited by exports, China is just beginning to unleash the power of its domestic consumer market. Imported goods (in reality, foreign brands, even if they are manufactured within China) are highly taxed, encouraging Chinese consumers to spend money on cheaper, local brands, thus keeping the money supply circulating through the domestic market.

    Yet this does leave China somewhat subject to real estate speculation. With   limited channels for investment, a risky domestic stock market, and little-to-no interest accrued by holding money in Chinese bank savings accounts, there is, for many individuals, nowhere else to spend their money but in the housing market.

    There are a few other forces at work here as well. Since the Chinese government still technically owns all of the land in the country, real estate developers are given the right to develop land based on a bidding process, with the rights going to the highest bidder. Auctioning of land for development typically happens at the municipal level. Once a developer is awarded the right to develop a piece of land, there is a time limit (usually no more than a few years) before it returns to the hands of the government.

    The purpose of this is two-fold: one is to manage the urban influx of new migrants and also to discourage land speculation by developers. As you can imagine, savvy developers often wait until the last minute to build a project to get the maximum profits from their projects.

    Since income taxes are low by international standards (and easily evaded through the preponderance of ‘grey money’ or hidden income) and property taxes are virtually nonexistent (up until recently at least), land auctioning is by far the largest source of income for local governments. This becomes the main way these governments fund infrastructure and public works projects.

    This same process is happening in cities across China. Why? Quite simply, the demand is there. The booming housing market is a revolution of sorts. This is really the reflection of the emergence of a true Chinese middle-class. The U.S. media, on the other hand, tends to remain focused on a massive China real estate bubble, perhaps as a projection of America’s own recent experience of real estate exuberance.

    Yet there are some major differences. For example, few Chinese purchase homes with little or no money down. Banks are not lending ‘creative mortgages’ such as ARMs to homebuyers. Government measures seek to discourage speculation.

    For instance, Chinese home buyers are limited to purchasing 2 homes and must put at least 30% down for the first home and 60% down for the second home. Investment by foreigners into the real estate market is strictly regulated in order to reduce the amount of ‘hot money’ coming into the country. Non-Chinese citizens are limited to purchase one home only and must hold onto it for 5 years before being allowed to resell it.

    Due to the massive size of China’s population, the majority of homes being purchased are flats in newly-built residential high-rise compounds. The size of these units might be a little too cozy for Americans or even Europeans, but to young Chinese homebuyers (of which most are first-time buyers), it represents an aspiration unimaginable only a few years ago.

    Take 26 year old Mei Li for example: late last year she, an administrative assistant at a construction company, and her husband, an IT professional, bought a home in the fast growing western district of Chengdu, between the 2nd and 3rd Ring Roads. The young couple put a 30% down payment on a 2-bedroom, 80 m² (860 ft²) flat on the 23rd floor of a tower that is part of a brand new residential development.

    At RMB 7,500/m², the total cost of their flat was RMB 600,000 (about $91,000 USD). As required, and with some help from their parents, Ms. Li and her husband put a down payment of 30%, or RMB 180,000, and qualified for a 30-year, 6% fixed-interest home loan from Bank of China. With a combined income ranging from about RMB 8,000-10,000 ($1,200 USD – $1,500 USD) per month, their monthly mortgage payment of RMB 2,500 ($380 USD) is easily manageable.

    Ms. Li and her husband are glad they got in when they did. Even though their new unit won’t be ready for move-in until the end of this year, they have already seen the value of their investment increase by 10%. Located adjacent to a planned stop for an underground metro line currently under construction, the value of their investment is bound to further increase due to its convenient access to public transportation. In the future, taking the subway will be just one of their transportation options as Ms. Li and her husband plan to buy their first car by the end of this year.

    Multiply Mei Li and her husband’s story by the millions and you have a better idea of what is really behind the China housing boom. To be sure, speculation certainly exists, but predominately it is middle-class aspiration that is fueling urbanization.

    In Chinese, the word for ‘family’ and ‘home’ are the same: jia (家). The family is the critical unit of Chinese culture, making ownership of a home a critical priority. For the world, middle-class home-ownership also promotes peace and stability in China, providing the basis for the evolution of a more consumer oriented, less predatory Chinese economy.

    Adam Nathaniel Mayer is an American architectural design professional currently living in China. In addition to his job designing buildings he writes the China Urban Development Blog.

  • America’s Biggest Brain Magnets

    For a decade now U.S. city planners have obsessively pursued college graduates, adopting policies to make their cities more like dense hot spots such as New York, to which the “brains” allegedly flock.

    But in the past 10 years “hip and cool” places like New York have suffered high levels of domestic outmigration. Some boosters rationalize this by saying the U.S. is undergoing a “bipolar migration”–an argument recently laid out by Derek Thompson in The Atlantic. On the one hand the smart “brains” head for cool, coastal cities like New York and Boston, while “families” and “feet”–a term that seems to apply to the less cognitively gifted–trudge to the the nation’s southern tier–a.k.a. the Sun Belt–for cheap prices and warm weather. “College graduates with bachelor’s degrees or higher,” Thompson notes, “have been moving to the coasts, like salmon swimming against the southwesterly current.”

    However, this analysis–no matter how widely accepted in the media–is grossly oversimplified, perhaps even misleading. Indeed, college graduates, for the most part, are heading not to the big cities on the coasts, but to smaller, less dense and quite often Sun Belt cities.

    To come up with our list of the country’s biggest brain magnets, we took the 52 largest metropolitan areas (all those over 1 million population) and ranked them by gains in people with college educations compared to the population over 25 years of age between 2007 and 2009, using the latest data from the American Community Survey provided by demographer Wendell Cox. It turns out that none of the top 10 gainers were large Northeastern cities, but largely Southern or Midwestern. New Orleans; Raleigh, N.C.; Austin, Texas; Nashville; Birmingham, Ala.; Kansas City, Mo.-Kan.; and Columbus, Ohio, all scored high marks. Only one California city, San Diego, made the top 10. Perennial “brain gainers” Denver, Colo., and Seattle round out the top 10.

    Among those metropolitan statistical areas with populations over 5 million, the best ranking went to the Philadelphia region (No. 12 overall), arguably the least glitzy and most affordable of the large northeast cities. The San Francisco metropolitan area, long a leader in its percentage of college-educated adults, held the next spot at No. 13. On the other hand, supposed “brain” magnets Boston and Chicago managed middling rankings, right behind Charlotte, N.C., and just ahead of San Antonio, Texas. Both fell well behind such overlooked “brain gain” areas as Jacksonville, Fla.; St. Louis, Mo.-Ill.; and Indianapolis. New York, the nation’s intellectual capital, ranked a mediocre 29th and Los Angeles an even worse 37th. To put in perspective, Nashville’s rate of college educated migration growth was 3.7%, compared with 1.4% for New York and a measly 0.7% for Los Angeles.

    Rather than following a clear path to the world of the “hip and cool,” college graduates appear influenced by a more nuanced and complex series of factors in terms of their location. New Orleans’ No. 1 ranking, for example, is likely product of the continuing recovery of its shrunken population, where the central city appears to be somewhat more attractive to professionals than before Katrina while the suburban populations have recovered more quickly from the disaster. The strong showing of Birmingham may likely be traced not to changes in the core city itself, but to the rapid growth in its surrounding suburban counties and the rapid expansion of the region’s medical complex.

    This reflects something not often mentioned: the spreading out of intelligence. Conventional theory suggests that the new generation of college graduates will go to the largest, densest places, eschewing, as The Wall Street Journal put it snidely, their parent’s McMansions for small abodes in the inner city. Yet the ACS numbers indicate that, overall, college migrants tend to choose less dense places. In the two years we covered, the growth rate in urban areas with lower urban area densities (2,500 per square mile) boasted a 5% increase in college-educated residents, compared with roughly 3.5% for areas twice as dense.

    This can be seen in the pattern of migration toward relatively low-density metropolitan areas like Nashville, Columbus, Raleigh or Kansas City as opposed to more packed regions like New York, Los Angeles or San Francisco. And wherever these college graduates migrate, they are at least as likely to settle outside the urban core. Another overlooked fact: Most places with the highest percentages of college-educated people are in suburbs. Only two of the 20 most-educated counties in the country are located in the urban core: New York (Manhattan) and San Francisco. Virtually all the rest are suburban.

    Another somewhat surprising statistic revolves around affordability and job growth. The college-educated, particularly in this tepid economy, are not immune to reality. They may want to go one place–for example, ever-alluring New York or sunny Los Angeles–but may soon find they can find neither a good job there nor an affordable place to live in order to stay there. Overall our analysis shows that many end up in places with lower housing prices. Areas with the highest price housing experienced college-educated growth at a rate only 60% of those with more affordable real estate. This is one thing that makes an Austin or Raleigh, even a Columbus or Kansas City, more attractive than a Boston, New York or Los Angeles

    Finally we have to consider employment trends. For the most part college graduates, like most folks, preferred cities with lower unemployment and more job growth. Some top gainers, such as Raleigh, Columbus and Kansas City, all boast lower than average unemployment and appear to be recovering from the recession. But this is not always the case: Some relatively poor performers on the job front, like Portland, Ore., and San Diego, have managed to maintain their appeal–for now.

    As the economy recovers these patterns are likely to accelerate, although they could also shift a bit as regions gain or lose employment momentum. Meanwhile, the best strategy for attracting graduates lies in creating jobs, as well as in offering both affordable housing and a range of housing options, including both reasonably priced urban and lower-density living. Generally speaking an area that is economically vital as well as physically or culturally appealing will do best. In the next decade advantages will also fall to family-friendly regions, particularly as the current crop of millennial-generation graduates starts entering en masse their family-forming years. These factors, more than hipness or dense urbanity, may well be more influential in determining which regions do best in the ongoing war for talent.

    —-

    No. 1: New Orleans-Metairie-Kenner, La.

    Grad Gain: 36,666

    Gain as a Share of Total 25+ 2007 Population: 5.42%

    New Orleans’ No. 1 ranking is likely due to former exiles returning after Hurricane Katrina. A recent report from the Census Bureau estimates that area’s population in the past decade has shrunk 29%. Recovery in the urban core has remained patchy, but suburban populations have recovered more quickly from the disaster.

    No. 2: Raleigh-Cary, N.C.

    Grad gain: 28,748

    Gain as a Share of Total 25+ 2007 Population: 4.27%

    Even in hard times Raleigh-Durham–the fastest-growing metro area in the country–has repeatedly performed well on Forbes’ list of the best cities for jobs. The area is a magnet for technology companies fleeing the more expensive, congested and highly regulated northeast corridor. Affordable housing and short commute times are no doubt highly attractive to millennials seeking to start a family. Indeed, a 2010 Portfolio.com/bizjournals survey ranked the city the third-best for young adults.

    No. 3: Austin-Round Rock, Texas

    Grad gain: 42,117

    Gain as a Share of Total 25+ 2007 Population: 4.23%

    Brains are flocking to Austin for good reason. Forbes ranked it the best large urban area for jobs in 2010. Along with Raleigh-Durham, Austin is emerging as the next Silicon Valley, luring lots of brains who would have previously headed toward the West Coast. Austin owes much both to its public-sector institutions (the state government and the main campus of the University of Texas) and its expanding ranks of private companies–including foreign ones–swarming into the city’s surrounding suburban belt. Its vibrant cultural scene certainly helps in attracting college-educated millennials.

    No. 4: Nashville-Davidson-Murfreesboro-Franklin, Tenn.

    Grad gain: 36,975

    Gain as a Share of Total 25+ 2007 Population: 3.68%

    A high quality of life, a vibrant cultural and music scene and a diverse population make Nashville a desirable place to live. Low housing costs drive down the cost of living, which is even lower than in other affordable cities like Raleigh, Austin or Indianapolis. Nashville is also home to a growing health care industry: More than 250 health care companies have operations in Nashville, and 56 are headquartered there.

    No. 5: Kansas City, Mo./Kan.

    Grad gain: 38,398

    Gain as a Share of Total 25+ 2007 Population: 2.96%

    The two-state Kansas City region boasts strong population growth and net in-migration– and for good reason. The city has one of the lowest costs of living, one of the highest personal-income growth rates and one of the healthiest real estate markets in the country. Short commute times also add to the attractiveness of the city for families. The city is the second-largest rail hub in the U.S. and is actively growing its life science and technology sectors.

    No. 6: Birmingham-Hoover, Ala.

    Grad gain: 21,111

    Gain as a Share of Total 25+ 2007 Population: 2.86%

    Birmingham’s strong showing on this list is likely due to the rapid growth in its surrounding suburban counties. One big development sure to lure brains: the rapid expansion of the University of Alabama’s medical center and surrounding private medical industry.

    No. 7: San Diego-Carlsbad-San Marcos, Calif.

    Grad gain: 51,151

    Gain as a Share of Total 25+ 2007 Population: 2.71%

    The only MSA from the "hip and cool" state of California to make the top 10, despite high levels of out-migration and a relatively poor performance in the job front. For now, at least, the area’s beautiful beaches and idyllic weather manage to attract plenty of college graduates, but it will need to get out of its slump in order to retain them.

    No. 8: Denver-Aurora-Broomfield, Colo.

    Grad gain: 43,853

    Gain as a Share of Total 25+ 2007 Population: 2.69%

    A perennial magnet for college graduates, and one of the "hip and cool" cities to make the top of our list, Denver was one of the darlings of the information age, and its suburbs have long incubated tech companies. Its technology sector is still strong, but higher prices and greater regulation have driven companies to regions like Austin and Raleigh, which are more business-friendly and cheaper.

    No. 9: Columbus, Ohio

    Grad gain: 29,515

    Gain as a Share of Total 25+ 2007 Population: 2.6%

    While the recession has taken a huge toll on the rest of Ohio, Columbus has been thriving, thanks to being home of the state capital, a booming startup culture and the largest college campus in the country–Ohio State University, a major employer and information center. Forbes named the Columbus metropolitan area–home to 1.8 million residents– one of America’s best housing markets, as well as one of the best places for businesses and careers. The city enjoys below-average unemployment and a strong tech presence that includes Battelle Memorial Institute, which oversees laboratories for several federal agencies.

    No. 10: Seattle-Tacoma-Bellevue, Wash.

    Grad gain: 53,869

    Gain as a Share of Total 25+ 2007 Population: 2.39%

    Seattle has long been one of the big winners in the brain battle as well. It has some of the country’s most important cutting-edge firms–Microsoft, Costco, Amazon, Starbucks–one of the country’s best arrays of urban and suburban neighborhoods. Housing is no longer cheap, but remains far less expensive than its main rival, the San Francisco Bay Area.

    —-

    Photo by Jeanette Runyon

    This piece originally appeared in Forbes.

    Joel Kotkin is executive editor of NewGeography.com and is a distinguished presidential fellow in urban futures at Chapman University, and an adjunct fellow of the Legatum Institute in London. He is author of The City: A Global History. His newest book is The Next Hundred Million: America in 2050, released in February, 2010.

  • Australia’s Housing Affordability “Outrage”

    There is mounting concern in Australia about the nature and extent of country’s housing affordability crisis. Expressions of distress are not limited to the middle income households who are locked out of the Great Australian Dream of home ownership. There is heightened interest from advocates of low income households and an opposition political party. Moreover, Australia’s overvalued housing is receiving renewed attention in international circles.

    Part of this attention is attributable to the 7th Annual Demographia International Housing Affordability Survey, which was released in late January. The Demographia Survey, which I co-author with Hugh Pavletich of Performance Urban Planning in Christchurch (New Zealand) covered 325 Metropolitan markets in seven nations (United States, United Kingdom, Canada, Australia, Ireland, New Zealand and Hong Kong, in China). The Survey assesses housing affordability using the United Nations and World Bank recommended measure of median house price divided by median household income (the Median Multiple). The data shows housing to be severely unaffordable in Australia, which was the most unaffordable nation included in the survey.

    In response, Michael Perusco of Melbourne’s Sacred Heart Mission and chairman of the Council to Homeless Persons called the affordability statistics "alarming.“ He added he was not surprised by the housing affordability data, noting the stress on the people he serves caused by inflated prices.

    Kirsten Moore recently reported in these pages on the statement by the Australian Green party. Senator Scott Ludlam, the party’s shadow minister (spokesperson) for housing called Australia’s housing affordability a "world-class outrage." He went on to say "When a family or an individual has to spend so much of their income on paying their mortgage, it has a seriously adverse affect on their education and training opportunities, on their investment opportunities and on their ability to pay for services like health care and child care."

    The real estate industry also expressed concern. David Airey, president of the Real Estate Industry Association of Australia issued a statement in response to the Demographia Survey, saying that: "for the majority of Australian families the difference between household income and loan payments is narrowing quickly."

    Various measures indicate that households with mortgage payments equaling 30 to 35 percent or more of their gross annual income on mortgage suffer from “mortgage stress." Mortgage stress has been spreading around Australia like invasive species. Last year’s Demographia Survey showed that the median income household in Sydney would pay 57 percent of its income for a mortgage if it bought a median priced house in the current market. In Adelaide, the figure would have been 47 percent. Over the last year things have only gotten worse.

    This is not merely a response to growth, or economic vitality. The median income household in the vibrant Dallas-Fort Worth region, for example, (larger than Sydney) would pay approximately 17 percent of their incomes for a mortgage on the median priced house. This is despite the fact that population growth and the demand for housing has been much greater in Dallas-Fort Worth than in Sydney (Figure 1).


    In Indianapolis, similarly sized to Adelaide and growing faster, the median income household would pay 14 percent of their income for a mortgage on the median priced house. House prices have risen more than 130 percent relative to incomes over the last three decades in Australia’s major metropolitan areas (Figure 2). By comparison, the increase has been only one-eighth as much (16 percent) in the United States.

    The extent of the house price increases is starkly illustrated by comparing the value of the own housing stock to the gross domestic products of Australia and the United States since 1988 (the first year for which Australian house value data is readily available).

    According to data from the United States Federal Reserve Board, the value of the US stock of owned housing in 2010 was approximately the same in relation to the Gross Domestic Product as it was in 1990. On the other hand data from the Reserve Bank of Australia indicates that the value of the own housing stock in Australia was 85 percent higher relative to the Gross Domestic Product than in 1990. Thus, the value of the owned housing stock in Australia is today at least $1.9 trillion greater than it would have been if the 1990 ratio had been retained (Figure 3).

    Of course, part, although far from all of the United States experienced a severe housing bubble that burst in 2007. Even so, the increase in gross house values relative to the gross domestic product in the United States  never approached the massive increase in valuation that has occurred in Australia.

    The Green Party statement rightly blamed "Government’s actions that provide incentives designed to benefit investors and speculators and to keep house prices going up." The price rises have been principally the result of state government policies banning most development on the urban fringe and created a severe shortage of competitively priced land for development. It is an established economic fact of life that, all things being equal, the prices of goods and services tend to rise where there are serious limitations on supply, whether land, petroleum or bananas (as in the case of Typhoon Larry in Queensland in 2006).

    The effects of such policies is to telegraph to investors both in Australia and around the world the potential for speculative gain in a housing market.   The biggest losers come largely from the ranks of younger middle income Australians, including many immigrants, who would like to own their own homes. It is astounding that in egalitarian Australia, which has an enviable historic record of concern for lower and middle income households, is being transformed into a country where   inheritance or access to foreign capital will be a prerequisite for home ownership for middle income people.   

    The Organization for Economic Cooperation and Development (OECD) has raised concerns about the role of restrictive land use regulations in Australia (as well as the United Kingdom, which is also covered in the Demographia Survey).  OECD has recommended that Australia ease land supply constraints by streamlining planning and zoning regulations.

    The experience of Australia, along with a number of other markets covered in the Demographia Survey demonstrates that severe restrictions on the supply of land for development remain fundamentally incompatible with both housing affordability and the aspirations of lower and middle income citizens.

    Photograph: New "detached" housing in Perth (by author).

    Wendell Cox is a Visiting Professor, Conservatoire National des Arts et Metiers, Paris and the author of “War on the Dream: How Anti-Sprawl Policy Threatens the Quality of Life

  • A New Tribe for New Geographies: Reasonable People of Goodwill

    I am Singaporean, with a half-Indian, half-Eurasian father; a half-Pakistani, half-Malay mother. Dad converted to Islam from Roman Catholicism; each year my brothers and I celebrate Eid ful Fitr, Eid ul Adha and Christmas with different parts of our family. Cousins, aunts and uncles have married outside their ethnicity and faith – to Chinese Christians and Indian Hindus – so the Lunar New Year and Deepavali, the South Indian “Festival of Lights”, are also bustling times.

    This interstitial existence, both within and among different ethnic, religious and linguistic communities, has given me more than my fair share of diversity-related stories. Once, I ordered drinks from an Indian stall owner at Newton Circus, a popular food centre in Singapore. I asked in Malay for “tek dua, bandung satu” [two teas and one bandung, a local drink mixing syrup and condensed milk]. The stall owner replied in Tamil. When I said I didn’t speak it, he asked: “Apa macam punya Mama, tak tahu cakap …” [What kind of Indian cannot speak Tamil?], with a look of total disdain. The expectation that people of Indian ethnicity in Singapore speak Tamil is common, given that most Singaporean Indians are Tamil.

    On another occasion, I was the Master of Ceremonies at an awards ceremony and was faced with the challenge of pronouncing the sometimes complex names of Tamil recipients. Thankfully, a very patient staff member was willing to walk me through the intricacies of what, in a poem I later wrote about the experience, I described as “rolling l’s and lolling r’s”.

    We often hear exhortations to find “unity in diversity”, to manage our differences so they do not become sources of conflict. This is particularly critical in modern cities like multi-religious, multi-ethnic Singapore, which increasingly attract a globally cosmopolitan class of multiple backgrounds, heritages and cultures, all densely-packed into an area slightly smaller than New York City.  

    My personal history has often prompted me to wonder how such diversity can be more than managed, but also celebrated and optimized. I suggest some tentative thoughts on three principles that can help individuals and urban societies navigate their respective diversities, encapsulated in the idea that we must all strive to form a new sort of tribe, comprising “reasonable persons of goodwill”.

    Reason and Rationality

    To succeed, diverse societies, need to be peopled by reasonable individuals who apply logic and vigorous scientific thinking rather than isms and ologies which, unfettered, can precipitate conflict. My family background has made me instinctively aware of this idea since as a child, I knew but could not always articulate how they were at the same time both similar and distinct from my brothers and me.

    I first encountered the idea of a reasonable person when, as a first-year undergraduate at Oxford, I listened to Amartya Sen deliver a lecture about the need to apply “Reason before Identity” in making assessments and decisions – similar to what the philosopher Rene Descartes called shining “the natural light of Reason” to situations.

    I’ve realised now that being reasonable provides three critical insights. First, each of us, while individual, is also plural, with many interacting identities.

    This may seem counterintuitive, given that the term “diversity” is usually applied to mark particular groups from others. Such conceptions of “Us vs Them” can be based on a range of markers: gender, ethnicity, race, religion, language, nation, professional affiliation, tribe, educational background, among others.

    However, a less frequently used, but equally resonant, definition of diversity applies within individuals – those like me, with mixed parentage and “hyphenated identities”, or who balance the different aspects of their professional, personal and other identities in a dynamic equilibrium.

    Second, an individual’s different identities matter more or less at different times.

    Being at work underscores my professional affiliations as a civil servant; going to the mosque on Fridays is a spiritual experience; visiting my paternal grandmother for Christmas is about spending time with family. I recall dressing up as Santa Claus in 2009, because many of my younger nieces and nephews were old enough to appreciate getting presents on Christmas Eve. Was it ironic that a Muslim adopted the garb of a traditional Christmas icon? Perhaps, but it made perfect sense in my head after I reasoned that this was in the spirit of fun, festivity and family.

    Identities, like our ethnicity or faith, define us in profound ways, but   their salience varies with situations. Even as our identities interact, Reason helps us keep them conceptually distinct. A similar argument is made in Amartya Sen’s Identity and Violence (2006); its telling subtitle suggests that primordial identities like race and religion create “The Illusion of Destiny”, whereas logic tells us that no part of our identity should be tyrannical over all others, no matter how resonant and powerful it may be.

    Third, Reason helps us realise that each aspect of our multiple identities generates connections between us and many, if not all, other people.

    I feel this particularly strongly when interacting with family on my father’s side. Growing up, my paternal grandmother told me stories from the Old Testament, emphasizing how both the Christian and Muslim segments of our family  celebrate the lives of Abraham, Moses, David and Jesus. Recently, when one of Dad’s Catholic aunts passed away, I was reminded of a further similarity, in different faiths’ prayers for the dead. Muslims, many Christians and some of the Hindus in our family hold prayers on the first three days after a funeral, then on the seventh, 40th and 100th days. There is a lattice of shared cultural links between groups of ostensibly different backgrounds, even if our rituals differ.

    The Importance of Persons

    Applied alone, Reason can come across as cold and clinical. It is therefore useful to temper it by recognising and valuing the person-hood in each individual. This is critical in making us “reasonable persons”, rather than mere automatons applying a Reason-imitating algorithm.

    Belief in person-hood is not a new idea. Across a range of belief systems, we find an emphasis on the core of humanity, resident in any individual.  The liberal humanist tradition is one source of this approach, but it can also be justified spiritually in the belief that there is an element of the divine in all of us, like the Christian idea of being made “in the image of God” or the Muslim concept of each person occupying a special position in Creation as God’s vicegerent on Earth.

    Belief in individual person-hood is a prerequisite for meaningful reciprocity among people, where one obeys the Golden Rule and “does unto others”. I find an emphasis on person-hood a wonderful antidote to simplistic thinking about people who are ostensibly “different” from us. It would be easy to see some of my non-Indian friends as utterly distinct, or some of my non-Muslim family as irrevocably different. But once I start remembering that they are each unique individuals, not just abstract “Others”, it is easier to embrace fully the many connections we share.

    Goodwill and Good Will

    Goodwill is also critical for moving beyond toleration to celebrating diversity.  Generally, people reluctantly put up with differences.  Goodwill allows us a richer appreciation of those distinctions. There are different conceptions of such an expanded diversity – America’s “melting pot”, from which the many become one; or the non-assimilationist ‘unity in diversity’ of Singapore and other countries. All rely on a fundamental bedrock of goodwill among peoples, with three important consequences.

    First, we learn together what we cannot know alone. This was brought home to me very powerfully, when one participant at a conference asked a Hindu if he worshipped “one or many Gods”. The answer was zen-like in its simple complexity: it does not matter whether is one or are many Gods. What matters is that there is “Only God”. This reminded me that human ideas often pale in comparison to life’s larger truths. Sometimes, deeper understanding of our own beliefs can be suggested by traditions outside our own.

    Second, goodwill reminds us to give others the benefit of the doubt.  Others have obligations not to cause offence in speech and action, but each of us also has the prerogative not to take offence. After all, offensive remarks often stem from ignorance rather than malice. We can reply to such ignorance with   information, rather than indignation. Like all ethnic and religious minorities, I have experienced a fair number of awkward situations – being served pork, or invited to drink alcohol, or to eat during daytime during the fasting month of Ramadhan. Not taking take offence is not always easy, but does serve to maintain friendships and creates sometimes risible memories.

    The third benefit of goodwill lies in helping build   trust and accommodating differences. Land-scarce Singapore has a quaint practice where the street-level floors of the apartments provided by our Housing and Development Board (HDB) – called void decks – can be leased by residents. They are frequently used for Malay weddings and Chinese funerals – and uncomfortable double-bookings do arise. Often, these have been defused with a little reasoned give-and-take.

    Balancing Ideals & Pragmatism

    Being reasonable persons of goodwill helps us navigate the choppy and sometimes uncharted waters of diversity. But Reason is neither uniformly nor universally distributed in most societies, so it must be carefully nurtured through education and exposure, rather than left to chance. Even where it is widespread, Reason also has limits, at which points powerful emotions start to come into play.

    Rising above these challenges requires not just vision, but healthy realism. Rather than a final destination, it is better to view the navigation of diversity as a journey – where we are all, in the words of a friend who is a Catholic priest, “fellow pilgrims” and part of a tribe with common values, even if we don’t all wear the same outer markings.

    Aaron Maniam is a Singaporean Muslim from a large and diverse family. He volunteers with Singapore’s National Youth Council and groups of young leaders in Singapore’s Muslim and Indian communities. He was identified by the Asia Society as an Asia 21 Young Leader in 2006 and a “Next Generation Policy Leader” in 2010.

    Photo by AndyLeo@Photography

  • Orange County Vantage Point: One Eye on Egypt as Little Saigon Rebrands Tet

    Scenes from Egypt, Tunisia and other places in the Middle East provide a stark reminder of the chaos that can consume entire nations. The scene on Bolsa Avenue in Little Saigon last week offered evidence that chaos can be overcome.

    Don’t get me wrong—chaos had a place along Bolsa as streams of drivers sought rare parking spaces, crowds gathered around impromptu fireworks displays on the streets, and shoppers elbowed their way among dozens of flower merchants who set up shop in parking lots.

    The buzz came in advance of Tet, the Vietnamese New Year celebration. Flowers are a big part of the tradition, and peddlers offered their best orchids and other selections.
    Restaurants and ad hoc vendors of various goods also aimed for some business, with everything from silk fabrics to baked goods on sale.

    The jumble of commerce, tradition and celebration that made parking so hard in Little Saigon was a relatively nice sort of problem for all involved. It was certainly nicer than the American experience in the Vietnam War, which ended in utter chaos.

    Many historians say the end started with the Tet Offensive in 1968. Vietcong forces picked the New Year holiday to unleash a campaign of attacks that sowed chaos throughout South Vietnam.

    The Tet Offensive failed to score any military victories by standard measures. Yet it succeeded in fostering a perception of chaos that struck a significant blow against the South Vietnamese government, which stumbled along with U.S. aid for another seven years.

    The chaos that started with the Tet Offensive and ended with crammed refugee boats fleeing Vietnam also led to the creation of Little Saigon. It’s a sprawling district that takes in parts of five cities in Orange County, just south of Los Angeles.

    Little Saigon is now home to the largest concentration of ethnic Vietnamese outside of Vietnam itself. It’s where refugees staked a claim to something more than—better than—the chaos they faced as their native country crumbled.

    What better place to rebrand Tet by reclaiming the celebratory sense of a new year and laying to rest darker images tied to yesteryear’s misfortunes? There are no doubt many who continue think of the Vietnam War when they hear the word Tet.

    Little Saigon’s recent hustle and bustle built around flower peddlers indicates another view, though. It shows that many others have remembered that the holiday existed before war and survived combat. They do not ignore history by considering Tet’s traditional meaning. They allow room for a larger view and an eye on the future.

    Jim Schlusemeyer, owner of Tuyet’s Orchid, is a good example. He sells his flowers to retailers and the general public, working the weekly swap meet at the Orange County Fairgrounds in Costa Mesa.

    Schlusemeyer was born in Vietnam and came here as a refugee, eventually taking the last name of his stepfather. He’s a competitive businessman who needs unique product, so he breeds his own orchids. Land in Orange County is either too expensive to make commercial flower growing worthwhile or too far inland to provide the cooler atmosphere that orchids require. So he breeds small lots of hybrids here and leases space at growing operations in Northern California for commercial production.

    Schlusemeyer enjoyed the big crowd in Little Saigon in the days leading up to Tet. His business has taken hits along with most others the past few years. The holiday and its call for flowers is a nice spike.

    Schlusemeyer says Tet sales get helped along each year by growing numbers of whites and Latinos who come to Little Saigon. Word has gotten around that the Tet holiday brings out the best orchids. There still aren’t a lot of shoppers from outside the local Vietnamese community, but the numbers are rising and appreciated.

    Not bad for a holiday that bears a name once firmly associated with one of the most frustrating and fractious periods in American history.

    Rather impressive for a community of refugees who only recently carved a new life for themselves as Americans.

    Any doubts about the rebranding of Tet were answered by a small booth set up amid the flower peddlers on Bolsa. It was sponsored by Sam’s Club—a division of retail giant Wal-Mart Stores Inc. A salesperson pitched the crowd on home improvements looking to sell everything from patio covers to vinyl fencing.

    You’d be hard-pressed to come up with a better example of putting the hyphen in Vietnamese-American. Keep those hyphens handy considering events in the Middle East. There’s a neighborhood known as Little Arabia just a few miles away from Little Saigon.

    Jerry Sullivan is a contributing editor to New Geography and managing editor of the Orange County Business Journal.

  • The Midwest: Coming Back?

    Oh my name it is nothing
    My age it is less
    The country I come from
    Is called the Midwest

    –Bob Dylan, “With God on Our Side,” 1964

    For nearly a half century since the Minnesota-raised Robert Zimmerman wrote those lines, the American Midwest has widely been seen as a “loser” region–a place from which talented people have fled for better opportunities. Those Midwesterners seeking greater, glitzier futures historically have headed to the great coastal cities of Miami, New York, San Diego or Seattle, leaving behind the flat expanses of the nation’s mid-section for the slower-witted, or at least less imaginative.

    Today that reality may be shifting. While some parts of the heartland, particularly around Detroit, remain deeply troubled, the Midwest boasts some of the lowest unemployment rates in the country, luring back its native sons and daughters while attracting new residents from all over the country.

    For example, Des Moines, Omaha, Kansas City, Columbus, Minneapolis, Milwaukee and Madison have all kept their unemployment rates lower than the national average, according to a recent Brookings survey. They are also among the regions that have been able to cut their jobless rates the most over the past three years.

    This contrasts sharply with the travails of the metropolitan economies of the Southeast, Nevada, Arizona and California. Of course, other regions are doing better than the Sun Belt sad sacks. The stimulus and TARP benefited some parts of the Northeast, but even those areas haven’t performed as well as the nation’s mid-section. The only other arc of prosperity has grown around the Washington leviathan, largely a product of an expanded government paid for by the rest of the country.

    In contrast, the relative prosperity in parts of the Midwest largely stems from the private sector. Take the rise in the price for agricultural commodities, global energy demand, greater home affordability and a  slow but perceptible pickup in domestic manufacturing. According to University of Iowa researcher Jacob Langenfeld, these factors suggest that it’s time to stop seeing the Heartland as a perennial loser and to start seeing it as a “[model] for effective economic development.”

    The new reality is reflected in several ways.  In terms of personal-income growth last decade, several Midwest regions ranked  among the top ten in the U.S., including Milwaukee, Cleveland, Kansas City and Cincinnati.

    These cities all performed better than Seattle, Denver or Portland. San Jose and San Francisco, those perennial darlings of the information age,  sat around the bottom of the list. The mid-section also boasts many of the nation’s healthiest real estate markets, according to Realtor.com. Three of the top five markets–Kansas City, Kansas, Omaha and Fargo–are located in the region

    An analysis of shifting migration patterns provides even more intriguing evidence. Over the past century the Midwest’s share of the nation’s population fell from nearly 35% of the total to barely 21%. Only the Northeast, now less than a fifth of the population, has experienced a similar decline, while the West and South have registered impressive gains.

    Now some of the very regions that experienced losses over the past few decades, such as St. Louis, suffer much lower rates of out-migration than a similarly sized area like San Diego. Others, such as Indianapolis, Columbus, Madison and Kansas City, have enjoyed strong rates of domestic migration. In sharp contrast, coastal giants like metropolitan Los Angeles or New York have worse domestic out-migration rates than Detroit.

    The outcome of the recent midterm elections means that political changes may further propel the Midwest express. The new Congress is largely dominated by representatives of the heartland such as Speaker John Boehner of Ohio and Budget Committee Chairman Paul Ryan of Wisconsin. This marks a powerful shift from the previous Congress, controlled by iron-fisted coastal Democrats like former Speaker Nancy Pelosi of San Francisco.

    We can expect the new Congress to adhere more closely to Midwestern interests on a host of issues. Energy legislation will now reflect the interests of Midwestern states, which depend heavily on coal, rather than the renewable dreams of the coastal big cities. In transportation we may see a shift in priorities from high-speed rail to such mundane things as roads and bridges.

    More important still may be changes at the local level. For decades Midwestern governors and mayors tried to emulate the Northeast and West Coast. Historian John Teaford observed that the struggling Midwestern cities in the 1960s and 1970 employed “cookie cutter” redevelopment in a vain effort to replicate the great coastal cities. Ultimately the building of “international style” towers, sports stadia and cultural palaces did little to restore places whose economies had become increasingly uncompetitive.

    In recent years, the most risible example of coastal aping could be found in Michigan, the nation’s most economically ravaged state. Under Gov. Jennifer Granholm Michigan focused on a strategy of promoting “cool cities” to lure the young entrepreneurial hipsters away from the coasts. Like California, Michigan placed huge bets on renewable fuels and other green industries.

    By the end of Granholm’s term this winter the state suffered one the country’s highest unemployment rates, a falling population and epic out-migration. She has been replaced by a pragmatic pro-business conservative, Rick Snyder, who is focused on a practical economic-development agenda. Similar shifts have taken place in Ohio and Wisconsin.

    The new brand of Midwestern realism has been embraced for years by some regions. For example, non-partisan business and civic leaders in Kalamazoo, Mich., have pushed both educational reform and economic diversification. The region, though hardly booming, has done better than the state overall and is experiencing an entrepreneurial and community renaissance.

    Kalamazoo entrepreneurs tend to understand that the key to Midwestern renewal lies with the region’s core competencies and attractions. David Zimmermann, founder of Kalexsyn, a flourishing biotech company, identifies these assets:  Michigan’s resident pool of skilled labor, a low cost of living and a generally community-oriented, family-friendly atmosphere.

    Zimmermann says his company, which now employs 30 workers and has revenues of $5.4 million, has surprisingly little trouble attracting younger skilled workers. The median age at the company, he notes, is only 36, and many have come to Kalamazoo from traditional coastal biotech hot spots. This includes several researchers some who originally left the Midwest in their teens and twenties.

    “People are looking at the Midwest and crunching the numbers,” Zimmermann says. “Maybe you take a 20% pay cut from San Francisco but you buy a nice house for $200,000. You come out way ahead. We think this a very strong advantage.”

    Such a newfound appreciation for the Midwest represents a critical element in expanding the region’s turnaround. With enhanced power in Washington and more common sense government at home, the Midwest could be poised to regain a competitive advantage that has been missing for several generations.

    This piece originally appeared in Forbes.

    Joel Kotkin is executive editor of NewGeography.com and is a distinguished presidential fellow in urban futures at Chapman University, and an adjunct fellow of the Legatum Institute in London. He is author of The City: A Global History. His newest book is The Next Hundred Million: America in 2050, released in February, 2010.

    Photo by Paladin27

  • Regional Exchange Rates: The Cost of Living in US Metropolitan Areas

    International travelers and expatriates have long known that currency exchange rates are not reliable indicators of purchasing power. For example, a traveler to France or Germany will notice that the dollar equivalent in Euros cannot buy as much as at home. Conversely, the traveler to China will note that the dollar equivalent in Yuan will buy more.

    Economists have attempted to solve this problem by developing "purchasing power parities," which are used to estimate currency conversion rates that equalize values based upon prices (Note 1). This helps establish the real value of money in a particular place.

    When people move from one region of the United States to another they can encounter a similar phenomenon. For example, a dollar is not worth as much in San Jose as it is in St. Louis. Research by the US Department of Commerce Bureau of Economic Analysis (BEA), for example, found that in 2006 a dollar purchased roughly 35 cents less in San Jose than in St. Louis. BEA researchers estimated "regional price parities" for states and the District of Columbia and for all of the nation’s metropolitan areas (Note 2). Regional price parities can be thought of as the equivalent of regional (state or metropolitan area) exchange rates. This research was covered in previous newgeography.com articles by Eamon Moynihan and this author.

    This article uses Department of Labor, Bureau of Labor Statistics metropolitan area consumer price indexes to estimate the 2009 cost of living and per capita personal income adjusted for the cost of living.

    Cost of Living: At the regional level (See Census Region Map, Figure 1), there are substantial differences in the cost of living (Figure 2). The lowest cost of living is in the Midwest, at 4.8 percent below the nation. The South has the second lowest cost of living at 3.9 percent above the national level. The West is the most expensive area, 13.5 percent above the national cost-of-living, while the Northeast’s cost-of-living stands 11.3 percent above the national rate.

    The cost of living in the South may seem higher than expected. But if the higher cost metropolitan areas of Washington, Baltimore and Miami are excluded, the cost of living in the South falls to 1.5 percent below the national rate. If the California metropolitan areas are excluded from the West, the cost of living still remains 4.0 percent above the national rate.

    Per Capita Income: The highest unadjusted per capita incomes are in the Northeast, followed by the West, the South and the Midwest. Yet when metropolitan area exchange rates are taken into consideration, the order changes significantly. The Northeast remains the most affluent, and the Midwest moves from last place to second place. The South is in third place, the same as its income rating, while the West falls from second place to fourth place (Figure 3).

    Cost of Living: Variations in the cost of living, which is reflected by the metropolitan area exchange rates, remains similar in 2009 to the 2006 rankings.

    The Top Ten: The lowest costs of living were in (Table 1):

    1. St. Louis, where $0.891 purchased $1.00 in value at the national average.
    2. Kansas City, where $0.903 purchased $1.00 in value at the national average.
    3. Cleveland, where $0.921 purchased $1.00 in value at the national average.
    4. Pittsburgh, where $0.941 purchased $1.00 in value at the national average.
    5. Cincinnati, where $0.944 purchased $1.00 in value at the national average.

    Rounding out the most affordable 10 are two metropolitan areas in the South (Atlanta and Dallas-Fort Worth), two in the Midwest (Detroit and Milwaukee) and one in the West (Denver). No Northeastern metropolitan area was ranked in the top 10.

    Table 1
    Estimated Cost of Living: 2009
    Metropolitan Areas over 1,000,000 with Local CPIs
    Rank Metropolitan Area
    Metropolitan Exchange Rate: to Purchase $1.00 at National Average
    Compared to Lowest Cost of Living
    1
    St. Louis, MO-IL
    $0.891
    0%
    2
    Kansas City, MO-KS
    $0.903
    1%
    3
    Cleveland, OH
    $0.921
    3%
    4
    Pittsburgh. PA
    $0.941
    6%
    5
    Cincinnati, OH-KY-IN
    $0.944
    6%
    6
    Atlanta. GA
    $0.958
    8%
    7
    Detroit. MI
    $0.959
    8%
    8
    Milwaukee. WI
    $0.959
    8%
    9
    Dallas-Fort Worth, TX
    $0.976
    10%
    10
    Denver, CO
    $0.996
    12%
    11
    Minneapolis-St. Paul, MN-WI
    $1.000
    12%
    12
    Houston, TX
    $1.000
    12%
    13
    Tampa-St. Petersburg, FL
    $1.006
    13%
    14
    Phoenix, AZ
    $1.011
    14%
    15
    Portland, OR-WA
    $1.034
    16%
    16
    Chicago, IL-IN-WI
    $1.041
    17%
    17
    Philadelphia, PA-NJ-DE-MD
    $1.054
    18%
    18
    Baltimore, MD
    $1.068
    20%
    19
    Riverside-San Bernardino, CA
    $1.078
    21%
    20
    Miami-West Palm Beach, FL
    $1.085
    22%
    21
    Seattle, WA
    $1.120
    26%
    22
    San Diego, CA
    $1.151
    29%
    23
    Boston, MA
    $1.175
    32%
    24
    Washington, DC-VA-MD-WV
    $1.181
    33%
    25
    Los Angeles, CA
    $1.222
    37%
    26
    San Francisco-Oakland, CA
    $1.258
    41%
    27
    New York, NY-NJ-PA
    $1.281
    44%
    28
    San Jose, CA
    $1.343
    51%
    Estimated from BEA 2006 data, adjusted by local Consumer Price Index for 2006-2009


    The Bottom Ten: The most expensive metropolitan areas were:

    28. San Jose, where $1.343 purchased $1.00 in value at the national average.
    27. New York, where $1.281 purchased $1.00 in value at the national average.
    26. San Francisco, where $1.268 purchased $1.00 in value at the national average.
    25. Los Angeles, where $1.222 purchased $1.00 in value at the national average.
    24. Washington, where $1.181 purchased $1.00 in value at the national average.

    The bottom ten also included three metropolitan areas in the West (Riverside-San Bernardino, San Diego and Seattle), one in the Northeast (Boston) and one in the South (Miami). There were no Midwestern metropolitan areas in the bottom 10.

    Per Capita Income: Per capita income in 2009 was then adjusted for the cost of living.

    Top Ten:Washington has the highest per capita income, adjusted for the cost of living, at $47,800. San Francisco placed second at $47,500. Denver ranked third at $46,200, while the cost-of-living adjusted income in Minneapolis-St. Paul was $45,800 and $45,700 in Boston. The top 10 also included two Midwestern metropolitan areas (St. Louis and Kansas City), two from the Northeast (Baltimore and Pittsburgh) and one from the West (Seattle).

    Bottom Ten: The least affluent metropolitan area was Riverside-San Bernardino, with a per capita income of $27,800. Phoenix was second least affluent at $33,900 while Los Angeles was third least affluent at $35,000. The fourth least affluent metropolitan area was Tampa-St. Petersburg at $36,600 and the fifth least affluent metropolitan area was Portland at $37,400. The bottom 10 also included two metropolitan areas from the South (Atlanta and Miami), two from the Midwest (Cincinnati and Detroit) and one from the West (San Diego).

    The cost of living adjusted income data includes surprises. New York, commonly considered a particularly affluent metropolitan area, ranked 17th in cost-of-living adjusted income, and below such seemingly unlikely metropolitan areas as Pittsburgh, Kansas City, Cleveland, St. Louis and Milwaukee. These metropolitan areas also ranked above San Jose, which ranked first in unadjusted income in 2000, but now ranks 16th in cost of living adjusted income (Table 2).

    Table 2
    Personal Income Per Capita Adjusted for  the Cost of Liviing
    Metropolitan Areas over 1,000,000 with Local CPIs
    Rank (Cost of Living Adjusted)
    Rank (Unadjusted Income)
    Metropolitan Area
    Per Capita Income 2009: Adjusted for Cost of Living
    Per Capita Income 2009: Unadjusted
    1
    2
    Washington, DC-VA-MD-WV
    $47,780
    $56,442
    2
    1
    San Francisco-Oakland, CA
    $47,462
    $59,696
    3
    8
    Denver, CO
    $46,172
    $45,982
    4
    9
    Minneapolis-St. Paul, MN-WI
    $45,772
    $45,750
    5
    4
    Boston, MA
    $45,707
    $53,713
    6
    18
    St. Louis, MO-IL
    $45,288
    $40,342
    7
    7
    Baltimore, MD
    $44,908
    $47,962
    8
    15
    Pittsburgh. PA
    $44,848
    $42,216
    9
    19
    Kansas City, MO-KS
    $43,862
    $39,619
    10
    6
    Seattle, WA
    $43,730
    $48,976
    11
    13
    Houston, TX
    $43,581
    $43,568
    12
    16
    Milwaukee. WI
    $43,477
    $41,696
    13
    11
    Philadelphia, PA-NJ-DE-MD
    $43,247
    $45,565
    14
    21
    Cleveland, OH
    $42,734
    $39,348
    15
    12
    Chicago, IL-IN-WI
    $41,990
    $43,727
    16
    3
    San Jose, CA
    $41,255
    $55,404
    17
    5
    New York, NY-NJ-PA
    $40,893
    $52,375
    18
    20
    Dallas-Fort Worth, TX
    $40,494
    $39,514
    19
    23
    Cincinnati, OH-KY-IN
    $40,437
    $38,168
    20
    10
    San Diego, CA
    $39,647
    $45,630
    21
    24
    Detroit. MI
    $39,147
    $37,541
    22
    17
    Miami-West Palm Beach, FL
    $38,124
    $41,352
    23
    26
    Atlanta. GA
    $38,081
    $36,482
    24
    22
    Portland, OR-WA
    $37,446
    $38,728
    25
    25
    Tampa-St. Petersburg, FL
    $36,561
    $36,780
    26
    14
    Los Angeles, CA
    $35,045
    $42,818
    27
    27
    Phoenix, AZ
    $33,897
    $34,282
    28
    28
    Riverside-San Bernardino, CA
    $27,767
    $29,930
    Estimated from BEA 2009 income data and 2006 regional price parity data, adjusted by local Consumer Price Index for 2006-2009


    Some expensive metropolitan areas such as Washington, San Francisco and Boston ranked at or near the top, but their cost-of-living adjusted incomes were considerably less than the unadjusted incomes. On average, it took $1.20 to purchase $1.00 of value at national rates in these three metropolitan areas. Washington’s unadjusted per capita income was 40 percent ($16,100) higher than that of St. Louis, however when the cost of living is factored in, Washington’s advantage drops to 6 percent ($2,500).

    Caveats: The analysis above does not consider cost-of-living differentials within metropolitan areas. For example, data from the ACCRA cost of living index indicates generally higher prices in the cores of the largest metropolitan areas, such as New York (especially Manhattan), Chicago and San Francisco. Further, these data make no adjustment for relative levels of taxation. A cost of living analysis using disposable income would produce different results, dropping higher taxed metropolitan areas to lower rankings and raising lower taxed metropolitan areas higher.

    Cost of Living Differences: Will They Continue? The spread in cost-of-living between metropolitan areas have been driven wider over the last decade by the relative escalation of house prices in some metropolitan areas in the West, Florida and the Northeast. Whether these shifts in cost of living will be reflected in migration patterns will be one of the things to look for in the new Census.

    ———

    Note 1: Purchasing power parity data is published by the World Bank, the International Monetary Fund (IMF) and the Organization for Economic Cooperation and Development (OECD).

    Note 2: The BEA research applied regional price parity factors only to employee compensation and excluded other income. It is possible that, had the analysis been expanded to these other forms of income, the differences in cost of living would have been greater.

    Photo: Rosslyn, VA business district, Washington (by author)

    Wendell Cox is a Visiting Professor, Conservatoire National des Arts et Metiers, Paris and the author of “War on the Dream: How Anti-Sprawl Policy Threatens the Quality of Life

  • Why Most Americans are Both Liberal and Conservative

    American politics is consumed by a bitter, at times violent, debate about the overall role of government and specific governmental programs.

    Pundits often frame this divide in terms of geography (red states versus blue states), ethnicity (Hispanics and blacks versus whites), class (rich versus poor), or age and gender. Those factors matter, but seeing polarization only in terms of group versus group misses an important paradox about Americans: Most of us have both deep conservative instincts and liberal instincts.

    This personal inner conflict need not calcify our national divide. Instead, it could form the basis for a new and unifying consensus or civic ethos. To do this, though, our political leaders must build on the quintessentially American politics of today’s Millennials (those born between 1982 and 2003), who prize individual initiative at the local level to achieve national goals.

    Why we look left and right at the same time
    American political opinion looks in two directions – both left and right, or liberal and conservative – at the same time. Social scientists Lloyd A. Free and Hadley Cantril were the first to use survey research to describe and analyze this paradox of public opinion that has always shaped US politics.

    In their book, “The Political Beliefs of Americans” (1967), they maintained that Americans consistently demonstrate a conflict between their general attitudes toward “the proper role and sphere of government,” (which drove the big GOP gains last November) and their attitudes toward specific governmental programs (which helps explain broad American support for “big government” programs like Medicare).

    According to Mr. Free and Mr. Cantril, most Americans have conservative attitudes concerning the size of government, and liberal beliefs in support of programs to protect themselves economically. This leads majorities to favor smaller government, individual initiative, and local control while endorsing major governmental programs ranging from Social Security to student grants and loans.

    Tensions go back to our founding
    This tension has always been a part of American politics. The US Constitution was itself the product of fierce debate in the wake of the failed Articles of Confederation. The ingenious solution the Founders gave us was both a strong central government and equally powerful guarantees of individual liberty embodied in the Bill of Rights. Notably, that solution was largely the product of that era’s young adults, the so-called Republican Generation.

    Still, the Constitution didn’t settle the question of the government’s role in the economy and personal welfare. That wasn’t resolved, at least temporarily, until the Great Depression, when Americans gave their strong support to FDR’s New Deal programs. Again, it was that period’s young adults – the “greatest generation” – that led the new consensus.

    Small government, big programs
    Such consensus, of course, doesn’t erase our conflicting convictions. Even in the depths of the Great Depression, Gallup revealed this conflict between the public’s programmatic liberalism and conservative ideology. On the one hand, large majorities believed that the government should provide free medical care to the poor (76 percent), extend long-term, low-interest loans to farmers (73 percent), and implement the newly created Social Security program (64 percent). By contrast, only a minority wanted the government to take over railroads (29 percent) and banks (42 percent), or limit private fortunes (42 percent).

    In 1964, as President Johnson was announcing his Great Society initiatives, Free and Cantril, using the results of commissioned Gallup polls, determined that within the electorate, ideological conservatives outnumbered liberals by more than 3 to 1 (50 percent to 16 percent). But in those very same surveys, support for liberal government programs exceeded conservative opposition by a ratio of 4.6 to 1 (65 percent to 14 percent).

    Using data from four of the Political Values and Core Attitudes surveys conducted by the Pew Research Center over the past two decades, we confirmed their research. Across four Pew surveys, from 1987 to 2009, ideological conservatives outnumbered liberals by a ratio of 3.5 to 1, but liberal supporters of specific programs outnumbered conservative opponents by a 2.2 to 1 margin.

    In every Pew survey, there were always more conservatives than liberals regarding the overall role of government and a greater number of liberals than conservatives in support of programs designed to promote equality and economic well-being. In effect, the United States is neither a center-right nor a center-left nation; it is, and always has been, both at the same time.

    Not surprisingly, voters who identify as Republicans have tended toward the conservative side of these two tendencies. And Democratic identifiers have leaned toward the liberal side. Although the gap between the identifiers of the two parties has widened recently, during most of the time since Free and Cantril first published their findings, the greatest number of both Democratic and Republican identifiers, as well as independents, has been ideologically conservative and programmatically liberal.

    Moderates driven out
    Today, driven by more liberal attitudes among the Democrats’ young Millennial Generation and minority supporters, and the more conservative beliefs of the Republicans’ older, white base, the leadership of the two parties is more polarized than at any time since the Great Depression.

    For the first time ever, among Democrats in the House of Representatives, the liberal Congressional Progressive Caucus contains more members than the moderate New Democrats and conservative Blue Dogs combined.

    Across the aisle, few congressional Republicans are willing to call themselves moderates, and liberals, once a meaningful bloc in the GOP, have entirely disappeared.

    Despite these divisions, the leaders of each party must find a way to work together to synthesize both strands of America’s political DNA – a belief in the importance of a strong national community and equality of opportunity as well as a strong desire to limit government’s encroachment on individual liberty – into a new civic ethos that is broadly acceptable to most Americans.

    Millennials can foster a new consensus
    The belief of America’s youngest adult generation, Millennials, in the efficacy of individual initiative at the local level to achieve national goals provides a basis for just such a solution. To once again bind the wounds of internal discord, our political leaders should adopt this approach and successfully appeal to the ideological conservatism and programmatic liberalism of the American people.

    This piece originally appeared at the Christian Science Monitor.

    Morley Winograd and Michael D. Hais are fellows of the New Democrat Network and the New Policy Institute and co-authors of Millennial Makeover: MySpace, YouTube, and the Future of American Politics (Rutgers University Press: 2008), named one of the 10 favorite books by the New York Times in 2008.

    Photo by Zach Stern

  • Mega-City Semantics in China’s Pearl River Delta

    Recently an article ran in The Telegraph about China ‘creating the largest mega-city in the world with 42 million people‘. The title of the piece is a bit misleading as the government is not planning a new city per se, but rather combining a group of nearby cities into one huge ‘mega-city’. The targeted group of cities makes up the Pearl River Delta region in China’s southern Guangdong Province.

    Home to China’s famous first tier cities Guangzhou and Shenzhen, the Pearl River Delta is already one of the most populated places on earth. It is the manufacturing powerhouse of the country, thanks in large part to it being the first economically liberalized region after Reform and Opening Up. As a result of this, the Pearl River Delta has absorbed ambitious migrants from all over China for the better part of three decades.

    In addition to Guangzhou and Shenzhen, the proposal calls for integrating smaller (albeit still in the millions population-wise) cities of Donggaun, Foshan, Huizhou, Zhaoqing, Jiangmen, Zhongshan and Zhuhai into one. Upon first reading, the proposal doesn’t make much sense as the Pearl River Delta region has done an excellent job already of linking transportation and infrastructure among its different cities- so why the need to amalgamate into one city?

    Yet the intention of the integration becomes clear when Ma Xiangming, the chief planner at the Guangdong Rural and Urban Planning Institute, articulates that:

    “The idea is that when the cities are integrated, the residents can travel around freely and use the health care and other facilities in the different areas.“

    This is the key. The Chinese government still enforces the hukou household registration system for its citizens, making it difficult for people who move from one city to another to use the services offered by their new city. Restrictions for migrants to new cities are not only limited to healthcare and educational services, but to investment opportunities as well such as starting a business or purchasing a new home.

    By amalgamating the cities of the Pearl River Delta into one ‘mega-city’, this gets rid of the bureaucratic restrictions of the hukou registration. Now, the migrants who have left their native homes and settled in the Pearl River Delta can move more freely around the region. This is much more than semantics, it is a huge step forward in the liberalization of movement and opportunity for its citizens. It is unbelievable that The Guardian piece makes no mention of the significance of this development.

    UPDATE:

    Now there are reports that the story of the Pearl River Delta mega-city is false. According to an AFP report, China denies plan to create world’s biggest city.

    The error made by the original Telegraph article is most likely due to a misunderstanding by the reporters. As I mentioned above, the title was highly misleading, nothing more than a sensational headline designed to get reader attention. And the consultants quoted in the original article are city planners, professionals whose job it is to make recommendations on how to go about development, not the final decision makers who approve projects.

    The fact that the Pearl River Delta is not going to become one ‘mega-city’ doesn’t necessarily take away from the interest in integrating the region, making it a place where services are shared and the ease of mobility between its cities is increased.