Category: Economics

  • How Big Government and Big Business Stick It to Small U.S. Businesses

    From the inception of the Soviet Union, transformation was built, quite consciously, on eliminating those forces that could impede radical change. In many ways, the true enemy was not the large foreign capitalists (some of whom were welcomed from abroad to aid modernization) but the small firm, the independent property owner.

    “Small scale commercial production is, every moment of every day, giving birth spontaneously to capitalism and the bourgeoisie … Wherever there is business and freedom of trade, capitalism appears,” noted the state’s founder Vladimir Lenin. He understood that while larger firms could be manipulated to serve the state, “capitalism begins in the village marketplace.”

    Later on, this drive to eliminate grassroots capitalists—notably the “rich peasants” or kulaks—took on a particularly deadly form. In 1929 Stalin decided on the “liquidation of the kulaks as a class.” Millions of small rural entrepreneurs were imprisoned, murdered, or starved to death, until by the end of the ’30s independent business in the Soviet Union was largely eliminated, giving the state free rein.

    Who are America’s Kulaks?

    The United States, fortunately, is not the Soviet Union and even the most “transformation” oriented politician does not—at least yet—have power to create a gulag or openly appropriate the wealth or lives of citizens. Yet lately there is nevertheless a powerful trend to limit and largely disempower the country’s small business community—our kulaks—from a host of antagonists, including the Obama administration, the large financial institutions, and the ever-expanding regulatory apparat.

    In the 19th century, the small farmer epitomized the national ideal: independent, hard-working, frugal and engaged in his community. Later, as agriculture’s share of the economy dropped, the “yeoman” farmer gave way to the Main Street business owner, whose conflicts, particularly in the late 19th and early 20th centuries, were more with oligopolistic corporations—notably utilities, oil companies, and railroads—than the government.

    Kulaks are not just people with some money and capital. They tend to be engaged in the private sector, where risk is an everyday concern. There are other parts of the affluent middle class who are not Kulaks but actually beneficiaries of the intrusive state, such as academics, parts of big business and, of course, elite members of the ever-expanding governmental nomenklatura. These professionals, as well as corporate executives, have helped make the Democratic Party, as the New York Times’ Tom Edsall suggests, the “favorites of the rich.”

    The Decline of a Class

    In the ascendance during the Reagan and Clinton booms, our kulaks—the roughly 10 million businesses under 500 employees that employ 40 million people—are clearly in secular decline, with grave implications for the economy, employment, and the future of democracy.

    Rather than a new age of democratic capitalism imagined by Reagan era conservatives, we increasingly live in a world dominated by large companies. The overall revenues of Fortune 500 companies have risen from 58 percent of nominal GDP in 1994 to 73 percent in 2013. At the same time, small business start-ups have declined as a portion of all business growth, from 50 percent in the early ’80s to 35 percent in 2010. Indeed, a 2014 Brookings report (PDF) revealed that small business “dynamism,” measured by the growth of new firms compared with the closing of older ones, has declined significantly over the past decade, with more firms closing than starting for the first time in a quarter century. Only 35 percent of small business owners, according to a recent survey by the National Small Business Association, express optimism about the economy.

    This decline in entrepreneurial activity marks a historic turnaround. Start up rateshave fallen for young people in particular, dropping to the lowest levels in a quarter century. At the same time the welfare state has expanded dramatically to the point that nearly half of all Americans now get payments from the federal governmentnotably through Medicare and Social Security. At the same time, the lack of grassroots economic activity may contribute to labor participation rates, now the lowest in almost four decades.

    The Obama administration’s progressive-sounding rhetoricmay offend some of the thinner-skinned members of the oligarchy, but his economic policies—the bank bailouts, super-low interest rates, and growing federal power—have also improved the balance sheets of the corporate hegemons and the super-rich. In contrast, these policies do little, or less than little, for the yeoman class. Money today is made far more easily today by playing games with the market than making or selling on Main Street.

    High business costs, some related to the rising tide of regulation under President Obama—including Obamacare—have become a huge burden to smaller firms. Indeed, according to a 2010 report (PDF) by the Small Business Administration, federal regulations cost firms with fewer than 20 employees more than $10,000 each year per employee, while bigger firms paid roughly $7,500 per employee. The biggest hit to small business comes in the form of environmental regulations, which cost 364 percent more per employee for small firms than it does for larger ones. Small companies spend $4,101 per employee, compared to $1,294 at medium-sized companies (20 to 499 employees) and $883 at the largest companies, to meet these requirements.

    Nowhere has consolidation of power under the current regime been more obvious than in the financial sector. Goldman Sachs’ Lloyd Blankfein has described his firm as “among the biggest beneficiaries of reform.” The new regulatory environment has created huge barriers to any potential competitors and places smaller firms at a distinct disadvantage.

    In contrast these regulations have hastened the rapid decline of community banks, for example, down by half since 1990, particularly hurts small businesspeople who depended on loans from these institutions, leaving them, as even Ben Bernanke admits, with major obstacles at achieving credit.

    The large banks also benefited from the Obama administration’s steady refusal to prosecute any Wall Street grandees. Their get-out-of-jail-free card is a testament to the pilfering lobbyists of Washington’s K Street and the greed of politicians in both parties.

    Resisting the New Duopoly: Big Government and Big Business

    Under Lenin and Stalin, the threat to the kulaks was explicit, and in the end genocidal. Here in America, to be sure, the process is far less extreme. And not all the assault on Kulaks can be traced to government.

    Technology and globalization often work against small firms. In the past, technology promoted competition whereas now it increasingly works to foster the consolidation of a new oligarchy dominated by such quasi-monopolies as Microsoft, Amazon, Apple, Google, and Facebook.

    Indeed, the future being envisioned in the media and by the oligarchs is one dominated by automated factories and computer-empowered service industries. This will reduce opportunity for both middle-class jobs and small business in the future. To some, the American middle and working classes are becoming economically passé. Steve Case, founder of America Online, has even suggested that future labor needs can be filled not by current residents but by some 30 million immigrants. In this he reflects the cosmopolitan notions favored by the oligarchs. But likely not so much by the Kulaks and the bulk of the populace.

    Rather than a republic of yeoman, we could evolve instead, as one left-wing writer put it, to live at the sufferance of our “robot overlords,” as well as those who program and manufacture them, likely using other robots to do so. The financial community seems to have little problem with this tendency, as we can see in its support for companies such as Uber, which, however convenient, is growing at the expense of what had been thousands of full time workers. And former top Obama aides are leading Uber’s defense against threatened taxi drivers.

    Politicians on both the right and left seek to appeal to middle class voters and small business owners, but neither party can be said to have the interests of these groups at heart. The large corporations and banks have enjoyed an unprecedented surge in profits, but few small business have crashed that party. Republicans and their leading lobbyists generally have no interest in doing anything, such as equalizing capital gains and income rates, that would offend those who support their campaigns and fund their ongoing political activities.

    In the past, Democrats may have appealed to Kulaks, but that seems to have died with the end of Bill Clinton’s second term. Whereas the first Clinton accepted limits on government largesse, the newly emboldened progressives, citing inequality, are calling for more transfers to the poorer parts of society. They even plan to hit the kulaks where they live—largely suburbia—as part of an effort to social engineer American communities.

    This trend has almost universal support in the mainstream media, the campuses, and some corporations, who can better manipulate the regulatory and tax system. There is even a role model: to become like Europe. As The New York Times’ Roger Cohen suggests, we reject our traditional individualist “excess” and embrace instead continental levels of modesty, social control, and, of course, ever higher taxes.

    Trump, Sanders, and the future of the Kulaks

    The assault on the kulaks has had significant political consequences, although the endgame remains very much in question. Certainly there’s widespread dissatisfaction towards the Obama administration: in 2012, small business ownersranked as the least approving group for the current regime.

    Yet it is not just Republicans or Tea Partiers who are upset with the rising plutocracy. Americans, according to Gallup, greatly favor small companies over big business. Indeed most large institutions—government and media as well as large corporations—now suffer some of the lowest rankings in recent history, with only small business and the military doing well.

    Given these attitudes, it’s not surprising that the rising candidates of 2015 were those—Trump, Carson, Sanders , and even Fiorina—who have tried to position themselves in opposition to the status quo. The candidate most feared by Wall Street isn’t the folksy socialist Bernie Sanders but Donald Trump, whose candidacy, reports Politico, is setting off “a wave of fear” among the investor class. This is not just concern over Trump’s xenophobia, but his essential populism.

    Both Trump’s support and that of Ben Carson come from Republicans who do not oppose higher taxes on the ultra-rich; they might not be far right culturally but they tend to the left on issues of economic security. These issues are critical toboomers, the group that dominates the small property owning class and the largest share of voters, and have been turning more conservative.

    The kulaks may agree with Bernie Sanders on the dangers of corporate power, but they are likely no fans of redistribution. They also may suspect, rightly, that they, and not the grandees at Apple or Goldman Sachs, will be the ones to pay for the Democrats’ increasingly extravagant redistributionist demands.

    Overall the kulaks do not seem impressed with candidates, such as Hillary Clinton and Jeb Bush, who are essentially creatures of dueling oligarchies. The kind of acceptance of corporate leadership that dominated Republican politics through much of the past half century is now fading, and the results are a GOP fractured not only by ideology but also by class. The big money may be on the corporate side, but there are a lot more Kulaks than grandees when it comes to voting.

    In Russia, the forces of the state managed to destroy the kulaks, cementing a legacy of economic stagnation, particularly in the countryside, that remains today. America’s war on the kulaks may be less bloody-minded, but if it is not somehow halted, both our economy and the country’s intrinsic entrepreneurial spirit will fade. We may end up looking all too much like contemporary Russia, an oligarch-dominated kleptocracy that holds out increasingly little promise to its own people, and provides no real role model to the rest of the world.

    This piece first appeared at The Daily Beast.

    Joel Kotkin is executive editor of NewGeography.com and Roger Hobbs Distinguished Fellow in Urban Studies at Chapman University, and a member of the editorial board of the Orange County Register. He is also executive director of the Houston-based Center for Opportunity Urbanism. His newest book, The New Class Conflict is now available at Amazon and Telos Press. He is also author of The City: A Global History and The Next Hundred Million: America in 2050. He lives in Orange County, CA.

    Photo: Main Street America Russell, Kansas by http://www.cgpgrey.com [CC BY 2.0], via Wikimedia Commons

  • Conferences and Progress

    Californians attend innumerable conferences on housing and economic growth.  Year after year, in counties across California, the same people show up to say and hear the same things.  Mostly what they say and hear is naive, and nothing ever changes.

    I was reminded of this when I saw a report on what appears to have been a typical conference at the Harris Ranch on Growing the Central Valley Economy.

    There is no doubt that the Central Valley economy could use some economic growth.  After years of paying a disproportionate share of the costs of California’s coastal-driven energy, environmental and water regulations, the Valley’s economy is suffering.  Poverty is rampant, as California leads the nation with a three-year average poverty rate of 23.4 percent according the Census Bureau’s most recent comprehensive poverty measure.

    The Valley and some other inland areas are the primary reason California leads the nation in poverty and inequality.  Throughout the Valley, economic growth is anemic.  It’s negative in some areas.  Some counties are seeing declining populations.

    Conferences, at least the typical California conference, won’t help.  They only serve to provide a low-cost means to salve the participants’ consciences, allowing them to feel that they are doing something.

    Consider the recommendations that came through the report:

    Creative thinking from the public policy sector

    You can bet your net worth that you will hear about creative thinking or thinking outside the box at every California housing or economic development conference. At best, it doesn’t mean anything. If it does mean anything, creative thinking from the public policy sector is the worst thing that could happen.

    Public policy sector creative thinking is what has created the San Joaquin Valley’s stagnant economy and California’s poverty and inequality in the first place. California’s ruling elite are proud of California’s regulatory quagmire. No one could have imagined 20 years ago how successful they would be in putting it in place. Today, it remains unduplicated by any state, but Oregon is trying.

    The public sector does not create jobs or wealth, although it can provide preconditions through infrastructure development or contracts. But government is not the source of innovation or wealth creation. That comes from entrepreneurs, whether in the once-dominant aerospace industry or the early days Silicon Valley’s world-leading tech sector.  It won’t create any in the future.

    The best that government can do is to get out of the way of innovators—that means stream-lining the regulatory process and protecting property rights, in order to provide a predictable business environment.

    Let’s hope we don’t see more creative thinking from the public policy folks.

    Putting a “face” on the Valley and individual lives affected, emphasizing the continuing drought, pending fracking legislation, and burgeoning trade and logistic sectors in the seven-county region known as the San Joaquin Valley

    I think the idea is that if the coastal elite could just see the impacts of their policies, they would change those policies to allow more economic vigor in the Valley. The naivety is touching, and shockingly naive.

    Let’s face it, California’s coastal elite likely care more about some Minnesota dentist’s shooting a lion than they care about the lives of Valley residents. Their policies are there to save the world. If they cause some inconvenience for people in the Valley, well that’s just the cost of progress.

    It might be different if they thought their policies would impact their own incomes. Their policies don’t. Tech sector people know their incomes come from all over the world, and they just relocate plants, call centers, tech support and even development outside of California if costs become too high. There is a reason that the Silicon Valley no longer is building more of the chip factories for which it was named.

    The retired coastal elite’s income is mostly independent of California’s economy. Once again, the checks come from someplace else.

    Accessing and employing the most effective tools from science, engineering and technology to responsibly advance technological applications

    Yep, and motherhood is a wonderful thing. Technology and applications will advance, regardless of what happens in the San Joaquin Valley. How is this supposed to help the Valley? California has priced itself out of competitive tradable goods production. That’s why Intel, Apple, Facebook and others are spending billions expanding outside of California.

    Technology will benefit Valley residents, but it won’t be a source of economic growth until the Valley has a competitive cost structure. And that cannot happen until the state takes its foot off the valley’s neck.

    Building coalitions to ensure adequate resources and investment in the Central Valley during what is likely to be a dramatic transition period

    Coalitions are another topic that comes up in every California conference. We’ve heard this for decades, and nothing has happened.

    All that coalitions, at least as they materialize in California, can do is advocate. Most often, they advocate to the government. Since governments are the source of the problem and not the source of economic growth and wealth, this not an effective strategy. The coalitions might extract some wealth from someone else, but they are not going to create economic vigor.

    Focusing locally on training and retaining that will help boost opportunities for employment and contribute to an improved quality of life as the region continues its transformation to a progressively more sustainable future

    This is another thing you hear constantly California conferences. Education and training are something that we have chosen to do for our young people. It can be an economic development tool. In California today, though, education is not an economic development tool.

    San Joaquin Valley graduates of high school or college can’t get jobs in the Valley. The Valley’s unemployment rates are way above the State’s even in good years. More individuals with degrees won’t change this. All it means is that Texas, Arizona, Utah, and other states will have a better pool of California workers to supply their economies. We may feel a moral obligation to educate, but it’s not a local economic development tool.

    What Could Work?

    The California Environmental Quality Act (CEQA) was originally enacted to protect California’s pristine natural environments. Since then it’s evolved into a tool which allows almost anyone to stop or delay just about any project. In fact, the threat of a CEQA case is often wielded by project opponents in order to extort concessions from companies.

    CEQA dramatically increases the uncertainty and costs associated with California projects. It needs to be rewritten to achieve its original purpose while limiting its use as a tool for maintaining the status quo.

    California’s other regulations that most hurt economic growth are either environmental or are designed to bring in “stakeholders .” All need to be evaluated on a cost-benefit basis.

    Chapman University researchers have presented compelling evidence that California’s greenhouse gas regulations have almost no impact on global carbon levels, but we know they have considerable costs.

    Regulations designed to bring in “stakeholders” effectively grant almost everyone veto power over most projects. You could hardly design a more effective method to slow or stop growth.

    Politically, there is no chance of making necessary regulatory revisions anytime soon. There is hope, though. California’s minority caucus recently stopped proposed regulation mandating a 50 percent decrease in California’s use of gasoline. The minority caucus’ constituents are California’s primary regulatory victims. It was good to see them stand up for their constituents. I hope to see more of it in coming years. That will be far more effective than another conference.

    Bill Watkins is a professor at California Lutheran University and runs the Center for Economic Research and Forecasting, which can be found at clucerf.org.

  • Rural Industrialization: Asia’s 21st Century Growth Frontier

    A World Bank report released earlier this year featured a jarring statistic: 200 million people moved to East Asia’s cities between 2000 and 2010. That figure is greater than the populations of all but five of the world’s countries. Commentators argue that the urbanization of Asia is inevitable, with one calling recent growth “just the beginning.” Considered alongside figures about urban migration, the fact that only 1 percent of Asia’s land is urbanized (a popular statistic) appears to validate predictions about the increasing densification of cities. However, growth in the capacity of cities to accommodate industrial growth seems to be flattening. With a rising middle class and booming demand for automobiles, Asian cities can expect no relief from congestion, and this may be a deterrent for businesses. Rural areas are increasingly prepared to absorb this potential shift in demand.

    Urbanization patterns

    In examining Asia’s economic growth through urbanization patterns, it is helpful to consider historic data spanning several decades. Figure 1 compares 54 years of urbanization in Southeast Asia’s five largest economies against India and China, both arguably the 21st century’s most dynamic growth stories and frequent subjects of urbanization research and commentary. Urban population share has been rising consistently in most countries of this study. Malaysia has long seen a population majority living in cities, and China and Indonesia both crossed the 50% threshold in 2011. Thailand has also rapidly urbanized since 2000, and will likely pass 50% this year. By contrast, Vietnam, India, and the Philippines have been slower to urbanize, with the latter declining since 1990. Part of this variation reflects differences in definitions and measurements of urbanization across countries and time, but the underlying pattern remains clear: the past several decades have seen an urban migration of historic scale.

    Figure 1 (Data source: World Bank)

    That urbanization correlates with economic growth is a point rarely overlooked. Indeed, the two have supported one another since the emergence of capital- and labor-intensive manufacturing during the industrial revolution. Borne of historic growth patterns, this logic has been used to support predictions of continued industrial urbanization and policies that promote it. However, remote penetration of connective infrastructure – including both transportation and communications – is replacing old growth models with a new rural industrialization. The following data support this claim.

    GDP and urban growth

    The urban growth-GDP quotient (Figure 2) represents urban population growth divided by GDP, and is effectively a measure of how much economic activity countries are extracting from their cities. It is not an absolute measure such as GMP (gross metropolitan product). Rather, it is a measure of how changes in GDP track changes in urbanization, providing a broader look at the relative role of cities in national economies. A time horizon of nearly three decades (1985 – 2014) is chosen to capture the high growth period after market reforms in China (1979) and Vietnam (1985). The indexing approach is necessary to normalize the scale of variables for more meaningful graphical visualization, essentially “controlling” for vast differences in numeric values (e.g. the GDPs of China vs. the Philippines). It also creates a common reference point to compare longitudinal performance across countries.

    Figure 2 (Data source: World Bank)

    In this metric, China outperforms comparator countries with a particularly rapid increase in the quotient since 2005; it has evidently been successful deriving GDP value from urban areas. By contrast, Indonesia has seen comparatively less urban-based GDP contribution, and Thailand’s contribution has remained roughly the same since outpacing all countries between 1985 and the Asian financial crisis.

    Manufacturing and urban growth

    One factor underlying these differences is the type of industries contributing to GDP growth, and in particular their location patterns (rural vs. urban). An examination of manufacturing value added (MVA) is necessary to sharpen this analysis, as manufacturing is historically an urban-based activity. Cities provide labor, infrastructure, business services, and global connectivity; their importance to manufacturing is undisputed. The raw MVA numbers (Figure 3) indicate that since 2005, China has far outperformed other countries in the study, most of which showed consistent but not transformative growth. Among the latter, India boasts the lone spike in MVA, and that only recently.

    Figure 3 (Data source: World Bank)

    To complete the analysis, Figure 4 compares historic patterns of manufacturing growth against growth in urbanization. The indexed quotient replaces GDP (Figure 2) with MVA and can be regarded as a measure of the extent to which countries leverage urbanization to support manufacturing growth. China’s statistical dominance in previous measures vastly diminishes here. Further, growth in the ability of many remaining countries to derive MVA from cities slows after initially rapid growth.

    Figure 4 (Data source: World Bank)

    The notable exception is India, and this is the critical point in this analysis. India’s competitive advantage is rooted in the country’s tech sector and other higher-value added activities. From call centers to technology R&D, India has developed a defensible regional position in knowledge-based industries, which are increasingly dependent on the by-products of urbanization: an educated workforce, global talent networks, and lifestyle amenities that appeal to higher-income residents. China maintains its position at the top due in part to its particular urban-based industrialization strategy (special economic zones and decentralization reforms empowering cities). However, China’s conversion of rural agricultural land into industrial facilities is an emerging phenomenon, and the line between urban and rural is fading. For example, in many provinces (e.g. Hebei) factory parcels stand alone, surrounded by farms.

    Towards rural industrialization

    In Southeast Asia, as in parts of China, industrialization is not a fundamentally urban phenomenon. From the industrial estates of Thailand’s Eastern Seaboard to the suburban clusters of Vietnam and Indonesia, companies are now finding most everything they need outside of city centers. The advantages are numerous: cheaper land, lower labor costs, less congestion, and in some cases lucrative business incentives. These suburban and rural industrial clusters are even focusing on quality of life for families, looking beyond hard infrastructure to provide housing, education, and recreation facilities. Such amenities appeal to workers of all skill types, from manufacturing to research and development. As such, rural industrialization need not be only smokestacks and assembly lines; an educated workforce can be recruited if rural living standards match those of cities. This broadens the array and sophistication of industries capable of supporting a new kind of growth.

    Hyper-urbanization visits significant inefficiencies on businesses, potentially making rural regions more attractive for operating. In many of Asia’s major cities, snarled traffic grinds life to a near halt and transit infrastructure has provided only modest relief. Aside from Singapore (a frequent statistical exception), Bangkok and Kuala Lumpur are leaders within Southeast Asia in developing urban rail. However, neither system offers the geographic coverage needed to loosen gridlock. Ho Chi Minh City is currently building its first metro line, but construction is delayed and completion appears to be years away. If hyper-urbanization is re-interpreted as a policy challenge rather than a sign of progress, the decentralization of industrial development can be one solution. Asia’s economic fate is not inextricably linked with the size of its cities, and fresh visions of decentralized growth are already proving their value. The potential is vast; for example, Indian Prime Minister Narendra Modi’s “digital push” and recent commitments to rural broadband represent a development path for the country’s remote regions. Technology, expertise, new funding sources, and emerging economic opportunities are ready to support the rise of rural industrialization across Asia.

    Kris Hartley is a Visiting Lecturer in Economics at Vietnam National University – Ho Chi Minh City, and a PhD Candidate at the Lee Kuan Yew School of Public Policy, National University of Singapore.

    Top Photo: Putrajaya, Malaysia: Seri Gemilang Bridge. Behind the bridge on the right side Ministry of Women, Family and Community and Ministry of Urban Wellbeing, Housing and Local Government © CEphoto, Uwe Aranas / , via Wikimedia Commons

  • Oil Bust? Bah — North Dakota Is Still Poised To Thrive

    Oil and gas companies have the worst public image of any industry in the United States, according to Gallup. But it’s well-loved in a swathe of the U.S. from the northern Plains to the Gulf Coast, where the boom in unconventional energy production has transformed economies, enlivened cities and reversed negative demographic trends.

    What now that the good times are over in the oil patch? In North Dakota, the epicenter of the once-hot Bakken shale play, the number of active rigs is down to 68 as of this week from 145 in June of 2014.

    Some might argue that it’s now the turn of oil patch cities to suffer, just as they did when prices plunged back in the early 1980s, setting off a decade long decline. But many of these cities have made considerable progress in economic diversification, making themselves far more attractive places for non-energy businesses.

    Perhaps no state benefited more from the energy boom than North Dakota. Long known more for its harsh weather, low population and featureless expanses than for anything positive, the massive deposits on the Bakken formation turned the state into the No. 2 energy producer in the country, trailing only Texas. The prairie state gained 45,000 energy jobs between 2007 and 2014. Now the decline in oil prices promises to eliminate quite a few of them.

    But few North Dakotans seem to believe that the energy bust will turn the state once again into a poster child for stagnation. For one thing, North Dakota’s job base has also expanded well beyond oil, with a net growth of 155,000 jobs   jobs from 2007 to 2014  — no small beer in a state with a population of 739,000. This growth started well before the oil boom, with employment surging by 50,000 jobs between 2000 and 2007.

    Transportation, logistics, wholesale trade and construction are among the industries that have added jobs, and the state’s technology industry has surged, doubling employment since 2009. The state’s engineer count has expanded 41% since 2009, almost seven times the national increase. Fargo, the state’s largest city but hundreds of miles from the Bakken, has thrived in large part due to the expansion in tech and business services. Overall Fargo has 38% more jobs than in 2000.

    In the coming years, other industries may help pick up the slack from energy. One prime candidate is aerospace, where North Dakota is touting itself as the “Silicon Valley of drones,” an outgrowth of the conversion of the Grand Forks Airforce Base from launching bombers and tankers to drones. The country’s first drone-only business park is being built on an unused portion of the base. Other industries on the upswing include biomedicine and wind turbine parts.

    Although some accounts have focused on the high costs to North Dakota communities of the oil boom, it’s difficult to find many North Dakotans who think it hasn’t been worth it. Over the past decade the state’s per capita income soared from 38th in the nation in 2004 to sixth in 2014. In this surge North Dakotans bought lots of things that once seemed unattainable, including winter homes in places like Phoenix.

    Beyond The Buffalo Commons

    But perhaps the biggest transition is demographic. A decade ago North Dakotans were being told by geographers like Rutgers’ Frank and Deborah Popper that their state would continue to lose residents and would best be transformed into a “buffalo commons,” a giant park that would be home largely to native Americans and the state’s varied wildlife .

    Yet North Dakota has enjoyed a remarkable demographic revival. After stagnating at roughly 640,000 for 15 years between 1990 and 2005, the state’s population now stands at roughly 100,000 higher.

    Once among the oldest states, it now ranks as the fourth youngest, with among the highest birthrates and the strongest in-migration per capita in the nation. More important still, the youngest residents are now much better educated, according to an analysis of Census data by Mark Schill of the Grand Forks-based Praxis Strategy group. Some 34% of North Dakotans between the ages of 25 and 34 have college degrees, and 40.8% in Fargo, well above the 31.7% rate nationally.

    Critically much of the demographic recovery in North Dakota is concentrated in Fargo and other places far from the energy belt, such as Sioux Falls, Omaha and Des Moines.

    Do The Plains Have A Future?

    Clearly the drop in price of oil, as well as of some farm commodities, will slow the Plains’ progress. Some sectors, notably the coal industry, seem destined to shrink as the EPA clamps on tighter emissions controls. North Dakota’s now low energy costs could be undermined by such steps, eliminating one competitive advantage. Iowa, Kansas and Minnesota also rank among the states most reliant on coal for electricity.

    The decline in key commodity markets could also hit the region’s resurgent manufacturing sector, which specializes in farming and earth-moving equipment; the current problems plaguing Caterpillar and are being felt across the region. The problems in key export markets, such as China and Canada, are being further exacerbated by the strong dollar.

    But younger demographics and low business costs suggest that the state will remain attractive for tech and business services companies. The state’s ability to draw businesses from higher-cost coastal areas has been bolstered by strong on the ground improvements. In Fargo there has been substantial downtown development and it boasts cultural attractions and a lively restaurant scene. The same can be said for in many Plains cities, notably Oklahoma City, Des Moines and Omaha. Anyone who had visited these place a decade or two ago would likely barely recognize them.

    To be sure with its tough climate and location far from the coasts, the Great Plains cities are not likely to challenge places like California or New York for leadership in media or software. But there’s an opportunity for these metro areas to grow in industries ranging from manufacturing and logistics to customer support that can sustain them until commodity prices once again begin to rise. When that happens, as they say out there, honey, bar the door.

    This piece first appeared in Forbes.

    Joel Kotkin is executive editor of NewGeography.com and Roger Hobbs Distinguished Fellow in Urban Studies at Chapman University, and a member of the editorial board of the Orange County Register. He is also executive director of the Houston-based Center for Opportunity Urbanism. His newest book, The New Class Conflict is now available at Amazon and Telos Press. He is also author of The City: A Global History and The Next Hundred Million: America in 2050. He lives in Orange County, CA.

    Photo “Western North Dakota” by Aaronyoung777Own work. Licensed under CC BY 4.0 via Wikimedia Commons.

  • No Wiggle Room in Housing Market

    The salary gap – where top-end incomes are rising faster than middle- and lower-end salaries – plays a large role in the affordability of middle-class housing along with interest rates and prices. Which factor has more influence depends on where you live and how you make your living.

    Using some simplifying assumptions (20 percent down payment and a 30-year fixed-rate mortgage), today’s middle-class household increasingly cannot afford a middle-class home. Two things hurt this market: poor job outlook (impacts income) and interest rates (impacts affordability).

    Cities

    Salary Needed

    Mortgage Rate

    Salary Gap

    Jobs/People Ratio

    Unemployment Rate

    Cleveland

    $33,714.17

    3.96

    10%

    .59

    5.3

    Pittsburgh

    $33,838.57

    3.87

    7%

    .61

    5.1

    Detroit

    $37,544.40

    4.05

    2%

    .54

    5.6

    Cincinnati

    $36,357.35

    3.98

    1%

    .60

    4.0

    St Louis

    $36,784.94

    3.94

    0%

    .62

    5.0

    Atlanta

    $39,356.45

    3.97

    -7%

    .61

    5.5

    Phoenix

    $43,170.07

    3.97

    -19%

    .59

    5.3

    Tampa

    $41,488.22

    4.04

    -23%

    .56

    5.0

    Minneapolis

    $50,969.96

    3.96

    -20%

    .69

    3.5

    Philadelphia

    $54,385.77

    3.96

    -34%

    .59

    5.5

    Baltimore

    $55,842.76

    3.89

    -34%

    .62

    5.3

    Houston

    $53,684.45

    3.94

    -41%

    .64

    4.3

    Orlando

    $46,300.92

    3.99

    -52%

    .61

    4.8

    San Antonio

    $48,092.30

    3.99

    -50%

    .60

    3.4

    Dallas

    $52,947.58

    3.97

    -44%

    .65

    3.7

    Sacramento

    $61,517.63

    4.03

    -47%

    .55

    5.6

    Chicago

    $61,068.50

    3.97

    -58%

    .60

    5.5

    Portland

    $65,009.41

    4.01

    -61%

    .61

    5.5

    Denver

    $69,912.24

    4.04

    -68%

    .67

    3.7

    Miami

    $63,289.86

    4.00

    -93%

    .59

    5.2

    Washington

    $83,027.24

    3.90

    -61%

    .67

    4.3

    Seattle

    $78,118.97

    4.05

    -69%

    .66

    4.2

    Boston

    $86,164.15

    3.91

    -78%

    .63

    4.1

    New York City

    $90,750.14

    3.97

    -102%

    .58

    5.1

    Los Angeles

    $88,315.32

    3.94

    -124%

    .59

    6.0

    San Diego

    $104,839.73

    4.04

    -161%

    .56

    4.8

    San Francisco

    $157,912.06

    3.95

    -211%

    .63

    4.0

    Salary Gap expressed as percent of Median Salary (that is, Salary Gap = (Median Salary minus Salary Needed) divided by Median Salary); negative numbers mean the salary needed to buy the median-priced home is greater than the median salary in that city. Data on salary needed and mortgage rates from http://www.hsh.com/finance/mortgage/salary-home-buying-25-cities.html; data on median salary from http://www.bls.gov/oes/current/oessrcma.htm. Unemployment rate for August 2015 and Participation rate is 2014 annual average from www.bls.gov.

    In some ways, Minneapolis is not unlike San Francisco: both enjoy relatively low levels of unemployment and low mortgage costs. Nationally, the average 30-year mortgage rate is 4.09% (for July 17, 2015). Minneapolis and San Francisco are at 3.96% and 3.95%, respectively. Compared to the national unemployment rate of 5.3%, Minneapolis is at 3.5% and San Francisco is at 4.0%. So how do we explain the difference in affordability, aside from the realtor’s rant of “location, location, location”? San Francisco has a higher jobs/population ratio than Minneapolis, but that is only part of the story. As someone once told me when I was trying to understand why the jobs/housing relationship in Orange County didn’t fit the model: “What makes you think those people have jobs?”

    In other words, where a population is less dependent on the traditional economy, higher home prices may be sustainable. This occurs in areas with a concentration of rich (“high-net-worth”) individuals. Some cities, like San Francisco and New York, are also attractive to rich homebuyers from outside the US. About 5% of existing home sales in California were to buyers from China (mainland, Hong Kong and Taiwan), who spent about $12 billion on homes primarily in San Francisco, Los Angeles and San Diego. The Chinese buyers paid an average of $831,000 per home – 69% paid with all-cash. In that sense, San Francisco is more like New York. The New York metro has an unemployment rate slightly below the national average, but only 57.8% as many jobs as there are people, compared to the national average of 59.2%. Foreign buyers from Canada and Mexico – who, along with China, make up about half of all foreign home buyers in the US – tend to buy in lower-priced housing markets in Florida, Arizona and Texas. Although more units are sold to international buyers in Florida (about 21% in 2015), the higher dollar volume is in California and New York. Homebuyers from Canada spent $6.4 billion in Florida and Arizona last year while buyers from China spent a total of $12 billion in California and New York. These statistics hint at a population that is less job-dependent, less “middle-class” than the national average.

    The behavior of middle-class households in the decade before the 2008 collapse confirmed what I called a “distinct shift in the paradigm governing the housing market.” In November 2004, the stock market was climbing and the Fed was raising interest rates. The combination brought out talk of a real estate bubble. If investors started moving money away from housing they would be selling houses at a time when higher mortgage interest rates would make it more difficult to find buyers. That was 2004, mind you, not 2008; there were four years of housing prosperity ahead.

    Under the new paradigm, rising stock market prices are neither cause nor effect for changes in residential real estate prices. (One exception is the New York metropolitan area, where Wall Street drives home prices by virtue of its impact on employment and income.) The break in the statistical relationship between Wall Street and Main Street started around 1980. In 1979, the Federal Reserve changed their policy away from interest rate targeting. As they attempted to control the supply of money, interest rates began to swing wildly. Households put more money in real estate when they saw more uncertainty in the economy. At the time I dubbed housing “A New Kind of Gold.” It wasn’t that the prices of houses behaved the same way as gold prices but because of the shared attitude from buyers. Gold is a traditional hedge against economic uncertainty. In the 1990s, people started buying homes when other investments seemed uncertain.

    Prior to 1995, the Federal Reserve kept secret their monetary policy objectives. Twenty years later, we know that they are using the federal funds rate to reach targets for the money supply. Technically, the federal funds rate is the rate at which the Federal Reserve would like banks to lend to each other (although the banks are free to charge each other whatever they want). Banks also use the federal funds rate as the basis for setting consumer interest rates, like mortgage rates. Real estate investments are sensitive to interest rate changes in very specific ways. The total impact of current events on home prices will come from the Federal Reserve, regardless of what happens in the stock market. When interest rates rise it makes expansion more expensive for businesses by raising their borrowing costs. When businesses don’t expand, neither does employment. In addition to the fact that homes with mortgages become affordable to a smaller portion of the population, the impact on jobs is another reason why rising interest rates would reduce the demand for homes.

    The gap between the mean- and median-priced homes was increasing across the country before the 2008 crisis, indicating that prices at the top of the scale were rising faster than the prices of more modest homes. The return of the home price gap to pre-1995 levels could have equalized affordability for middle-class Americans if income had followed suit. In addition to the poor employment outlook, fewer and fewer people will be able to afford the higher priced homes because the gap between mean- and median-income is rising faster than the home price gap is falling.

    Median and mean (average) home sales prices are for new homes sold in the U.S. where the sales price includes land. Data from www.census.gov. Median and mean (average) salary from www.census.gov (Table H-13).

    If the long-anticipated strengthening in the jobs market had appeared after the Great Recession, it could have made a real difference for middle-America. But so far, the employment recovery has not appeared. As weak job growth appeared in September, the previously encouraging July and August growth numbers were revised downward. The labor force participation rate declined, leaving only 59.2% of the population working. Population growth in the US is less than 1% per year but job growth is not keeping up with it.

    Month 2015

    Civilian Population Growth

    Employment Growth

    June

    199,362

    -56,000

    July

    205,661

    101,000

    August

    220,858

    196,000

    September

    233,715

    -236,000

    4-Month Total

    859,596

    5,000

    Civilian Population Growth based on population estimates from www.FactFinder.census.gov, Employment Growth based on number of persons employed from www.bls.gov.

    As long as the monthly payments on median-priced homes are out of reach for median-income households, demand in the middle-class housing market cannot strengthen. This is one more reason the Federal Reserve cannot afford to raise interest rates this year. That doesn’t mean that they won’t do; just that they shouldn’t – that don’t always do that smart thing.

    Housing photo courtesy of BigStockPhoto.com.

    Susanne Trimbath, Ph.D. is CEO and Chief Economist of STP Advisory Services. Dr. Trimbath’s credits include appearances on national television and radio programs and the Emmy® Award nominated Bloomberg report Phantom Shares. She appears in four documentaries on the financial crisis, including Stock Shock: the Rise of Sirius XM and Collapse of Wall Street Ethicsand the newly released Wall Street Conspiracy. Dr. Trimbath was formerly Senior Research Economist at the Milken Institute. She served as Senior Advisor on United States Agency for International Development capital markets projects in Russia, Romania and Ukraine. Dr. Trimbath teaches graduate and undergraduate finance and economics.

  • The Energy Election

    Blessed by Pope Francis, the drive to wipe out fossil fuels, notes activist Bill McKibben, now has “the wind in its sails.” Setting aside the bizarre alliance of the Roman Catholic Church with secularists such as McKibben, who favor severe limits of family size as an environmental imperative, this is a potentially transformational moment. 

    Simply put, the cultural and foreign policy issues that have defined U.S. politics for the past have century are increasingly subsumed by a divide over climate and energy policy. Progressive pundits increasinglyenvision the 2016 presidential election as a “last chance,” as one activist phrased it, to stop “climate change catastrophe.” As this agenda gets ever more radical, the prominence of climate change in the election will grow ever more obvious.

    The key here is that the green left increasingly does not want to limit or change the mix of fossil fuels, but eliminate them entirely, the faster the better. The progressive website Common Dreams, for example, proposes eliminating fossil fuels within five or six years in order to assure “reasonable margin of safety for the world.”

    This new militancy is a break from the recent past, when many greens embraced natural gas and nuclear power as practical, medium-term means to slow and even reverse greenhouse gas growth. But the environmental juggernaut, deeply entrenched within the federal bureaucracy and pushed by a president with seemingly limitless authority, is committed increasing to the systematic destruction of one of the country’s most important, and high-paying, industries. One goal is to demonize fossil fuel producers along the lines of the tobacco industry.

    The pope’s intervention has bolstered the tendency within the environmental movement not to allow any challenge to its own version of infallibility. This, despite discrepancies between some models of climate change and what has actually taken place.

    As we have moved from a rational discussion of the issue toward an increasingly dogmatic agenda, we have lost sight of more pragmatic, and less economically painful, ways to reduce greenhouse gases through methods such as conservation, the substitution of natural gas for coal, and a re-embrace of nuclear power. As the Breakthrough Institute has shown, most reductions in greenhouse gases in the United States have not come from subsidized renewable energy sources but instead from improved efficiency and the rise of natural gas at the expense of coal. Overall, solar and wind, the favorites of the greens, account for barely 1.35 percent of the world’s energy.

    The Breakthrough Institute’s pragmatism intends to create a middle ground between the left, which demonizes even the slightest criticism of green policy dogma, and the right, which equally mistakenly dismisses climate change as essentially a fabrication. But with the extremes in control of the debate, we can expect next year to mainly hear divisive discourse instead of solutions.

    The Geography of Energy

    In some parts of the country, most notably the Northeast and the West Coast, the imperatives of climate change demand the destruction of the fossil fuel industry. In others, those that depend the most on low-cost energy, the attack on fossil fuels represents a moral threat to local economies, jobs and well-being. The battleground will be in the Great Lakes, arguably the most critical region for the next election. Contrary to its sad sack image, the economy there has been on the rebound for years. Virtually every Great Lakes state except Illinois now enjoys unemployment rates below the national average. Several, led by the Dakotas, Minnesota, Nebraska, and Iowa, boast job rates that are among the nation’s highest. 

    Three key factors are propelling this comeback: an energy boom, a resulting jump in manufacturing, and relatively low housing costs. Energy firms have been a major source of new work for industrial firms, and lower electricity costs have provided U.S. manufacturers with an energy price advantage over European and Asian firms. German electricity prices, a result of their “green” energy policies, are almost three times the average of those in the United States.

    The administration’s directive to all but ban coal could be problematic for many Midwest states, including several—Iowa, Kansas, Ohio, Illinois, Minnesota and Indiana—that rank among those most reliant on coal for electricity. Not surprisingly, much of the opposition to the EPA’s decrees come from Heartland states such as Oklahoma, Indiana, and Michigan.  

    Politically, the energy-rich states running from Texas, Oklahoma, and Louisiana up to the Dakotas may be all but lost to the Democrats. Before the decline in oil prices, these areas enjoyed a gusher in energy jobs, providing high wage employment (roughly $100,000 annually) that exceeds compensation for information, professional services, or manufacturing. Due largely to energy, they have enjoyed the highest jobs growth since 2007 and were among the first states to gain back the jobs lost in the recession. 

    In contrast, the areas that form the solid base of the progressives—basically the Northeast and the West Coast—have an increasingly small stake in fossil fuel industries. California, which has the fifth largest oil reserves among the states, has basically decided to abandon the industry, gradually pushing the remnants of what was once a thriving sector out of the state.

    For the most part, with the notable exception of Pennsylvania, Northeastern states have little in the way of fossil fuels, and have gradually been eliminating much of their manufacturing base for over a half century. Nor do they have much need for electricity for industry as they continue to deindustrialize. Manufacturing accounts for barely 5 percent of state domestic product in New York and 8 percent in California—but 19 percent in Michigan and 30 percent in Indiana.

    Rise of the Climate-Industrial Complex

    Climate activists such as hedge fund billionaire Tom Steyer increasingly couch their policies on theological grounds, one reason why the pope’s intervention was so timely. Stark self-interest is also at work. Many of the Silicon Valley and Wall Street supporters of green policies have been among those most anxious to capitalize on big oil’s demise. 

    This includes cash-rich firms such as Apple, as well as many high-tech financiers and venture capitalists. Some of the biggest new fortunes, notably that of Elon Musk, are largely the creatures of subsidies. Neither SolarCity nor Tesla would be so attractive—and might even not exist—without generous handouts from taxpayers.

    In contrast to traditional manufacturers, capitalists like Musk have a well-developed interest  in taking advantage of the most draconian energy legislation. Other tech figures, including top executives atGoogle, have benefited from government-subsidized renewable energy schemes, including a remarkably inefficient and expensive solar project that has obliterated a huge part of the Mojave Desert. 

    No surprise, then, that the crony capitalists of Silicon Valley and their Wall Street financiers have emerged as primary funders of the green left. Much like the oil firms that help finance Republicans, particularly those who are climate change skeptics, the new oligarchs have solid business reasons to embrace the pontiff’s environmental dogma, though they seem unlikely to follow his admonitions to eschew corporate greed.

    Ironically, the new militancy among greens is likely to hurt most the poor and working class with whom Pope Francis takes pains to identify. A rapid ban on fossil fuels in the developing world would hurt efforts to increase access to electricity. Today, some 1.3 billion people  are off the grid, and not by choice. In sub-Saharan Africa, where much of the world’s population growth is expected to take place, roughlytwo-thirds of the population lacks regular access to electricity.

    As Bjorn Lomborg has pointed out, whatever the negative effects of climate change on the poor, the impact of no electricity and poor sanitation are infinitely greater. Climate change policies, he notes, are an inefficient way to accomplish such things as reducing malaria; the Kyoto Protocol’s carbon cuts could save 1,400 malaria deaths for about $180 billion a year. More traditional approaches could save 300,000 people for about $500 million year.

    Greens seem to have little idea what the poor want or need. When asked, people in developing countries prioritize such things as education, health care, job opportunities and better food; climate change ranked 16th—dead last on the list—according to a UN survey.

    But the green gentry retain their catechisms. Prince Charles embraces the “intuitive grammar” of ultra-dense slums such as Mumbai’s Dharavi, which, he claims, have perfected more “durable ways of living” than those in the suburbanized West.San Francisco’s Friends of the Earth  similarly applauds slum-dwellers as an “inspiration” for the low-carbon urban future, while Stewart Brand openly endorses the notion, “Save the Slums,” because they will save the planet.

    Needless to say, it’s unlikely these apostles of urban squalor would want their children to live like that and it is absurd to suppose that leaders of such emerging powers as India and China have any intention of giving up on their gains in reducing poverty. We cannot expect they will accommodate the passions of wealthy Westerners at the expense of their own people.

    A War on the Western Working Class?

    Those most likely to pay for the new green agenda will be middle- and working-class populations in what are now rich countries. Germany spends hundreds of billions of dollars on solar panels and wind turbines that provide only an unreliable 15 percent of its electricity and 3 percent of its total energy. German consumers pay three times more for electricity than the average American. It’s so bad that Germans have added a new term to the language: “energy poverty.”

    Perhaps the best test case for the impact of draconian climate policies is in my adopted home state of California. Here, high energy costs brought about by renewable mandates have devastated manufacturing growth and boosted electric bills, particularly in the poorer, and hotter, inland areas. Asone recent study found, the summer electrical bills in rich, liberal Marin come to $250 monthly while in impoverished Madera, the average is twice as high.

    Of course, energy policy is just one of the things raising poverty in a state where many of the world’s greatest fortunes are being minted. But it’s part of a climate change-driven agenda that is also somewhat responsible for the state’s absurdly high housing costs by consciously limiting affordable suburban growth. Overall, nearly a quarter of Californians live in poverty, the highest percentage of any state, including Mississippi, and, according to a recent United Way study, close to one in three are barely able to pay their bills.

    With the blessings of the pope and broad support in the media, few Democrats are likely to stand up against the green policies. Hillary Clinton’s shift against the Keystone XL Pipeline, despite strong union support for the project, shows that she is willing to trade blue-collar workers in the Heartland for the approval of the coastal gentry, among whom climate change has acquired something of a religious aspect. “Whether it’s eating vegetarian or wearing organic eye shadow, we’re all shopping for absolution,” observes Daniel Engber in Slate.

    Ultimately Democrats will embrace the determined attempt by President Obama to secure his “legacy” as the great calmer of the Earth’s climate. Yet there’s some question how effective these policies will prove. Invariably, efforts will follow to silence those skeptical of the current course, particularly regarding the economic impact on working-class voters. In California, Steyer and his allies have worked overtime to suppress any potential dissent from politicians who hail from the largely Latino, blue-collar districts hit most directly by these policies.

    Despite a massive investment in Latino “grassroots” front groups, as well as politicians, this effort is not foolproof. This month a handful of largely Latino and inland Democrats, some of them backed by the state’s residual energy industry, killed Jerry Brown’s attempt to force a 50 percent reduction in fossil fuel use by 2030, a measure that would have allowed the state impose gas rationing.

    To be sure, this rebellion may prove short-lived, as state regulators now seem determined to impose by decree what could not even make it through the state’s Democratic-dominated legislature. Steyer loyalists such as State Senate President Kevin de Leon will continue to mollify his impoverished constituents–nearly half of all households in his district earn less than $34,000 a year—with handouts from “cap and trade funds” and the ever illusive chimera of “green jobs.”

    In truth, if anyone has benefited from green policies and subsidies, it’s been the well-off.

    They are the ones who benefit from subsidized solar, electric vehicles, and fuel-efficient cars; a recent UC Berkeley study found the top fifth of households received 60 percent of these wealth transfers, compared to barely 10 percent of those in the bottom quintile. Generally speaking, barrio residents don’t drive $100,000 Teslas.

    So will climate change be an effective issue for the Democrats next year? There is room for skepticism. In 2014 Steyer and his acolytes spent some $85 million on “green” candidates, only to fail impressively. Geography and class work against their efforts, driving longtime working and middle-class Democrats, driving voters in places like Appalachia, the Gulf Coast and some areas of the Great Lakes increasingly out of the Democratic Party.

    It is not even certain that Millennials, faced with diminishing prospects for good jobs and home ownership, will prove reliable backers of a draconian climate agenda. One recent survey suggested that young voters are actually less likely to identify as “environmentalist” than previous generations. 

    Like extreme social conservatism on the right, climate change thrills the coastal “base” of the Democratic Party, but threatens to lose support from other parts of the electorate. Despite the duet of hosannas of both the hyper-secular media and the Bishop of Rome, a policy that seeks, at base, to reduce living standards may well not prove politically sustainable.

    This piece originally appeared at Real Clear Politics.

    Joel Kotkin is executive editor of NewGeography.com and Roger Hobbs Distinguished Fellow in Urban Studies at Chapman University, and a member of the editorial board of the Orange County Register. He is also executive director of the Houston-based Center for Opportunity Urbanism. His newest book, The New Class Conflict is now available at Amazon and Telos Press. He is also author of The City: A Global History and The Next Hundred Million: America in 2050. He lives in Orange County, CA.

    Midwest drilling rig photo by Bigstock.

  • China Catches Cold: What That Means For The Rest Of Us

    For the last century, one enduring cliché has been that when America sneezes, the world catches a cold. But now the big power with the sniffles is China.

    China’s rise has been the most profound development of the past half century, turning a moribund, rural country into a highly urbanized economic superpower. Hundreds of millions have been lifted out of poverty, and markets around the world reshaped. China alone accounted for a whopping 24.1% of global economic growth from 2003 to 2013. according to the IMF.

    This also means that when China stumbles, as it is now, the impact is widely felt. The current economic slowdown, and the government’s reaction to it, notably currency devaluation and possible controls of capital flight, could impact economies today much as American crises brought on a global depression in the 1930s and ushered in a global recession seven years ago.

    Some claim that China is headed toward a total financial meltdown. But it seems more prudent to assess the impact of China’s economic retreat with the caveat that this may be a short-term phenomenon, as the country showed remarkable resiliency through the recent global recession. However, in the short term, there are several categories of cities which may feel some downdraft from China’s slowdown.

    The Luxury Cities

    Outside of the stock market, probably the biggest impact of China’s swoon will be in real estate. Real estate and hospitality, mostly hotels, accounted for 65% of the $6.4 billion in U.S. investment by Chinese interests in the first half of 2015. Owning property is something of an obsession among Chinese, in part due to an instinctive distrust of the stock market. Despite all the attention paid by Western media to the Chinese stock market crash, only one in 30 Chinese own stock.

    Chinese have been investing heavily in overseas real estate now for a decade, and for the most part those investments are concentrated, not surprisingly, in what I call the “luxury cities,” wealthy global hubs where some Chinese also want to settle but historic returns also have been highest. This has been a major part of the outflow of capital from China, which has been accelerated by the perception of a weakening economy.

    But now there are indications that the Communist Party is ready to impose greater restrictions on private overseas investment, which could start slowing the outflow of funds into real estate, notes Mollie Carmichael, an analyst at John Burns Real Estate Consulting. This could upend economies in many parts of the high-income world.

    Globally the most popular cities for Chinese real estate investors are spread over a wide territory, including such places as Vancouver, Toronto, Australia’s Melbourne and Sydney, Singapore and London. Some experts are already warning of a crash in multi-family apartment across Australia. Each of these cities has a sizable Chinese minority. The huge Chinese investment in Vancouver began before the transfer of Hong Kong back to China from Britain, but the flow of money has continued in recent years.

    These impacts also will be felt in the United States, where Chinese rank second only to Canadians as real estate investors. Buyers from China, Hong Kong and Taiwan spent $22 billion on U.S. homes in the year ending March 2015, up 72% from the same period in 2013 according to the National Association of Realtors. But this surge may be coming to an end, particularly in coastal Southern California, the San Francisco Bay Area, New York and Hawaii, which have been favorites among of Chinese investors. John Burns reports an imminent decline in Chinese investment activity in Orange County, a hotbed for flight capital.

    These areas, not incidentally, have also been hotbeds of real estate inflation in the bubble era and again more recently. A slowdown in Chinese investment could halt, or even reverse, some of the big bets being made there. Of course, this could also be music to the ears of prospective new American investors, and homebuyers, who now do not have to deal with competition from Chinese investors.

    The Commodity Economy

    Some of the biggest impacts of China’s slowdown have been in commodities, notably oil, gas and food. As demand for these products decline, the impact on cities around the world that depend on this sector could be severe. This is most evident in the developing world, from Brazil to Nigeria to South Africa; a drop in Chinese investment, notes Brookings, could be disastrous for African countries that have grown to rely on capital from the Middle Kingdom.

    Also at risk are Canadian cities such as Calgary as well as Australian cities, notably Perth, that also have gotten rich selling raw materials to China. Australia, with an economy and population less than a 10th that of America’s, exports twice to the Middle Kingdom than the United States.

    Any slowdown in China will help undermine oil prices. None of this will be good for such places asHoustonOklahoma City and much of Louisiana, which are already hurting from supply competition with OPEC. Similarly a decline in farm prices, also related to China’s flagging demand, could hit such farm-oriented metropolitan areas as Omaha, Fargo and Minneapolis. The Great Plains, which has thrived from the commodity boom, could take a bit of a hit.

    Yet there’s good news here, particularly for American consumers and those in developing countries, whose food prices have eased. Low energy prices also could help “downstream” producers of oil products, such as refineries, petrochemical facilities and some pharmaceuticals companies. This, notes Houston economist Bill Gilmer, could actually help industrial parts of Houston, particularly along the ship channel, amidst negative impacts on businesses involved in energy exploration and development.

    The Industrial Sector

    China’s ascendency has been powered by its factories. Foreign companies that supply the high-end machinery that they use will be hurt, including many in Germany and Switzerland. Exports are already falling from South Korea, a manufacturing powerhouse increasingly dependent on China trade. This means trouble for Seoul, Munich and the Ruhr urban area. The Port of Hamburg, Germany’s largest, is already seeing a decline in its exports to China.

    Here in the United States, a slowdown could hurt companies like Caterpillar and John Deere, which have sent loads of earth-moving and other equipment to assist China’s massive building boom, as well as to developing countries who buy the equipment needed to meet Beijing’s once seemingly insatiable appetite.

    It would also hurt American centers of precision manufacturing such as Milwaukee and greater Detroit; last year Michigan exported $3.4 billion in machinery to China. The Wolverine States’exports to the Middle Kingdom have surged 1,500% since 2000, far outstripping gains in the rest of the world. Ohio, another bellwether industrial area, has seen the Chinese share  of its exports grow from 2% in 2000 to close to 8% last year. Small industrial towns like Peoria and agricultural equipment firms in places like Fargo could be threatened by a commodity decline. The impacts will be felt heavily on the West Coast as well, particularly around Seattle; some 20% of Washington’s exports go to China, led by aircraft.

    Some might see China’s decline as a harbinger of better times for American, Japanese or European producers, but the impact may be exactly the opposite. It may well be as well that Chinese companies, faced with a slowdown at home and not great prospects elsewhere, will redouble their efforts in the United States. This is already a concern in the U.S. steel industry, which sees Chinese devaluation and the oversupply of steel there leading to ever fiercer price competition.

    Some believe that a weakened China will open itself up to penetration by America’s highly advanced service sector. But this is certainly not the intention of the Chinese. Last year I visited Shenzhen’s Qianhai development, which by 2020, according to local authorities, anticipates attracting some $65 billion in investment, a working population of 650,000 people generating annual gross domestic product of around $25 billion. It is squarely aimed at the global service business and located in one of the world’s newer and most spectacular megacities.

    Rather than cede ground when under attack, the Communist Party seems headed back toward reliance on what they hope are streamlined state-owned companies and a massive new trillion yuan stimulus to spur demand; in other words, back to the future. They will likely continue to intensify their repression of domestic dissent.

    This will outrage those of us who believe in human rights and free markets. But China’s leaders may not be so concerned about the tender sensibilities of investment bankers, civil rights advocates, economists or the Western media. Their priority is maintenance of the regime, which depends on continued improvement of Chinese living standards. Whether we benefit or not is likely a matter of indifference to the leaders of a self-confident people now trying to establish their Asian preeminence, and could from that vantage point seek to become the No. 1 power in the world.

    This piece originally appeared at Forbes.

    Joel Kotkin is executive editor of NewGeography.com and Roger Hobbs Distinguished Fellow in Urban Studies at Chapman University, and a member of the editorial board of the Orange County Register. He is also executive director of the Houston-based Center for Opportunity Urbanism. His newest book, The New Class Conflict is now available at Amazon and Telos Press. He is also author of The City: A Global History and The Next Hundred Million: America in 2050. He lives in Orange County, CA.

    Photo of SEG Plaza electronics market by Bobbie Johnson, licensed under Creative Commons.

  • 500 Years of GDP: A Tale of Two Countries

    Last year (2014), China overtook the United States in gross domestic product adjusted for purchasing power (GDP-PPP, see point 4 for explanation), according to both the International Monetary Fund (IMF) and the World Bank (Note 1). It may come as a surprise, but this is really a matter of China simply reasserting its position as the world’s largest economy, which it had lost around 1890 to the United States. This is based on estimates developed by the late legendary economist Angus Maddison of the Organization for Economic Cooperation and Development (OECD).

    Over the 515 years from 1500 to 2015, the available data seems to suggest that the largest economy in the world almost always been either China or the United States. The one exception indicated was in 1700, when India had the highest GDP (for most years there is only incomplete data). This article provides highlights of GDP PPP data in US$2015 (Note 2), beginning less than a decade after Columbus "discovered America" and less than 70 years after the last great pre-Columbian Chinese sailing expedition, led by Admiral Zheng He. Maddison’s data is used and adjusted to 2015$ through 1970, with IMF data used for 1980 to 2015.

    Further, in the earlier years, virtually all nations had very low GDPs per capita. This was to begin changing with the industrial revolution. Thus, the early data can be characterized as being strongly related to population, because there was much less difference in GDP per capita based on level of development.

    1500: In 1500, China was the largest economy in the world, followed closely by India, both with estimated GDP’s of approximately $100 billion. France was a distant third at approximately 18 billion, followed closely by Italy and Germany. What is now the United Kingdom ranked 10th, at barely one quarter the output of France (Figure 1).

    1700: This was the only reported year between 1500 and 2015 that China or the United States did not lead the world. India had the strongest economy in 1700, closely followed by China. Throughout the entire period to the middle of the 20th century, China’s economy was larger than India’s by a relatively small margin. At the same time “the great powers” of the West were still well behind China and India, with France retaining third-place with a GDP less than one fourth that of China and 1/6 that of India. The United Kingdom was yet to break into the top five, ranking eighth (Figure 2).

    1820: By 1820, the next year for which full data is available, China resumed its lead and by a larger margin. India was second, slightly more than one half that of China. The United Kingdom finally appears, in third-place with a GDP one sixth that of China and only slightly ahead of France (Figure 3). The available data shows China to have retained the top position through 1870.

    1890: By 1890, the United States had emerged as the world’s largest economy, opening up an approximately five percent lead over China. India ranked third, followed by the United Kingdom and Japan (Figure 4).

    1930: By 1930, the ascendancy of the United States was clear. China, then reeling from social disorder and civil strife, still remained the second largest economy, but trailed the United States by approximately two thirds. There was little difference between China and the next three largest economies, Germany, the United Kingdom and India (Figure 5).

    1980: Half a century later, in 1980, the United States retained a similar lead, but now over second-ranked Japan. Germany was a close third, followed by Italy and France. India ranked ninth, approximately 30 percent ahead of 10th ranked China. Then the Deng Xiaoping era was getting underway (Figure 6), leading to China’s resurgence back towards the top.

    2010: China’s ascendancy was obvious by 2010, reaching within 20 percent of the United States, which remained number one. This had been a dramatic reversal, since China’s GDP had been little more than one tenth that of the United States only 30 years earlier (1980). India was also restored to a leadership position, ranking third. Japan was fourth and Germany was fifth (Figure 7).

    2015: The 2015 IMF projections show China to have recovered first-place after at least a 125 year hiatus. The United States was second, approximately four percent behind China. India, Japan and Germany remained in third, fourth and fifth place (Figure 8). The BRIIC developing nations are in the top 10, with Russia, Brazil and Indonesia ranking sixth through eighth (in addition to China and India in first and third place). Two other powers of Europe round out the top 10, the United Kingdom and France.

    Observations

    The impact of China’s difficult 19th century is indicated by a 10% GDP decline, despite an increasing population. It seems likely that this is at least partially attributable to the Opium Wars, treaty ports and related extraterritorial jurisdiction by external powers. China’s GDP in 1900 had fallen 10 percent from its 1820 level.

    It is notable that through much of their empire-colonial relationship between the United Kingdom and India, the colony had the larger GDP. This was the case from 1820 through 1900. This is principally due to the larger population of India. For example, in 1870, India’s GDP was one-third larger than that of the United Kingdom. In the same year, however, the UK GDP per capita was six times that of India.

    Similarly, while China’s GDP is larger than that of the United States in GDP, its GDP per capita is about one-fourth that of the US.

    Projections

    GDP projections produced for 2050, by PWC (Price Waterhouse Coopers) indicate that even more significant changes could be ahead. PWC expects China to have GDP of $61 trillion (US$2014). India is projected to be restored to its previous second place, at $42 trillion, just ahead of the United States ($41 trillion). BRIICs members Indonesia and Brazil would be 4th and 5th, while BRIICs Russia would be 8th. Mexico and Japan would follow Brazil, with Nigeria and Germany rounding out the top ten.

    If PWC is right, the dominance of China and the United States might be supplanted by the historically dominant duo of China and India. Of course, no one knows for sure. Forecasting economics is even harder than forecasting population.

    ——————–

    Note: All data is converted into 2015 international dollars using the US GDP implicit price deflator. US
    dollars are the basis of international dollars.

    Photo: Zheng He Park, Nanjing (by author)

    ——————–

    Wendell Cox is Chair, Housing Affordability and Municipal Policy for the Frontier Centre for Public Policy (Canada), is a Senior Fellow of the Center for Opportunity Urbanism (US), a member of the Board of Advisors of the Center for Demographics and Policy at Chapman University (California) and principal of Demographia, an international public policy and demographics firm.

    He is co-author of the "Demographia International Housing Affordability Survey" and author of "Demographia World Urban Areas" and "War on the Dream: How Anti-Sprawl Policy Threatens the Quality of Life." He was appointed to three terms on the Los Angeles County Transportation Commission, where he served with the leading city and county leadership as the only non-elected member. He served as a visiting professor at the Conservatoire National des Arts et Metiers, a national university in Paris.

  • Are-You-Better-Off: An Update

    Going into the silly-season of US Presidential campaigning, I want to get a head start on updating the “Are you better off today than you were four years ago?” discussion. In an April 2009 ng article, Rogue Treasury, I compared measures of our economic well-being before and after passage of the Emergency Economic Stabilization Act of 2008. Treasury assured Congress and the people that spending $700 billion would “ensure the economic well-being of Americans.” The Troubled Asset Relief Program (TARP) was going to save the American Dream of homeownership. The numbers showed a very different story. We were, in fact, largely worse off in the first six months after the bill passed. In the table below, I update the figures for May 2015.


    Before TARP

    So Far

    2015 Update

    National Unemployment

    7%

    8%

    5.5%

        Lowest state unemployment

    3.3% (WY)

    3.9% (WY)

    2.6% (NE)

        Highest state unemployment

    9.3% (MI)

    12% (MI)

    7.6% (CO)

    National Foreclosure rate (per 5,000 homes)

    11

    11

    5

        Lowest state foreclosure rate

    < 1 in 7 states

    < 1 in 6 states

    <1 in 4 states

        Highest state foreclosure rate        

    68 (NV)

    71 (NV)

    12 (FL)

    Dow Jones Industrial Average

    10,325

    7,762

    18,126

    “Before TARP” figures are as close to passage of the Bailout Bill (October 3, 2008) as possible; “So Far” figures vary slightly by category from February through April 2009. Unemployment and foreclosure rates by state were available at Stateline.org. The 2015 Update are May 2015 from RealtyTrac.com and BLS.gov.

    “Before TARP” figures are as close to passage of the Bailout Bill (October 3, 2008) as possible; “So Far” figures vary slightly by category from February through April 2009. Unemployment and foreclosure rates by state were available at Stateline.org. The 2015 Update are May 2015 from RealtyTrac.com and BLS.gov.

    Six years later, homeowners appear to be potentially better off even in the worst hit state, Nevada, where they can no longer claim the highest state foreclosure rate. That honor now belongs to Florida. But look at the other end – there are fewer states than ever in the category of having less than 1 foreclosure per 5,000 homes. In December 2006, there were 17 states with less than 1 per 5,000 homes. Nationally, foreclosures in May 2015 were about where they were in December 2006, before things got really bad but after foreclosures were already on the rise nationally – up 35% from the previous year. In December 2006, Florida was at about 6 foreclosures per 5,000 homes; the rate is double that now at 12. Nevada was at 13 in 2006 compared to about 10 now.

    National unemployment before the recession and all the bailouts and stimulus packages (2007 average) was 4.6% – we just are not seeing full recovery yet. Nebraska’s unemployment rate is a little lower now than the 2007 annual average of 3.0%. At the other end of the spectrum, Colorado’s May 2015 unemployment rate is 7.6%, still about double its rate of 3.8% from 2007. Where there is recovery, it is very, very uneven. The battle ground states in the 2012 Presidential election were Colorado (worse), Florida (worse), Michigan (better), and Nevada (better).

    Meanwhile, the rich got richer with TARP. The Dow Jones Industrial Average is up 75% above its pre-TARP level. This as it turns out, seems to be the point of TARP after all. Instead of helping citizens stay in their homes, TARP was used to bailout the banks by purchasing the mortgage-backed securities that weren’t backed by mortgages. After about a month of that, in November 2008, Quantitative Easing (QE) was used to buy the mortgage-related bonds and the TARP money was re-directed so the Fed could take ownership positions in financial institutions.

    By the way, just as we had pointed out in our January 2009 ng article Should We Bailout Geithner Too? a US Court ruled that the New York Fed did not have legal authority to take over a business. On June 15, 2015, Judge Thomas C. Wheeler ruled (in Starr International v. The United States, Case No. 11-779C) wrote: ‘there is nothing in the Federal Reserve Act or in any other federal statute that would permit a Federal Reserve Bank to take over a private corporation and run its business as if the Government were the owner’ the way they did with AIG. Judge Wheeler noted that the Fed’s own lawyers told them they were ‘on thin ice’ going forward with their plans.

    Here’s the bottom line: Legislation that was passed to support homeownership ended up supplying cash to banks both domestic and foreign. Between TARP and QE, the banks were able to sell all of their junk bonds to the government and use the extra cash to pad their reserve funds. More than half of the total money supply in the US is sitting in banks as excess reserves, earning 0.25% interest. That’s about $6.3 billion a year going to the banks on top of all the bailouts, loans, junk bond sales, etc. When the Fed decides to raise interest rates – my guess is February 2016 – the banks will be earning even more by holding on to the money they got from the Fed


    Data Source: http://www.federalreserve.gov/releases/h3/Current/, Table 2. Monthly August 2014 through June 2015, then bi-weekly from July 8 through September 2, 2015.

    Banks are using their excess reserves to run up the value of the stock market through overnight lending and investments. These are short-term investments – overnight is very short term! They are not the kinds of investments that create jobs or make homeowners better off. They are, however, the kinds of investments that make bankers better off. They also add to the wild swings you see in the Dow Jones Industrials Average (volatility).

    Richard Nixon was quoted by a British newspaper in 1987 as saying that if the economy turns down, “a jackass” could be elected on the Democratic ticket.* As the 1988 presidential election approached, the US had just completed 6 years of economic expansion and the unemployment rate was 5.3%. George H.W. Bush (R) won the White House over Michael Dukakis (D) with 426 electoral votes to 111. In November 2008, the banks got the biggest bailouts in history while the nation and the world were entering the Great Recession. Barack Obama (D) beat out John McCain (R) by 365 to 173. If the banks keep going the way they have been, it could be very good news for some jackass running to extend the Obama economy … and bad news for the rest of us.

    *Cited in ‘A New Political Picture’ by Tom Wicker, New York Times, 22 October 1987, p. A35.
    Susanne Trimbath, Ph.D. is CEO and Chief Economist of STP Advisory Services. Dr. Trimbath’s credits include appearances on national television and radio programs and the Emmy® Award nominated Bloomberg report Phantom Shares. She appears in four documentaries on the financial crisis, including Stock Shock: the Rise of Sirius XM and Collapse of Wall Street Ethicsand the newly released Wall Street Conspiracy. Dr. Trimbath was formerly Senior Research Economist at the Milken Institute. She served as Senior Advisor on United States Agency for International Development capital markets projects in Russia, Romania and Ukraine. Dr. Trimbath teaches graduate and undergraduate finance and economics.

    Wall Street photo by flickr user Manu_H.

  • Is Owning A Car Too Expensive?

    Many analysts—usually planners—have been regularly offering a wealth of exhortations concerning how uneconomical it is to purchase, operate and maintain a private car. Is this a valid assertion of a household economic burden? And what is the likelihood that the advice will ultimately prove useful? Household economic decision-making varies greatly, depending principally upon income levels, personal circumstances, and preferences. A single mother with children, or a part-time worker, will make transport choices for radically different reasons than a management executive. With their priorities already set, each of these individuals has little use for generic advice; it is either unhelpful or irrelevant to them.

    Such advice often crops up in planning-related journals or web sites. Given that laypeople are unlikely to read these sources, however, the efforts may be largely wasted.

    Underlying the production of advice is the presumption that households need it. In theory, consumers can be unaware of costs in certain cases, for example, if a product is relatively new or not universally used, such as e-cigarettes.

    This could hardly apply to households and the car market. There are 828 cars per 1000 people in the US; 620 in Canada. Even more telling is market participation by households, as shown by the blue bars in Chart 1, below. By 2012, only about 9% of households did not own a vehicle, compared to over 20% in 1960. These figures speak of a large majority of households in the car market. As for households that opted not to own a car, their absence from the market may be due, at least partly, to their knowledge of the costs.

    Chart 1 Source: Oak Ridge National Laboratory; Transportation Energy Data Book. Table 8.5.

    If knowledge is not at issue, the question becomes whether households manage their expenses on this item prudently, or if they could use expert advice to do so.

    Advice on how to manage household transportation expenses is, evidently, also unnecessary. Statistics on household expenditures leave little doubt that households manage their transportation budgets surprisingly well. Consumer surveys show that among all income quintiles, with total household expenditures ranging from about $31,000 to five times that ($155,000), the percentage allocated to transportation is fairly constant – around 15% (Chart 2). The only exception is found among the highest quintile, which may simply be indicative of higher disposable incomes. (We hope readers will be lenient about our use of statistics from multiple countries. The intent is to show trends, rather than report on the specifics of a chosen country.)

    Not only is the mid-teen figure constant across different income groups, it is also constant across countries. The European Union, for example, reports 13.0% and 13.2% all across the EU (excluding its newest members). It is hard to interpret this consistency as anything other than an ability to control transportation costs in a way that meets a household’s needs and budget, particularly when seen in juxtaposition to the expenditure on shelter.

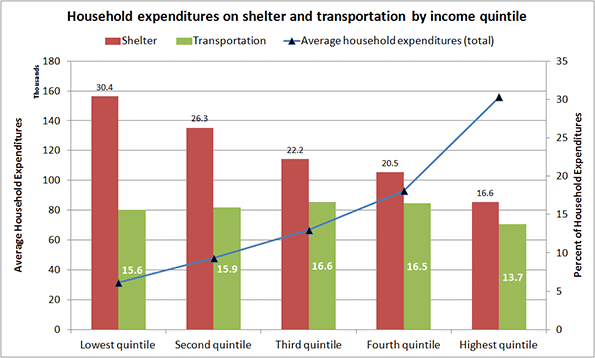
    Chart 2 Source: Statistics Canada, Survey of Household Spending. Table 2: Budget Shares Of Major Spending Categories By Income Quintile, 2012.

    This consistency of the transportation expense at all income levels is intriguing and instructive.Researchers have suggested that it represents a universal constant. Regardless of its universality, it indicates the adaptability people demonstrate in controlling this expense. This adaptability ranges from choosing the means of transport (foot, bike, transit, car or rail), their level of effort, the time they are willing to spend traveling, and their flexibility in reaching destinations.

    For example, public transport lowers costs, but is generally slower than a car (Chart 3). In 2005, 21% of drivers recorded a 90+ minute round trip as opposed to three times that (64%) reported by transit riders. As might be expected, public transport users are predominantly lower quintile households that trade cost for time (Chart 4).

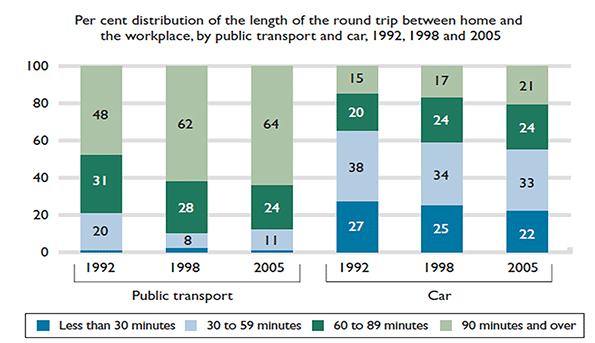
    Chart 3 Source: Statistics Canada, General Social Survey, Trip Duration, 1992, 1998, and 2005.

    Choosing the mode of transport is one path to controlling costs, and certain households are clearly doing so. As the chart below shows, about 75% of bus riders (adding the first three bars) earn up to $50,000 a year, a lower-rank quintile income. Riding the bus is a conscious choice, as percentages of riders of other income brackets suggest, but for the 75% it may also be an economic necessity.

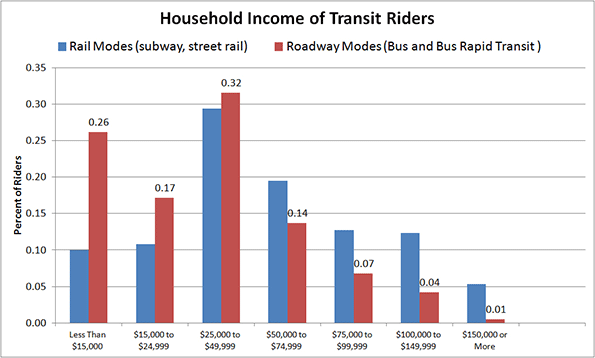
    Chart 4 Source: American Public Transportation Association, A Profile of Public Transportation Passenger Demographics and Travel Characteristics, 2007.

    Other options in controlling transportation costs include walking and bicycling where possible, accessing the second-hand car market, and choosing other motorized transport.

    One good example of ‘other’ motorized transport is motor scooter ownership in developing nations, and in certain industrialized countries. In Taiwan, for example, “….Scooter is the primary mode of transport on this densely populated island – there are about 15 million for 23 million citizens.” Such wide-spread dependence on scooter-based motorized mobility correlates well with its cost and the per capita GDP of its users. Italy, for example, tops the EU in scooter/motorbike ownership. It may not be pure coincidence that it also has one of the lowest GDPs per capita among EU nations.

    The resale market for cars in the US outstrips the new car market by about one to three (Chart 5). Not only is the market large but also, significantly the average cost of a pre-owned car is generally about half its original price.

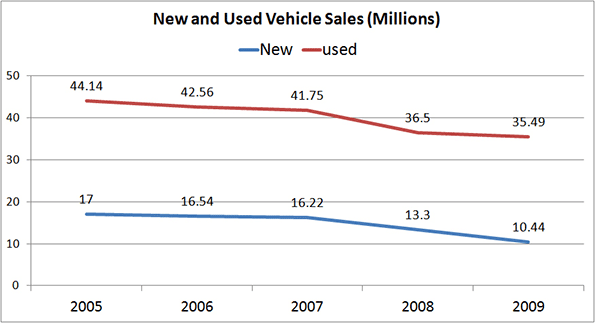
    Chart 5 Source: NIADA’s Used Car Sales Industry Report; Relative Size of Car Markets for New and Used Cars, 2010.

    The size of the resale market demonstrates yet another means by which consumers—particularly the lower quintile households— seek and grasp the opportunity to control car-related costs. As is evident from Chart 6, three of the five quintiles limit their new car purchases extensively; an overwhelming majority of consumers (averaging 77%) buy used cars. That figure reaches about 81% among the lowest quintile households.

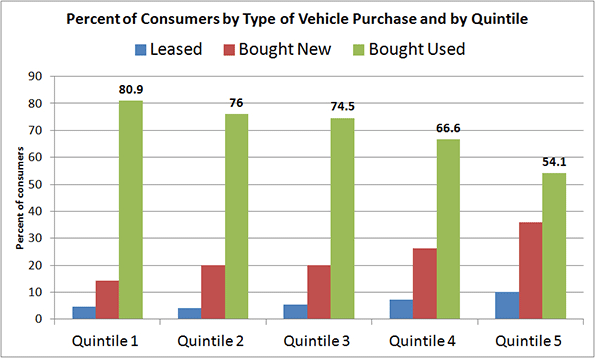
    Chart 6 Source: Laura Paszkiewicz, The Cost and Demographics of Vehicle Acquisition, Consumer Expenditure Survey Anthology, 2003 (61) Division of Consumer Expenditure Surveys, US Bureau of Labor Statistics.

    Not only does the resale market allow for control of a buyer’s initial investment, but segments within the market further enhance that ability. As Chart 7 shows, the price differential between a private sale and that from a franchised dealer can range from double to triple.

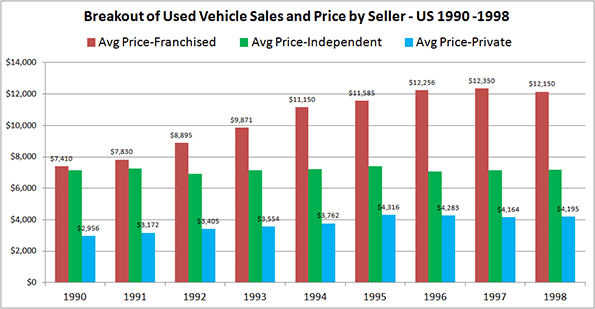
    Chart 7 Source: The Used Vehicle Market in Canada, DesRosiers Automotive Consultants Inc., 2000.

    The twentieth century saw momentous change and variety in the means of transport, both personal and collective. All new entries except bicycles are motorized, and were unimaginable a mere century earlier. The previous means of transportation — horse-dependent — lasted for at least forty centuries, during which collective transport was non-existent. Motorized personal transport is just one instance in a trend of displacing muscle-dependent activities with motor-driven ones (such as climbing stairs being supplanted by using elevators). The change has been astonishing, unusually fast, and, judging by the plethora of articles on the topic, a cause for concern to some.

    Statistics and examples so far allow us to draw at least one indisputable conclusion: Households do know their transportation costs, and adjust their expenditures according to their needs and budget by taking advantage of available opportunities. It would appear that there is little need for guidance on either front.

    Fanis Grammenos heads Urban Pattern Associates (UPA), a planning consultancy. UPA researches and promotes sustainable planning practices including the implementation of the Fused Grid, a new urban network model. He is a regular columnist for the Canadian Home Builder magazine, and author of Remaking the City Street Grid: A model for urban and suburban development. Reach him at fanis.grammenos at gmail.com.

    After twenty-four years at Canada Mortgage and Housing Corporation, Tom Kerwin now leads an active volunteer life, including being the Science and Environment Coordinator for the Calgary Association of Lifelong Learners. He holds a Master’s degree in Environmental Studies from York University.

    Special thanks to Luis Rodriguez for collaborating in shaping this article.

    Flickr photo by promich: Car Town, a used car lot in Chicago.