Category: Economics

  • The Decline of the Midwest, the Rise of the South

    The New York Times ran an article recently that’s nominally about football, but really gives insight into the decline of the Midwest and the rise of the South. Called “As Big Ten Declines, Homegrown Talent Flees,” this piece ties in perfectly with my recent essay on the differing social states of the Midwest and South. The NYT’s money quote says it all:


    The SEC sold excellence. The Big Ten sold tradition.

    Ironically, it is the formerly stigmatized “backwoods” South that has embraced excellence while the former industrial champion of the Midwest has spurned it. I don’t think that Midwesterners understand how much things have changed in the South. I hear the same stereotypical view of the South that might have had a lot of truth decades ago but have changes substantially. For example, those who think it is both a good thing and bad have quipped that Indiana is like an extension of the South into the Midwest. I don’t think so.

    For example, Charlotte built a light rail system. Dallas has poured a billion dollars into a downtown arts district. Atlanta has a multi-billion infill strategy around its former Belt Line railroad. Nashville eliminated downtown parking minimums and implemented a form based code. South Carolina has its German style apprenticeship program. North Carolina built Research Triangle Park – in 1959. Southern cities like Atlanta have proudly claimed and built success around their black heritage. And Charlotte’s Chamber of Commerce CEO said, “To understand Charlotte, you have to understand our ambition. We have a serious chip on our shoulder. We don’t want to be No. 2 to anybody.” Outside of Chicago, does anybody in the Midwest talk like that?

    Sure, there are bits and pieces here and there in the Midwest that speak to excellence. But they are the anomalies in a region that has retrogressed. Whereas in the South they’ve massively elevated their game in the last 40 years and are working hard to keep getting better. Sure, low costs and taxes play a role in their success. Climate and the universality of air conditioning as well. But they aren’t content to rest on just that. They want to get better. Meanwhile the Midwest is regressing towards what the South used to be such as, for example, by turning paved roads back to gravel because they can’t afford the maintenance.

    The NYT piece brings up an interesting factor driving the rise of the SEC vs. the Big Ten, namely the shift in underlying population ratios over time: “An instructive comparison is Michigan and Georgia. In 1960, Michigan had twice Georgia’s population; in 1990, it was nearly one and a half times as big; today, their populations are roughly equivalent.”

    The decline in Midwest population and economic heft brings with it a price that has to be paid. It’s showing up in the football world today. But it’s sure to hit the academic prowess of the Midwest’s major state schools as well. How long can these places maintain their relative rankings of excellence without the financial firepower to play in the big leagues? There’s more inertia on the academic side, but don’t think it won’t eventually happen here as well. The same is true in many other aspects of civic life. Even mighty Chicago has nearly bankrupted itself in its efforts to keep up with other global cities.

    The Big Ten obviously saw the writing on the wall and decided to expand outside the region. I dislike this for reasons of, naturally, tradition. But it’s a rational response to a declining marketplace. Similarly, the Cleveland Orchestra established a Miami residency in the pursuit of cash to keep its artistic excellence intact. Might some of these institutions at some point become Midwest in name only? Time will tell.

    Not everyone agrees with the idea that the SEC vs. Big 10 comparison is a relavent proxy, basically saying that it’s ludicrous to say that football proves anything. I don’t think that it does. But I will make three points:

    1. The differing fortunes of the two conference is yet another in an extremely long series of data points and episodes that demonstrate a shift in demographic, economic, and cultural vitality to the South.
    2. Sports is one of the many areas in which Midwestern states have clung to traditional approaches, even though those approaches haven’t been producing results.
    3. Demographic and economic changes have consequences. It’s not realistic to expect that the Midwest’s excellent institutions will necessarily be able to retain excellence when supported by hollowed out economies.

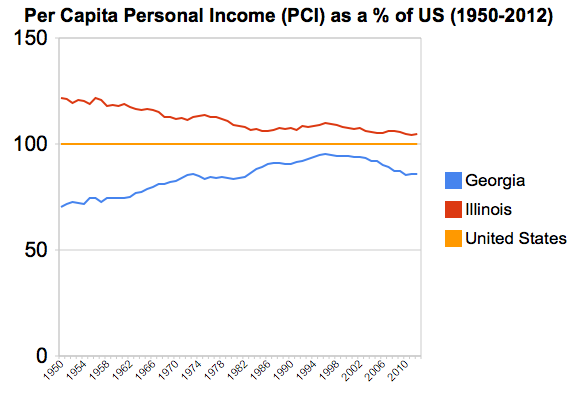
    I’d like to throw up a couple of charts to illustrate the longer term trends at work. The first is a comparison of per capita personal income as a percent of the US average for Illinois vs. Georgia since 1950:


    il-vs-ga

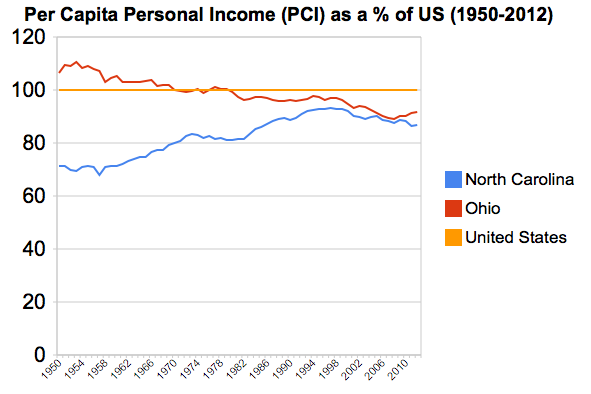
    Here’s the same chart of Ohio vs. North Carolina:


    oh-vs-nc

    If I put up the population or job numbers, the same charts would show the South mutilating the Midwest. (Indiana, Georgia, and North Carolina were all about the same population in 1980, but the latter two have skyrocketed ahead since then for example). What’s more, the South’s major metros score better on diversity and attracting immigrants than the Midwest’s major metros as a general rule.

    These charts show the convergence in incomes over time. The decline in relative income of the Midwest is possibly in part to increases elsewhere, not internal dynamics. But think about what the Midwest looked like in 1950, 60, or 70 vs the South, then think about it today and it’s night and day. The Midwest may still be endowed with better educational and cultural institutions than the South, but we can see where the trends are going. Keep in mind that those things are lagging indicators. Chicago didn’t get classy until after it got rich, for example.

    Now we see that Southern income performance hasn’t been great since the mid to late 90s. This is a problem for them. As is their dependence on growth itself in their communities. I won’t claim that the South is trouble free or will necessarily thrive over the long haul. But they seem to have a clearer sense of identity, where they want to go, and what their deficiencies are than most Midwestern places.

    Richard Longworth seems to buy the decline theory but has a different explanation of the source, namely that Chicago has sucked the life out of other Midwestern states:

    In the global economy, sheer size is a great big magnet, drawing in the resources and people from the surrounding region. We see this in the exploding cities of China, India and South America. We see it in Europe, where London booms while the rest of England slowly rots.

    And we see it in the Midwest where, as the urbanologist Richard Florida has written, Chicago has simply sucked the life – the finance, the business services, the investment, especially the best young people – out of the rest of the Midwest.

    To any young person in Nashville or Charlotte, the home town offers plenty of opportunities for work and a good life. To any young person stuck in post-industrial Cleveland or Detroit, it’s only logical to decamp to Chicago, rather than to stay home and try to build something in the wreckage of a vanished economy.

    This seems to be a common view (see another example), even in the places that would be on the victim side of the equation. But I’ve never seen strong data that suggests this is actually the case. Are college grads and young people getting sucked out of the rest of the Midwest into Chicago?

    Thanks to the Census Bureau, we now have a view, albeit limited, into this. The American Community Survey releases county to county migration patterns off of their five year surveys sliced by attribute. There seems to be some statistical noise in these, and for various reasons I can’t track state to metro migrations, but thanks to my Telestrian tool, I was able to aggregate this to at least get metro to metro migration. So here is a map of migration of adults with college degrees for the Chicago metro area from the 2007-2011 ACS:


    degree-migration
    Net migration of adults 25+ with a bachelors degree or higher with the Chicago metropolitan area. Source: 2007-2011 ACS county to county migration data with aggregation and mapping by Telestrian

    This looks like a mixed bag to me, not a hoover operation. What about the “young and restless”? Here’s a similar map of people aged 18-34:


    ya-migration
    Net migration of 18-34yos with the Chicago metropolitan area. Source: 2006-2010 ACS county to county migration data with aggregation and mapping by Telestrian

    This is an absolute blowout, with a massive amount of red on the map showing areas to which Chicago is actually losing young adults. Honestly, this only makes sense given the well known headline negative domestic migration numbers for Chicago.

    I do find it interesting that there’s a strong draw from Michigan. Clearly Michigan has taken a decade plus long beating. There’s been strong net out-migration from Michigan to many other Midwestern cities during that time frame, and its the same in Cleveland, which also took an economic beating in the last decade. This is just an impression so I don’t want to overstate, but it seems to me that a disproportionate number of the stories about brain drain to Chicago give examples from Michigan. Longworth uses the examples of Detroit and Cleveland. These would appear to be the places where the argument has been truly legitimate, but that doesn’t mean you can extrapolate generally from there.

    What’s more, even if a young person with a college degree does move to Chicago from somewhere else, will they stay there long term? They may circulate out back to where they came from or somewhere else after absorbing skills and experience. It’s the same with New York, DC, SF, etc. I’ve said these places should be viewed as human capital refineries, much like universities. That’s not a bad thing at all. In fact, it’s a big plus for everybody all around. Chicago is doing fine there. But it’s a more complex talent dynamic than is generally presented, a presentation that does not seem to be backed up by the data in any case.

    Aaron M. Renn is an independent writer on urban affairs and the founder of Telestrian, a data analysis and mapping tool. He writes at The Urbanophile, where this piece originally appeared.

    Photo courtesy of BigStockPhoto.com.

  • Opportunity Urbanism: Creating Cities for Upward Mobility

    This is the introduction to a new report commissioned by the Greater Houston Parnership and HRG and authored by Joel Kotkin with help from Tory Gattis, Wendell Cox, and Mark Schill. Download the full report (pdf) here.

    Over the past decade, we have witnessed the emergence of a new urban paradigm that both maximizes growth and provides greater upward mobility. We call this opportunity urbanism, an approach that focuses largely on providing the best policy environment for both businesses and individuals to pursue their aspirations.

    Although contrary to much of the conventional wisdom about cities and regions, this is not a break with traditional urbanism, but instead a reinforcement of old traditions. Long ago, Aristotle reminded us that the city was a place where people came to live, and they remained there in order to live better. “A city comes into being for the sake of life, but exists for the sake of living well.”  In the end, opportunity urbanism rests on the notion that cities serve, first and foremost, as engines to create better lives for its residents.

    The Houston and Luxury Models

    We have focused on the Houston metropolitan area because in many ways it reflects the idea of opportunity urbanism more closely than any major metropolitan area. Across a broad spectrum—income growth, new jobs, housing starts, population growth and migration—no other major metropolitan region in the country has performed as well over the past decade. This was among the first major metropolitan regions to replace the jobs lost in the recession, and has experienced by far the largest percentage job growth since, with Dallas-Ft. Worth second.

    In many ways, opportunity urbanism contrasts with the prevailing urban planning paradigm—variously called new urbanism or smart growth—which seeks to replicate the dense, highly concentrated mono-centric city of the past. At the core of this approach is the notion that policies of forced density, through regulatory mandates and often subsidies, are critical to attracting both young, educated people and the global business elite.4 This approach describes the successful city, in the words of former New York Mayor Michael Bloomberg, as “a luxury product.”

    This notion of the “luxury city” can be seen to have worked, at least for some, in well-appointed older cities such as New York, San Francisco and Boston. Unlike most American cities, these boast long-established dense cores and transit-oriented commuter sheds. They possess great amenities tied to their past, from world class art museums and universities, to charming historic districts, parks and public structures.

    But this model of urbanism does not fit the profile of most American metropolitan regions, which tend to be far more recent in their development, more dispersed and overwhelmingly auto-dominated in terms of commuting. Indeed, most of the fastest growing regions in this country—Houston, Dallas-Ft. Worth, Oklahoma City or Atlanta—function in a highly multi-polar model, that contrasts sharply with that of cities like New York, Boston or Chicago.

    Prospects for Upward Mobility

    The luxury paradigm has worked for some in some cities, but has failed, to a large extent, in providing ample opportunities for the middle and working classes, much less the poor. Indeed, many of the cities most closely identified with luxury urbanism tend to suffer the most extreme disparities of both class and race.

    If Manhattan were a country, it would rank sixth highest in income inequality in the world out of more than 130 countries for which the World Bank reports data. New York’s wealthiest one percent earn a third of the entire municipality’s personal income-almost twice the proportion for the rest of the country.

    Indeed, increasingly, New York, as well as San Francisco, London, Paris and other cities where cost of living has skyrocketed—are no longer places of opportunity for those who lack financial resources. Instead they thrive largely by attracting people who are already successful or living on inherited largesse.

    They are becoming, as journalist Simon Kuper puts it, “the vast gated communities where the one percent reproduces itself.”  

    Not surprisingly, the middle class is shrinking rapidly in most luxury cities. A recent analysis of 2010 Census data by the Brookings Institution found that the percentage of middle incomes in metropolitan regions such as New York, Los Angeles and Chicago has been in a precipitous decline for the last thirty years, due in part to high housing and business costs. A more recent 2014 Brookings study found that these generally high-cost luxury cities—with the exception of Atlanta—tend to suffer the most pronounced inequality: San Francisco, Miami, Boston, Washington DC, New York, Chicago and Los Angeles. Income inequality has risen most rapidly in the very mecca of luxury progressivism, San Francisco, where the wages of the poorest 20 percent of all households have actually declined amid the dot com billions.

    Like other large cities, Houston also suffers a high level of inequality, but its lower costs have helped its middle and working class populations to enjoy a higher standard of living than their luxury city counterparts. The promise of the opportunity urbanism model also can be demonstrated by lower income disparities between racial groups, higher GDP growth, less expansion of poverty and the greater production of high-paying mid-skilled jobs. In these aspects, opportunity cities like Houston greatly out-performed their often more celebrated rivals.

    How to Measure “Living Well”

    We leave this introduction with one statistic that most encompasses the success of the Houston opportunity model and exposes the weakness of smart growth: the cost-of-living adjusted average paycheck.

    Despite the assertions of Paul Krugman, among others, that the Texas urban economy is based on low wages, the fact is Harris County’s average household income is above the national average; close to that of Boston. But once the cost of living is factored in, Houston does far better for its citizens compared to any of the legacy cities. Houston, with Dallas-Ft. Worth a strong second, is able to provide its citizens the highest standard of living, as measured by average annual adjusted wages, of any major metro in America. This is different than subjective “quality of life,” but includes such basics as jobs, housing and overall cost of living.

    Download the full report (pdf) here.

    Joel Kotkin is executive editor of NewGeography.com and Roger Hobbs Distinguished Fellow in Urban Studies at Chapman University, and a member of the editorial board of the Orange County Register. His newest book, The New Class Conflict is now available at Amazon and Telos Press. He is author of The City: A Global History and The Next Hundred Million: America in 2050. His most recent study, The Rise of Postfamilialism, has been widely discussed and distributed internationally. He lives in Los Angeles, CA.

  • The Cities That Are Benefiting The Most From The Economic Recovery

    It is painfully clear that the current U.S. economic recovery has been a meager one, with the benefits highly concentrated among the wealthiest. The notion that “a rising tide” lifts all boats has been sunk, along with the good ship middle class.

    Geographically as well, the recovery has been concentrated in a relative handful of regions. Nationwide, real per capita GDP rose a meager 3.8% from 2010 through 2013, according to new Bureau of Economic Analysis numbers. An analysis of the data by urban expert Aaron Renn shows that a handful of metropolitan areas have enjoyed much faster growth. For the most part, these are areas that have cashed in on the current technology or energy booms, and in some cases, both. Also, surprisingly, there have been some very good gains in some of the nation’s long-distressed industrial heartland metro areas, as the combination of energy development and a resurgent automobile industry have boosted regional GDP.

    Tech Capitals

    Of the nation’s 52 largest metropolitan statistical areas, many of the top performers have strong tech economies, led by the No. 2 metro area on our list, San Jose-Sunnyvale-Santa Clara, aka Silicon Valley, where real per capita GDP expanded 11.5% from 2010-13. Perhaps more surprising is the strong, tech-fuelled performance of No. 3 Portland-Vancouver-Hillsboro, Ore., where real per capita GDP grew 9.2%. The prime contributor has been the robust performance of late of Intel, the state’s largest private employer, which employs about 17,000 in Portland’s western suburbs around the town of Hillsboro, the company’s largest concentration of workers anywhere.

    Other less heralded tech centers have also performed well, including No. 4 Columbus, Ohio (8.2% growth), and No. 8 Salt Lake City (7.3%), both of which are also benefiting from the surge in oil and gas production. Among smaller cities with strong tech communities, Fargo, N.D., and Provo-Orem, Utah, have enjoyed better than 10% real per capita GDP growth since 2010.

    Energy Regions

    Per capita growth in the energy states has been even more impressive. Placing first on our big cities list is Houston-the Woodlands-Sugarland, Texas, where per capita GDP rose 13.2% from 2010-13, a major achievement in a region whose population continues to grow rapidly. Zooming out to all 381 U.S. MSAs, no places come close to the two Texas oil towns that rank first and second overall, Midland (sizzling 38.8% growth since 2010) and Odessa (34.1%). Both lie in the Permian basin, an oil-rich geological formation that was first tapped in the 1920s and has seen a marked revival in production recently due to advances in extraction techniques like horizontal drilling and fracking. Also notable, the southern Texas town of Victoria clocked over 21% growth.

    Among the largest metro areas, energy hubs also did well, including Oklahoma City (7th, 7.5%) and Dallas-Ft. Worth-Arlington (13th,  6.5%) and the San Antonio area (16th), which is benefiting from a gusher in the Eagle Ford Shale play. Economist estimate its development has pumped $87 billion into the south Texas economy.

    Rust Belt Revives

    The booms in tech and energy are well-known. But the most surprising wrinkle in our survey of per capita GDP growth is the revival of auto manufacturing, which benefits both from technological improvements and lower energy costs. Among the larger metro areas, the key winners have been Grand Rapids-Wyoming (fifth, 7.8%) and Detroit (tied for ninth, 7.2%), as well as the surprising 15th place ranking for Cleveland-Elyria.

    These gains are heartening, but the real question may be how long this will continue. In part, the strong 2010-13 numbers reflect a recovery from very poor economic performance that has stretched on for decades, and population losses, which tend to skew per capita GDP numbers upwards. But signs of health in the nation’s long disdained midsection deserve applause.

    Surprising Laggards

    The recovery has not lifted most regions, just as it has not helped most Americans. Per capita income growth has been slow in most of the nation’s largest cities outside Texas. Given the enormous financial bailout from the federal government, as well as the massive spike in stock and real estate prices, one would have expected far better performance from New York, which ranks a middling 33rd out of the 52 largest MSAs, with below average 2.3% growth since 2010.

    Chicago-Naperville-Elgin ranked 26th; Los Angeles-Long Beach-Anaheim, 38th, and  Philadelphia, 40th. Perhaps the biggest disappointment is 51st place Washington D.C.-Arlington-Alexandria, which had been a high-flier through the Recession amid strong federal spending. Per capita GDP since 2010 has fallen 3.4%. This disturbs some pundits, such as Richard Florida, but no doubt Washington’s fall from grace would be widely welcomed by most Americans.

    And What About Poverty

    Increasingly, many question not only the relative lack of growth, but that the growth we are experiencing is doing very little for the vast majority of Americans. Former Clinton adviser Bill Galston has noted that this recovery has “left almost everybody” out.

    No group has been harder hit than the poor. The nation’s population below the poverty line has expanded a full percent since 2010. An analysis by demographer Wendell Cox shows that poverty declined in just seven of the nation’s 52 largest metropolitan areas from 2010-13: Louisville, Ky.; Oklahoma City; Nashville, Tenn.; Columbus Ohio; Grand Rapids; and Texas’ Austin and San Antonio.

    Most of the areas with the strongest growth in per capita GDP posted smaller than average increases in poverty. In Houston the share of the population living in poverty rose 0.6% from 2010-13 to 16.4%, 11th highest among the nation’s biggest metro areas.

    The results in California suggest strongly that the tech boom has not done much to relieve poverty in the Golden State, despite the much ballyhooed “California comeback” trumpeted by the likes of Paul Krugman. In reality it’s poverty, not prosperity, that’s on the march in most California cities outside the Bay Area. Since 2010, the percentage of the population of San Diego living in poverty has grown 1.3% to 15.2%, while that of Riverside-San Bernardino rose 1.7% to 18.2%, the third highest rate among the 52 largest metro areas in the country. Meanwhile the poverty rate in Los Angeles, the state’s dominant urban region, has risen 1.8% to 17.6% (fifth worst), and Sacramento, the state capital, has seen a 2.0% increase in poverty to 16.6% (10th).

    This suggests that, for the most part, what has passed for growth has been too meager to reduce poverty. In many places, even ones growing rapidly, such as the Silicon Valley hub of San Jose, the number of poor continue to increase. Since 1999, poverty in the valley has jumped  from 7.6% to 10.5%. This also likely is a low figure, given the extraordinarily high cost of living in the Bay Area, as well as the rest of coastal California. According to the Census Bureau, California’s poverty rate is the highest in the nation when adjusted for the state’s exorbitant cost of housing.

    For the most part, poverty has been reduced, or at least has grown less, in lower-cost regions that have ties to the energy and manufacturing revival, which tend to create opportunities for middle- and working-class residents. Until we figure out how to get growth whose benefits are widely shared, and reduce poverty, the one measurement likely to go up is cynicism about the efficacy of our current economic policies.

    Real Metropolitan Area GDP Per Capita (2010-2013)
    Rank Metropolitan Area 2010 2013 2010-2013 Change
    1 Houston-The Woodlands-Sugar Land, TX  $  63,816  $    72,258 13.2%
    2 San Jose-Sunnyvale-Santa Clara, CA  $  89,806  $  100,115 11.5%
    3 Portland-Vancouver-Hillsboro, OR-WA  $  63,025  $    68,810 9.2%
    4 Columbus, OH  $  50,370  $    54,493 8.2%
    5 Grand Rapids-Wyoming, MI  $  41,248  $    44,482 7.8%
    6 Charlotte-Concord-Gastonia, NC-SC  $  51,819  $    55,802 7.7%
    7 Oklahoma City, OK  $  45,993  $    49,441 7.5%
    8 Salt Lake City, UT  $  57,790  $    62,008 7.3%
    9 Nashville-Davidson–Murfreesboro–Franklin, TN  $  50,464  $    54,112 7.2%
    10 Detroit-Warren-Dearborn, MI  $  46,314  $    49,653 7.2%
    11 Pittsburgh, PA  $  48,710  $    52,053 6.9%
    12 Cincinnati, OH-KY-IN  $  48,841  $    52,063 6.6%
    13 Dallas-Fort Worth-Arlington, TX  $  57,032  $    60,730 6.5%
    14 Birmingham-Hoover, AL  $  46,108  $    49,034 6.3%
    15 Cleveland-Elyria, OH  $  52,169  $    55,430 6.3%
    16 San Antonio-New Braunfels, TX  $  37,202  $    39,280 5.6%
    17 San Francisco-Oakland-Hayward, CA  $  75,103  $    78,844 5.0%
    18 Seattle-Tacoma-Bellevue, WA  $  71,404  $    74,701 4.6%
    19 Minneapolis-St. Paul-Bloomington, MN-WI  $  59,168  $    61,711 4.3%
    20 Sacramento–Roseville–Arden-Arcade, CA  $  43,905  $    45,764 4.2%
    21 Austin-Round Rock, TX  $  50,094  $    52,110 4.0%
    22 Denver-Aurora-Lakewood, CO  $  59,284  $    61,595 3.9%
    23 Phoenix-Mesa-Scottsdale, AZ  $  43,156  $    44,803 3.8%
    24 Boston-Cambridge-Newton, MA-NH  $  71,936  $    74,643 3.8%
    25 San Diego-Carlsbad, CA  $  55,921  $    57,955 3.6%
    26 Chicago-Naperville-Elgin, IL-IN-WI  $  55,727  $    57,752 3.6%
    27 Providence-Warwick, RI-MA  $  41,698  $    42,994 3.1%
    28 Louisville/Jefferson County, KY-IN  $  46,710  $    48,048 2.9%
    29 Tampa-St. Petersburg-Clearwater, FL  $  39,066  $    40,153 2.8%
    30 Buffalo-Cheektowaga-Niagara Falls, NY  $  41,497  $    42,550 2.5%
    31 Baltimore-Columbia-Towson, MD  $  55,907  $    57,294 2.5%
    32 Indianapolis-Carmel-Anderson, IN  $  58,590  $    60,038 2.5%
    33 New York-Newark-Jersey City, NY-NJ-PA  $  67,499  $    69,074 2.3%
    34 Riverside-San Bernardino-Ontario, CA  $  26,509  $    27,094 2.2%
    35 St. Louis, MO-IL  $  47,876  $    48,738 1.8%
    36 Milwaukee-Waukesha-West Allis, WI  $  55,767  $    56,734 1.7%
    37 Miami-Fort Lauderdale-West Palm Beach, FL  $  44,386  $    45,145 1.7%
    38 Los Angeles-Long Beach-Anaheim, CA  $  58,211  $    59,092 1.5%
    39 Kansas City, MO-KS  $  52,916  $    53,677 1.4%
    40 Philadelphia-Camden-Wilmington, PA-NJ-DE-MD  $  58,696  $    59,339 1.1%
    41 Memphis, TN-MS-AR  $  46,534  $    47,014 1.0%
    42 Richmond, VA  $  50,977  $    51,498 1.0%
    43 Rochester, NY  $  44,825  $    45,202 0.8%
    44 Atlanta-Sandy Springs-Roswell, GA  $  51,830  $    52,178 0.7%
    45 Virginia Beach-Norfolk-Newport News, VA-NC  $  48,395  $    48,708 0.6%
    46 Raleigh, NC  $  51,820  $    51,673 -0.3%
    47 Las Vegas-Henderson-Paradise, NV  $  43,351  $    43,079 -0.6%
    48 Jacksonville, FL  $  42,068  $    41,752 -0.8%
    49 Hartford-West Hartford-East Hartford, CT  $  68,005  $    66,870 -1.7%
    50 Orlando-Kissimmee-Sanford, FL  $  47,023  $    45,855 -2.5%
    51 Washington-Arlington-Alexandria, DC-VA-MD-WV  $  76,035  $    73,461 -3.4%
    52 New Orleans-Metairie, LA  $  61,325  $    56,943 -7.1%
    Analysis by Aaron M. Renn


    This piece first appeared at Forbes.

    Joel Kotkin is executive editor of NewGeography.com and Roger Hobbs Distinguished Fellow in Urban Studies at Chapman University, and a member of the editorial board of the Orange County Register. His newest book, The New Class Conflict is now available at Amazon and Telos Press. He is author of The City: A Global History and The Next Hundred Million: America in 2050. His most recent study, The Rise of Postfamilialism, has been widely discussed and distributed internationally. He lives in Los Angeles, CA.

    Photo by w:Flickr user Bill Jacobus [CC-BY-2.0], via Wikimedia Commons

  • Battle of the Upstarts: Houston vs. San Francisco Bay

    “Human happiness,” the Greek historian Herodotus once observed, “does not abide long in one place.” In its 240 years or so of existence, the United States has experienced similar ebbs and flows, with Boston replaced as the nation’s commercial capital first by Philadelphia and then by New York. The 19th century saw the rise of frontier settlements—Cincinnati, Pittsburgh, Cleveland, and finally Chicago—that also sought out the post position. In the mid 20th century, formerly obscure Los Angeles emerged as New York’s most potent rival.

    Today we are seeing yet another shuffling of the deck among American regions. New York remains the country’s preeminent city, but its most powerful rivals are likely to be neither Chicago nor Los Angeles, but rather two regions rarely listed in the hierarchy of influential regions: the San Francisco Bay Area and Houston.

    Making of a new pecking order

    The Bay Area does not rank among the 20 top global cities in most studies, such as the 2014 A.T. Kearney listings. In the respected rankings of the London-based Globalization and World Cities Network, the Bay Area stood below not only Chicago, which is considered an “alpha” global city, but also such places as Toronto and Mexico City.

    Yet such rankings vastly underestimate the power now being wielded by the San Francisco region. As the headquarters for the largest concentration of cutting edge tech firms in the world, the Bay Area increasingly shapes the operations of companies from manufacturing and marketing to retail and media. And given that roughly half the nation’s venture capital is still being lavished on area start-ups, it is not surprising that Silicon Valley ranks number one in the world as a place to launch tech ventures, according to the Startup Genome.

    Tech dominance, according to a recent study on global cities conducted by my firm NewGeography, explains why the San Francisco Bay Area nudges out much larger Los Angeles for bragging rights on America’s Pacific Rim. Technology leaders, including Intel, Apple, Oracle, Google, and Facebook, are based in Silicon Valley, while Asian global tech firms such as Samsung also have North American headquarters there. Top technology firms from other cities often have their key R&D functions in the Bay Area. Even a frugal firm like Wal-Mart is enlarging its Silicon Valley presence.

    The current social media bubble will surely pop, but as Michael S. Malone and others have noted, the Bay Area’s preeminence will likely continue, fueled by its unique concentration of engineers, entrepreneurs, and risk capital. As a lure for the ambitious, Silicon Valley and San Francisco are replacing Wall Street. Google alone has 1,200 employees who formerly worked for large U.S. investment banks, and migration from the Big Apple to California is now at its highest level since 2006.

    Much of the appeal of the Bay Area is a result of happy coincidence of history and geography. The Bay Area—where I went to school and got my start in journalism, and where parts of my family have resided since the ’50s—has been blessed with excellent higher education and is centered around what is arguably America’s most beautiful city. Good weather, beautiful vistas, and access to nature have made the Bay Area a natural lure for people who can afford to live wherever they want.

    The Energy Capital

    Houston, where I have been working as a consultant, hardly qualifies as one of the most physically attractive or temperate cities. San Francisco may well have been, as Neil Morgan suggested a half century ago, “the Narcissus of the West,” but Houston, in most accounts, has been widely disparaged as hot, steamy, ugly and featureless. Yet despite this, its ascendency is no less compelling than that of the Bay Area.

    Houston’s trump card, like the Bay Area’s, resides in its control of one strategic industry, in this case energy. The majority of traded foreign oil majors, such as London-based Shell and British Petroleum, have their U.S. headquarters in Houston, and even companies based elsewhere boast a significant Houston presence. For example, Exxon, although it has its headquarters in Dallas-Fort Worth, is opening a massive Houston campus that will be home to 10,000 employees. Additionally, a majority of the world’s largest oil services companies, such as Baker Hughes, Schlumberger, and FMC Technologies, are based in Houston.

    Altogether, more than 5,000 energy-related companies call Houston home. The city employs three times more people in energy than its second place rival, Dallas-Ft. Worth, and more than the next five cities combined. This growth is likely to accelerate because foreign companies, notably from Germany, have begun buying up energy firms in the area, including Siemens’s recent $7.6 billion dollar purchase of the Dresser Rand Group, an energy equipment firm.

     Houston has added more than 10 percent more jobs since 2008, almost twice the increase in the Bay Area. Since 2000 Houston’s employment figures have shot up 32 percent, while the Bay Area has grown by barely 4 percent. And it’s not just energy that’s driving things—Houston is now the nation’s largest export port and boasts the world’s largest medical center. It has also become, by some measurements, the most ethnically diverse (PDF) region in the country. In the last decade, for example, Houston increased its foreign-born population by 400,000, second only to New York and well ahead of much larger Los Angeles.

    The big losers: LA and Chicago—but also New York

    In the past century New York and Los Angeles have dominated American media. This is being severely undermined by the Bay Area’s digital economy. Since 2001, notes Mark Schill at Praxis Strategy (where I am a senior fellow), book, periodical, and newspaper publishing—all traditionally concentrated in the New York area—have lost some 250,000 jobs, while Internet publishing and portals generated some 70,000 new positions, many of them in the Bay Area or Seattle.

    Google and Yahoo are already among the largest media companies in the world. (Yahoo now refers to itself as a digital media company rather than a technology company). With the ubiquity of its iTunes platform, Apple exercises ever greater control over consumer distribution of entertainment products such as music and video; Netflix, Hulu, and YouTube could become the studios of the future. This could shift global media decision-making from its familiar New York-Los Angeles axis to the Bay Area.

    This is particularly bad news for Los Angeles, whose grip on the entertainment industry was weakening even before Silicon Valley’s rise. Since 2004, LA’sentertainment industry lost roughly 11 percent of its jobs, as production shifted to Canada, Louisiana, and other locales.

    The decline in media employment comes on the heels of a rapid industrial decline—the area has lost more than 90,000 aerospace jobs since the end of the Cold War. The situation is so dismal that a report issued by many of the region’s top business and political leaders concluded that the city “is barely treading water while the rest of the world is moving forward.”

    Chicago’s situation is arguably even worse, but it is more threatened by Houston, which has already passed the Windy City in numbers of corporate headquarters. Since 2010, when U.S. industry began recovering, Houston manufacturing employment expanded by more than 17 percent, compared to flat growth in Chicago.

    “Houston is the Chicago of this era—like the old Chicago,” remarks David Peebles, who runs the Texas office of Odebrecht, a $45 billion engineering firm based in Brazil. “In the ’60s you had to go to Chicago, Cleveland, and Detroit. Now Houston is the place for new industry.”

    With its industrial base eroding, Chicago is no longer a strategic hub for any key industry. Outside of trading commodities, it also no longer serves as a major global financial center. Regional population growth has been meager over the past decade, and the city’s own pension issues may be worse than Detroit’s.

    Chicago retains its brilliant skyline, great cultural institutions, powerful political influence, and a strong business community. But its days of America’s number two city are long gone, and, as we enter the mid-2000s, it is falling behind not only Los Angeles and New York but the two rising Texas cities, Houston and Dallas, both expected to pass the “city of big shoulders” in population by mid-century, or earlier.

    Engineering the Future

    In the coming decades, New York will remain the nation’s top global city, due to its remarkable urban legacy, the power of Wall Street, and the entrenched traditional media. But its Achilles heel is a lack of the engineering power necessary to address key challenges such as the digitization of industry, energy efficiency or climate change. New York is profoundly weak in engineering talent (PDF)—ranking 78th out of 85 metropolitan areas in engineers per capita.

    In contrast, the Bay Area represents the epitome of engineering power, with the San Jose area boasting the largest per capita concentration of engineers of any major metropolitan area. The Bay Area’s power to develop new technologies and its almost unfathomable wealth will continue to undermine traditional institutions, from Hollywood and Wall Street to business services, tourism, automotive, and even aerospace industries.

    Far less appreciated, Houston, rather than being a southern city of duller wits, actually ranks second in engineers per capita. If the Bay Area is master of the digital economy, Houston ranks as the technological leader of the material one; it is the capital for the energy-driven revival of U.S. industry, not only in Texas but throughout the old industrial heartland. Revealingly, Houston actually has seen far more rapid growth in both college educated and millennial population since 2000 than the Bay Area, as well as New York, Chicago, and Los Angeles.

    Rival Approaches to Urbanism

    The Bay Area, for all its vaunted progressivism, increasingly resembles a “gated community” whose high prices repel most potential newcomers, particularly families. Already by far the nation’s least affordable city—only 14 percent of current residents can possibly afford to buy a home—it represents a growth model that is by definition exclusive, almost a throwback to medieval forms where the rich clustered inside the city gates.

    High housing prices, notes economist Jed Kolko, account for the fact that, despite the boom, population growth in the Bay Area remains well below national averages. From 2000 to 2013, the region lost approximately 550,000 domestic migrants. Despite sizable immigration, the regional population growth rate has fallen below the national average.

    In contrast, Houston is among the fastest growing regions in the country, with rapid increases both in domestic migrants and newcomers from abroad. This stems from both lower housing prices and a growth model that is far more amenable to higher paid blue collar and middle management positions. Since 2000, Houston’s population has grown by 30 percent compared, three times that of the Bay Area.

    Ironically, Houston’s growth has been more egalitarian than that of the notionally super-progressive San Francisco region. A recent Brookings report found that income inequality has increased most rapidly in what is probably the most left-leaning big city in America, where the wages of the poorest 20 percent of all households have actually declined amid the dot com billions.

    This inequality has a distinct racial element. The Bay Area gap between white residents (who dominate the tech economy) and minorities is among the highest in the nation while, during the boom, income has fallen for Hispanics and African-Americans, according to Joint Venture Silicon Valley.

    This racial divergence is far less pronounced in Houston, while the growth of poverty since 2000 has been slower, increasing at one third the rate of New York and San Francisco, and half that of Los Angeles. The Texas city may lack the great views of San Francisco, but Houston has turned out to be a better city for middle class minorities. Homeownership among African Americans stands at 42 percent and for Latinos at more than 53 percent; this compares to 32 and 37 percent in the Bay Area.

    Perhaps the biggest differences can be seen in families. Of the nation’s 52 largest metropolitan areas, the Bay Area has the lowest percentage, 11.5 percent, of people ages 5 to 14. In Houston, 23 percent of the population fits this age category. In particular San Francisco is notoriously inhospitable to families, with the lowest percentage of kids of any major city.

    The two regions also reflect very different urban forms. The Bay Area’s leadership has opted to favor dense “in fill” growth and sought to restrict suburbandevelopment. Houston has taken a different tack. As its population has expanded, so too has the metropolitan area. This includes the development of many planned communities that appeal to middle class families and many immigrants. In 2013, Houston alone had more housing starts than the entire state of California.

    But it would be wrong to dismiss Houston’s model as merely “sprawl.” Instead it is better seen as simply expansive. In fact, arguably no inner ring in the country has seen more rapid growth, with high-rise, mid-rise and townhouse development in many long neglected districts. The increase in high-density housing tracts (more than 5,000 per square mile) since 2000 has been almost ten times higher than the Bay Area.

    The Political Battle for the Future

    Increasingly America’s future will be determined by these two cities, with the issue of addressing climate change at the fore. Much of the Bay Area’s leadership—led by the likes of Google Chairman Eric Schmidt and investor Tom Steyer—have all but declared war on the oil and gas industry. Several colleges and universities in the region, including Stanford, have shed their energy holdings, and Silicon Valley has nurtured movements such as Bill McKibben’s 350.org that seek to revoke the “social license” of big oil, a tactic used previously against the tobacco companies and firms that did business in apartheid South Africa.

    The elites of Silicon Valley and San Francisco are not just interested in saving the earth; they wish to profit from a change in the nation’s energy economy. Google, Sun Microsystems founder Vinod Khosla, and top venture capitalists such as John Doerr have bolstered their already ultra-thick wallets by capitalizing on “green energy” subsidies and outright grants from various levels of government. Given these investments, it’s easier to understand the Valley’s support for draconian climate change legislation, complete with attempts to demonize “Texas oil.” (One won’t see such populist zeal on , say, increasing capital gains rates.)

    The Valley’s hostility to fossil fuel energy, and its jihad to destroy an entire industry, is only barely recognized in Houston. I also have never heard anyone there suggest that Silicon Valley should be closed down as a danger to the planet (or at least a threat to the attention span of younger Americans). Houstonians, particularly in the energy industry, generally lack media savvy, which is one reason why energy is widely rated as the country’s least popular industry. Also missing, thankfully, is the sense of entitlement and self-congratulation one finds in the Bay Area. But once the intention to devastate the oil and gas industry is better understood, expect the energy capital to square off against the tech center, generating what may be the regional battle royal of our era.

    This piece originally appeared at The Daily Beast.

    Joel Kotkin is executive editor of NewGeography.com and Roger Hobbs Distinguished Fellow in Urban Studies at Chapman University, and a member of the editorial board of the Orange County Register. His newest book, The New Class Conflict is now available at Amazon and Telos Press. He is author of The City: A Global History and The Next Hundred Million: America in 2050. His most recent study, The Rise of Postfamilialism, has been widely discussed and distributed internationally. He lives in Los Angeles, CA.

    Photos courtesy of University of Texas Health Science Center at Houston Office of Communications and Vincent Bloch.

  • Diverging Fortunes in Portland

    A recent New York Times Magazine had a story on Portland that featured Yours Truly. I recapitulated a few observations I’ve had over the years, including that it’s truly remarkable how a small city like Portland has captured so many people’s imagination, and also that “people move to Portland to move to Portland.”

    A Portland writer named Steve Duin appears to have had an aneurysm over the piece and, among other things, criticized my statement about why people move to Portland, saying:

    She quotes Aaron Renn, an urban-affairs analyst, who insists that while Los Angeles attracts starlets and New York the financiers, “People move to Portland to move to Portland,” as if the city is a space between Pacific Avenue and Park Place on the Monopoly board, not a vibrant, creative, accessible and accommodating urban scene.

    Which only proves that he completely missed the point. All I’m saying is what he’s saying in different words, namely that people move to Portland for its lifestyle and amenities. This is exactly what every Portland booster claims, namely that what they’ve created is attractional. I’m simply pointing out the obvious: people move to Portland primarily for lifestyle and leisure, not career or economic reasons. People move to Portland because they want to live there.

    Portland’s economy has actually picked up of late. Its unemployment fell below the national average in 2013 after having been above it for 14 straight years. But I want to highlight a disconnect between a couple measures of economic performance.

    I’ve written many times that Portland has done very well in terms of per capita GDP. In fact, from 2001 to 2013 (the maximum range of data available from the feds), Portland was #1 out of all 52 large metros in the US in its percentage increase in real per capita GDP.

    On the other hand, looking at how much of that economic value ends up in people’s pockets tells a different story. From 2001 to 2012 (I don’t think 2013 has been released yet), Portland only ranked 40th out of 52 in its percentage increase on this metric. Portland declined from a per capita income of 104.9% of the US average in 2001 to 98.6% in 2012.

    I threw this divergence into a quick chart:


    portland-gdp-vs-persinc

    It would be interesting to dig into these numbers. I did a quick back of the envelop calculation of total GDP growth by industry. Only a few industry totals are available, but the biggest gainer was Manufacturing, up 300%. Education, Health, and Social Assistance were #2, followed by Professional and Business Services. Natural Resources, Retail. Information, and FIRE were at the bottom.

    Speaking of San Jose, I see an even more remarkable divergence there. It was #2 in per capita GDP growth over the 2001-2013 time frame. Looking at the overall Bay Area total real GDP, it increased by 30.1% from 2001 to 2013. Keep in mind I’m using the inflation adjusted figured here, so there’s no inflation in that metric. But at the same time the Bay Area lost 2.4% of its jobs.

    The Bay Area grew its economy by almost a third while shedding over 75,000 jobs. Pretty remarkable.

    Aaron M. Renn is an independent writer on urban affairs and the founder of Telestrian, a data analysis and mapping tool. He writes at The Urbanophile, where this piece originally appeared.

    Portland Oregon” by Jamidwyer – Own work. Licensed under Public domain via Wikimedia Commons

  • The Sick Man Of Europe Is Europe

    The recent near breakup of the United Kingdom — something inconceivable just a decade ago — reflects a deep, pervasive problem of identity throughout the EU. The once vaunted European sense of common destiny is decomposing. Other separatist movements are on the march, most notably in Catalonia, Flanders and northern Italy.

    Throughout the continent, public support for a united Europe fell sharply last year. Opposition to greater integration has emerged, with anti-EU parties gaining support in countries as diverse as the United Kingdom, Greece, Germany and France.

    The new reality is epitomized by France’s ascendant far-right political figure, Marine Le Pen, who is now leading in many polls to win the next presidential election. “The people have spoken loud and clear … they no longer want to be led by those outside our borders, by EU commissioners and technocrats who are unelected,” she declared recently. “They want to be protected from globalization and take back the reins of their destiny.”

    These attitudes suggest that the EU could be devolving from a nascent super-state to something that increasingly resembles the Holy Roman Empire, a fragmented landscape of small, unimportant states wrapped in a unitary, but ephemeral crepe. This challenges the view of some Americans, particularly but not only on the left, who see Europe as a role model for the U.S.

    Not long ago progressive authors like Jeremy Rifkin could project the European Union to be one of the world’s great and admirable powers. Today, Rifkin’s 2005 tome “The European Dream,” and a host of similar tracts, seem absurd amid growing political unrest and spreading economic stagnation.

    Economic Decline

    Some pundits, such as Paul Krugman, routinely describe Europe’s approach to economic, environment and social policy as more enlightened than America’s. Wherever possible, progressives push for European-style action in areas such as curbing carbon emissionsand rapidly converting to “green” energy.

    Yet these policies are not working. The one large relatively fast-growing economy in Europe (excluding Turkey) is Poland.

    Several years ago Germany and the Netherlands were exemplars as opposed to the much-disdained PIGS (Portugal, Italy, Greece and Spain). But German growth rates have plummeted, going negative in the last quarter, along with France and Italy. More stagnation is likely as energy costs surge and key export markets, notably in Russia and China, begin to contract. Today, the “sick man” of Europe is not any one country, or collection of countries; the “sick man of Europe” is Europe.

    Europe’s poor economy stems in large part from policy. The strong welfare state so admired by progressives here has also made Europe a very expensive place to do business. High taxes and welfare costs, long tolerable in an efficient economy like Germany, have a way of catching up with companies and countries. This has been particularly notable after the financial crisis; since 2008 the unemployment rate has shot up 5 percentage points while dropping steadily in the Untied States.

    The European-wide embrace of “green” energy policies has been tough particularly for manufacturers. Under Chancellor Merkel, Germany has embraced a massive shift to green energy that has helped raise electricity costs for companies by 60% over the past five years to double the rates in the United States.

    The Russians, Europe’s one relatively inexpensive energy source, may have calculated that, in the long run, China may prove a better customer than the Europeans. Ironically, some European countries, including Germany, have been forced to boost their use of coal, certainly not much of a climate change win, to make up for shortfalls created by shuttering nuclear plants and overreliance on often erratic green energy.

    Ultimately, high energy prices tend to fall most painfully on the middle and working classes in the form of higher electricity bills. Some may see their jobs threatened as European employers look forlower-cost alternatives, such as in the energy rich South and middle of the United States.

    Demographic Disasters

    The young are arguably the biggest losers in Europe’s decline. Even though birthrates are very low throughout much of Europe from Germany, Italy and Spain to the eastern countries, those now coming into the workforce face extraordinarily high levels of unemployment, topping 50% in some places. It’s no wonder that some are dubbing them a “lost generation.”

    The combination of low birth rates and declining prospects contribute to rising concerns about immigration. Immigration has always been a more contentious issue in Europe, where many countries are dominated by a single ethnic group and the residents prefer something closer to homogeneity. This nativism has been painfully evidenced in recent decades from everything from the violent breakup of Yugoslavia and the far more civilized dismantling of Czechoslovakia to assaults on the Roma in France, the Czech Republic, Greece and other countries.

    In Britain, the anti-immigrant and anti-EU U.K. Independence Party’s recent strong showing in the European Parliament elections reflected this concern. Diversity in London, which by some counts has the world’s largest concentration of immigrants, thrills London’s media and business communities but stirs great resentment, particularly among working and middle-class voters. The fact that by some estimates that most new jobs generated in the recovery have gone to immigrants has not warmed sentiments.

    A Region Without Meaning

    Chancellor Merkel has noted that “multi-culturalism” in Germany has “utterly failed.” Muslims in Europe drifting to ISIS is just one reflection of the continent’s weakness. The slow integration of immigrants into the economy, even in relatively prosperous, enlightened countries like Sweden, reflects also the inability of Europeans to integrate the newcomers who could help provide a workforce and consumer base in the future.

    Perhaps the greatest challenge to Europe is not demographics, economics or energy, but one of identity. In highly secularized Europe, Christianity, which bound the continent around some similar values, is increasingly rarely practiced or believed. More Czechs, for example, believe in UFOs than in God. Outside of some vaguely anti-American, neo-druid communitarianism among some, there’s not much holding Europeans together.

    All this suggests that Americans would do better than look to Europe for future solutions to our own problems. However attractive the European model may seem to our pundit class, the reality on the ground shows something more to be avoided than embraced.

    This piece originally appeared at Forbes.

    Joel Kotkin is executive editor of NewGeography.com and Distinguished Presidential Fellow in Urban Futures at Chapman University, and a member of the editorial board of the Orange County Register. His newest book, The New Class Conflict is now available at Amazon and Telos Press. He is author of The City: A Global History and The Next Hundred Million: America in 2050. His most recent study, The Rise of Postfamilialism, has been widely discussed and distributed internationally. He lives in Los Angeles, CA.

  • Will Lindsay Lohan Save Greece?

    It’s September, but island beaches from the Aegeans to Zante are still buzzing in Greece. Mykonos has been the summer’s Go-To spot for superstars and supermodels; the mainland and cities are also seeing the British and Europeans coming back.

    Greece’s reemergence on the tourist circuit and the celebrity-watch sites has brought travel revenue, which accounted for 12 billion euros through April, actually above the previous peak in 2008. And, based on arrivals, the national tourism agency predicts that visitors will account for 13 billion euros this year.

    So did the appearance of Lindsay Lohan and friends in the Greek isles signify, as one newspaper put it, a template for Greece’s economic recovery?

    It didn’t. It’s even still possible that Greece’s economic troubles have yet to hit bottom — no one really knows. There is one definite, though. Even with a dramatic increase in its significant tourism industry, the dance floor under Greece’s summer parties has been resting on a breathtakingly shaky foundation.

    The debt-ridden economy has now endured 24 quarters of negative output. Young Greeks continue to flee, straining the country’s pension system.

    Extreme austerity regime policies — fiscal tightening — have resulted in the most extreme unemployment rate in Europe, 27 percent.

    Private investment remains in a free fall, with a decline of more than 10 percent over 2013. Financial institutions are barely lending. The gross total of doubtful and nonperforming loans by major banks is up from 5 percent to 25 percent since 2010.

    And, while tourists are crowing about Greece’s fantastic bargains, those low prices are partly a reflection of the salary squeeze on Greek workers. Wage deflation is at a pace never before experienced in a post-WWII era developed country, even as household taxes continue to rise.

    Those facts are just shorthand — an almost random selection from the reams of data we’ve compiled and analyzed at the Levy Economics Institute that document the continued precariousness of the economy.

    This isn’t the first time in recent months that a seemingly positive sign in Greece has been wrongly celebrated as the start of a recovery. The country’s return to the bond markets in April was cheered as the end of a four-year exile. But the exercise was a public relations play. Demand for the bonds reflected the state of excess global liquidity, not investor confidence in Greece as a good risk. (Not to mention that the bonds were implicitly guaranteed by the European Central Bank.)

    The improvement in tourism isn’t a sham like the bond market show. It’s real — but it’s such a small portion of the overall picture that it’s having only a minimal impact on the terrible employment problem, and on Greece’s balance of payments.

    Millions of tourists may keep landing at Greece’s airports. I hope they do. But don’t expect ordinary Greeks to be planning their own luxury vacations anytime soon.

    Dimitri Papadimitriou is president of the Levy Economics Institute of Bard College. The publications, conferences, workshops and congressional testimony of the institute have a wide international audience.

    Flickr photo by efilpera: Clouds over Mykonos, September 2014.

  • Metro Area Gross Domestic Product

    The Bureau of Economic Analysis is out with the preliminary numbers for 2013 metro area GDP (see the press release). Here is a spreadsheet with per capita GDP data for all large metros.

    We’ve now got enough data that it’s worthwhile to start tracking the trend vs. a 2010 base instead of 2000. With that, here are the top ten large metros by real per capita GDP:

    Rank Metro Area 2013
    1 San Jose-Sunnyvale-Santa Clara, CA 100,115
    2 San Francisco-Oakland-Hayward, CA 78,844
    3 Seattle-Tacoma-Bellevue, WA 74,701
    4 Boston-Cambridge-Newton, MA-NH 74,643
    5 Washington-Arlington-Alexandria, DC-VA-MD-WV 73,461
    6 Houston-The Woodlands-Sugar Land, TX 72,258
    7 New York-Newark-Jersey City, NY-NJ-PA 69,074
    8 Portland-Vancouver-Hillsboro, OR-WA 68,810
    9 Hartford-West Hartford-East Hartford, CT 66,870
    10 Salt Lake City, UT 62,008

    San Jose cracks the $100,000 barrier, though that’s in part to the Bay Area being split into two metros, and the base year for constant dollar calculations getting switched from 2005 to 2009. But still impressive.

    This list is similar to what we’ve seen before. But how are things changing? Let’s look at the top ten large metros for percent change in their real per capita GDP from 2010 to 2013:

    Rank Metro Area 2010 2013 Pct Change
    1 Houston-The Woodlands-Sugar Land, TX 63,816 72,258 13.23%
    2 San Jose-Sunnyvale-Santa Clara, CA 89,806 100,115 11.48%
    3 Portland-Vancouver-Hillsboro, OR-WA 63,025 68,810 9.18%
    4 Columbus, OH 50,370 54,493 8.19%
    5 Grand Rapids-Wyoming, MI 41,248 44,482 7.84%
    6 Charlotte-Concord-Gastonia, NC-SC 51,819 55,802 7.69%
    7 Oklahoma City, OK 45,993 49,441 7.50%
    8 Salt Lake City, UT 57,790 62,008 7.30%
    9 Nashville-Davidson–Murfreesboro–Franklin, TN 50,464 54,112 7.23%
    10 Detroit-Warren-Dearborn, MI 46,314 49,653 7.21%

    A full map of this metric is below.

    percent-change-per-capita-gdp-2010-2013
    Percent change in real per capita GDP, 2010-2013.

    Houston’s #1 showing is very impressive. This is a per capita value remember, so they aren’t on top just by virtue of adding lots of people. And they are in the top ten for 2013 per capita, so it’s not like they started on a low base or something.

    Portland and San Jose continues their strong showing in this metric (more on these metros to come next week). Two metros in Michigan made the top ten, though some of that I’d speculate must come from the auto industry recovery, meaning it’s cyclical in nature.

    I’ll throw in the total real GDP figures as well, but obviously these heavily align to population. Here are the ten biggest metro GDPs in 2013 (amounts in millions of dollars):

    Row Geography 2013
    1 New York-Newark-Jersey City, NY-NJ-PA 1,377,989
    2 Los Angeles-Long Beach-Anaheim, CA 775,967
    3 Chicago-Naperville-Elgin, IL-IN-WI 550,793
    4 Houston-The Woodlands-Sugar Land, TX 456,177
    5 Washington-Arlington-Alexandria, DC-VA-MD-WV 437,085
    6 Dallas-Fort Worth-Arlington, TX 413,627
    7 Philadelphia-Camden-Wilmington, PA-NJ-DE-MD 358,091
    8 San Francisco-Oakland-Hayward, CA 356,081
    9 Boston-Cambridge-Newton, MA-NH 349,652
    10 Atlanta-Sandy Springs-Roswell, GA 288,175

    And the top ten in total real GDP growth percentage, 2010-2013.

    Rank Metro Area 2010 2013 Pct Change
    1 Houston-The Woodlands-Sugar Land, TX 379,595 456,177 20.17%
    2 San Jose-Sunnyvale-Santa Clara, CA 165,435 192,184 16.17%
    3 Austin-Round Rock, TX 86,546 98,126 13.38%
    4 Portland-Vancouver-Hillsboro, OR-WA 140,717 159,266 13.18%
    5 Charlotte-Concord-Gastonia, NC-SC 115,229 130,318 13.09%
    6 Oklahoma City, OK 57,856 65,246 12.77%
    7 Nashville-Davidson–Murfreesboro–Franklin, TN 84,572 95,124 12.48%
    8 Dallas-Fort Worth-Arlington, TX 368,015 413,627 12.39%
    9 Salt Lake City, UT 63,090 70,719 12.09%
    10 San Antonio-New Braunfels, TX 80,101 89,463 11.69%

    Richard Florida posted some thoughts on this data over at City Lab. I’m less bothered than he is by Washington, DC’s poor performance, however. Much like Detroit’s cyclical upswing, I think short term turbulence in DC from the sequester and fiscal challenges was to be expected.

    Aaron M. Renn is an independent writer on urban affairs and the founder of Telestrian, a data analysis and mapping tool. He writes at The Urbanophile.

  • Apocalypse Soon? Uneasiness with The Economy

    Seven in 10 Americans say the country is on the wrong track. Americans are unhappy, worried and pessimistic, and their spending is down according to a University of Michigan report. But the same report shows that consumer sentiment is up. Consumer confidence is up, according to the Conference Board, and our own Consumer Demand Index indicates that spending plans are up.

    What accounts for this dichotomy? Perhaps it could be the normalcy bias, a desire for “normalcy” so strong as to feed a willingness to overlook contrary evidence. Or perhaps our uneasiness is an example of the “wisdom of crowds”, James Surowiecki’s theory that in aggregate, opinions of a wide cross-section of people are more accurate than those of experts.

    Frankly, I’m uneasy, unhappy, worried, and pessimistic.

    The protracted and uneven recovery from the Great Recession has led most Americans to conclude that the US economy has undergone a permanent change for the worse, according to a new national study by scholars at Rutgers University. Seven in 10 Americans now say the recession’s impact is permanent, up from half in 2009 when the recession officially ended.

    Despite sustained job growth and lower levels of unemployment, most Americans do not think the economy has improved in the last year or that it will in the next. Just one in six Americans believe that job opportunities for the next generation will be better than theirs have been; five years ago, four in 10 held that view.

    Much of the pessimism is rooted in direct experience. Fully one-quarter of the public says there has been a major decline in their quality of life owing to the recession, and 42% say they have lower salary and less savings than when the recession began, while just 30% say they have more.

    The public also paints an extremely negative picture of American workers as unhappy, underpaid, highly stressed, and insecure about their jobs. Americans are also pessimistic about the future, and sharply critical of Washington policymakers. Only a quarter think economic conditions in the United States will get better in the next year, and just 40% believe their family’s finances will get better over the next year.

    The Economy gets a downgrade: The updated budget and economic outlook recently released by the nonpartisan Congressional Budget Office (CBO) contained good news about
    corporations, but bad news about the rest of the economy. According to Harry Stein of the Center for American Progress, the CBO now estimates that the economy will grow even more slowly than it expected in its previous economic outlook. It now expects that wages and salaries will comprise a smaller portion of that reduced economic pie.

    The report suggests that troubling long-term trends in our economy are getting worse. Those trends include the stagnation of middle-class wages, which has gone on for over a decade. In addition, during the last 50 years overall employee compensation – including health and retirement benefits – has fallen to its lowest share of national income in more than 50 years, while corporate profits have climbed to their highest share.

    Yet corporations are paying a much smaller portion of the total federal tax burden than they did in the past: about 10% today, vs. 30% in 1953.

    While this is not an immediate emergency, since the annual budget deficit is very low right now, deficits will become unsustainable in the future, according to the CBO.

    But there is a crisis for middle-class and low-income families right now: stagnant wages are not keeping up with rising expenses. American productivity has increased, but those gains are not making it to low- and-middle wage workers.

    There has not been a real deleveraging: For several years, media headlines have been filled with references to a “deleveraging,” or a reduction in the level of US debt. But while the US financial system and banks are better capitalized, there has been no deleveraging in the broader economy. Consider these three points, courtesy of BlackRock investment strategist Russ Koesterich:

    • US household debt remains high: Thanks to a significant write-off of mortgage debt, the debt burden of US consumers has been modestly reduced. By most measures, however, household debt levels are still too high. The past several years have witnessed a huge surge in student and auto loans. Overall, US household debt still stands at 103% of disposable income.

    • Fueled by cheap credit, corporations have been adding new debt. Since the third quarter of 2010, corporate debt has increased every quarter. Over the past six quarters, corporate debt has been growing at an average annualized rate of around 9.5%, well above the pre-crisis average of 7.5%.

    • Federal government debt has exploded. Outside of debt held by the Social Security Trust Fund, federal debt has risen by roughly $7.3 trillion over the past six years, an increase of 140%.

    The net result is that non-financial debt has actually risen significantly since the financial crisis. Six years ago, notes Koesterich, non-financial debt was around 227% of GDP. Today, it’s at a record 250%.

    Does rising non-financial debt matter for the economy and for investors? Long-term, the answer is yes: implications include slower growth, a persistent headwind for consumers and vulnerability to even a modest rise in interest rates (this is particularly true for the federal government).

    This is not a real economic recovery: Wages have been stagnant since the start of the supposed recovery. Real household income has fallen by 7%.

    • The S&P 500 has increased 196% in five years; stock market valuations have been higher only three times in history: 1929, 1999, and 2007. But average Americans are not participating in the markets’ gains. They have instead parked record levels of cash ($10.8 trillion) in no-interest bank and money market accounts.

    • The economy has added a few million jobs, but 11 million people have permanently left the labor market.

    • The Federal Reserve balance sheet was $900 billion before the 2008 financial crisis; today it stands at $4.4 trillion. The correlation between that increase and the stock bubble is self-evident. So is the true purpose of quantitative easing: to save Wall Street, not Main Street.

    • The housing market is worse for real people than it was in 2009. The national home price increase — 25% just since 2012 — has been centered in the usual speculative markets, aided and abetted by the Fed’s easy money, managed by the Wall Street hedge funds, and exacerbated by late-arriving flippers, who now account for 34% of all home sales. Mortgage rates have been falling for the past year, home builders have been reporting soaring confidence about the future, and the National Association of Realtors keeps predicting a surge in home buying any minute now.

    Yet as analyst James Quinn points out, mortgage applications are in free fall, new home sales are at 1991 levels, and existing home sales are falling. Home prices have peaked and are beginning to roll over.. Home sales will be stagnant for the next decade, he predicts.

    This will not end well: Crashes are coming, concludes Quinn. Quantitative easing will cease come October, unless the Fed and Wall Street can manufacture a new crisis to cure by printing more money. By every valuation measure, he writes, stocks are overvalued by at least 50%. By historical measures, home prices are overvalued by at least 30%.

    Ten-year Treasuries are yielding 2.4%, while true inflation is north of 5%. With real interest rates deep in negative territory, the bond market is even more overvalued than stocks or houses. These simultaneous bubbles have been created by the Federal Reserve in a desperate attempt to keep this debt laden ship afloat. Their solution to a ship listing from too much debt has been to load it down with trillions more in debt. The ship is taking on water rapidly.

    We had a choice, says Quinn: “We could have bitten the bullet in 2008 and accepted the consequences of decades of decadence, frivolity, materialism, delusion and debt accumulation. A steep sharp depression which would have purged the system of debt and punishment of those who created the disaster would have ensued. The masses would have suffered, but the rich and powerful bankers would have suffered the most. Today, the economy would be revived… Instead, the Wall Street bankers won the battle and continue to pillage and loot the national wealth while impoverishing the masses.

    Discontent among the masses grows by the day. When the stock, bond and housing bubbles all implode simultaneously, all hell will break loose in this country. It will make Ferguson, Missouri look like a walk in the park.”

    I fear he may be right; so like I said, I’m uneasy.

    Dr. Roger Selbert is a trend analyst, researcher, writer and speaker. “Growth Strategies” is his newsletter on economic, social and demographic trends. He is economic analyst, North American representative and Principal for the US Consumer Demand Index, a monthly survey of American households’ buying intentions.

    Flickr photo by Brendan Murphy, The last sunset on earth, taken “somewhere close to the ends of the earth – White Cliffs in NSW”.

  • Southern California Becoming Less Family-Friendly

    The British Talmudic scholar Abraham Cohen noted that, throughout history, children were thought of as “a precious loan from God to be guarded with loving and fateful care.” Yet, increasingly and, particularly, here in Southern California, we are rejecting this loan, and abandoning our role as parents.

    This, of course, is a process seen around the high-income world, and even in some developing countries. But, here in America, some regions are moving in this post-familial direction faster than others, and, sadly, Southern California, for the most part, is leading the trend.

    Historically, Southern California, as a lure first for domestic migrants and, later, for foreign immigrants, has been an incubator of families. As recently as 2000, the proportion of population ages 5-14 in Los Angeles and Orange counties stood at 16 percent, the sixth-highest level among the nation’s 52 largest metropolitan areas. Thirteen years later, that proportion had dropped to 12.8 percent, ranking 33rd. The area experienced a 20 percent drop in its share of youngsters, the largest decline among U.S. metro areas.

    Of course, not everywhere in Southern California has experienced such a precipitous shift. The Inland Empire, which stands apart in census data, remains a relative bastion of familialism, with 15.3 percent of the population between ages 5-14. Yet even the Inland Empire is slipping somewhat, from having the highest percentage of children to a ranking of fourth, and experiencing a 17 percent decline in children’s share of the population, the fourth-largest percentage drop in the nation.

    If we try to focus even more closely, the patterns of decline, and the few bright spots, become more clear. Using 2010 U.S. Census data for specific regions (more up-to-date numbers are not yet available at the local level), it’s clear where much of this loss is concentrated.

    The most precipitous declines have been in the inner city, notably Central Los Angeles, which experienced a net loss of 87,000 youngsters from 2000-10. Although their rate of loss was not as severe as in the core, other, once family-rich parts of the region – the San Fernando and San Gabriel valleys, Santa Ana/Anaheim, Long Beach and Whittier-Southeast Los Angeles County – all posted double-digit percentage drops in children.

    Only a few areas of Southern California experienced growth in the number of children. Much of the growth was in the vast, outer suburbs and exurbs – places such as the Victor Valley, San Bernardino, Perris-Temecula, Santa Clarita-Antelope Valley and Riverside-Moreno Valley, as well as decidedly more upscale Irvine-South Orange County.

    In a sense, these numbers tell several stories. To be sure, high housing prices seem to have a direct impact on family formation, pushing people further out to the periphery or, in some cases, out of the region entirely. Overall, according to recent analysis of census data, high-cost areas tend to repel families; almost all the most expensive areas in the country, such as the Bay Area, New York and Boston, have all experienced strong drops in numbers of children.

    This has resulted, as demographer Ali Modarres has demonstrated, in a gradual emptying out of families from the poor, but still expensive, inner core of Los Angeles. These areas tend to be heavily immigrant, and once were seen as the generators of a new generation of Angelenos. Now, however, as Modarres suggests, these areas are also “getting old,” with grandparents remaining but the new generation headed to other locales within or beyond the region. This process, he notes, has been accelerated by a decline in immigration to the region, particularly among Latinos, who long settled in these areas.

    Housing prices are not the only determinant. Prices are even higher in the Bay Area, which has seen a falling number of children, but not as severe as in Los Angeles.

    One likely explanation is the Southland’s relatively weak economy, which continues to create jobs sluggishly, and an unemployment rate, particularly in Los Angeles County, well above the state and national averages. High prices repel families, but this is particularly true in a region generating relatively little economic opportunity.

    There are other factors, particularly for middle-class families, who tend to have more choice where to locate. One seems to be education. For example, Irvine-South Orange County does well in this regard, but its housing costs are beyond the budgets of most other than upper-middle-income households, which tend to be Asian or non-Hispanic white. Irvine has a national reputation for excellent schools, a major lure to families who wish to avoid the expense of private education.

    For some in Southern California, particularly those pushing high-density and rental housing, these shifts may be considered a boon. After all, households with children, even more than most people, tend to prefer single-family homes and tend to embrace the notion of ownership. Single people are more likely to choose – by preference or because of cost – rental properties. The vision of Southern California as primarily dominated by high-density rentals correlates with requirements of state law and plans of the Southern California Association of Governments.

    At the same time, the economic languor of this region may make many of these bold designs untenable. People without decent – or any – employment do not make ideal tenants any more than they constitute potential homeowners. Given the high costs of high-density construction, this suggests that many units will be rentable only by aging former homeowners or by several families sharing a unit.

    Sadly, the decline in homeownership and the single-family housing market may contribute long term to the region’s continued relative economic eclipse. Single-family home construction is among the most reliable contributors to local economic growth and job creation. In contrast, each multifamily unit constructed contributes 60 percent less to the GDP.

    More important still, the loss of families presages a future that we can already see in many European and east Asian countries. There is the development of an aging, inner core, made up largely of retirees, both poor and affluent, sprinkled among areas dominated by young, mostly childless, people. Over time, this leads to a less-dynamic region, as the workforce and consumer base shrinks, and politics shift emphasis from economic growth to redistribution. Meanwhile, many of the poor and working-class families are forced out toward the furthest periphery, often far from employment and relatives.

    Can this process be reversed? Certainly a stronger economy, with more middle-wage jobs, might encourage people to have families, and give them the incentive, as well as the wherewithal, to buy a house. It would provide parents, and potential parents, with the notion that they can create a new generation with reasonable economic prospects.

    The other key factor is a radical reordering of our education systems. It is clear from the data that areas with good schools, such as Irvine, continue to attract families, even at very high housing price points. If middle-class families feel they can access a decent public education in the older, settled areas, such as the San Fernando Valley, L.A.’s Westside or North Orange County, they might be more willing to put down roots in these places, which would help create the greater stability generally associated with families, especially homeowners.

    Sadly, political leadership in most of Southern California and Sacramento seems blissfully unaware of these trends, or the potential danger to the area’s economic, as well as its demographic, vitality. Perhaps a region dominated by aging populations, and fewer families, by nature tends to look backward and neglect the kind of infrastructure investment, including in education, that families and business require.

    A resurgent hipster economy may not require much economic growth, or changes in the political system, but the region’s families need a thorough reversal in course if this region hopes to retain its appeal as an incubator of future generations.

    This piece originally appeared at The Orange County Register.

    Joel Kotkin is executive editor of NewGeography.com and Distinguished Presidential Fellow in Urban Futures at Chapman University, and a member of the editorial board of the Orange County Register. His newest book, The New Class Conflict is now available at Amazon and Telos Press. He is author of The City: A Global History and The Next Hundred Million: America in 2050. His most recent study, The Rise of Postfamilialism, has been widely discussed and distributed internationally. He lives in Los Angeles, CA.

    Baby photo by Bigstock.