Category: Economics

  • Jerry Brown and California’s “Attractive” Poverty

    Jerry Brown is supposed to be a different kind of politician: well informed, smart, slick, and skilled.  While he has had some missteps, he’s always bounced back.  His savvy smarts have allowed him to have a fantastically successful career while generally avoiding the egregious dishonesty that characterizes so many political practitioners.

    So, I was shocked to read that he said that California’s poverty is a result of the State’s booming economy.  Here’s part of the Sacramento Bee report:

    Gov. Jerry Brown, whose pronouncements of California’s economic recovery have been criticized by Republicans who point out the state’s high poverty rate, said in a radio interview Wednesday that poverty and the large number of people looking for work are "really the flip side of California’s incredible attractiveness and prosperity."

    The Democratic governor’s remarks aired the same day the U.S. Census Bureau reported that 23.8 percent of Californians live in poverty under an alternative calculation that includes the cost of living. Asked on National Public Radio’s "All Things Considered" about two negative indicators — the state’s nation-high poverty rate and the large number of Californians who are unemployed or marginally employed and looking for work — Brown said, "Well, that’s true, because California is a magnet.

    "People come here from all over in the world, close by from Mexico and Central America and farther out from Asia and the Middle East. So, California beckons, and people come. And then, of course, a lot of people who arrive are not that skilled, and they take lower paying jobs. And that reflects itself in the economic distribution."

    This is so incredibly wrong that I’m worried that Brown has lost his head and ability to reason.   If he really believes what he said, he’s living in the past and he’s so ill informed as to be delusional.  If he doesn’t believe what he said, I’m worried that his political skills have slipped.  To my knowledge, he’s never said anything so clearly at odds with the truth in his career.

    Here are the facts:

    • California’s poverty is not where the jobs are, which is what we’d expect if what Brown said was true.  Most of California’s jobs are being created in the Bay Area, a region of fabulous wealth. By contrast, California’s poverty is mostly inland. San Bernardino, for example, has the second highest poverty rate for American cities over 200,000 population, and no, it’s not because it’s a magnet. Most of California’s Great Central Valley is a jobs desert, but the region is characterized by persistent grinding poverty and unemployment.  No one in recent years is moving to Kings County to look for a job.
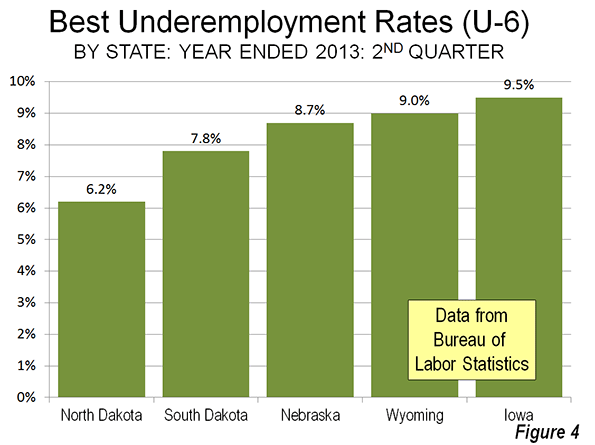
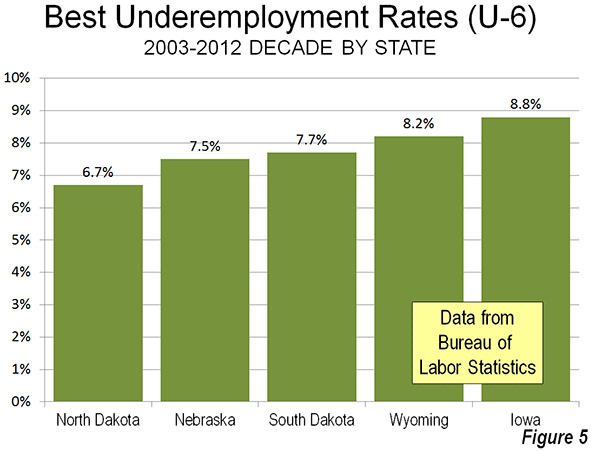
    • States with opportunity have low poverty rates.  North Dakota may have America’s most booming economy.  According to the Census Bureau, North Dakota’s Supplemental Poverty Measure is 9.2 percent.  That is, after adjustments for cost of living, 9.2 percent of North Dakotans live in poverty.  The rate in Texas – a state with a very diverse population, and higher percentages of Latinos and African-Americans – is 16.4 percent.  California leads the nation with 23.8 percent of Californians living in poverty.
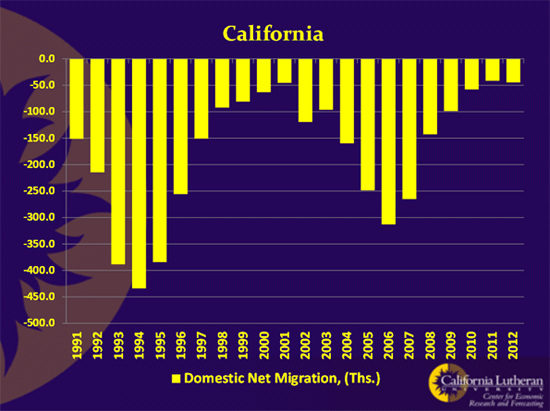
    • According to the U.S. Census, domestic migration (migration between California and other states) has been negative for 20 consecutive years. That is, for 20 years more people have left California for other states than have come to California from other states. Wake up, Jerry, this is no longer your Dad’s state – or that of his successor, Ronald Reagan. This is a big change from when Brown was elected governor the first time.  At that time, California was a magnet.  It had a vibrant economy, one with opportunity.  California was a place where you could have a career, afford a home, raise a family.  It was where the American Dream was realized.
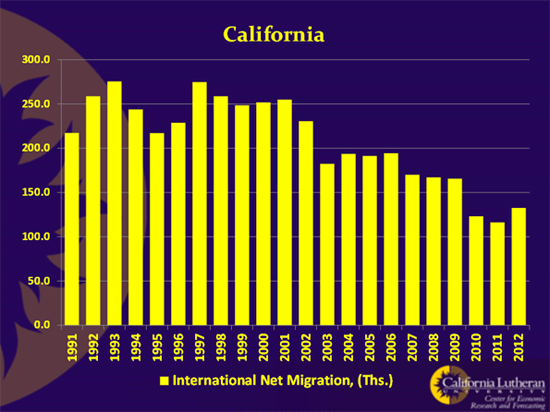
    • How about the magnetic attraction for immigrants from all over the world? According to the Census Bureau, international migration to California is way down.  The number of California international immigrants has been declining for a decade at least.  Indeed, in recent years there have been about half as many international immigrants to California than we saw in the 1990s.  Over the past decade, the number of foreign born increased more in Houston than the Bay Area and Los Angeles put together. Opportunity, not  “attractiveness”, drives people to move.
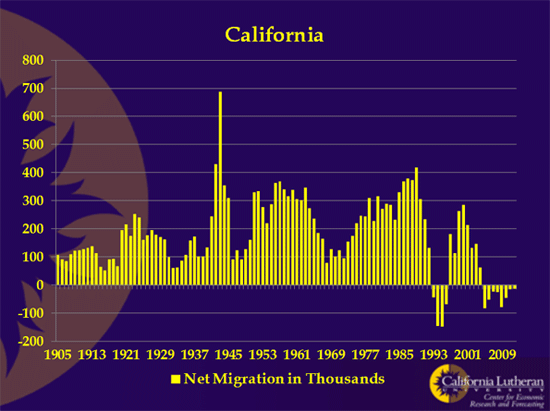
    • The result of negative domestic migration and falling international migration is the total migration to California has been negative in each of the past eight years.  More people have left California than have come to California for eight consecutive years. 
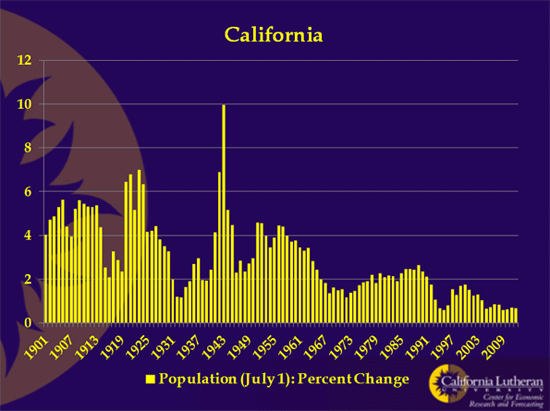
    • California’s migration trends combined with falling birth rates has resulted in the lowest sustained population growth rates that California has seen.

    The data are clear: Brown’s assertions have no basis in fact.  California – with the exception only recently of the Bay Area – is not a magnet. California is not "incredibly attractive and prosperous."  People are not coming from all over the world. California may beckon, but more are leaving, and those here are having fewer children. California’s seductive charms go only so far.

    I don’t know if I’d prefer that Brown was delusional or lying. On the one hand, policy made from a delusional analysis of the world is sure to be bad policy. Brown, for example, may convince himself that Twitter, Google, and Facebook are the future of the California economy, without recognizing how few people, particularly from the working class or historically disadvantaged minorities, they employ. On the other hand, Brown is very skilled in the political arts. If someone as skilled as he has to resort to such outright misdirection, we may be in worse shape than I think.

    Bill Watkins is a professor at California Lutheran University. and runs the Center for Economic Research and Forecasting, which can be found at clucerf.org.

    Jerry Brown photo by Bigstock.

  • Are Millennials Turning Their Backs on the American Dream?

    In his classic 1893 essay, “The Significance of the Frontier in American History,” historian Frederick Jackson Turner spoke of “the expansive character of American life.” Even though the frontier was closing, Turner argued, the fundamental nature of Americans was still defined by their incessant probing for “a new field of opportunity.” Turner’s claim held true for at least a century—during that time, the American spirit generated relentless technological improvement, the gradual creation of a mass middle class, and the integration of ever more diverse immigrants into the national narrative.

    Yet today, many consider this modern period of “expansiveness” to be as doomed as the prairie frontier culture whose denouement Turner portrayed. Nothing makes this clearer than the perception of a majority of middle class Americans that their children will not do better than them, with as many as pessimistic about the future as are optimistic. Almost one-third of the public, according to Pew, consider themselves “lower” class , as opposed to middle class, up from barely one quarter in 2008.

    Are Young Americans Becoming Herbivores?

    To some, this dismal outlook is either inevitable, or even positive, as Americans shift from their historically “expansive” view and embrace a more modest déclassé future. Rather than seek new worlds to conquer, or even hope to retain the accomplishments of prior generations, contemporary young Americans seem destined to confront a world stamped by ever narrowing opportunity, class distinction, and societal stagnation. Once a nation of competitive omnivores and carnivores, America could be turning more docile—a country of content, grazing herbivores.

    Just such a diminished world view has already taken root in Japan, particularly among that country’s younger males. Growing up in a period of tepid economic growth, a declining labor market, and a loss of overall competitiveness, Japan’s male “herbivores” are more interested in comics, computer games, and Internet socializing than building a career or even the opposite sex. Marriage and family have increasingly little appeal to them, sentiments they share with most women their age.

    This devolved future is widely embraced by both left and right. Libertarian-leaning economist Tyler Cowen identifies a permanent upper class, essentially those who command machines and particularly the software that runs them, while the masses, something like 85 percent of the population, need to adjust to lower living standards, and a diet made up largely of beans and rice.

    This approach has appeal to the grandees of finance, who see in a diminishing American dream not only higher relative status for themselves but an opportunity to turn prospective property owners into rental serfs. Large equity funds have been particularly aggressive about buying foreclosed homes and renting them out, often at high rates, to economically distressed families.

    This “rentership” society, as first suggested by Morgan Stanley’s Oliver Chang, reflects, in this sense, an almost Marxian dialectic that sees ownership of property concentrating in ever fewer hands. Conservative theorists have little problem with this, since they naturally defend class privileges and are less committed to upward mobility than assuring the relentless triumph of market capitalism.

    But the most potent apologists for shrinking the American dream come from the very left which, in the past, once championed broad-based economic growth and upward mobility. Instead, progressives increasingly favor their own version of a “rentership society,” albeit one more regulated than the conservative version, but also accepting , and even encouraging, the proletarianization of the American middle class. (Turning them, in the process, into good, reliable clients of the Democratic Party). Goodbye Levittown, with its promise of property ownership and privacy, and back to the tenements of Brownsville, now dressed up as “hip and cool.”

    Some even have suggested getting rid of “middle class norms of decency” governing housing and bringing back the boarding house of the 19th and early 20th Century. The goal, of course, is to facilitate ever more densification of urban areas and to rein in the dreaded suburban “sprawl.”

    This tendency to force densification and downgrade ownership is deeply pronounced among urbanists and the green lobby, two groups with ample power in most blue states and regions. “Progressive” theorists such as Richard Florida see wealth transferring to a handful of “spiky” American cities, places such as San Francisco and Manhattan, where even the prospect of home ownership is inconceivable to the vast majority of the population.

    There are many others, farther out on the green urbanist track, who believe that the entire notion of middle class upward mobility is too consumption-oriented and, well, sort of in bad taste. They maintain that millennials will not only eschew home ownership but the ownership of automobiles and practically anything else bigger than their beloved electronic gadgets.

    Indeed, this transformation would be greeted with enthusiasm by many greens and traditional urbanists. The environmental magazine Grist even envisions “a hero generation” that will escape the material trap of suburban living and work that engulfed their parents. “We know the financial odds are stacked against us, and instead of trying to beat them, we’d rather give the finger to the whole rigged system,” the millennial author concludes.

    Are Americans Millennials Victims of Circumstance?

    Are young Americans ready to move off the competitive playing field and onto the herbivore pastureland? The economic stagnation certainly seems to have had a negative effect on everything from marriage to fertility rates, which are at their lowest levels in a quarter century. Much like their Japanese counterparts, young Americans increasingly avoid both marriage and having children, according to a recent Pew Foundation study. Despite a total rise in population of 27 million (PDF), there were actually fewer births in 2010 than there were ten years earlier.

    Is this a matter of preference or a reaction to hard times?  Hemmed in by college debt and a persistently weak economy, almost 40 percent of the unemployed are between 20 and 34. A smaller percentage of American males between 25 and 34—the key age for prospective families—are in the workforce than at any time since 1948.

    One reason some celebrate the rejection of marriage and family is that it undermines the suburban environments that overwhelmingly attract most families. Urban theorists such as Peter Katz maintain that millennials (the generation born after 1983) show little interest in “returning to the cul-de-sacs of their teenage years.” Manhattanite Leigh Gallagher, author of the predictable anti-burbs broadside The Death of Suburbs, asserts with certitude that that “millennials hate the suburbs” and prefer more eco-friendly, singleton-dominated urban environments.

    Another apparent casualty here may be entrepreneurship, the very thing that characterized both boomers and their successors, Generation X.  Entrepreneurship rates remain strong among older Americans , but start-up rates among young people look far weaker. Millennials’ experience with the economy makes them, according to generational chroniclers Morley Winograd and Mike Hais, “very risk averse,” particularly in comparison with previous generations.

    Can millennials recreate the “Expansive” culture in their own image?

    Winograd and Hais see millennial timidity as a mostly temporary phenomena. Far from rejecting suburbia, homeownership, and the American dream, millennials are simply seeking to recreate it in their own image. Contrary to the notions promoted by the Wall Street financiers, urban land speculators, and greens, most millennials, particularly those entering their 30s, express a strong desire to own a home, with three times as many eyeing the suburbs as the inner core.

    The recession, according to a recent Wilson Center study (PDF), did not kill the desire to own a home among younger people: more than 90 percent of those under 45 said they wanted to own their own residence.    Another survey by TD Bank found that 84 percent of renters aged 18 to 34 intend to purchase a home in the future. And a Better Homes and Gardenssurvey found that three in four sawhomeownership as “a key indicator of success.”

    Survey data also suggests that millennials are highly focused on getting married and being good parents. Nearly four in five millennials express a desire to have children. This will become more significant as millennials reach their 30s and early 40s, the prime age for family formation. Over the next decade, at least six million people will be entering their 30s, and that number is expected to keep expanding through 2050.

    None of this suggests that, as some social conservatives might hope, that the Ozzie and Harriet family is about to make a major comeback. For one thing, millennials will likely get hitched and have children later than previous generations. Their marriages also will probably be less traditional and male-centered. Hais and Winograd assert that millennials are a “female dominated” generation and have a less traditional view of sex roles—or for that matter, what constitutes a family, since they tend to be highly supportive of same sex marriage.

    But if they differ from past generations, most millennials clearly do not aspire to the ideal of singleness and childlessness embraced by more radical boomer enthusiasts. That said, they will not recreate the family or their residence in their parents’ image. They may, for example, be more willing to customize their residences for their own unique needs or for greater energy efficiency, and place greater emphasis on “technology capabilities” than on a larger kitchen, or some more traditional suburbanaccoutrements.

    As they get on with life, they will also make new demands on their bosses, warn Hais and Winograd. Companies will need to accommodate as well the new familial arrangements that Millennials are likely to seek out. This means firms will need to adopt policies that favor telecommuting, flexible hours, and maternity and paternity leave that will allow for a better balance between work and personal life.

    But in the long run, millennials, if given a chance, are likely to maintain the national ethos of aspiration despite the powerful headwinds they now face. As Turner suggested at the end of his famous essay, it would be “a rash prophet who would assert that the expansive character of American life has now entirely ceased.”

    The real issue here is not the declining validity of American aspiration, but overcoming the economic, political and social factors that threaten to suffocate it. Similar challenges—the concentration of wealth of the Gilded Age, the Great Depression, war, and environmental angst—have periodically appeared and were eventually addressed through technological innovation, and critical political and social changes. Rather than accept the shrinkage of the American prospect, we should seek ways to restore it for those who will inherit this republic.

    This story originally appeared at The Daily Beast.

    Joel Kotkin is executive editor of NewGeography.com and Distinguished Presidential Fellow in Urban Futures at Chapman University, and a member of the editorial board of the Orange County Register. He is author of The City: A Global History and The Next Hundred Million: America in 2050. His most recent study, The Rise of Postfamilialism, has been widely discussed and distributed internationally. He lives in Los Angeles, CA.

  • The Tough Realities Facing Smaller Post-Industrial Cities

    A couple weeks ago the Economist ran a leader and an article on the plight of smaller post-industrial cities, noting that these days the worst urban decay is found not in big cities but in small ones. They observe:

    Partly, this reflects the extraordinary success of London and continuing deindustrialisation in the north of England. Areas such as Teesside have been struggling, on and off, since the first world war. But whereas over the past two decades England’s big cities have developed strong service-sector economies, its smaller industrial towns have continued their relative decline. Hartlepool is typical of Britain’s rust belt in that it has grown far more slowly than the region it is in. So too is Wolverhampton, a small city west of Birmingham, and Hull, a city in east Yorkshire.

    And even with growth, the most ambitious and best-educated people will still tend to leave places like Hull. Their size, location and demographics means that they will never offer the sorts of restaurants or shops that the middle classes like.

    Their editorial forthrightly embraces a policy of triage, saying “The fate of these once-confident places is sad. That so many well-intentioned people are trying so hard to save them suggests how much affection they still claim. The coalition is trying to help in its own way, by setting up ‘enterprise zones’ where taxes are low and broadband fast. But these kindly efforts are misguided. Governments should not try to rescue failing towns. Instead, they should support the people who live in them.”

    This same dynamic is clearly evident in the United States as well. Bigger cities have tended to weather industrial decline far better than smaller ones. There seems to be some threshold size below which it is difficult to support the infrastructure, the amenities, and the thick labor markets that attract the people and businesses in 21st century growth industries. My “Urbanophile Conjecture” heuristic suggests that you need to be a state capital with a population greater than 500,000 to be thriving. But even larger places that aren’t capitals and conventionally viewed as failures like Detroit retain powerful metro area economies and large concentrations of educated workers, especially in the suburbs. Conversely, smaller places like Youngstown, Ohio and Flint, Michigan face much bleaker circumstances.

    There are exceptions to the rule, including many delightful college towns or the occasional oddball like Columbus, Indiana, but for the most part smaller post-industrial cities have really struggled to reinvent themselves.

    In part this is because a rising tide hasn’t lifted all boats, only some of them. As economist Michael Hicks noted, “Almost all our local economic policies target business investment, and masquerade as job creation efforts. We abate taxes, apply TIF’s and woo businesses all over the state, but then the employees who receive middle class wages (say $18 an hour or more) choose the nicest place to live within a 40-mile radius. So, we bring a nice factory to Muncie, and the employees all commute from Noblesville.”

    In short, growth actually fuels divergence because a) the growth disproportionately accrues to the places that are doing well in the first place and b) even when struggling cities can attract jobs, people earning middle class wages frequently live elsewhere. Doug Masson likened this to Jesus’ statement that “For he that hath, to him shall be given: and he that hath not, from him shall be taken even that which he hath.” I think there’s a lot of evidence that for bigger cities a lot of activity is exhibiting a convergent or flattening effect. That’s why so many places today have decent startup scenes, quality food, agglomerations of talent, etc. But for smaller cities my observation is that it’s still a divergent world.

    You see this on full display in central Illinois, where the town of Danville (population 33,000) and Champaign-Urbana (combined population 124,000) are only about half an hour’s drive apart on I-74. Danville is one of the bleakest towns I’ve ever visited in the Rust Belt. When your Main Street is a STROAD, you know you’re in trouble. Champaign-Urbana by contrast, is a fairly healthy community. It’s home to the main campus of the University of Illinois, seems to be reasonably thriving, has many high quality residential streets, a direct rail connection to Chicago, etc. As a college town, it’s one of those “exception” smaller places.

    Anyone within reasonable driving distance with a choice would almost undoubtedly choose to live in Champaign over Danville, unless they had a family or personal connection to the latter. It’s an easy slam dunk decision. In effect, proximity to Champaign acts as kryptonite to Danville’s revitalization. Again, a rising tide only fuels this divergence.

    This sort of divide between communities mirrors the divide in society as well. The question is, what approach should be taken to address these disparities? One approach is to focus on the people, and leave the places to rot. Jim Russell has noted that “people develop, not places” thus most place based economic strategies are destined to fail. This approach has also been advocated by economist Ed Glaeser, who in an article title, “Can Buffalo Ever Come Back?” answered his own question by saying, “probably not—and government should stop bribing people to stay there.”

    This is obviously unpalatable to policy makers of either the left or the right, as no one has yet embraced it openly. How then have the left and right responded? The response of the left seems to be what Walter Russell Mead has labeled the “blue model” solution. His basic view is that the post-war economy was based around a policy consensus he labeled the blue social model (and which Urbanophile contributor Robert Munson has simply labeled the New Deal). This involved large corporations, powerful unions, extensive industrial regulation, and an expanding safety net. Those who wish to retain the model suggest allowing divergence to continue, but raising taxes on the wealthy and successful in order to redistribute them to sustain those at the bottom of the ladder (via an expanded welfare state), who are in effect seen as lost causes in the modern global knowledge economy, though few of them will openly say it. So the idea is to invest in success, and redistribute the harvest aggressively. That’s why you see lots of left advocacy in favor of tax increases on higher income earners and against food stamp and other benefit cuts, but a paucity of ideas for how to provide the left behinds with jobs and opportunity.

    Mead suggests there’s no such thing as the red social model, and perhaps he’s right in that there’s never been a national policy consensus we could label as such, but there’s certainly a red model response to current conditions and it’s called the Tea Party, or what Mead has labeled a “Red Dawn” in many places like KansasNorth Carolina, and New Mexico. This is a type of single factor determinism model. In these kinds of models, a single factor like education, transportation infrastructure, climate, etc is treated as overwhelmingly determinant in driving the economic structure and outcomes. The factor posited by the Red Dawn model is government, therefore the red model response is to slash and burn government (with the potential exception of highway spending) to lower costs, taxes, and regulatory barriers that are perceived to be holding the economy back. In other words, government is the base, and the economy and everything else is the superstructure. Fix the base and the superstructure will correct itself. That’s the theory.

    Broadly speaking, these are the paths that Illinois and Indiana have followed. Chicago’s size enables it and its values to political dominate the state in the modern era. With only a rump of a Republican Party, the Democrats are free to do what they like. Conversely, in Southern influenced Indiana it is the outstate areas that are numerically superior to the successful urban regions, thus the state follows their policy preference, and Republicans overwhelmingly dominate the state so there’s little real opposition to red model policies.

    What have the results been? Most obviously, Illinois is nearly bankrupt while Indiana is sitting on a AAA credit rating and a $2 billion surplus in the bank. (It has a pension deficit, but it’s manageable and there’s a funding strategy in place). Clearly Indiana has a more functional political system than Illinois, which somehow manages to remain gridlocked despite a “four horseman” style legislative system and overwhelming Democratic dominance. So score two for Indiana.

    Finances aside, what have the results been? Illinois has poured massive quantities of cash into building on success, with items like the O’Hare Modernization Program and Millennium Park. The successful side of the economy, epitomized by the global city portion of Chicago, has soared to incredible heights. This is a city that earned at seat at the table of the global elite. On the other hand, the overlooked areas like much of the south and west sides of Chicago and places like Danville, are in horrific shape. The goal of allowing divergence clearly worked. However, with the state’s finances in abysmal shape, the redistribution portion did not happen. Indeed, the social safety net and basic services depended on by the rest of Illinois are being shredded. Even if you believe that it’s viable to simply support a large lumpenproletariat in perpetuity on welfare – which is doubtful – financial extremis means Illinois isn’t even able to try.

    Meanwhile in Indiana, pretty much the entire state policy has been reoriented towards making the left behind areas attractive to lower wage businesses. Policies that would cater to higher end businesses in successful urban areas have been less popular. That’s not to say there’s been nothing. Gov. Pence recently agreed to subsidize a non-stop flight between Indianapolis and San Francisco to help the local tech industry, for example. And he’s supported efforts to boost the life sciences sector. But I think think it’s fair to say low costs and low taxes are the watchword, with right to work, light touch environmental regulation, mass transit skepticism, etc.

    However, most of Indiana’s left behind type places have not recovered. Overall the state has retained a stubbornly high unemployment rate significantly above the US average, and, even more worrying, incomes have been declining relative to the US. Metropolitan Indianapolis, Lafayette, Bloomington, and Columbus have done reasonably well. Much of the rest of the state has continued to struggle, particularly in adding jobs with middle class wages. As the recent commentary by Brian Howey, Michael Hicks, and Doug Masson shows, Indiana retains its “Noblesville-Muncie” divides mirroring Illinois’ “Champaign-Danville” ones.

    In short, the blue and the red model produced some success, albeit in different modes (think San Francisco vs. Houston, Chicago vs. Indianapolis), for the “haves” side of the equation but haven’t yet proven equal to the “have nots.” The Economist makes it clear the totaly different policy configurations of the UK haven’t made a dent in it either. Post-industrial blight in much of Europe tells a similar tale. This suggests that there are powerful macro forces at work that are extremely difficult if not impossible to overcome. It’s no surprise then that the Economist suggests giving up.

    Again, that’s not likely, so what should we do? I won’t pretend to have all the answers to a very difficult question. However, I’ll suggest a few possibilities:

    • Seek to stop the civic death spiral. This means getting ahead of the decline curve by seeking to halt the cycle of people and businesses leaving, leading to revenue declines and degraded quality of place, leading in turn to to service cuts and tax increases and disinvestment, which leads to more people and businesses leaving. This involves getting ahead of decline and restructuring government to a place where you can hold a defensible position on services and taxes from which you can seek to rebuild.
    • Integrate with metropolitan economies. Rather than Muncie trying to hold Noblesville/Metro Indy at bay, or Danville the same to Champaign, closer connectivity is the key. I’ve written on this before regarding Indiana. In the short term losing the highly paid employees to a nearby municipality is a good thing. Without those living options for the managers, etc. you’d never be in play for the plant in the first place. That connection expands your labor pool, provides trade opportunities, etc. Just the property taxes from the plant is valuable, and can be used in rebuilding. Fostering these connections would require decisions that seem counter-intuitive on the short run. For example, Ball State University in Muncie should clearly expand its downtown Indianapolis presence. That isn’t necessarily taking away from Muncie. It’s building new connections and opportunities for Muncie where they don’t exist today.
    • Find a claim to fame around which to rebuild. Carl Wohlt says that every commercial district needs to be known for at least one sure thing. Similarly, what’s Danville’s sure thing? Some towns like Warsaw or Elkhart already have it and need to build on it. Others need to find one. That’s not to say one thing is the only thing you’ll ever need or that you aren’t opportunistic around potentials deals that come your way. But you have to start somewhere. Where do you put your limited available civic funds?

    I’m not so naive as to think this it the complete answer. But if there’s to be a genuine attempt to rescue places, then new thinking is needed and a turnaround will take a long time. In the meantime in parallel, clearly people-centric solutions also need to be pursued, to give people the best opportunity to realize their potential and dreams in life, where ever that may take them. No city is a failure that does this for its citizens.

    Aaron M. Renn is an independent writer on urban affairs and the founder of Telestrian, a data analysis and mapping tool. He writes at The Urbanophile, where this piece originally appeared.

    Photo by Randy von Liski

  • Playing Musical Chairs with World Economies

    The world’s largest economies seem engaged in something like the children’s game of “musical chairs.” For years, the United States has been the world’s largest national economy, though in recent decades the integrated economy of the European Union has challenged that claim given that the region   includes four of the ten top national economies, Germany, the United Kingdom, France and Italy. The most recent data, reflecting the deep European recession, indicates that the top position has been retaken by the United States.

    The International Monetary Fund (IMF) has released its semi-annual World Economic Outlook Database for October 2013. Information is provided for 189 country-level geographies, from 1980 to the present, with projections to 2018. Despite the economic malaise, the IMF data shows the US gross domestic product, adjusted for purchasing power parity (GDP-PPP), to be greater than that of the combined 28 member European Union (EU). This development, however, is at least partially due to accounting revisions, which are described below.

    2012 Gross Domestic Product (Purchasing Power Parity)

    The new data shows the United States to have a 2012 GDP-PPP of $16.245 trillion (current international dollars), two percent above the EU’s $15.933. This difference is relatively minor – the equivalent of Maryland’s GDP. In 2011, the EU led the US by a small margin, before the accounting methodology change. The IMF expects the US lead to be lengthened to approximately 10 percent by 2018. For comparison, in 1980, the same 28 EU economies had a GDP nearly one-quarter larger than that of the United States (Figures 1 and 2). However, it must be noted that in 1980, the European Union had only nine members and had an economy 8 percent smaller than that of the US.           

    China’s reduced, but still strong economic growth has propelled it to a GDP-PPP of $12.3 trillion, reaching 75 percent of the US figure. By 2018, the IMF expects China to reach 96 percent of the US GDP. If the IMF projected GDP increase rates of China and the US were to continue, China would be a larger economy than the United States by 2020. While this may be seem to be occurring sooner than expected, it is consistent with the expectation of former IMF economist Arvind Subramanian, in his book Eclipse: Living in the Shadow of China’s Economic Dominance. The scale of Chinese economic miracle that started under Deng Xiaoping can be seen by the fact that in 1980 its GDP was barely 10 percent of the US economy (See Ronald Coase and Ning Wang, How China Became Capitalist).

    India’s economy also continues to progress. Now the world’s fifth largest economy, India’s GDP-PPP is estimated at $4.7 trillion. By 2012, India’s economy had reached 29 percent of that of the United States, nearly triple the 1980 figure. IMF expects India to close the gap by another five percentage points by 2018.

    Japan has fallen to the fifth largest economy, at approximately $4.58 trillion. Japan had grown strongly after World War II, having reached 35 percent of the US economy by 1980. A number of experts, such as Harvard’s Ezra Vogel, expected that Japan would continue to close the gap with the United States. But Japan’s ascendency stopped by 1991, when it reached a size 41 percent of the US economy. In the subsequent economic slide, Japan’s economy fell to 28 percent of the US by 2012. IMF expects another two point drop by 2018.

    Gross Domestic Product per Capita (Purchasing Power Parity)

    The United States remains dominant in personal affluence among the world’s largest economies. In 2012, the US GDP-PPP per capita was $51,700. The European Union had a GDP-PPP of $31,600 in 2012, but is declining relative to the United States. In 2012, the EU GDP per capita was 61 percent of the US figure. This is down from a peak of 66 percent in 1982. IMF projects a further three percentage point loss by 2018 (Figures 3 and 4). The GDP-PPP per capita of the nations in the 9 nation European Union of 1980 was higher, at $36,100 in 2012 (Figure 5).

    Despite China’s potential for becoming the world’s leading economy by the beginning of the next decade, its huge population makes the GDP per capita much lower. In 2012 China’s GDP per capita was $9,100, about 18 percent of the US figure. This is, however, far higher than the 1980 figure of 2 percent. IMF expects China’s GDP per capita to rise to $14,900 by 2018, 23 percent of the US figure. 

    India’s GDP per capita was $3,800 in 2012, or seven percent of the US GDP per capita. India’s progress has been rapid, though   strongly overshadowed by China. India’s GDP per capita was 70 percent higher than China’s in 1980, but now China’s is now 60 percent higher. However, India has gained five percentage points on the US since 1980.

    Japan’s GDP per capita stood at 69 percent of the US figure in 2012 ($35,900), down significantly from 1991, when Japan’s GDP per capita reached 84 percent of the US level. IMF projects about a 1.5 percentage point further decline by 2018.

    Accounting Revision

    As is noted above, the accounting changes implemented by the United States have changed the world rankings and their prospects

    Data in the IMF’s last release (March 2013) placed the European Union slightly ahead of the United States in GDP-PPP. The United States is the first country to fully implement internationally agreed upon changes to national accounts (United Nations’ System of National Accounts 2008).  The IMF summarizes the revisions and its impact on the US economy as follows:

    “…expenditures on research and development activities and for the creation of entertainment, literary, and artistic originals are now treated as capital expenditures. Furthermore, the treatment of defined-benefit pension plans is switched from a cash basis to an accrual basis. The revisions increase the level of GDP by 3.4 percent and boost the personal savings rate.”

    The US Department of Commerce, Bureau of Economic Analysis indicates that Europe will convert to the new methodology in 2013 and it is to be expected that other nations will quickly follow.

    Before the accounting revision IMF data predicted that US would not pass the EU until 2015. Further, the previously lower GDP figures predicted that China would pass the United States just two years later (2017). China may have to wait to assume the top chair, but perhaps not. It all depends on how fast China converts to the new accounting and the impact of the revision on GDP figures.

    An Uncertain World

    Of course, economic projections cannot be “taken to the bank.” The world economy is volatile and uncertain and more so now that in more stable times.

    The US economy continues to sputter along with lagging growth. The European economy is doing even more poorly. Mixed signals continue to be heard from China, where astronomic growth rates are being replaced, at least for the moment, by more modest ones. President Xi Jinping says that China can create sufficient employment for its growing urban workforce with a 7.2 percent growth rate (See: “China Needs 7.2% Growth to Ensure Employment” in The Wall Street Journal) – a rate that would be the envy of each of the world’s strongest economies.

    The big high income world nations also have reason to envy India. According to the Organization for Economic Cooperation and Development (OECD), the economy of India “clocked a low growth rate of 4.4 percent” in the April to June quarter. The OECD characterized India’s immediate economic prospects as “weak,” yet India’s growth rate is far above those of the US, EU and Japan.

    The Bank of Japan (BOJ), the nation’s reserve bank, is optimistic about the nation’s new growth-seeking policies under “Abenomics” (named after Prime Minister Shinzo Abe). But the BOJ predictions of economic growth at 1.5 percent in 2014 and 2015 are favorable only in the light of Japan’s anemic recent growth.

    All of these predictions, combined with accounting changes, paint a blurred picture. This is the nature of a world economy that the IMF refers to as being stuck in “low gear.”

    Wendell Cox is a Visiting Professor, Conservatoire National des Arts et Metiers, Paris and the author of “War on the Dream: How Anti-Sprawl Policy Threatens the Quality of Life.

    —-

    Photo: Bank of China (right) and Peace Hotel, Shanghai (by author)

  • American Cities May Have Hit ‘Peak Office’

    Despite some hype and a few regional exceptions, the construction of office towers and suburban office parks has not made a significant resurgence in the current recovery. After a century in which office space expanded nationally with every uptick in the economy, we may have reached something close to “peak office” in most markets.

    The amount of new office space in development is extraordinarily low by historical standards, outside of a handful of markets. Back in the mid-1980s, according to the commercial real-estate research firm CoStar, upward of 200 million square feet of office space was built annually. After dropping precipitously in the early 1990s, construction rose again to 200 million square feet a year in the early 2000s before dropping well under 150 million square feet in 2006, and lower after that. This year, in what is purported to be the middle of an economic recovery,  we will add barely 30 million square feet,according to Reis Inc.

    Even with this paltry construction, vacancy rates nationwide have barely moved, hovering around 17%. This is nowhere near low enough to justify much more construction in the vast majority of markets, where office rents remain well below 2007 levels.

    Indeed, the trend in real estate remains to convert office spaces to other uses,particularly residential. Large-scale office construction is happening in just a handful of markets; New York and Houston are the only ones with 10 million square feet being built, with smaller amounts in the works in Boston, Washington, Dallas-Ft. Worth and the San Francisco Bay Area.

    Most of the current anemic growth is happening outside downtown areas. Silicon Valley, which is essentially a sprawling suburb, currently has about as much construction as San Francisco. In Houston, another big metro area with robust job growth, there is a new 47-story high-rise being developed downtown, but much of the action is taking place on the periphery, notably in the Energy Corridor. ExxonMobil’s massive new campus, at 3 million square feet, ranks with One World Trade Center in Manhattan as the nation’s largest new office projects.

    Through the third quarter this year, the amount of new office space under construction in suburban areas was roughly double the amount being built in central business districts, by CoStar’s count. Furthermore, only 7.1 million square feet of office space was absorbed downtown in the first nine months of 2013, compared to 51.5 million in suburban areas, CoStar says. But overall there is still 100 million square feet less space being used today than in 2007, and at current absorption rates, it could take six or seven years just to get back to where we were before the recession.

    The Weak Economy

    The key question here is not the geography of office space but why so little is being built. As long as economic growth is modest, don’t expect much change in the skyline in most downtowns, or suburbs. Job growth has been mediocre at best, and much of that has been in the low-wage and part-time category. McJobs and part-time workers do not generally fill office towers.

    The dirty little secret of this recovery is that labor participation rates are at the lowest level since 1978. Underemployment is rife, at around 18% to 20%, and much of that likely includes large numbers of people who used to work in offices.

    This is true even in New York City, where the rate of “office-using employment” has been dropping since the late 1960s and even in the recovery, has yet to rebound to the levels of 2000.

    Changing Use of Space

    Just as we have gotten used to more fuel-efficient cars, companies now utilize space more efficiently than before, largely through information technology. This is a trend many companies plan to accelerate. In the past, for example, your average mid-level executive had his own secretary; now it’s more common to have perhaps one aide for several managers. Historically office developers assumed that each worker would require 250 square feet of space; by the end of the decade this could drop to 100 to 125 square feet.

    Even the most notoriously bureaucratic of professions, law, is scaling back. A recent Cushman and Wakefield survey  found that most firms — many already downsizing — were working to reduce their office footprint per attorney from 800 to 500 square feet. Almost two out of five expect to use “hoteling,” or the sharing of offices among attorneys, something very rare a decade ago.

    At the same time, some of the sectors that are the best bets for expansion, such as information technology and media, are increasingly seeking out unconventional office space. Mayor Mike Bloomberg’s drive to upzone large parts of Midtown Manhattan to create ever-taller towers works operates on the assumption that new users will be much like the old ones. But some experts, such as New York-based architect Robert Stern, suggest that ultra high-rise development does not appeal to either creative businesses and tourists, while preserving older districts, with already developed buildings, does.

    Self-Employment and Home-Based Businesses

    Perhaps the biggest long-term threat lies in the shift from corporate to self-employment. From 2001 to 2012, the number of self-employed workers grew by 14%, according to a recent study by Economic Modeling Specialists. This is occurring not only in the metro areas that suffered the worst during the recession, such as Phoenix, Los Angeles and Riverside-San Bernardino, but also in the healthiest economies such as Houston and Seattle.

    Some of these now self-employed workers may end up in small offices, but many don’t leave home at all. Working at home is growing far faster than commuting by either car or transit, and in most U.S. metro areas, far exceeds those who get to work by public conveyance, most often to downtown areas. Over the past decade the number of U.S. telecommuters expanded 41% to some 1.7 million, almost double the much-ballyhooed increase of 900,000 transit riders.

    Are We Blowing Another Bubble?

    In some specialized, fast-growing markets, new office construction may well be justified. Raleigh is seeing some new construction in its small downtown, as are hot job markets such as Austin and oil-rich Midland, Texas, where a proposed 53-story office tower would be the tallest building between Dallas and Los Angeles.

    But in New York, plans for massive new office tower construction seem to contradict an unemployment rate considerably above the national average. Financial services, the primary driver of the Manhattan market, is showing signs of economic distress, with firms moving middle-management jobs to more affordable places such as Richmond, Va.; Pittsburgh; St. Louis; and Jacksonville, Fla.

    Perhaps even more worrisome, less than half of the space in new buildings in Manhattan is preleased, compared to over 70% in both Houston and Boston, and a remarkable 92% in San Jose/Silicon Valley. This reflects an apparent dearth of large employers in New York who could conceivably afford and fill ultra-expensive office space in the coming years, a recent article in Crain’s New York points out. Tech companies might be expected to help fill the gap, but we have to remember that after the last boomlet Silicon Alley suffered asteep contraction; it has since recovered, but could be hit hard again if the current bubble pops.

    San Francisco, the other current darling of office developers, is even more dependent on the current dot-com boom. The IPOs of Frisco-based firms such as Twitter appear to suggest the prospect of a whole new generation of office occupants. By one account, there is as much as 12 million square feet of new office space in the pipeline in the city, enough to satisfy historical demand for the next 16 years.

    Yet past experience shows many of these companies will likely dissolve or merge in the next few years. They may be fewer in numbers and longer established than last time around, as some local boosters eagerly suggest, but most are still unprofitable and many may never be truly viable. Following the 2000 dot-com crash, San Francisco office occupancy dropped roughly 10 million square feet, while tech employment crashed from a high of 34,000 in 2000 to barely 18,000 four years later.  As one real-estate executive put it at the time, “The office-space market here ”reminds me of the Road Runner cartoon where the Coyote runs into the wall.”

    Observers also point out that more traditional businesses, such as banks, continue to ship jobs elsewhere, in large part due to extraordinarily high costs. The fact that pre-leasing for SF’s new office buildings is barely 33% should add to the caution.

    None of this suggests there are not some good opportunities for new construction, but the office building’s role as a key indicator of the strength of the U.S. economy has faded. In great cities, rather than a ballyhooed era of new office skyscrapers we will see more conversions and the construction of residential high-rises, as well as medical buildings. The secular trend is for the dispersion of business service employment to smaller markets, and into people’s homes. The glory days of the American office tower are over, and not likely to return soon, given technological trends and a persistently tepid economy.

    This story originally appeared at Forbes.

    Joel Kotkin is executive editor of NewGeography.com and Distinguished Presidential Fellow in Urban Futures at Chapman University, and a member of the editorial board of the Orange County Register. He is author of The City: A Global History and The Next Hundred Million: America in 2050. His most recent study, The Rise of Postfamilialism, has been widely discussed and distributed internationally. He lives in Los Angeles, CA.

    Photo by Mark Lyon — Full Floor For Rent.

  • Density, Unpacked: Is Creative Class Theory a Front for Real Estate Greed?

    “The heresy of heresies was common sense”—George Orwell

    The stories we tell affect the lives we lead. I do not mean to be abstract here. I mean, literally, the stories that are told make up a kind of meta-reality that soaks in us to form a “truth”. This “truth” affects policy, which affects investment, which affects bricks and mortar, pocketbooks, and power. Eventually, the “truth” trickles down into a more real reality that defines the lives of the powerless.

    The story du jour in urban policy is one of density. The arc of the story is that cities are places where “ideas come to have sex”. The lovechild is innovation. The mood lighting is creative placemaking.

    The Kama Sutra of density reads this way: creative people cluster in cities that are good at lifestyle manufacturing. The more people that are sardined the higher likelihood there will be “serendipitous” encounters. The more serendipity in a city the better chance the next “big thing” will occur. The next “big thing” will lead to a good start-up, which will lead to an agglomeration of start-ups, termed an “Innovation District”. Detroit becomes Detroit 2.0 then.

    The story of density is a seductive story. Society-making is sobering and full of harsh realities. The story of density is seamless, velvety. It is no wonder the story gets sold, implemented, and then told and re-told, despite the validity and logic of the story being pretty awful.

    Take the recent New York Times piece entitled “What It Takes to Create a Start-up Community”. In it, the writer interviews urbanist Richard Florida. “Population density, [Florida] said, allows for the serendipitous encounters that inspire creativity, innovation and collaboration,” reads one key passage in the piece.

    The story goes on to highlight the emerging tech hub of Boulder as the exemplar of the story of density. One problem: Boulder, a city of less than 100,000, isn’t dense, with a population per square mile of 3,948. The writer moves the goal posts a bit and says the city “is an unusual case of density”, before going on to question whether a start-up community can be created in a city like Detroit that “lacks density”. Yet Detroit, despite being a land mass comprised of one-third vacant land, is denser than Boulder, at 5,144 people per square mile. In all, Aristotle would have a field day with the piece.

    Such illogic peppers the story of density, particularly as it relates to the correlation—to say nothing of the causation—between household clustering and tech growth. For instance, in a recent analysis of America’s top “high tech hot spots” by the Progressive Policy Institute, the top 25 counties experiencing the highest percentage of tech job growth reads like a “Where’s Waldo” list, if Waldo was Thoreau-like. There’s Madison County in Alabama (417 people per sq. mile). Utah County in Utah (258 people per sq. mile). Denton County in Texas (754 people per sq. mile). Fayette County in Kentucky (1,043 people per sq. mile). Snohomish County in Washington (342 people per sq. mile).

    To be fair, also on the list are San Francisco, Boston, and New York. In the case of Boston and San Fran, the tech clustering is a legacy asset—including large venture capital funds — from decades prior, not the result of the story of density. New York, under Mayor Bloomberg, has supposedly gone whole hog on the “idea-sex in the city” script, yet tech is but a speck on the universe that is New York City’s economy.

    For example, Kings County, home to Brooklyn, numbers 25 on the list of places with highest percent of tech job growth, yet Brooklyn’s Job Index—calculated as new tech/information jobs between 2007 and 2012, as a share of 2007 total private sector employment—is just 0.4, meaning the number of new tech jobs in Brooklyn represents less than half a percent of total private employment. Given the information sector as a whole is hemorrhaging jobs according to a recent Harvard Business Review, the scaling of fledgling tech towns is unlikely. This is especially true for cities like New York that—while enriched with the chattering class buzz stoking the story of density—simply lacks the engineering talent of Boston, Silicon Valley, Houston and yes, Detroit , to make the “scene” something than just that: a scene.

    But let’s play along anyway, as that’s the power of the story of density: reality doesn’t bite. So, say Brooklyn can become the next Silicon Valley. This likelihood depends on two assumptions that define the story of density: “cooling” a city will draw top tech talent, and then packing them in to luxury condo towers and mixed use districts will form creativity incubators.

    First, the idea that manufacturing cool spurs a start-up scene is spurious at best. I mean, has this ever worked? Please don’t say Austin, or any number of college towns or state capitals or places with boutique streets that depend largely on transfers from taxpayers — and parents! — to their privileged burgs. Many of these place, like Austin and Raleigh, are themselves far from dense urban nodes, but are exceptionally spread out.

    What about Boulder? In the piece “How Boulder Grew Into a Hub for Start-Ups”, the writer questions venture capitalist Brad Feld, a huge player in the Boulder tech scene, about what brings entrepreneurs to communities like Boulder. Feld throws his hands in the air:

    “People want to live where they want to live. You should figure out where you want to be and build a life around it. Different geographies attract different people.”

    Why did Feld move to Boulder?

    Actually, I moved here in 1995 because Amy said "I’m moving to Boulder – you can come with me if you want." And I did.

    There are things that do appeal to innovators, however. Affordability is an appeal, so says a recent survey of London techies who are decamping from the capital, if only because outrageous rents prevent a “start-up” of anything.

    Over in Berlin, the tech scene is struggling despite the “Berlin geek chic” culture that unfolded. The city’s tech leaders think Berlin needs to be more conventional than cool. “[T]he jury is still out on whether [Berlin’s] a great place to truly grow that company into a mature startup," notes Marc Strigel, head of SoundCloud. "Both the authorities and startups could do much more in promoting Berlin for families, for these world-class talents we definitely need."

    The second assumption relates to the idea that sardining people will ultimately lead to serendipity and innovation. I smell underpants gnomes. Specifically, in an episode of South Park, creators Trey Parker and Matt Stone expose the blind loyalty attached to the façade of “expertise”. The episode goes like this: the characters need a presentation for class. One of the boys talks about a group of gnomes that inexplicably sneak into his house to steal underpants. There’s got to be a reason, right? They confront the gnomes who, claiming to be business experts, explain their business plan as thus: Step 1: Collect Underpants. Step 2: ?. Step 3: Profit.

    The story of density has the same logic gap. Step 1: Population density. Step 2: ?. Step 3: Innovation. Density gurus will claim Step 2 relates to serendipity. But serendipity is chance. How do you plan for chance? Even if you could, creative classification is largely a process of homogenization by class, age, and profession, which, according Rita King of Science House, erodes the possibility of meaningful chance encounters. “Artists bumping into other artists or business people bumping into other business people or Mormons bumping into other Mormons, etc., isn’t real serendipity,” notes King. San Francisco in many ways is more a monoculture than the highly diverse suburbs that surround it.

    Okay, so if the story of density really isn’t about innovation then what is it about? The answer can be found in a recent article entitled “Urban Prophet” in the real estate trade mag Property Week. The piece quotes Albert Ratner, chairman of US real estate firm Forest City Enterprises, on his reading of Florida’s The Rise of the Creative Classes, the first book in the story of density. “You have given real estate developers the playbook,” notes Ratner.

    Put simply, the point of sardining is to make as much money as possible for those who already  have the most . This is the raw truth that fuels the hype, and of course pays for it as well. But it’s a tough sell to neighborhoods and cities increasingly experiencing the negative effects of real estate wealth jamming, and more broadly wealth inequality. Enter the story of density to make another “truth”.

    In reality, the story of density is a fiction and it’s high time we start rewriting the book.

    Richey Piiparinen is a writer and policy researcher based in Cleveland. He is co-editor of Rust Belt Chic: The Cleveland Anthology. Read more from him at his blog and at Rust Belt Chic.

  • L.A. Ports Face Challenge from Gulf Coast

    In this strange era of self-congratulation in California, it may be seen as poor manners to point out tectonic shifts that could leave the state and, particularly, Southern California, more economically constrained and ever more dependent on asset bubbles, such as in real estate. One of the most important changes on the horizon is the shift of economic power and influence away from the Pacific Coast to the Gulf Coast – the Third Coast – a process hastened by the imminent widening of the Panama Canal. Over time, this could represent a formidable challenge to our status as a critical global region.

    It is easy to live in Southern California – particularly in the more-affluent, coastal sections or the middle-class inland valleys – and hardly know how critical international trade is to our regional economy. Invisible to denizens of Malibu or Newport Beach, the ports of Long Beach and Los Angeles together account for almost 40 percent of U.S. container imports. Along with Hollywood, and our climate, it represents arguably the region’s greatest asset.

    Overall, the ports are the critical linchpin of the roughly 500,000 jobs tied to logistics, warehousing and trade services. These jobs, notes economist John Husing, provide a wide range of generally higher-paying blue-collar employment compared with, for example, hospitality or retail. This is critical in a region with a large undereducated, but motivated, workforce.

    Southern California’s emergence as the nation’s largest trading center has been unlikely, tied more to ingenuity and ambition than natural geography. Unlike its West Coast rivals – San Diego, Seattle and, most particularly, San Francisco – the Los Angeles region does not boast a great natural harbor. Its construction, starting in the early decades of the previous century, was completely man-made and conceived.

    By the 1980s, sparked by a shift of trade from Europe to Asia, the ports of Los Angeles and Long Beach started to overtake, in merchandise trade value, New York, which had dominated U.S. trade since the first decades of the 19th century. Along with trade came business connections, direct air travel and a surge of Asian immigration. Today, Los Angeles, with roughly 1.5 million Asians, ranks first among America’s counties for Asian population, while Orange County, with more than 530,000 Asian residents, ranks third, just behind the Santa Clara-Silicon Valley region.

    Wider canal coming

    These advantages, human as well as geographic, are critical to the region’s global status. But this could change, in part due to the expansion of the Panama Canal – set for completion in late 2014 or in 2015 – which will open to Asian businesses the opportunity to send megaships directly to the Gulf Coast or the Southeast.

    “Trade will shift,” predicts Khalid Bachkar, a professor at the California Maritime Academy.

    There are other challengers to our supremacy, including port expansions in both Western Canada and Mexico that could offer newer facilities and rail connections directly within their own countries and the vast U.S. market. But the greatest challenge seems likely to come from the Gulf, which offers excellent access to trains that carry goods directly to the vast majority of the United States.

    Demographic trends will also play a role. In the 1970s and 1980s, the Pacific Coast seemed like the premier growth market, but high housing prices, taxes and regulatory restraints – and, most importantly, outmigration – have slowed regional business growth.

    In the next four years, notes Pitney Bowes, Houston is expected to have the largest household growth in the country: some 140,000 people, an increase by 6.7 percent. Most of the other fast-growth regions in the nation – Dallas-Fort Worth, Austin, Texas, Raleigh-Cary, N.C., San Antonio, Jacksonville, Fla., and Charlotte, N.C. – are located either along the Gulf or are natural markets for their ports.

    In contrast, Los Angeles is projected to grow by only 1.5 percent and Orange County by less than 2 percent the next four years.

    Critically, the Gulf is, for the first time, attracting a critical mass of Asians. Over the past decade, Houston has enjoyed some of the nation’s fastest growth in Asian population, up some 70 percent, and its Asian community is now the eighth-largest in the country. Houston’s Asian population is now growing three times as rapidly as that of the San Francisco or Los Angeles areas.

    Energy exports

    At the same time, the expansion of oil and natural gas production in Louisiana, Texas and the Plains makes the Gulf ports major players in the emergence of the U.S. as an energy exporter. The Gulf Coast also is home to many of the nation’s largest industrial investments, including from overseas. The Port of Houston, for example, posted a 28.1 percent jump in foreign trade in 2012, and trade at reached records levels at the Port of New Orleans (I work as a consultant in that city).

    Agriculture has also been on a roll in terms of exports, and 50 percent of the nation’s grain shipments through Louisiana ports. Combined with rising energy and industrial growth, the Third Coast now claims a growing share of U.S. trade. Since 2003, the value of exports from the Gulf ports has more than tripled; the region’s share of U.S. exports over that period grew from roughly 10 to nearly 16 percent.

    Once an industrial backwater, the Gulf region has attracted new steel plants, petrochemical plants and facilities involved in everything from airplanes to food processing. All these locations export such items as cars and chemicals, and all import goods, such as car parts and iron ore. According to Site Selection magazine, the Gulf includes four of the top 12 states – led by No. 1 Texas, No. 7 Louisiana, No. 10 Florida and No. 12 Alabama – in attractiveness to investors. Texas and Louisiana ranked first and third among the states for new plants.

    Standing pat

    Ultimately, this is a challenge that our region cannot afford to ignore, particularly with completion of the Panama Canal expansion in as soon as roughly a year. In anticipation, ports along the Gulf, as well as in the Southeast, are almost all improving and expanding their ports. In contrast, Southern California ports – largely because of labor and environmental concerns – may be slow to make the “intense capital improvements,” such as dredging and new road connections. This largely results from environmental pressures that, notes economist Husing, are not nearly as powerful along the Gulf or in the Southeast. A history of labor disputes by highly paid, politically powerful California port workers also has reinforced the notion that the L.A. area ports are becoming an increasingly unreliable place to do business.

    The Third Coast is also positioned to benefit from commerce with Latin America, the Gulf’s historic leading trade partner. Latin America, notes Bill Gilmer, has been home to many of the world’s fastest-growing economies. Since 2002, about 56 million people in Latin America,according to the World Bank, have risen out of poverty.

    Trade with these partners – including Mexico – are ramping up growth in Houston, as well as other Gulf ports. Brazil, notes Jimmy Lyons, has risen to become a trading partner of Mobile, Ala. Strong Latin immigration to virtually all the Gulf cities, particularly Houston and, increasingly, New Orleans, can only strengthen these economic ties.

    Southern California, with its vast Hispanic population and proximity to Mexico, also should be able to serve as a hub for this trade, but this can only happen if the region attaches greater priority to port development. Historically, this region was built by people taking risks on big infrastructure – covering everything from the water delivery systems to the port and freeways – that literally paved the way to economic progress, and growth.

    The key question now is: Do we still have the spirit and willingness to build, as our competitors are on the Third Coast, the Southeast, Mexico and Canada. If we fail to meet the challenge, Southern California could surrender desperately needed potential sources of new employment and a critical linchpin to our continuing status as one of the world’s great global centers.

    This story originally appeared at the Orange County Register.

    Joel Kotkin is executive editor of NewGeography.com and Distinguished Presidential Fellow in Urban Futures at Chapman University, and a member of the editorial board of the Orange County Register. He is author of The City: A Global History and The Next Hundred Million: America in 2050. His most recent study, The Rise of Postfamilialism, has been widely discussed and distributed internationally. He lives in Los Angeles, CA.

    Port of Los Angeles photo courtesy of NOAA’s National Ocean Service.

  • To Rebuild, the Midwest Must Face Its Real and Severe Problems

    Despite well-publicized problems that earned it the nickname of the “Rust Belt”, on paper the Midwest possesses some formidable strengths. These include the largest concentration of engineers in America, world class educational institutions, a plethora of headquarters of global champions ranging from Proctor and Gamble to Caterpillar to the Chicago Mercantile Exchange, the world’s greatest reserves of fresh water, and an expanding immigrant population.

    Yet with limited exceptions, these have been around for a while, but haven’t produced much growth across the region. Instead, outside of an archipelago of successful outliers (mostly select parts of major metros or college towns), the region has seen its population, job, and income growth badly trail the nation.  During the 2000s US population grew by 9.7%, the Midwest* 3.8%. For jobs, the US lost 1.5% but the Midwest 7.8%.

    Reversing this requires not just leveraging strengths and building on assets, but facing the very real and severe structural challenges that plague the region. However, most of the strategies out there remain outside the region’s essential DNA:

    • Economic clusters like high tech startups or water industries are in effect attempts to build new success enclaves outside the system.
    • Rebuilding downtowns into urban playgrounds for the upscale often takes place against a backdrop of vacant lots, abandoned structures, and depopulation – in other words, empty space.
    • The Rust Belt Chic movement suggests that many of the problems are actually the solution.  But while there are intriguing and important elements to this, it bypasses core issues.

    These are all good as far as they go, but they require little broad-based reform (as opposed to district or enclave based solutions) to structural problems and thus are limited in what they can achieve.

    What are these structural problems? Among the key ones are:

    1. Racism. The modern history of Midwest cities is enmeshed in the history of race relations, particularly between black and white. Places like Chicago and Milwaukee remain among the absolutely most segregated in America. Race riots have been defining feature of cities ranging from Detroit to Cincinnati (which had a race-influenced riot as recently as 2001). In all of these places, a large population of black residents live in segregated neighborhoods plagued with problems ranging from poor schools to low quality housing to a lack of jobs.  Significant social distress has resulted. 

    There are signs the Great Migration that brought blacks north in search of factory work is reversing, with black residents actually seeing more welcoming environments and better economic opportunities in Southern metro areas like Atlanta, Houston, and Charlotte. As well, historically it’s been the more ambitious who leave, not such a good thing for the people and places left behind.

    2. Corruption.  Midwest cities ranging from Chicago to Detroit to Cleveland are famous as cesspools of corruption and cronyism. Systems like Chicago’s “aldermanic privilege” tradition that gives city council members almost dictatorial control over their districts produce environments of almost required tacit corruption even if no laws are violated. In other cities, it’s well known that your approvals will go much faster if you hire the right wired-up subcontractors, lawyers, or lobbyists. While this type of environment exists at some level everywhere, it’s very bad in many Midwest cities and badly degrades an already challenged business climate.

    3. Closed Societies. Contrary to the assertions of Robert Putnam and Bowling Alone, a lot of Midwest places suffer from an excess of social capital. As Sean Safford noted in Why the Garden Club Couldn’t Save Youngstown, excessively dense social networks can create a hermetically sealed environment into which new ideas can’t penetrate or get a hearing.  There are many reports of newcomers to Midwest cities saying that they have difficult making friends and penetrating the social networks in places as diverse as Minneapolis and Cleveland. In Cincinnati and St. Louis expect that the first question you’ll be asked is “Where did you go to high school?” which tells you everything you need to know about those cities.  Immigration has ticked up in recent years, but overall the Midwest has done a poor job of attracting outsiders.

    4. Two-Tier Environment and Resulting Paralysis.  Despite the plethora of high end companies, educated workers, and top quality universities, the Midwest economy was traditionally based on moderately skilled labor in agriculture and industry. This forged a work force that places too low value on education and which can even be suspicious of people with too much of it. Today’s agriculture and manufacturing concerns, at least the ones with jobs that pay more than subsistence wages, require much higher levels of skills and education than in the past. What’s more, with the global macro-economy favorable to larger cities and talent based industries, larger metros have comparatively done well while most smaller towns have struggled. As a result, their quality of life and services have so badly degraded they are no longer attractive to “discretionary residents” (those with the means and opportunity to leave), which perpetuates a downward spiral as the educated flock to bigger cities. That’s why manufacturers complain they can’t find workers with skills, even if those skills are just passing and drug test and showing up to work everyday. This produces massive inequities, resentment, and policy confusion. What’s more, realistically many very poorly performing communities may never recover.

    Beyond these core issues, many places have aging infrastructure, massive blight issues, a regulatory environment not suited to the 21st century, and severe fiscal problems. All of these are extremely difficult problems to resolve, but that does not mean they don’t need to be faced, and overcome.

    Unsurprisingly, the Midwest has not been a particularly competitive region.  There will continue to be bright spots ranging Des Moines to Madison to the greater Chicago Loop to the fracking fields of western Pennsylvania, but until the region faces up to its problems don’t expect a major turnaround anytime soon.

    Aaron M. Renn is an independent writer on urban affairs and the founder of Telestrian, a data analysis and mapping tool. He writes at The Urbanophile.

  • New Report: Enterprising Cities – A Force for American Prosperity

    The inaugural edition of Enterprising Cities: A Force for Prosperity that was recently released examines best practices in municipalities taking proactive measures to support job creation and economic growth together with the private sector. The U.S. Chamber of Commerce Foundation’s Enterprising States and Cities program takes an in-depth look at the policies and programs being implemented to promote economic growth at the state and local levels.

    The cities highlighted in the Enterprising Cities report—Dayton, OH, Irving, TX, Memphis, TN, Minneapolis, MN, Salt Lake City, UT, San Antonio, TX, Sioux Falls, SD—each, in their own unique way, are examples of how enterprise-friendly leadership, strategies, and partnerships can be put into action to achieve meaningful results.

    Cities, both large and small, play a pivotal role as drivers of America’s economy by creating and sustaining the local ecosystem for innovation, competitiveness, and productivity through enterprise-friendly policies that create jobs, enhance economic development, and build prosperity. Pragmatic leaders at the city level can often take on the issues that Washington will not, or cannot, solve. Enterprise-friendly policies at the city level can indeed facilitate local economic growth by supporting entrepreneurs and mobilizing effective partnerships for improving the conditions for business and job growth. Working together with businesses, city leaders can bolster expansion into national markets and exports to reach global markets.

    City policies and practices that will help strengthen our free enterprise system—the system that has served as the foundation of America’s prosperity and the only system capable of creating the jobs we need for the long haul—are those that do the following:

    • Allow businesses to grow and thrive.
    • Free businesses from excessive taxes, unnecessary regulations, and onerous local government processes.
    • Focus government on the critical tasks that are the foundation of economic opportunity, such as infrastructure and protective services.
    • Help educate, cultivate, and equip the next generation of young entrepreneurs and the workforce of the future.

    Enterprising cities use policy inputs, well-designed community programs, and economic development best practices to create an environment where free enterprise creates jobs and prosperity. Economic prosperity creates fiscally sustainable local governments capable of supporting the infrastructure and workforce that free enterprise needs. 

    Is your city an enterprising city? The 2013 Enterprising Cities were selected based upon their approach to local governance, fiscal management, and program deployment. You can use the criteria upon which these seven cities were selected to assess your own city. 

    • Explicit involvement of the local business community, citizens, and local education institutions.
    • A sound approach to fiscal management and the deployment of government services, often based upon private sector best practices.
    • Strong leadership, communication, and cooperation from the mayor, chamber of commerce, or other civic entities.
    • A focus on metrics to measure outcomes.
    • Open communication between local residents and city leaders, and strong city response to citizen input.
    • Evidence of a plan of action or community strategy carried out by multiple public and private partners.
    • Recognition that local business activity drives the economy, providing the fiscal stability that allows local governments to focus on the safety, education, and infrastructure that the private sector needs to thrive.   

    Praxis Strategy Group is an economic research, policy, strategy and development company.  Praxis and its partner Joel Kotkin conducted the Enterprising Cities study and the four annual Enterprising States studies for the U.S. Chamber of Commerce Foundation.

  • Underemployment in America

    The nation’s lackluster economic performance continues to be a concern. This is evident in stubbornly high unemployment rates (See: Suburban and Urban Core Poverty: 2012 Special Report),which continue to be well above historic norms. There is another indicator, which may be even more important – underemployment. This figure, 80 percent above the unemployment rate, can be used as a measure of the “output gap,” which a Congressional Research Service (CRS) report refers to as “the rate of actual output (economic) growth compared with the rate of potential output growth.” CRS continues: “Potential output is a measure of the economy’s capacity to produce goods and services when resources (e.g., labor) are fully utilized” (Note 1).

    Both rates are reported by the Department of Labor, Bureau of Labor Statistics (BLS). The national underemployment rate (BLS “U-6” labor underutilization measure) is far higher than the unemployment rate (BLS “U-3” labor underutilization measure). The 2012 underemployment rate was 14.7 percent, compared to the unemployment rate of 8.1 percent. The total unemployed population was 12.5 million in 2012, while the total underemployed population was 23.1 million.

    The difference between underemployment and unemployment comes by adding two groups: marginally attached workers and workers on part-time schedules for economic reasons. According to BLS, marginally attached workers are not counted as unemployed because they have not looked for work within the last four weeks, but they have sought work within the last year and are available for employment. Marginally attached workers include “discouraged” workers, who are not looking for work “because they believe there are no jobs available or there are none for which they would qualify.” In 2012, there were approximately 2.5 million marginally attached workers, including 900,000 “discouraged” workers.

    However, there was a much larger number of involuntary part time workers, at 8.1 million in 2012. This is nearly two-thirds of the 12.5 million workers unemployed in 2012.

    The number of underemployed may be higher. Gallup estimated the nation’s underemployment rate at 17.4 percent in August, well above the BLS August figure of 14.7 percent. The Gallup estimate would place underemployed workers at more than 27 million. This is approximately equal to all of the combined employment in the first and second largest states, California and Texas, as well as Colorado (Figure 1).

    Indeed, the number of underemployed could be higher yet. Economists Richard Vedder, Christopher Denhart, and Jonathan Robe at the Center for College Affordability and Productivity have estimated that 48 percent of employed college graduates hold jobs that do not require college degrees, using BLS data. None of these, as long as they are full time employees, would be included in the underemployment figures.

    Underemployment by State

    In addition to its monthly national estimates, BLS provides quarterly, year-on-year estimates by state, but only for Los Angeles County and New York City below the state level. Data is shown for 2006, the year of the best underemployment rate in the last decade, 2010, with the worst underemployment rate and the most recent year for which data is available, ending June 30, 2013 (Table).

    Underemployment Rates 
    by State, Los Angeles County & New York City
      2006 2010 2013q2* Rank
    United States 8.2% 16.7% 14.3%  
    Alabama 7.3% 17.3% 13.0% 22
    Alaska 11.8% 14.3% 12.4% 16
    Arizona 7.6% 18.4% 15.7% 42
    Arkansas 9.1% 14.5% 13.6% 25
    California 9.1% 22.1% 18.3% 50
    Colorado 7.9% 15.4% 13.8% 28
    Connecticut 7.8% 15.7% 14.6% 37
    Delaware 6.4% 14.3% 14.1% 30
    District of Columbia 9.8% 14.0% 14.1% 30
    Florida 6.2% 19.3% 15.1% 39
    Georgia 8.1% 17.9% 15.6% 40
    Hawaii 6.2% 16.9% 11.4% 12
    Idaho 6.9% 16.3% 13.6% 25
    Illinois 8.1% 17.5% 16.1% 47
    Indiana 8.1% 17.4% 14.5% 36
    Iowa 6.7% 11.6% 9.5% 5
    Kansas 7.4% 12.4% 10.9% 9
    Kentucky 9.3% 16.4% 14.3% 34
    Louisiana 8.1% 12.9% 12.5% 18
    Maine 8.2% 15.2% 14.2% 32
    Maryland 6.5% 13.0% 12.0% 15
    Massachusetts 8.2% 14.3% 13.3% 23
    Michigan 12.2% 21.0% 16.1% 47
    Minnesota 7.9% 13.8% 11.2% 11
    Mississippi 10.2% 17.6% 15.8% 45
    Missouri 8.0% 15.8% 12.4% 16
    Montana 6.9% 14.9% 12.7% 20
    Nebraska 6.1% 8.6% 8.7% 3
    Nevada 6.8% 23.6% 19.0% 51
    New Hampshire 6.1% 11.8% 11.1% 10
    New Jersey 7.8% 15.7% 15.7% 42
    New Mexico 7.5% 15.6% 13.7% 27
    New York 7.7% 14.8% 14.2% 32
    North Carolina 8.6% 17.4% 15.6% 40
    North Dakota 6.2% 7.4% 6.2% 1
    Ohio 9.7% 16.9% 13.5% 24
    Oklahoma 7.3% 11.4% 10.0% 6
    Oregon 10.4% 20.0% 16.9% 49
    Pennsylvania 8.0% 14.7% 13.8% 28
    Rhode Island 8.9% 19.2% 15.9% 46
    South Carolina 10.8% 18.1% 15.0% 38
    South Dakota 6.2% 9.7% 7.8% 2
    Tennessee 8.7% 16.6% 14.3% 34
    Texas 8.6% 14.4% 11.6% 13
    Utah 5.8% 15.1% 10.5% 7
    Vermont 6.4% 12.5% 10.5% 7
    Virginia 6.0% 12.9% 11.6% 13
    Washington 9.4% 18.4% 15.7% 42
    West Virginia 8.8% 14.0% 12.5% 18
    Wisconsin 8.1% 14.8% 12.9% 21
    Wyoming 5.8% 11.5% 9.0% 4
    Los Angeles County 9.1% 24.3% 20.5%
    New York City 8.7% 15.6% 15.1%
    Source: Bureau of Labor Statistics
    *2013q3: Year ended June 30, 2013


    Worst Performing States

    Underemployment in the states is highest in some Western and Midwestern states. For the 12 months ended June 30, Nevada had the highest underemployment rate, at 20.3 percent. California was second, at 19.3 percent, while Oregon had the third highest underemployment rate, at 16.9 percent. Michigan and Illinois were tied for fourth highest, at 16.1 percent (Figure 2).

    Over the past decade (2003 through 2012), four of these states were among the five with the highest underemployment rates. Michigan, hard hit by manufacturing losses, had the highest average underemployment rate (15.6 percent), followed by California and Oregon (both at 14.8 percent), South Carolina (13.8 percent) and Nevada (13.7 percent). For the most part, underemployment has become intractable in these states. Only Nevada, with its precipitous decline from the housing crisis ranked better than 40th worst in underemployment in any year between 2003 and 2012 (Figure 3).

    Best Performing States

    The best underemployment rates were literally concentrated in five adjacent states with strong energy sector states, principally in the Great Plains. North Dakota led the nation for the year ended June 30, 2013, with an underemployment rate of 6.2 percent, less than one-half the national rate (14.7 percent) and less than one-third the rates of Nevada and California. North Dakota’s neighbor to the south, South Dakota had the second best rate, at 7.8 percent, while   Nebraska ranked third at 8.7 percent. On Nebraska’s western border, Wyoming, the only non-Plains state in the top five, ranked fourth with an underemployment rate of 9.0 percent. Nebraska’s eastern neighbor, Iowa, ranked fifth, at 9.5 percent (Figure 4).

    As with the states with the worst underemployment rates over the last decade, those with the lowest  current figure also did best from 2003 and 2012. North Dakota is again number one, with an underemployment rate of 6.7 percent. Nebraska (7.5 percent), South Dakota (7.7 percent) and Wyoming (8.2 percent) follow, with New Hampshire ranking fifth best, at 8.8 percent (Figure 5).

    Underemployment in New York City and Los Angeles County

    For the year ended June 30, 2013, the city of New York had an underemployment rate of 15.1 percent, somewhat above the national rate of 14.3 percent. Over the past decade, the state of New York’s underemployment rate has been lower than that of the city in every year.  

    Los Angeles County is the largest county in the United States and if it were a state would rank eighth in population, between Ohio and Georgia. Further, it Los Angeles County were a state, it would have had the worst underemployment rate in every year from the 2008 to the present. For the year ended June 30 2013, Los Angeles County had an underemployment rate of 20.8 percent, nearly 1/2 higher than the national underemployment rate 14.7 percent and above the highest state rate of 20.3 percent in Nevada.

    Closing the Productivity Gap

    The productivity gap that results from underemployment constrains the US economy at a time of unusually severe financial challenges. College graduates face not only a grim employment market, but have student loan repayments that require good jobs. The nation continues to spend more than it collects in taxes. The inability of state and local governments to fund their government employee pension programs could lead, in the worst case, to much higher taxes or severe service cutbacks.

    Yet things could get worse. The soon to be implemented “Patient Protection and Affordable Care Act” (“Obamacare”) has a built-in incentives for employers to shift workers to part time status (weekly schedule of fewer than 30 hours of work per week). The law exempts them from providing health insurance for employees who work part time and so some establishments are shifting full time employees to part time status. Others establishments may substitute hiring part time employees instead of full time to reduce their expenses. This incentive is not just being executed by private companies seeking to maintain profitability. It extends to state and local government agencies, which unlike the federal government, must balance their books each year. According to a running of enterprises announcing shifts to part-time by Investors Business Daily, more than 75 percent are government agencies.

    All of this points to two important policy implications. The first is the necessity of focusing on the underemployment measure, the improvement of which is so crucial to maintaining and improving the standard of living and reducing poverty (by reducing the productivity gap). The second is that, with such a focus, policy makers from Washington to Sacramento, Lansing, and Carson City must pursue policies that encourage investment and employment.

    Wendell Cox is a Visiting Professor, Conservatoire National des Arts et Metiers, Paris and the author of “War on the Dream: How Anti-Sprawl Policy Threatens the Quality of Life.

    Note 1: A detailed comparison of the unemployment (U-3) and underemployment (U-6) rates is provided by economist Ed Dolan. A useful chart comparing the two indicators, with numbers from June 2012 will be found on qz.com.

    Note 2: Vedder, Denhart and Robe also suggest the possibility of “over-investment,” as more students may have been encouraged to higher education levels than there are likely to be correspondingly appropriate jobs. The extent of such over-investment is not known.

    Unemployed woman photo by BigStockPhoto.com.