Category: Economics

  • Visions of the Rust Belt Future (Part 1)

    “Men often applaud an imitation and hiss the real thing”–Aesop

    There are interesting developments being played out in the Rust Belt. Some cities, like Detroit, seem to be embarking whole hog down the creative class path. Others, like Pittsburgh, have their own thing going on, a thing Economic Geographer Jim Russell has delineated as the “Rust Belt Chic” model of economic development, with no modest amount of success. How a given Rust Belt city reinvests will have a large say in its future.

    Part 1 of this series, below, examines the nascent creative classification of Detroit. Part 2 analyzes whether or not there is a new way forward for post-industrial cities, using the lessons from Pittsburgh and Cleveland as the building blocks to developing an alternative set of strategies for struggling cities.

    Detroit Rock (Ventures) City

    In Detroit, the scene is playing out as such: rampant disinvestment in the core and extreme poverty around it. To help fix this, ties between Rock Ventures head and real estate billionaire Dan Gilbert, urbanist Richard Florida, and the non-profit Project for Public Spaces have been initiated. The goal, laudable enough, is to reinvest in downtown. And while the renewal formula planned is not new, the extent that the milieu is a controlled environment for an urban experiment is perhaps ahistorical, if only because Detroit’s level of disinvestment has created a vacuum that, naturally, power abhors.

    To wit, a recent New York Time’s article entitled “A Missionary’s Quest to Remake Motor City” hints at the level Dan Gilbert—who  has bought $1 billion in downtown property in what has been called a “skyscraper sale”—and his advisors have been handed the keys:

    “My job,” said Dave Bing, the Detroit mayor and former National Basketball Association star, “is to knock down as many barriers as possible and get out of the way.”

    And:

    “Mr. Gilbert met in a conference room for his twice-a-month Detroit real estate meeting, with about a dozen people who work for him, plus a lawyer and leasing agent. If Detroit 2.0, as this group often calls the effort, has a planning committee, this is it.”

    And:

    “[H]e and his staff will apparently have a largely free hand.”

    Now, the plan, and how the plan for Detroit’s future came about.

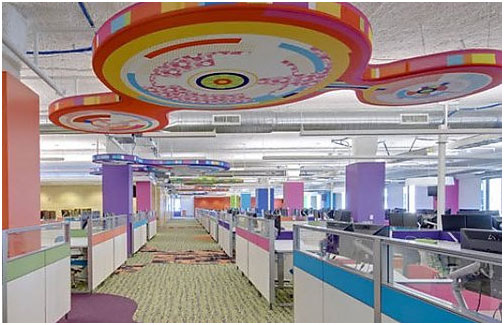
    A wealthy investor, Dan Gilbert, buys downtown properties. That investor goes on the record as to the importance of reinvesting into the urban core. That investor moves his mortgage company’s employees from suburban office parks into his own downtown real estate. Then, the investor, taking cues from his consultants, throws in something about innovation, which, at its lowest common denominator, means designing your way to a “culture of innovation”. Thus, the investor encourages that Romper Room-style office setting complete with what some would say is tacky décor wholly out of line with the soul of “the D”, but yet which is said to fun-birth inspiration—i.e., “[A] karaoke machine sat in an aisle. Guys threw footballs to one another; one employee shot at colleagues with a Nerf gun”; and “A Quicken promotional video solidifies the company’s attempts at over-the-top marketing, prominently featuring the space’s inexplicable Pac-Man theme”—despite the fact that your primary product line, i.e., mortgages,  needs far less innovation than it does a modicum of conventionality and ethics. Nonetheless, the sentiment of creative destruction is there.


    This basic process, then, is multiplied out from the office setting into strategic urban space, particularly around Gilbert’s real estate. The idea here is to design space so as to create vibrancy so as to galvanize commerce so as to ignite broad economic growth.

    Enter the partnership with the Project for Public Spaces, who is working with Gilbert’s group to do a set of “Lighter, Quicker, Cheaper” placemaking interventions, including pop-up shops. The conceptual girth behind the plan, according to a recent article “Detroit Leads the Way on Place-Centered Revitalization”, is described as such:

    “We proposed developing a Placemaking vision for the major public spaces, and refining the plan through the Power of 10 concept,” says Meg Walker, a Vice President at PPS who worked on the project. “…A lot of developers aren’t as enlightened as Dan Gilbert…they wouldn’t necessarily think about the glue that’s holding this all together.”

    “The Power of 10 framework suggests that a great city needs at least ten great districts, each with at least ten great places, which in turn each have at least ten things to do. Great public spaces produce an energy and enthusiasm that spills over into surrounding areas…

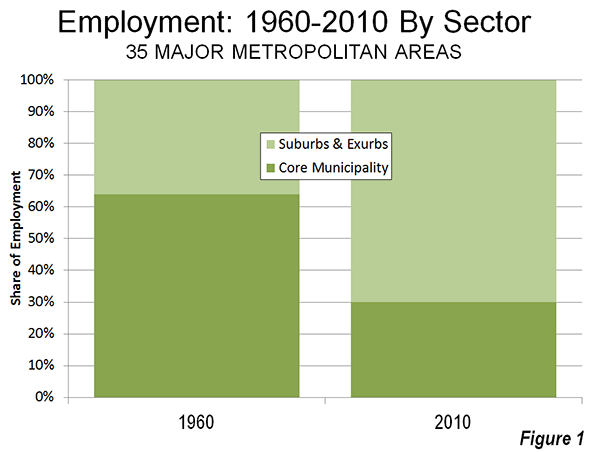
    With the conceptual description as a guide, this is a classic case of the urbanists’ version of trickled-down economics, in which an influx of capital into finite corridors is meant to attract wealth that “spills over” into surrounding areas. Unfortunately, there is little by way of evidence that this works, as was recently admitted by Richard Florida himself. What it may do, however, is fill real estate supply by pursuing a select target market, as placemaking can act as a grease to create pockets of creative class demand to support condos or retail and office space. And while one can certainly argue it beats rampant core disinvestment, it’s not the path of a bold new way that will measurably change the trajectory of Detroit, so says U of M Professor Michael Gordon. In effect, it’s simply shifting people from one set of real estate to another, with nothing undertaken on a systemic level to tackle Detroit’s real problem: poverty and disenfranchisement in its neighborhoods. Worse, re-urbanization as such is likely to exacerbate class and race divides that have plagued Detroit for decades, thus worsening Detroit’s real problem: poverty and disenfranchisement in its neighborhoods.

    Besides, we have been here before. Michigan via its Cool Cities campaign had a plan based off the same Detroit 2.0 premise, switch out the window dressing. Design place, accrue vibrancy, growth wealth. Obviously, the multi-million dollar economic development initiative didn’t work. Neither have similar initiatives across the whole of the Rust Belt.

    So, where’s the beef? What makes Detroit 2.0 different?  

    Naturally, this is where the economic development buzzwords “start-up” and “tech district enter into the Detroit 2.0 lexicon; that is, creating dense city areas will nurture spontaneous interactions that will foster Detroit’s innovation community, putting it firmly on the path to be the “Silicon Valley of the Midwest”. But every city wants this (or at least they are informed they do)—e.g., “Miami Wants to Be the Next Big Start-Up City”—and so the effort ultimately comes off as anything but visionary, rather visionless, trying.

    Cue the Onion. From an article entitled “St. Louis Mayor Has Sad Little Plan For Turning City Into High-Tech Hub”:

    In what appears to be a completely earnest attempt to revitalize a sluggish local economy, St. Louis mayor Francis G. Slay unveiled Thursday a detailed, ambitious, and truly depressing plan to turn his city into a major technology hub. “We’re going to show America, and the rest of world, just how innovative and cutting-edge St. Louis can be,” said the mayor, who displayed genuine optimism as he outlined a desperate strategy to woo major players in the high-tech sector with a sad little series of subsidies and tax incentives his city cannot afford… The mayor ended his presentation by pleading with reporters to dub the hopelessly untenable project “St. Louis 2.0.”

    In all, the current Detroit economic development approach is copycat urbanism at its finest, as there is nothing inherently “Detroit” about it. Nothing that intrinsically builds off its only true competitive advantage: itself.

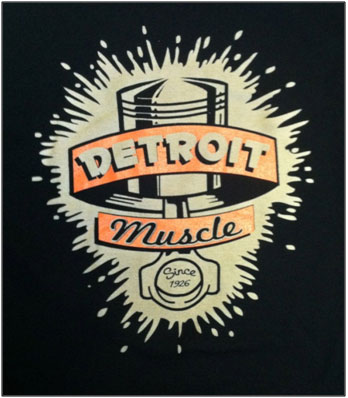
    For instance, Motor City is Motor City for a reason: it builds things. It designs things. Like, for instance, cars, which, by last count, are still being used, with over 254 million registered passenger vehicles in the US in 2009 alone. And while technology-based automation is increasing manufacturing output at the expense of jobs, production is still huge business in the Rust Belt, with automotive-related STEM jobs (i.e., science, technology, engineering and mathematics-related employment)—i.e., the creative class before the “creative class” became the “creative class”)—aiding Detroit’s regional resurgence, with its 10.5% STEM job growth leading the country from 2010 to 2012. And no, this is not to say Detroit will recoup manufacturing jobs lost from its heyday. But it’s absurd for Detroit to neglect training and flexing its muscle—or its legacy of concept, design, and production—for a future with no middle between start-ups and baristas. I mean, advanced manufacturing isn’t nostalgia. It exists.


    So, why this path? Why pretty Detroit? Why make it culturally less distinct? Why embark on a plan of hyper-modern ephemerality when your distinction is resilience, making things, and hard work? Why? Where is the evidence that this even works? What in the hell is even going on here?

    To get to the bottom of this you need to be aware of parallel events in Cleveland. There, Dan Gilbert has hands in that city’s Downtown redevelopment as well. But it is not what you think. And therein lies the problem.

    You see, if the Detroit Dan Gilbert is the urbanists’ Dr. Jekyll than in Cleveland he becomes the anti-urban Mr. Hyde. In fact, the Cleveland Dan literally embarks on nearly all the urbanists’ seven deadly sins, including owning and running a casino placed right beside the city’s iconic Public Square, demolishing historic buildings for the creation of a VIP valet center, planning to ruin the iconic Terminal Tower by connecting an enclosed pedestrian tunnel from a parking garage into its face—the Plain Dealer architecture critic stated it was akin to “poking a straw in Mona Lisa’s nose”—and, more generally, pissing off Millennials.

    From a recent Atlantic Cities piece entitled “If Other Cities Are Demolishing Skywalks, Why Does Cleveland Want a New One?”, the author, who omits Dan Gilbert’s name, writes:

    “In the last decades of the 20th century, many American cities built skywalks in a desperate attempt to seem modern, hoping to create a sanitized urban experience that would compete with the sanitized suburban experience of indoor malls.

    For the most part, it didn’t work, and now cities…are tearing down the skywalks…in an effort to return pedestrian life and vitality to the street.

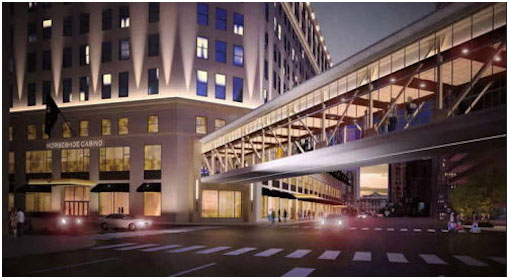
    Meanwhile, in Cleveland, the owners of the year-old Horseshoe Casino downtown are planning to build a brand-new skywalk…For many of the young people moving to Cleveland in search of a 21st-century urban experience – pedestrian-friendly, with lots of people out and about – it seems like a step backward in time.”


    Why is Gilbert going all anti-urban in Cleveland, then? In a word: money, as Moody’s just issued a report saying a walkway would help the casino reach predicted income streams, as it has been underperforming. Obviously casino ownership is a no frills money-making operation, as is real estate. With each: immediate financial return trumps the nurturing of human and community capital to support a vision of long-term economic growth.

    But Detroit Dan is different, right? He is a walkability guru’s guru. One of the “enlightened developers” as was stated above.

    Well, you be the judge. Here’s a blog post excerpt covering the recent Placemaking Leadership Council hosted in Detroit, with Detroit 2.0 taking center stage.

    Dan Gilbert, head of Rock Ventures and Quicken Loans, genuinely seemed to defer to Kent [the Project for Public Spaces head] when it came to his part of the presentation Thursday. Gilbert, who has millions of hours of public-speaking practice behind him, often turned to Kent to fill in the details on the upcoming renovations to Campus Martius, Cadillac Square, Capitol Park, Grand Circus Park and Paradise Valley.

    “Genuinely seemed to defer” is right. Or just bored as hell.

    And then there is this. This. Courtesy of a Curbed Detroit blog post called “Development In Downtown Detroit Is Playing Out Like A Huff Po Blog Post From 2009”. The referenced Huffington Post piece is by Detroiter Toby Barlow that is called “How a Billionaire Can Make a Billion Dollars”. The strategy? Buy Detroit, not “metaphorically” but “literally”, yet do it “very quietly, so as not to inflate any prices”. Then, according to Barlow, since a billionaire owns thing, he moves his employees to his buildings and gives them “incentives to live down near their work so that they’ll buy your residential property”. Barlow concludes:

    So, I don’t have to spell out the rest, do I? Real estate values will quickly soar as other companies, encouraged by your brazen move, make similar leaps into what will still be an incredibly affordable market. The momentum will build as the ever-frenzied media piles on.

    Yes, Detroit’s plan for the future pre-dated by a Huff Po blog entry from 2009.

    The big revelation here?

    Look, in the end, the Dan Gilbert’s of the world are in their line of work for one reason and one reason only: to make money. They will don whatever mask they need to play the part, be it the urban-loving Jekyll or the anti-urban Hyde. That’s the problem with creative class urbanism. It is dependent on developers who could care less. It is a means to an end for those who implement it.

    Too bad this end is not the beginning of a true path forward for a real Rust Belt recovery.

    Detroiters, like most Rust Belters, have been through enough. They deserve better.

    Richey Piiparinen is a writer and policy researcher based in Cleveland. He is co-editor of Rust Belt Chic: The Cleveland Anthology. Read more from him at his blog and at Rust Belt Chic.

  • Job Dispersion in Major US Metropolitan Areas: 1960-2010

    The continuing dispersion of employment in the nation’s major metropolitan areas has received attention in two recent reports. The Brookings Institution has published research showing that employment dispersion continued between 2000 and 2010, finding job growth was greater outside a three mile radius from central business districts between 2000 and 2010 in 100 metropolitan areas Note 1). This assessment probably underestimates the extent of job dispersion, since it includes some suburban centers as central business districts (such as West Palm Beach, FL and Palo Alto, CA).

    Recently I showed that employment dispersion has reached a point that there is a virtual balance of jobs and housing in suburban areas, which contrasts with the continuing excess of jobs in core municipalities relative to resident workers. After that article was published, Richard L. Forstall forwarded me research he presented to the Southern Demographic Association in the 1990s that examined employment trends in core municipalities and suburban areas between 1960 and 1990. At the time, Forstall was at the United States Bureau of the Census. He also spent years supervising Rand McNally international metropolitan area population estimates (Note 2).

    Major Metropolitan Job Dispersion: 1950 to 2010 and

    Forstall provides detailed information for the 35 major metropolitan areas as of 1990 (over 1,000,000 population). This article augments the Forstall research with data from the 2010 census (Note 3).

    Consistent with both national and international trends, the half century between 1960 and 2010 indicated significant dispersion in metropolitan areas. This, of course, was a continuation of a trend that accelerated from the first quarter of the 19th century, when early mass transit systems allowed people to live in larger spaces, farther away from their work.

    The movement of residents from the urban core to the suburbs followed the even greater exodus from small towns and rural areas. But it was not long before residents of the homogeneous bedroom suburbs of the 1950s began to find more nearby employment opportunities.

    In 1960, 54% of the employment in the 35 major metropolitan areas was in the historical core municipalities, with the balance of 46% of the jobs in suburban and exurban areas. By 2010, the corner municipality share had dropped to 30%, while suburban and exurban areas contained 70% of the employment (Figure 1). Between 1960 and 2010, 88% of the new jobs were in the suburbs and exurbs, leaving only 12% of the growth in the core municipalities (Figure 2).

    Dispersion Greater in Metropolitan Areas with Pre-War Non-Suburban Cores

    However, even this distribution appears to mask an even greater dispersion. Among the metropolitan areas with "Pre-war non-suburban core municipalities," (such as San Francisco, Baltimore, Providence, New York, etc.) a full 102% of job growth was in suburban and exurban areas. Core city employment accounted for a minus two percent of employment growth (in other words, it declined). These are metropolitan areas with core cities that were virtually fully developed before World War II and which have added little to their land areas by annexation.

    The other metropolitan areas have core cities with large swaths of suburbanization and some, like Phoenix and Sacramento are virtually all suburban. In these metropolitan areas, approximately 25% of the job growth since 1960 has been in the core cities (Figure 3).

    Pre-War Non-Suburban Core Municipalities Losses and Gains

    Among the 18 metropolitan areas with "Prewar non-suburban" core municipalities, two thirds experienced losses in their core cities. The Rust Belt "ground zero" core cities of Detroit, Cleveland, and Buffalo all lost 40 percent or more of their employment, and were joined by second tier Rust Belter St. Louis. The core city of Pittsburgh, typically one of the Rust Belt’s big four, did much better, losing only five percent of its employment. Across the state, however, the core city of Philadelphia did much worse, dropping 23 percent of its employment. The core city of Chicago lost 20 percent of its employment.

    Perhaps most notable was the core city of Hartford, which lost 9 percent of its employment between 1960 and 2010. According to data in the Brookings Institution Global Metro Monitor, Hartford has emerged as the world’s most affluent major metropolitan area (measured by gross domestic product per capita) over the same period. All of Hartford’s job growth was in the suburbs and exurbs.

    The core city of New York did the best among the metropolitan areas with "Pre-War non-suburban" cores, attracting 16 percent of the employment growth over the half-century. Washington (DC) also did well, with a 12 percent share of new employment.

    Urban Dispersion and the Quality of Life

    The dispersed metropolitan area, along with its comprehensive roadway networks, has served the US well, especially in two important measures of the quality of life — housing affordability and mobility. Major metropolitan areas in the United States have some of the most affordable housing in the high-income world. The US has shorter work trip travel times than Canada or Western Europe and much shorter than the major metropolitan areas of Japan (with the most comprehensive rail systems in the world) and East Asia.

    This advantage was reiterated with the recent release of the Tom Tom Congestion Index, which showed traffic congestion in the metropolitan areas of Australia and New Zealand to be far worse than in US metropolitan areas of similar size. For example, Sydney is as congested as Los Angeles, despite having only one-third the population. Auckland (New Zealand) has worse traffic congestion than any US metropolitan area of similar size.

    Peter Gordon and Harry W. Richardson spotted this advantage nearly two decades ago (See Are Compact Cities a Desirable Planning Goal?), before there was international traffic congestion comparison data. Based upon their review of national travel surveys, they concluded:

    Suburbanization has been the dominant and successful mechanism for reducing congestion. It has shifted road and highway demand to less congested routes and away from core areas.

    Wendell Cox is a Visiting Professor, Conservatoire National des Arts et Metiers, Paris and the author of “War on the Dream: How Anti-Sprawl Policy Threatens the Quality of Life.

    ——-
    Note 1: The Brookings Institution report indicates that employment within a 3 mile radius of downtown (the central business district) increased in number and share only in the Washington, DC metropolitan area. However, this may not indicate an increase in central business district (downtown) employment. The large, nearby, but suburban employment centers of Rosslyn, Crystal City and downtown Alexandria may be located within the three mile radius (the report does not indicate the point from which the radius is drawn). The three mile radius used in the report is useful and represents the best reported data. However, it may not be representative of central business district employment encloses a huge area (28 square miles), which is more than 25 times the typical central business district geographical size and larger than the land areas of the core cities of Providence and Hartford and nearly two-thirds the size of the core city of San Francisco. Transit commuting to such nearby employment centers is routinely far lower than the share that ride transit to downtown.

    Note 2: Forstall is co-author (with Richard P. Greene and James B. Pick of seminal research that estimated the population densities of the largest metropolitan areas in the world (Which Are the Largest: Why Lists of Metropolitan Areas Vary So Greatly). Normally, metropolitan area densities cannot be validly compared because of widely varying criteria between nations. Further, in the United States, metropolitan area densities are nonsensical, because their building blocks vary in size too much. With its County-based definitions, US metropolitan areas include building blocks ranging from half the size of Orlando’s Walt Disney World (New York County, or Manhattan borough) to the size of the nation of Costa Rica (San Bernardino County). The use of such a crude building block results in the inclusion of huge amounts of rural territory that is outside the labor market or the commuting shed (metropolitan areas are typically defined as labor markets). Forstall and his coauthors applied criteria that was both consistent and rational. This exhaustive process limited the number of metropolitan areas for which they were able to make estimates to 28.

    Note 3: This analysis differs from Forstall’s approach in defining core cities using the historical core municipality classification. It should be noted that there have been changes in metropolitan definitions over the 50 years.

    Photo: Suburban employment in Chicago (by author)

  • The Sound and the Fury In Chicago

    The Second City syndrome is alive and well. An anti-Chicago essay masquerading as a book review in the New York Times provides the latest example of the truth of that.  Rachel Shteir, a former New Yorker now living in Chicago, notes the various ills in the Windy City that should come as a surprise to no one, least of all residents:

    “Poor Chicago,” a friend of mine recently said. Given the number of urban apocalypses here, I couldn’t tell which problem she was referring to. Was it the Cubs never winning? The abominable weather? Meter parking costing more than anywhere else in America — up to $6.50 an hour — with the money flowing to a private company, thanks to the ex-mayor Richard M. Daley’s shortsighted 2008 deal? Or was it the fact that in 2012, of the largest American cities, Chicago had the second-highest murder rate and the ­second-highest combined sales tax, as well as the ninth-highest metro foreclosure rate in the country? That it’s the third-most racially segregated city and is located in the state with the most underfunded public-employee pension debt? Was my friend talking about how a real estate investor bought The Chicago Tribune and drove it into bankruptcy? Or how 15-year-old Hadiya Pendleton, who performed at Barack Obama’s inauguration, was shot dead near the president’s Kenwood home?"

    Illustrating the rule that criticizing Chicago is something that is Simply Not Done, this piece sent locals into collective apoplexy. Huffington Post Chicago provides a roundup of the “epic backlash.”  The Atlantic Cities chimes in with its own roundup of “Everything You Need to Know About Why Chicago Is Furious With Rachel Shteir and The New York Times,” noting that “We don’t have to wait for the angry letters to be printed in the next Book Review. The counter-manifestos are already here! In the past few days, it seems, everyone from Gary to Milwaukee has read Shteir’s ‘Chicago Manuals’ piece, resulting in a groundswell of angry rebuttals.” An army of angry tweeters spoke out.  And even the mayor addressed the issue. Not a bad day’s work for a theater professor at Depaul (Shteir’s day job).

    In a sense Shteir is right. I’ve long noticed that Chicago is basically an echo chamber of boosterism in which everyone is terrorized about deviating from the party line lest they be excommunicated from polite company, a fate that may well indeed await Shteir. And Chicago clearly has manifest problems as a city, many of which she notes, though many of her list such as the perennial disappointment of Cubs fans are clearly more snark than substance.

    However, what Shteir and Chicago both miss is the real value proposition of the city. Taken on its own terms, Chicago is a simply fantastic place to live. It has a magnificent lakefront setting, a stunning skyline, fantastic cultural institutions, incredible opportunities to consume (from designer clothing to world class dining), and much more. It may be true that these great things largely benefit those from more affluent precincts with vast tracts of the city left behind in segregated, entrenched poverty, but it’s tough to name a place where that isn’t likewise true. Much of Brooklyn, for example, remains mired in poverty, but no one in New York seems to care and criticisms of it as such are simply shrugged off.

    Chicago also has perhaps – at least in my view – the best blend of the best of the elite urban center with much of the best of cities further down the food chain. You can have genuinely walkable neighborhoods, take transit to work, and eat food that would be impressive in any city in the world while simultaneously having a spacious and affordable condo with parking that allows you to drive to a conveniently located Target or Costco to stock up when you need to. It’s car oriented when you need it and walkable when you need it, all at a reasonable price. Now that’s certainly something that many cities lower down in the hierarchy will also claim – big city amenities with a high quality of life. But Chicago is the most elite city in America that can plausibly make that claim.

    What Chicago is not, despite its pretensions, a truly global tier one city like New York, London, or Paris. That is what the booster culture can’t abide. It is an article of faith that every Chicagoan must believe, or at least pretend to believe, that Chicago is worthy of being spoken of in the same breath as any city in the world. Even a critic like Shteir seems to evaluate it on that basis.

    But the reality is that Chicago is a “1B” city like Frankfurt or Toronto not a “1A” city. There’s nothing wrong with that. In fact, I happen to believe Chicago’s value proposition is arguably better than most of the 1A cities for everyone who isn’t in the 0.1%. But both local boosters and critics can’t look at Chicago for what it is, but rather what it isn’t and never will be. Chicago will never be New York. But neither will New York ever match the best of Chicago on the Windy City’s own terms with a comparable quality/price/ease mix.

    In this sense, Chicago might be seen as the leader of a wave of other emerging would be 1A cities – Houston, Dallas, San Diego – that are making the cut from a second tier city. Being the leader and something of a role model for a wave of rising cities may not be bad positioning at all.

    Aaron M. Renn is an independent writer on urban affairs and the founder of Telestrian, a data analysis and mapping tool. He writes at The Urbanophile.

    Photo by Doug Siefken.

  • Genealogy Of Rust Belt Chic

    Some people don’t like the term “Rust Belt”. Others absolutely hate the word “chic”. Please don’t call the shifting mesofacts of dying Great Lakes cities “Rust Belt Chic”. Given the reaction, a lot of it negative, I decided to blog about how I came up with Rust Belt Chic. Way back in 2006, Shittsburgh was associated with a kind of urban chic. The South Side Slopes celebrated in the New York Times:

    “If Pittsburgh’s market were on steroids like New York’s, this would’ve happened a long time ago,” said one developer, Ernie Sota, referring to the recent spark of interest here. “But Pittsburgh’s kind of like an eddy. Things move slowly here.”

    Mr. Sota, 56, is a prolific local developer who is constructing a series of nine ‘green’ town houses, called Windom Hill Place, into a lush hillside here. He was drawn to the Slopes by the views and villagelike feel, which, for him, conjure memories of visits to Prague and Budapest.

    It’s just kind of quirky, funky and real, more organic, built by Europeans and other immigrants,” he explained. “The only other American cities that I find as geographically interesting are maybe San Francisco and Asheville, N.C.”
    Emphasis added. At the time, I thought of Sota’s sense of Pittsburgh place as unique to the city. I’m not from Pittsburgh. I don’t live in Pittsburgh. I didn’t go to school there. I’m a geographer. Pittsburgh appeals to my sensibilities. Pittsburgh is my Paris.

    The geographic scope of Pittsburgh urban chic became Rust Belt Chic upon meeting Phil Kidd and John Slanina in Erie, PA for a Rust Belt Bloggers summit. They introduced me to Youngstown. I was hooked.

    Rust Belt Chic always will be ironic. People are attracted to shrinking city hellholes. However, the hellhole part is misunderstood. What I mean is seeing opportunity hiding in a community struggling with survival. There’s just something about Youngstown that stirs passion in me. I’m not gawking at ruin porn or glossing over everything that is wrong. I love Rust Belt cities. I love Rust Belt culture. I’m proud to be from the Rust Belt. That’s what Rust Belt Chic now means to me. It’s personal. It’s who I am.

    For Pittsburgh, I could sense the tide turning. I see the same transformation taking place in other Rust Belt cities. A pejorative, Rust Belt-ness is an asset. It’s a starting point for moving forward, not a finish line or a civic booster campaign. Rust Belt Chic is in the same vein as rasquache:

    Rasquache sensibility that has become an important component of Chicana and Chicano art. The word, rasquache can be used in several senses. Its most common use is negative and relates to an attitude that is lower class, impoverished, slapdash and shallow. For this reason Tomás Ybarra Frausto who has written the cogent essay “Rasquachismo: A Chicano Sensibility” begins by stating, “One is never rasquache, it is always someone else, someone of a lower status, who is judged to be outside the demarcators of approved taste and decorum (in Richard Griswold del Castillo and others, Chicano Art: Resistance and Affirmation, 1965-1985. Los Angeles: Wight Gallery, UCLA, 1991, p. 155)

    However, as the case of several other terms and concepts (most notably the term and concept Chicano itself, which traditionally had a negative sense), the Chicano movement has turned the traditional notion of rasquache on its head. This important Chicano cultural sensibility has been particularly used to address, by means of a stance of resistance that is humorous and ironic rather than confrontational or hard-edged, the harrassments of external authorities such as the police, the immigration service, government officials, social services bureaucrats, and others. Chicano art that is rasquache usually expresses an underdog, have-not sensibility that is also resourceful and adaptable and makes use of simple materials including found ones, such as Luján’s cardboard, glue, and loose sand. 

    Rust Belt Chic turns the traditional notion of Rust Belt on its head. The Rust Belt is lower class, impoverished, slapdash, and shallow. At least, that’s how it looks from the coast, in New York City. Rust Belt Chic as a place to be is a form of resistance. It’s also a hot new trend and a threat to those neighborhoods that make my heart beat faster. From San Antonio:

    “I see a lot of progressiveness happening lightning quick now. When I came from Los Angeles as a visitor in 1992, I saw all these magic spaces you could rent for 300 or 400 a month. But I would laugh because there was little or nothing going on. I could get together some event with a friend or two and everybody thought it was so cool and innovative – I was just copping what I had seen in LA.

    San Antonio has gotten a lot more popular with Austin and California types discovering what a jewel this town is. Eclectic little restaurants and coffee places and shops growing up along Broadway and throughout Southtown. We’re being seen by a lot more cutting edge people by being open to contemporary signage and logos and creative design. With that, unfortunately, comes more expensive retail spaces and taxes are going up.

    There is a charm and real-ness to San Antonio I hope we don’t lose in the process. San Antonio is a non-materialistic town; people aren’t looking at your shoes or what kind of car you drive. When I leave San Antonio, it’s that real-ness that brings me back, every time. I left LA, and I left Austin because I got so tired of the trendy-ness. We’re growing fast, we’re drawing an eclectic market that will support artists. However, there will be a compromise. I don’t want to see it get too uptight.”

    –Robert Tatum

    Pittsburgh is Rust Belt Chic Paris. San Antonio is Rasquache Paris. When Richey Piiparinen and I were in San Antonio to do fieldwork, we were both struck by the Rust Belt Chic qualities of the city. At the time, we weren’t familiar with rasquache. We are now. I see a lot of similarities between Pittsburgh and San Antonio, particularly the way both places are under-appreciated. They enjoy a cult following. Hopefully, neither one will become the next Austin or Portland.

    Rasquache is further along, much further, than Rust Belt Chic. In fact, Rust Belt Chic is rasquache:

    This called to mind a passage I’d read in Have You Seen Marie? It’s an unusual book for a writer whose work has been at turns bawdy, avant-garde, and politically trenchant. Entirely autobiographical, Marie is a short, illustrated story with a childlike tone about Cisneros searching the streets of King William for a friend’s lost cat while mourning the loss of her mother, who died in 2010. I read Cisneros the passage I’d thought of: “ ‘King William has the off-beat beauty of a rasquache, and this is what’s uniquely gorgeous about San Antonio as a whole.’ ”

    She smiled. “Rasquache is when you make or repair things with whatever you have at hand. You don’t go to Home Depot. If you have a hole in your roof, you put a hubcap on there. Or you fix your fence with some rope. That’s rasquache. And then there’s ‘high rasquache,’ which is a term the art critic Tomás Ybarra-Frausto coined. He lives here. Danny Lozano knew high rasquache. He’d serve you Church’s fried chicken on beautiful porcelain and use Lalique crystal for flowers he’d cut from an empty lot.”

    “And that was one of the qualities that drew you to King William?”

    “Not just King William but San Antonio. A kind of elegance of found things. San Antonio has that soul. It’s not, ‘We gotta copy what we saw in New York.’ No! It’s going to come out of our own idea of what we think is beautiful.” She stared at me as if to make sure I understood. “But that’s also what’s getting lost. People feel like the city’s got to look like someplace else. Our mayor needs a stylist. He thinks he has to dress like a Republican. Pues, he’s Chicano! He’s got this gorgeous indigenous look, and he would look so cool if Agosto Cuellar, one of our local designers, dressed him, or someone like Franco, or Danny, or John Phillip Santos—he dresses totally San Antonio cool. He should do a style column for Texas Monthly.”

    I allowed that Santos, who is a regular contributor to this magazine, does have singular style (the last time I saw him, in December, he was wearing a horsehair charro tie and ringneck python boots) but joked that there might be a preponderance of leather pants in his fashion advice. Cisneros waved the joke aside.

    “Our problem is that we can’t recognize or celebrate what we have. We have this inferiority complex in Texas that we have to look elsewhere. Well, who knows more about inferiority than Chicanos? We grew up being ashamed because the history that is taught to us makes us ashamed. The whole colonial experience surrounding the Alamo is meant to make you feel ashamed.”

    In writer Sandra Cisneros, I sense a kindred spirit. As a Rust Belt native, Erie no less, I felt ashamed. I come from failure. I have no culture worth celebrating. Anywhere else must be better. That’s why we leave. Brain drain.

    I, too, was drawn to King William while in San Antonio. It is New Orleans (creole) and Pittsburgh (parochial). It’s like nothing I’ve experienced before. I get that boom town vibe of a place that is cool before anyone knows it is cool:

    Russell has seen what’s coming before. “When the buzz starts – when San Antonio embraces the brain gain, goes in the right direction on the talent economy and hipsters start to get wise to the neighborhood assets that are here – once the hipsters get wind of it – you’ll have to beat them away with a stick,” he said.

    I think that’s the concern of Robert Tatum. About a year ago, such a notion was unfathomable to Cleveland. What will the compromise with gentrification look like in Ohio City? Will somebody utter the words, “He dresses totally Cleveland cool”?

    Danny Lozano knew high rasquache. He’d serve you Church’s fried chicken on beautiful porcelain and use Lalique crystal for flowers he’d cut from an empty lot.

    Rust Belt Chic is served.

    Jim Russell is a talent geographer with particular interest in the Rust Belt. Read his blog at Burgh Diaspora, where this piece originally appeared.

  • The 2012 Metro Year in Jobs

    Last month the BLS put out the first official release of annual job data for metropolitan areas, so I wanted to take a brief look at this for large metro areas (more than one million in population, based on old metro area definitions that the BLS still uses). Here are the top 10 cities for percentage job growth. Nashville takes the crown. I’m also personally glad to see Indy bounce back after a couple tough years.

    Rank (Best) Metropolitan Area 2011 2012 Pct Change
    1 Nashville-Davidson–Murfreesboro–Franklin, TN 756.7 786.2 3.90%
    2 Houston-Sugar Land-Baytown, TX 2592.1 2691.4 3.83%
    3 Austin-Round Rock-San Marcos, TX 795.0 823.2 3.55%
    4 Salt Lake City, UT 620.0 641.0 3.39%
    5 San Jose-Sunnyvale-Santa Clara, CA 876.4 905.2 3.29%
    6 San Francisco-Oakland-Fremont, CA 1917.2 1977.8 3.16%
    7 Charlotte-Gastonia-Rock Hill, NC-SC 825.1 850.3 3.05%
    8 Raleigh-Cary, NC 506.9 521.9 2.96%
    9 Dallas-Fort Worth-Arlington, TX 2932.2 3016.0 2.86%
    10 Indianapolis-Carmel, IN 888.6 913.8 2.84%

    Here are the bottom ten performers. The federal slowdown already appears to be hitting DC:

    Rank (Worst) Geography 2011 2012 Pct Change
    1 St. Louis, MO-IL 1298.7 1298.8 0.01%
    2 Rochester, NY 510.1 513.2 0.61%
    3 Providence-Fall River-Warwick, RI-MA – Metro 544.8 548.3 0.64%
    4 Buffalo-Niagara Falls, NY 543.5 547.0 0.64%
    5 Philadelphia-Camden-Wilmington, PA-NJ-DE-MD 2707.4 2725.2 0.66%
    6 Milwaukee-Waukesha-West Allis, WI 815.5 821.4 0.72%
    7 Virginia Beach-Norfolk-Newport News, VA-NC 737.7 743.8 0.83%
    8 Hartford-West Hartford-East Hartford, CT – Metro 538.2 542.7 0.84%
    9 New Orleans-Metairie-Kenner, LA 525.1 529.7 0.88%
    10 Washington-Arlington-Alexandria, DC-VA-MD-WV 3007.6 3039.8 1.07%

    And here is the complete list:

    Row Metropolitan Areas 2011 2012 Total Change Pct Change
    1 Atlanta-Sandy Springs-Marietta, GA 2306.0 2349.9 43.9 1.90%
    2 Austin-Round Rock-San Marcos, TX 795.0 823.2 28.2 3.55%
    3 Baltimore-Towson, MD 1292.6 1317.8 25.2 1.95%
    4 Birmingham-Hoover, AL 493.6 501.4 7.8 1.58%
    5 Boston-Cambridge-Quincy, MA-NH – Metro 2459.5 2499.2 39.7 1.61%
    6 Buffalo-Niagara Falls, NY 543.5 547.0 3.5 0.64%
    7 Charlotte-Gastonia-Rock Hill, NC-SC 825.1 850.3 25.2 3.05%
    8 Chicago-Joliet-Naperville, IL-IN-WI 4305.1 4369.2 64.1 1.49%
    9 Cincinnati-Middletown, OH-KY-IN 990.1 1002.4 12.3 1.24%
    10 Cleveland-Elyria-Mentor, OH 1001.2 1016.6 15.4 1.54%
    11 Columbus, OH 926.0 950.4 24.4 2.63%
    12 Dallas-Fort Worth-Arlington, TX 2932.2 3016.0 83.8 2.86%
    13 Denver-Aurora-Broomfield, CO 1213.6 1246.1 32.5 2.68%
    14 Detroit-Warren-Livonia, MI 1785.7 1826.8 41.1 2.30%
    15 Hartford-West Hartford-East Hartford, CT – Metro 538.2 542.7 4.5 0.84%
    16 Houston-Sugar Land-Baytown, TX 2592.1 2691.4 99.3 3.83%
    17 Indianapolis-Carmel, IN 888.6 913.8 25.2 2.84%
    18 Jacksonville, FL 586.8 595.6 8.8 1.50%
    19 Kansas City, MO-KS 980.6 996.8 16.2 1.65%
    20 Las Vegas-Paradise, NV 808.2 823.6 15.4 1.91%
    21 Los Angeles-Long Beach-Santa Ana, CA 5165.8 5264.6 98.8 1.91%
    22 Louisville/Jefferson County, KY-IN 598.0 610.9 12.9 2.16%
    23 Memphis, TN-MS-AR 593.8 600.9 7.1 1.20%
    24 Miami-Fort Lauderdale-Pompano Beach, FL 2228.6 2278.2 49.6 2.23%
    25 Milwaukee-Waukesha-West Allis, WI 815.5 821.4 5.9 0.72%
    26 Minneapolis-St. Paul-Bloomington, MN-WI 1735.0 1766.4 31.4 1.81%
    27 Nashville-Davidson–Murfreesboro–Franklin, TN 756.7 786.2 29.5 3.90%
    28 New Orleans-Metairie-Kenner, LA 525.1 529.7 4.6 0.88%
    29 New York-Northern New Jersey-Long Island, NY-NJ-PA 8418.2 8554.3 136.1 1.62%
    30 Oklahoma City, OK 580.1 593.4 13.3 2.29%
    31 Orlando-Kissimmee-Sanford, FL 1014.9 1040.3 25.4 2.50%
    32 Philadelphia-Camden-Wilmington, PA-NJ-DE-MD 2707.4 2725.2 17.8 0.66%
    33 Phoenix-Mesa-Glendale, AZ 1715.6 1757.1 41.5 2.42%
    34 Pittsburgh, PA 1144.9 1158.6 13.7 1.20%
    35 Portland-Vancouver-Hillsboro, OR-WA 987.8 1006.6 18.8 1.90%
    36 Providence-Fall River-Warwick, RI-MA – Metro 544.8 548.3 3.5 0.64%
    37 Raleigh-Cary, NC 506.9 521.9 15.0 2.96%
    38 Richmond, VA 610.9 623.4 12.5 2.05%
    39 Riverside-San Bernardino-Ontario, CA 1128.8 1151.6 22.8 2.02%
    40 Rochester, NY 510.1 513.2 3.1 0.61%
    41 Sacramento–Arden-Arcade–Roseville, CA 808.6 822.5 13.9 1.72%
    42 Salt Lake City, UT 620.0 641.0 21.0 3.39%
    43 San Antonio-New Braunfels, TX 858.4 877.9 19.5 2.27%
    44 San Diego-Carlsbad-San Marcos, CA 1233.4 1258.8 25.4 2.06%
    45 San Francisco-Oakland-Fremont, CA 1917.2 1977.8 60.6 3.16%
    46 San Jose-Sunnyvale-Santa Clara, CA 876.4 905.2 28.8 3.29%
    47 Seattle-Tacoma-Bellevue, WA 1671.3 1711.5 40.2 2.41%
    48 St. Louis, MO-IL 1298.7 1298.8 0.1 0.01%
    49 Tampa-St. Petersburg-Clearwater, FL 1129.7 1155.7 26.0 2.30%
    50 Virginia Beach-Norfolk-Newport News, VA-NC 737.7 743.8 6.1 0.83%
    51 Washington-Arlington-Alexandria, DC-VA-MD-WV 3007.6 3039.8 32.2 1.07%

    Aaron M. Renn is an independent writer on urban affairs and the founder of Telestrian, a data analysis and mapping tool. He writes at The Urbanophile, where this piece originally appeared.

    Get a job photo by Bigstock.

  • Fracking Offers Jerry Brown a Watershed Moment

    The recent announcement that Jerry Brown is studying "fracking" in California, suggests that our governor may be waking up to the long-term reality facing our state. It demonstrates that, despite the almost embarrassing praise from East Coast media about his energy and green policies, Brown likely knows full well that the state’s current course, to use the most overused term, is simply not politically and economically sustainable.

    Although largely a prisoner of basic green dogma, Brown also is a former Jesuit, with that order’s sense of rationality, order and, well, philosophical flexibility. Unlike many of his progressive idolaters and legislative allies, Brown may well be intelligent enough to look past the rhetoric of the environmental movement and consider its often unexpected ill-effects.

    Brown needs to balance "California comeback" stories – including one that gushingly describes "California beaming" – with the actual realities. Good times, and the current technology bubble, may be blessing Silicon Valley, but as Walter Russell Mead points out, this comeback is being pushed "over the heads of the poor and the jobless." This, he adds, "is not how progressives used to think."

    The chasm between the effects of "noble" green politics and the interests of most Californians is becoming evident, if not widely recognized in the mainstream media. Editorial writers at the New York Times may believe we are losing our need for oil and gas, but this transition should be more difficult than they suggest and, if achieved through often-thoughtless Draconian measures, could have profound impacts on the overall economy.

    Let’s start with the supposed "up" side of the purist renewable policies hitherto embraced by Brown. The governor’s 2010 election promise about creating 500,000 "green jobs" – his economic rationale for his energy and other environmental policies – increasingly looks far-fetched. With electric car maker Fisker, backed by well-connected Democratic venture capitalists and Al Gore, now perhaps ready to follow solar-panel maker Solyndra into bankruptcy, the pitch about a green economy seems unlikely, even bizarre.

    The state-driven "green" policies have also created huge losses for the giant state-employee retirement fund CalPERS, one of whose managers at a recent conference confided that renewable–energy investments have negative returns approaching 10 percent.

    Certainly, neither green energy nor even the current Silicon Valley bubble are creating enough jobs to make up for the enormous shortfall in employment since the recession. This is particularly evident in urban areas like Los Angeles and Oakland – where Brown was mayor from 1999-2006 – as well as most of the state’s interior. Overall, the state vies for last-place honors with the likes of Rhode Island, Nevada and Mississippi for the nation’s highest unemployment rate. The damage is greatest in the state’s more blue-collar interior. Working-class Stockton just was allowed to enter bankruptcy and other municipalities seem likely to join the queue.

    Progressive journalists, eager to pronounce the state’s comeback to justify their ideology, seem utterly unaware of the seriousness of the overall situation in the state. One wonders what they would say if Pete Wilson or Meg Whitman were governor. Compare Texas, which is 550,000 jobs ahead of its 2007 number, to California, which, despite recent gains, remains down 560,000 jobs from its peak. Perhaps unemployment is not a big issue in the progressive reserve of Palo Alto, where the jobless rate is about the same as in North Dakota, but it is a constant in much of Los Angeles, San Jose and Santa Ana, as well as the Central Valley. If this suggests a "comeback" to New York Times columnist Paul Krugman, perhaps we need a new definition for that word.

    These comparisons seem particularly relevant to the discussion of fracking – oil and gas extraction using a technique called hydraulic fracturing. In the environmental scheme of things, oil and even natural gas, once widely favored by progressives, now constitute an utter evil. This is true even though gas has been the primary reason for the country’s reduced carbon emissions by replacing coal as a source for generating electricity. Some of the state’s well-heeled greens would like to ban the process entirely.

    Brown must be aware he is not just governor of the public sector or of his admirers among the coastal rich. He has to consider the unimaginable: removing mandates that force the state to rely on expensive, often-unreliable renewables, notably, solar. These have helped push California electricity prices well above the national average, and much higher than in prime economic competitors such as Washington state, Utah, Texas, Arizona and Nevada. Economist John Husing suggests this is one reason why California not only completely missed the recent national revival in manufacturing jobs – 500,000 the past two years – but actually lost 10,000 more such jobs.

    We are clearly missing the party here. California’s energy policies reflect what is already happening in Europe, where anti-fracking ideology, sometimes supported by the no-doubt-disinterested Russians, have largely won the day. But the costs of green policies have already convinced hard-pressed Spain to abandon its widely praised renewable program.

    Far more economically healthy Germany also is rethinking its renewables mandates. One reason: German companies like Bayer and BASF consider moving to cheaper locales, such as along the U.S. Gulf Coast, where electricity is one-third the price. Texas, Utah and Arizona are to California’s hard-pressed manufacturers what the Gulf Coast is to Germany’s.

    And, then, there are the effects of the budget. Unlike his East Coast admirers, Brown must know that the budget situation is hardly rosy over the longer term. The state auditor recently released a report showing the state’s net worth to be negative by some $127 billion, in large part due to often out-of-control pension costs. There are already indications that the return from last year’s hike in income taxes may not be as large as expected and that what was, during the election, promised to schools will likely end up, as widely predicted, covering rising pension obligations.

    Companies and individuals may not leave California in droves, as some have suggested, but investors certainly can put their money someplace more fiscally responsible. A longer-term problem may be that the higher-income earners, who generate the vast majority of income-tax revenue, are also those most likely to change behavior or find effective income-hiding strategies; remember, Facebook paid no income taxes last year.

    Given these prospects, reviving California’s fossil-fuel industry could prove a critical boost to the budget. A deal to raise some energy taxes while allowing more exploration and development would go a long way to filling the state’s coffers.

    Energy taxes play a big role in financing higher education in many states, including North Dakota, Louisiana and Texas. Oil money, ironically, has allowed Texas to fund universities, particularly the main University of Texas campus in Austin, as a competitor to the perennially hard-pressed University of California system. An energy boom in California, whose energy resources may exceed those of all these states, might offend most academics, but, my hunch is, they might take the money.

    Perhaps more important, a pragmatic shift on energy would also help, as columnist Tim Rutten puts it, "jump start" the state’s economy, particularly in central California. In the past decade, Texas has created almost 200,000 energy-related jobs, while California has generated barely 20,000. These jobs provide good wages to many blue-collar workers, the very people losing out the most in our progressive-minded state.

    There are other signs of pragmatism from the governor. Brown has announced support for a peripheral canal that would provide more-reliable water supplies to the state’s huge agribusiness industry. Although some state regulators threaten farmers with ever-tougher regulations, some observers, such as three-term Salinas Mayor Dennis Donahue, now a full-time farmer, say the governor is trying to "walk the line between labor, greens and agriculture."

    Many Republicans and conservatives find the notion of Brown getting on the road to reality itself fundamentally unrealistic. But the past could be prologue. Brown also started off his first term, in 1975, as something of a dreamer, proclaiming a "small is beautiful" agenda. This was, in many ways, ahead of its time, and skeptical of government spending, but Brown’s environmental views, particularly, also offended some business interests. Far worse, he signed off on legislation freeing up public-sector unions, which has turned into something of a disaster.

    But by the time he started running for a second term, Brown readjusted to a new reality. He could claim that, as someone opposed to the growth of institutionalized government, he could live with Proposition 13. Brown had opposed the measure, but, once it passed, in 1978, he chose, unlike many progressives, to embrace it.

    Brown then ran as a centrist, pro-growth governor. He particularly embraced the then-ascendant technology industry, gaining new donors and allies, although the shift toward realpolitick horrified some of his green backers. But the politics worked brilliantly.

    Today’s circumstances, of course, are different. For one thing, Brown faces little pressure from the right, as the Republican Party, at least for now, has deteriorated into near irrelevancy. The once-potent California business community also has lost much influence, with every lobby, basically, trying to make its own deal with the overweening state apparat.

    So, if Brown is to move to the center, he will have to do it largely on his own, and put up with the incessant hectoring of his allies. Yet, Brown’s occasional genius has demonstrated a Machiavellian quality, knowing when to embrace opponents in order to divide or weaken them, or to allow allies to stew. He also, at this stage of life – today, April 7, is his 75th birthday – must wonder if he wants to leave a legacy of fiscal weakness, a fading competitive edge and an ever-expanding class chasm. In the long run, whether on fracking or a host of other issues, Brown’s success will not derive from pleasing progressive writers, but by promoting a better future for the vast majority who live in, and love, this state.

    Joel Kotkin is executive editor of NewGeography.com and a distinguished presidential fellow in urban futures at Chapman University, and a member of the editorial board of the Orange County Register. He is author of The City: A Global History and The Next Hundred Million: America in 2050. His most recent study, The Rise of Postfamilialism, has been widely discussed and distributed internationally. He lives in Los Angeles, CA.

    This piece originally appeared in the Orange County Register.

    Photo: Troy Holden

  • The Evolving Urban Form: Nanjing

    Nanjing is one of China’s most historic cities. It is one of the four great ancient capitals of the nation, along with Beijing, Chang’an (Xi’an) and Luoyang. Its name means southern capital (Nan=south, Jing=capital), while the name of the current capital, Beijing means Northern capital. Nanjing was the national capital at various times, however generally for periods of no more than a few decades. Upon the establishment of the People’s Republic of China, the national capital was moved permanently to Beijing, where it had been for most of the previous five centuries.

    Nanjing is the capital of Jiangsu, which is China’s fifth most populous province. It has twice as many people as California (80 million) and a land area the size of Virginia. Nanjing is also one of the "four furnaces" of China, a title derived from its humid summers. The others include Wuhan (Hubei), Chongqing and sometimes Changsha (Hunan) or Nanchang (Jiangxi).

    Nanjing is reputed to have the world’s longest, though not the oldest surviving city wall, which was built in the 14th century (Photo).  The city is also the site of the second bridge ever built over the lower Yangtze River (Photo), opened in 1968 (the first was at Wuhan). The bridge carries both automobiles and trains. There are now five Yangtze River crossings in Nanjing.


    Nanjing City Wall


    Yangtze River (toward suburban Pukou qu)

    Yangtze Delta Megalopolis

    Nanjing is a big city in one of the world’s great urban mega-regions. It serves as the Western anchor of the Yangtze Delta region, a megalopolis (string of metropolitan areas) which consists of a string of sometimes adjacent urban areas, stretching through Suzhou to Shanghai and Hangzhou to Ningbo, with a population of approximately 60 million (plus additional millions in rural areas, outside the urban areas). This is at least a third more than live in the longer Washington-New York-Boston corridor, the original megalopolis.

    A trip through the Yangtze Delta corridor demonstrates only comparatively short sections that are not urbanized. One of the longest is the 10 mile (16 kilometer) section from the eastern urban fringe of Nanjing to the western fringe of Zhenjiang (location of the Pearl S. Buck Museum). Further, Nanjing’s southern fringe now meets that of Maanshan, in Anhui province (not a part of the Yangzte Delta).

    The Nanjing Urban Area

    Nanjing has grown rapidly. In 1950, the urban area population was approximately 1.0 million (see "Definition of Terms Used in the Evolving Urban Form Series"), a population some sources say was exceeded in the 15th century. The urban area has now reached 5.8 million. Nanjing is the world’s 59th largest urban area and the 13th largest in China. It is projected to have a population of more than 8 million by 2025 (Figure 1). The Nanjing urban area (Figure 2) covers approximately 440 square miles (1,140 square kilometers). This results in a population density of approximately 13,100 per square mile (5,100 per square kilometer).

    Consistent with the general principle that cities become less dense as they get larger, Nanjing’s population density has fallen significantly over the last 60 years, even as its geographical size has more than quintupled (Figure 3). Older historic land area data is not readily available, but if it is assumed that virtually all of Nanjing’s United Nations reported 1,000,000 population in 1950 lived within the 17 square mile (44 square kilometer) periphery of the city walls, the population density would have been more than 60,000 per square mile (more than 23,000 per square kilometer). The area within the city walls is indicated by green shading in the urban area representation (Figure 2).

    By 1970, the population had increased to over 1.4 million and if this population was contained inside the city walls, the population density would have approached 90,000 per square mile (35,000 per square kilometer).Indicating a similar density, the 2010 population of the most densely populated district (Golou qu), much of which is located inside the Wall 86,000 per square mile (33,000 per square kilometer).

    The Nanjing Metropolitan Area

    Nanjing is a prefecture (regional municipality) with 11 districts, of which nine are in the metropolitan area (Note 1). The core of Nanjing continues to grow, from 2.5 million in 2000 to 3.4 million in 2010, an increase of 34 percent (Note 2). But in comparison, the suburban districts grew from 2.3 million to 3.8 million, an increase of 64 percent (Figure 4). For the first time, suburban Nanjing has a larger population than the urban core. The suburbs accounted for 64 percent of the metropolitan area’s growth over the past decade, compared to 36 percent in the urban core (Figure 5).

    Pukou, a suburban district across the Yangtze River from the historic location of Nanjing, was by far the fastest growing part of the metropolitan over the past decade. By 2010, the population had risen to 710,000 from 225,000 in 2000, when it was largely rural. Two metro lines are planned to connect Pukou to the rest of the urban area, which is likely to encourage further suburban development.

    The Nanjing Economy

    Nanjing, like other cities in China, has been a beneficiary of China’s unprecedented poverty reduction, first launched by the economic reforms started by Deng Xiao Ping in the early 1980s. It is estimated that in 2012, Nanjing’s gross domestic product per capita (purchasing power parity adjusted) was approximately $25,000 annually. Nanjing’s GDP per capita is compared to that of other Chinese metropolitan areas and examples from the developed world in Table 6 (Note 3).

    A Strong Future

    Nanjing seems likely to continue its strong growth. This and Nanjing’s geographic location in one of the most vibrant mega-regions in the world should guarantee a continuing and strong contribution not only to the development of the Yangtze Delta megalopolis, but also to economic progress of China as a whole.

    Wendell Cox is a Visiting Professor, Conservatoire National des Arts et Metiers, Paris and the author of “War on the Dream: How Anti-Sprawl Policy Threatens the Quality of Life.

    —-

    Note 1: The districts (qu and counties) designated as urban by Nanjing prefecture (regional municipality) authorities Entire peripheral districts are designated when they begin to receive urban development. The "urban" designation in China, however, does not indicate continuous urbanization and is thus not an urban area in the internationally defined sense. The Chinese urban definition is thus similar to a metropolitan area (labor market).

    Note 2: The urban core includes the following districts (qu): Xuanwu, Biaxia, Qinhaui and Gulou.

    Note 3:  Estimated the Brookings Institution Global Metro Monitor, and other sources. See "World’s Most Affluent Metropolitan Areas: 2012" including the "Note."

    Top Photo: Zifeng Tower (all photos by author)

  • US Suburbs Approaching Jobs-Housing Balance

    Suburban areas in the US metropolitan areas with more than 1 million total regional population, once largely seen as bedroom communities, are nearing parity between jobs and resident employees. The jobs housing balance, which measures the number of jobs per resident employee in a geographical area has reached 0.89 (jobs per resident workers) in these 51 major metropolitan areas, according to data in the 2011 one-year American Community Survey. This is well below the 1.39 ratio of jobs to resident employees in the historical core municipalities (Figure 1).

    The historical core municipalities still have a larger share of metropolitan employment than they have of resident workers. However, 65 percent of major metropolitan area jobs are now in the suburbs, where 74 percent of workers live (Figure 2). The 0.89 jobs housing balance index indicates that there are only 11 percent fewer jobs in the suburbs than resident workers. Overall, the jobs housing balance of metropolitan areas (a synonym for labor markets) is at or near 1.00.

    From Monocentric to Polycentric to Dispersed Cities
    The data indicates the extent to which the classical monocentric city has been left behind by the evolution of the modern metropolitan area. Before the near universal extension of automobile ownership, cities were necessarily much more monocentric. Transit lines tended to converge on downtown, which made downtowns far more dominant in their share of metropolitan employment than they are today.

    For example, in 1926, according to historian Robert M. Fogelson writing in Downtown: Its Rise and Fall: 1880-1950, in 1926 41 percent of Los Angeles residents went to downtown every day, a figure that had dropped to 15 percent by 1953, principally for work and shopping. Today, in a much larger metropolitan area that also includes Orange County, 3 to 5 percent of jobs are located downtown (depending on the geographical definition). The area not only lost a significant share of metropolitan employment, but saw its share of retail sales drop as regional shopping centers were built throughout the area. Similar trends occurred in virtually every metropolitan area of the United States.

    All of this occured as the automobile facilitated access to virtually everywhere in the metropolitan area, not just downtown.

    The emerging polycentricity of the city long was obvious to many analysts, but it was Joel Garreau who brought the issue to popular attention in his classic Edge City: Life on the New Frontier. Garreau documented the development of large suburban employment centers throughout the major metropolitan areas and provided a list. Later, Robert Lang of the University of Nevada Las Vegas took the issue further in his Edgeless Cities: Exploring the Elusive Metropolis, which examined office space outside downtown areas and edge cities in 1999. Gross office space was greatest outside both the downtowns and edge cities, according to Lang’s data (Note 1).

    Lang’s analysis is limited to office space, which is more concentrated in downtown areas than employment. On average, 2000 data indicates that downtown areas had approximately 10 percent of employment, well below downtown’s 36 percent share of office space (Figure 3).

    Even so, there remains a misconception today that cities remain monocentric. Yet as the figures show we are progressing toward a distribution of jobs that nearly matches its distribution of housing, with the exception of downtown (where there is the greatest imbalance, see below).

    Historical Core Municipalities: Where the Jobs-Housing Imbalance is the Greatest

    The excess of jobs in relation to residential workers is greatest in the historical core municipalities. It is driven by the downtown areas (central business districts or CBDs), which have by far the highest employment densities in the metropolitan areas. For example, in 2000, the downtown areas of the nation’s 50 largest urban areas had an average job density 92,000 per square mile. This is approximately 70 times the average non-downtown urban area employment densities (1,300 per square mile). Downtown residential densities, if they were readily available, would doubtless be a small fraction of the downtown employment figures.

    Largest Historical Core Municipality Jobs-Housing Imbalances

    The imbalance between jobs and housing is highest among the historical core municipalities of Washington (2.63), Salt Lake City (2.61), Orlando (2.48), Miami (2.44) and Atlanta (2.31). Yet, these large historical core municipality imbalances co-exist with generally near average suburban jobs housing balances. For example, in Washington there are 0.87 jobs per resident worker in the suburbs, or only 13 percent fewer jobs than workers who reside in the suburbs. In the other four metropolitan areas, the suburban jobs housing balance is above 0.80 (Figure 4).

    Smallest Historical Core Municipality Jobs-Housing Imbalances

    The smallest historical core municipality jobs housing imbalance is in San Jose (0.84), which is the only major metropolitan area in which has fewer jobs than resident workers (Figure 5). However, the municipality of San Jose is a "Post War Suburban" core municipality, having experienced virtually all of its growth since 1940. This is despite the fact that San Jose’s corresponding urban area is the third most dense (following Los Angeles and San Francisco). Generally higher suburban housing densities were built in San Jose compared to less dense urban areas – which extend over vast distances – such as New York, Philadelphia and Boston. San Jose is also the only metropolitan area in which there are more suburban jobs than suburban resident workers (1.41 jobs per worker).

    The other historical core municipalities with the least imbalance between employment and resident workers are Los Angeles (1.10), Chicago (1.17), Milwaukee (1.17) and New York (1.17). The surprising inclusion of New York is discussed below.

    Each of the historical core municipalities with the fewest jobs per resident worker has a higher than average jobs housing balance in its suburban areas. Los Angeles has 1.02 jobs per suburban resident worker, principally the result of importing workers from the adjacent Riverside-San Bernardino metropolitan area. Milwaukee also has more suburban jobs than suburban resident workers (1.01).

    New York

    New York has the second largest central business district in the world, following Tokyo. It therefore seems odd that the municipality of New York should have such a low ratio of jobs per resident worker. The borough of Manhattan, where the central business district is located, has 2.76 jobs per resident workers, higher than that of top ranked Washington, DC (above). There are 1,450,000 more jobs than resident workers in Manhattan.

    New York’s low ratio is the result of a huge shortage of jobs relative to workers the outer boroughs (the Bronx, Brooklyn, Queens and Staten Island). There are 830,000 fewer jobs than resident workers in the four outer boroughs. Their ratio of jobs per resident, at 0.71 is lower than all but five suburban areas in the other 50 major metropolitan areas (Figure 6).

    The suburbs of New York, ironically, are more job-rich than the outer boroughs. They boast an 0.91 jobs per resident worker, ranking 17th out of the 51 metropolitan areas.

    The New Normal

    The former assumption that "everyone works downtown" is a thing of the past. Dispersion of jobs throughout the metropolitan area has become the rule. The "old normal" was that of the bedroom community – people living in the suburbs and working in the core cities. The "new normal" is about downtown and the core city. To the extent that there is a distortion in the jobs housing balance throughout the modern metropolitan area, it is the result of a larger number of jobs than residents in the core cities (and especially downtown).

    Wendell Cox is a Visiting Professor, Conservatoire National des Arts et Metiers, Paris and the author of “War on the Dream: How Anti-Sprawl Policy Threatens the Quality of Life.

    ———————-

    Photo: Houston downtown (to the left), edge city (Texas Medical Center in the middle) and dispersed employment (rest of photo). Photo by author.

    Note 1: The total office space outside the primary downtowns, secondary downtowns and edge cities was 37.0 percent in reviewed 13 metropolitan areas. Primary downtowns accounted for 36.5 percent, secondary downtown for 6.5 percent and edge cities for 19.8 percent (this analysis classifies Beverly Hills, Mid-Wilshire and Santa Monica in Los Angeles  as secondary downtowns, rather than as primary as in the book. See tables 4-2 and 4-10).

    Note 2: The historical core municipalities are the largest municipalities in each metropolitan area, with the following exceptions.
    (a) Oakland and St. Paul are also historical core municipalities.
    (b) Norfolk is the historical core municipality in the Virginia Beach metropolitan area.
    (c) San Bernardino is the historical core municipality in Riverside San Bernardino
    (see Classification of Historical Core Municipalities)

  • Progessives, Preservation & Prosperity

    Conservatives often fret that Barack Obama is leading the nation toward socialism. In my mind, that’s an insult to socialism, which, in theory, at least, seeks to uplift the lower classes through greater prosperity. In contrast, the current administration and its core of wealthy supporters are more reminiscent of British Tories, the longtime defenders of hereditary privilege, a hierarchical social order and slow-paced economic change.

    The notion that the "progressives" are, in fact, closeted Royalists has been trotted out by a handful of Obama admirers, such as Andrew Sullivan, who calls the president "the conservative reformist of my dreams." Essentially, Sullivan argues, Obama has been a "Tory president," with more in common with, say, an aristocratic toff like British Prime Minister David Cameron than a traditional left-liberal reformer.

    The fundamental conservativism underlying the modern "progressive" marks the central thesis of an upcoming book by historian Fred Siegel, appropriately titled "Revolt Against the Masses." Siegel traces the roots of the new-fashioned Toryism to the cultural wars of the 1960s, when the fury of the "Left," once centered on the corporate elites, shifted increasingly to the middle class, which was widely blamed for everything from a culture of conformity to racism and support for the Vietnam War.

    Tory progressivism’s most-unifying theme, Siegel notes, includes the preservation and conservation of the landed order enjoyed by the British ultrawealthy and upper-middle classes. In the 19th century, Siegel notes, Tory Radicals, like William Wordsworth, William Morris and John Ruskin, objected to the ecological devastation of modern capitalism and sought to preserve the glories of the British countryside.

    They also opposed the "leveling" effects of a market economy that sometimes allowed the less-educated, less well-bred to supplant the old aristocracies, with their supposedly more enlightened tastes. "Strong supporters of centralized monarchical power, this aristocratic sensibility also saw itself as the defender of the poor – in their place," writes Siegel. "Its enemies were the middle classes and the aesthetic ugliness they associated with the industrial economy borne of bourgeois energies."

    Today, this Tory tradition lives on in contemporary Britain, where industry remains widely disparaged and land use tightly controlled. There is no more strident defender of preserving the space of the landed gentry than the leading Tory mouthpiece, The Daily Telegraph. All efforts are made to restrict the expansion of suburbs and new towns, all the better to preserve the British countryside for the better enjoyment of the gentry.

    As a result, Britain now suffers some of the world’s highest housing prices – even in the economically devastated north of the country. Unable to afford decent accommodations, notes author James Heartfield, some British families have been forced to live in old restrooms, garden sheds, even abandoned double-decker buses.

    Until recent decades, such an "enlightened" conservatism has been rare in America, with its strong tradition of upward mobility and vast landscape for development. As early as the 1950s, however, intellectuals, architects, planners and aesthetes have railed against the banality of suburbanizing, and democratizing, America, but the real turn towards gentry progressivism took place with the rise of the environmental movement in the 1970s.

    Rightfully alarmed by the deterioration of the environment at that time, early green activists made contributions to a remarkable cleanup of the nation’s air and water, something that widely benefited millions of Americans. But the movement also fell ever more prone to all manner of hysterias; at the first Earth Day, in 1970, some scientists predicted that, by the 1980s, people would not be able to walk outside without a helmet. Then followed a series of jeremiads about "limits of growth" associated with the depletion of critical minerals, "peak oil" and, finally, the call for radical steps to address climate change.

    All these causes, sometimes based on fact or somewhat overheated extrapolation, gradually diverted American progressives from their historic interest in economic growth and social mobility to a primary focus on environmental purity, whatever the social or economic cost. Their Tory-like policies have helped stunt economic growth, particularly in the blue-collar industrial and construction sectors, promoting, albeit unintentionally, ever-narrowing opportunity for all but a few Americans.

    Despite its opportunistic use of populist rhetoric, the Obama administration has presided over widespread economic distress – with the average household now earning considerably less than it did four years ago. This trend has worsened during the current "recovery," even as the Federal Reserve’s policies have generated record profits for corporate and Wall Street grandees.

    It has been a particular boon time for a new rising class of oligarchs from Silicon Valley, which has embraced Obama with money and technical expertise. Not surprisingly, the ultra-affluent coastal areas have become primary supporters of the administration, which in November won eight of the nation’s 10 wealthiest counties, many of them handily.

    The growing gaps between the "1 percent" and everyone else have been particularly marked in those regions under the most complete progressive control. The Holy Places of urbanism, such as New York, San Francisco and Washington, D.C., also suffer some of the worst income inequality.

    In these regions, the so-called "creative class" is courted by politicians, developers and corporate big-wigs. Meanwhile their putative political allies, in places like Oakland and parts of New York’s the outer boroughs, experience seemingly irrepressible permanent unemployment and, increasingly, rising crime. Perhaps the most outrageous example of the dual nature of the new progressive economy, notes Walter Russell Mead, can be seen in Detroit, where a shrinking, debt-ridden and dysfunctional city that fails its largely poor residents has generated $474 million since 2005 for well-connected Wall Street bond issuers.

    Under the progressive Tory regime, the best that can be offered the middle class is an outbound ticket to less-Tory-dominated, albeit often less culturally "enlightened" places, such as Texas, the Southeast or Utah. There, manufacturing, energy and agricultural industries still anchor much of the economy. Despite their expressions of concern for the lower orders, gentry progressives don’t see much hope for the recovery of blue-collar manufacturing or construction jobs, at least not in their bailiwicks. Instead they suggest that the hoi polloi seek their future in what the British used to call "service," that is, as caregivers, haircutters, dog walkers, waiters and toenail painters for their more-highly educated betters.

    Such kindness, however, is no replacement for the kind of broad-based economic growth that historically has promoted self-sufficiency and upward mobility, both in California and elsewhere. Due in large part to the new progressive policies, this is now increasingly out of reach for many in the middle class, as well as the increasingly Latino working classes. Indeed, a recent report from the Public Policy Institute of California reveals that class stratification in the state has expanded far faster than the national average.

    "We have created a regulatory framework that is reducing employment prospects in the very sectors that huge shares of our population need if they are to reach the middle class," notes economist John Husing. A onetime Democratic activist, Husing laments how, in progressive California, green energy policies have driven up electricity costs to twice as high as those in competitor states, such as Utah, Texas and Washington, and considerably above those of neighboring Arizona and Nevada. These and other regulatory policies, he suggests, are largely responsible for the Golden State missing out on the country’s manufacturing rebound, losing jobs, while others, not only Texas but also in the Great Lakes, have expanded jobs in this sector.

    Similarly, Draconian land-use regulations have not only kept housing prices, particularly on the coasts, unnecessarily high, but slowed a potential rebound in the construction sector, traditionally a source of higher-wage employment for less-than-highly educated workers. So, while Google workers are pampered and celebrated by the progressive regime, California suffers high unemployment and a continued exodus of working-class and middle-class families.

    Sadly, there currently is no strong counterweight to the new Tory ascendency. Until traditional social democrats awake to realities, or the GOP acknowledges the painful reality of class, America will continue to lurch towards the very Tory model that our forefathers had the wisdom to reject throughout most of our history.

    Joel Kotkin is executive editor of NewGeography.com and a distinguished presidential fellow in urban futures at Chapman University, and a member of the editorial board of the Orange County Register. He is author of The City: A Global History and The Next Hundred Million: America in 2050. His most recent study, The Rise of Postfamilialism, has been widely discussed and distributed internationally. He lives in Los Angeles, CA.

    This piece originally appeared in the Orange County Register.

    Photo by: conservativeparty

  • Green Office Towers Cast Shadow Over Sydney

    Known for her spiky hair, studded-collar and heels, Sydney’s Lord Mayor is the epitome of progressive chic. For a green activist, though, Clover Moore attracts some surprising company. Landlords owning 58 per cent of the CBD’s office space have rushed to join her Better Buildings Partnership, an alliance “to improve the sustainability performance of existing commercial and public sector buildings”. At first glance, the property industry’s enthusiasm for ‘green building’ seems strange.  Shouldn’t they be insisting on less costly design and materials?  Or despite their hard-nosed reputation, are they out to save the planet after all?

    As it turns out, the lure of green building has more to do with cash than climate. By virtue of the soft economy and creeping “sustainability” measures, green-rated office towers are a gilt-edged opportunity for investors fleeing stocks and bonds. The wave of change rolling over central Sydney displays a certain logic. Meddling officials get to wrap themselves in virtue while big landlords – local and global investment trusts and fund managers – get a new premium grade rating for their properties. How better to protect asset values in an unsettled world? It’s a cosy, CBD-boosting deal, even if it distorts job and investment flows in outlying parts of the city.

    The floor-space revolution

    Even before the crash of 2008, banks, insurance companies and other financial services were under pressure to extract higher value out of every inch of floor-space. The global debt meltdown only accelerated the process. Aggressive cost-cutting saw Australian banks reduce their cost-to-income ratios from around 60 per cent in the late 1980s to around 45 per cent today. This priority is turning Sydney CBD’s office core inside-out, a trend reinforced by pay-offs from the green-rating of building stock.

    One recent headline summed it up neatly: “Martin Place exodus”. The article describes how major banks like Westpac, ANZ and Commonwealth are all vacating large office blocks in stately Martin Place, “the heart of Sydney’s financial centre”. Linking George Street, the CBD’s commercial “spine”, to the city’s government office sector along Macquarie Street, near state Parliament House, Martin Place has hosted the cream of Australia’s banking and insurance houses since the nineteenth century. The Reserve Bank is based there as well.   

    Sydney’s traditional office core enclosed Martin Place within Clarence, King and Macquarie Streets and the waterfront at Circular Quay. In line with conventional CBD morphology, this lies just north of the longstanding, but expanding, retail core bounded by York, Park, Elizabeth and King Streets, where large department stores are concentrated around the conjunction of George and Market Streets, the CBD’s peak land value intersection (PLVI).  

    Driven to economise on floor-space, larger financial and professional services firms are leaving the traditional office core for outer blocks, which until recently were, in the parlance of CBD theory, “zones in transition”, low-grade areas on the periphery of the office and retail cores with potential for higher value functions. Some “see the axis of the Sydney central business district changing.” Typically, landlords are now expected “to work with Sydney tenants to address their concerns around relocating or redesigning … and help minimise costs and increase efficiencies in their work environment.”  Lest this be dismissed as penny-pinching, a new “workplace philosophy” has been invented to sell the floor-space revolution, and, predictably, that old chestnut “sustainability” has been pressed into service.

    Spreading from banks to insurance companies to professional services and other large white-collar workplaces, “activity-based working” (ABW) has been treated to rapturous media coverage. “Gen Y shuts door on open-plan century”, is how one headline put it. In progressive outlets, ABW is depicted more as a reaction than an initiative, a revolution forced on employers – and indirectly on property developers – by green, socially aware, tech-savvy Gen Y office workers. As the narrative goes, they reject confinement in the “assigned desks” of open-plan workstations or offices. 

    At one prominent bank, staff are “free to roam and work where and how the mood takes them.” Usually, we are told, “they start the day at an ‘anchor point’ where their locker is and which they share with about 100 other workers … they might stay around that area for the day, with a choice of work situations ranging from quiet spaces to conversation areas, or they may set up somewhere else depending on who they need to see.” Equipped with laptops, i-pads, mobile phones and wi-fi, they “can move from space to space and hardware isn’t an inhibitor.” Some organisations “have been … expanding a whole range of tools from [their] internal social-media platform to crowd-sourcing …” Spaces come in all varieties, including meeting rooms, “hush” rooms, discussion pods, team tables, cafes, “floor hubs”, “touch-and-go area[s] for short stays”, even “funky kitchens”.

    And topping off the semblance of a white-collar wonderland, ABW adapted buildings often have glass lifts and “a central atrium allowing views to other floors”, so “you really do feel part of a bigger whole, you can see everybody.”

    Touted in near-utopian language, ABW unites the high-end circle of developers, architects, interior designers, building managers, real estate agents and progressive media. Most of all, we are assured, it’s about values, lifestyles and the coming generation, invariably presented as model progressives. According to a Colliers International report, Generation Y “prefer to work for an organisation with a commitment to social causes than one without … [i]n relation to the built environment, being green as an office occupier will become more of a ‘must have’ than a ‘nice to have’ in order to attract and retain staff.” Amongst other things, this means “creating less hierarchical workplaces, which facilitate collaboration, personal accountability and flexibility.”

    Such are the times, that if a business announced ABW-type reforms to improve its bottom line, raise productivity or increase returns to investors, it would be damned as a “slave to neo-liberal dogma”. But if the very same measures were dressed-up in the garb of “sustainability”, it would be showered with awards and accolades.

    Notwithstanding the pushy New Age rhetoric, ABW is more an economic-cum-technological opportunity for employers, than a revolt by the young and restless. Focus on costs is inevitable when economic conditions are so tight, and information and communications devices so ubiquitous and portable. A popular measure of office space efficiency is the workspace ratio, explains a researcher at Jones Lang Lasalle, or the number of square metres occupied by each office worker. The typical ratio is 15 square metres per person, but technology is freeing up workers to leave the office, so occupancy is typically now between 40 and 50 per cent, which translates, on average, to each worker occupying 37.5 square metres. “That’s expensive space”, he says.

    Other research found that in a traditional office, between 55 and 85 per cent of desks are not used at any given time. Yet other studies indicate that “trading off individual territory for shared areas” can reduce floor space requirements by 20 to 40 per cent. This all leads directly to the bottom line. By cutting the amounts paid for rent and outgoings, says a Colliers researcher, ABW could reduce a firm’s total cost by up to 30 per cent.

    That’s reason enough to drive large organisations out of their digs in Martin Place and the old office core, mostly for state-of-the-art towers designed to accommodate ABW floor-plans and facilities. “Macquarie Bank was an early mover (to Shelley Street), as was Westpac to its vertical campus in the western central business district”, report Jones Lang Lasalle on the major banks, and “[m]ore recently, the Commonwealth Bank has moved to Darling Quarter and ANZ will soon move to Pitt Street.” One way or another, the larger financial institutions, whose head-office functions were scattered throughout the CBD, have “implemented strategies to consolidate their space requirements and build in [ABW] flexibility.”

    This isn’t happening to satisfy worker demands for “sustainability”, but recourse to “green ethics” no doubt helped prise the sceptical from their desks.

    Green-star trek

    Nor have landlords failed to gain from the floor-space revolution. Large and institutional players like real estate investment trusts and fund managers profited from a wave of demand for innovative, capital-intensive building stock. More unexpectedly, they encountered a rising class of green-tinged activists, designers and architects, whose obsessions with energy-saving and natural power came in useful. As climate change crept up the political agenda, progressives across all tiers of government soon turned to the built environment, churning out laws and regulations that defined and mandated ‘green building’ standards. The property industry’s peak bodies embraced the concept.    

    This is somewhat paradoxical. Despite its obsession with all sorts of metrics, ratios and indices, the property sector doesn’t seem to care that the object of these standards is unmeasurable. Their effect on the global climate system can never be known (it was always fanciful to suggest that Australian building styles would affect the climate, but anyone who believes it after Copenhagen, Cancun, Durban and Rio is deluded).

    On the other hand, the financial benefits are rather more tangible. The key is NABERS, the National Australian Built Environment Rating System. Administered nationally by the New South Wales Office of Environment and Heritage, NABERS is a rating scale from a low of 1 to a high of 6 stars (the “Green Star”) applicable to buildings or tenancies, based on criteria like energy efficiency, water usage, waste management and indoor environment quality. The federal and some state governments have mandated at least a 4.5 star rating for public sector offices, and 4.5 has generally become the minimum for image-conscious corporates. A building or suite designed or refurbished for ABW will naturally score well.

    The Commonwealth Bank’s new campus-style headquarters at Darling Quarter is in the CBD’s “western corridor”, formerly a “zone in transition” near the disused docks and freight yards of Darling Harbour. It achieved a coveted 6 star rating. Coming up with two curved-roof buildings of six and eight stories, “the designers have emphasised the natural light, air quality and water recycling … with features including a full-height atrium, single-pass ventilation, blackwater recycling, trigeneration power and passive chill beam air-conditioning.” Westpac’s new campus further up the corridor at 275 Kent Street achieved 4 stars, and the three towers underway at Barangaroo, a futuristic, mixed-use precinct at the corridor’s northern end, meet 6 star specifications. ANZ’s new headquarters at 242 Pitt Street (161 Castlereagh), towering over the CBD’s “mid-town” south of the retail core, also aims for 6 stars.

    The most vaunted 6 star tower is the oval-shaped, “flagship” tower at 1 Bligh Street. Using 3D software called Building Information Modelling or BIM, the designers conceived an edifice with “gas and solar panels reduc[ing] electricity consumption by as much as 25 per cent, while water recycling reduces mains water by up to 90 per cent …” But its “principal sustainability feature is a fully glazed doubleskin façade made from clear glass panels … allow[ing] for automated sunshading that dramatically reduces the heat load on the building, which means [it needs] less airconditioning and can have … better natural light.” First-tier law firm Clayton Utz is the building’s anchor tenant.

    To the extent that creative designers, developers and landlords have combined to meet a demand in the market, these buildings are impressive enough. That’s how markets should work. But on the pretext of “sustainability”, activist politicians and officials have, effectively, codified the product and marketing strategies of the most powerful players. NABERS does that by granting official recognition to a system mirroring the star scale long used in the hotel industry. Overnight, hundreds of thousands of square metres of non-rated office space was downgraded. Rent-seeking opportunities for the owners of rated space proliferated, to the detriment of smaller, more marginal players, their tenants and peripheral regions. “While the NABERS rating of a building is not the sole factor for corporate tenants”, said a CBRE director, “it is playing a significant role in selecting suitable office space.”

    Clover Moore, whose jurisdiction covers capital-rich Sydney CBD and surrounds, has actively boosted the interests of large and institutional landlords with a grab-bag of lucrative benefits. There’s the CitySwitch Green Office program, which assists landlords leasing more than 2000 square metres of office space to achieve a mandatory NABERS rating; there are “green loans” for “sustainable retrofits” to be repaid as a levy on council rates; there’s a scheme under the Better Buildings Partnership that enables commercial property owners to enter Environmental Upgrade Agreements (EUAs) and share the cost of green building upgrades with tenants; and there are exemptions from a levy on new construction for green initiatives. 

    All in all, NABERS effects have proven a boon to the high-end property industry. Particularly for listed real estate investment trusts (REITs) and fund managers, but also many unlisted investors, which value stable capital growth as much as income, and continually trade or “recycle” assets to manage their portfolios. By allocating capital efficiently for market-oriented purposes, these investors can play a positive role in urban development, as long as green distortions (amongst others) don’t get in the way.

    An Australian Property Institute study at the end of 2011 found that office buildings with a 6 star NABERS rating enjoyed a premium in value of 12 per cent, those with a 5 star rating 9 per cent, those with 4.5 stars 3 per cent, and those with 3 stars 2 per cent. In May 2012, the IPD green property survey found that “prime office buildings with high NABERS ratings – from 4 stars to 6 stars – outperformed the broader prime office market over the past year … the greener buildings delivered an 11.3 per cent total return compared with the overall CBD office return of 10.8 per cent.” Further, buildings with a high NABERS rating “significantly outperformed assets as having a NABERS rating of 3.5 stars or less … better-rated assets delivered 11.8 per cent compared with 8.7 per cent for the lower-rated properties.”

    Capital growth conscious REITs and funds must have been pleased to hear, from a principal of the IPD Green Property Investment Index, that “owners who improve the sustainability attributes of their buildings are more likely to experience relatively stronger growth in capital values and will mitigate downside risk in asset values.” That’s a bonus for such local and global investors who have poured billions into the “safe haven” of Australian – especially Sydney – commercial real estate for other reasons, like the diminished standing of other asset classes, stock market volatility, a relatively sound economy, a reputable legal system and links to the booming Asia-Pacific region. Sydney was the world’s fourth most popular destination for cross-border property investment in the 18 months to June 2010, while the spreading use of NABERS culiminated in November 2011, when a rating became mandatory for space above 2000 square metres.   

    This is how a mayor can spend her life cultivating a progressive persona, only to end up the unwitting tool of some canny fund managers.

    Regressive recentralisation

    Green building is promising to be a goldmine for the well-placed, and a dead weight for almost everyone else. In an April 2012 Market Overview for Parramatta, a second-tier CBD servicing Sydney’s western region, Knight Frank explain that “the gap between economic rents and market rents remains a constraint on new [office] supply.” In other words the cost of land acquisition, planning and building processes, construction and fitting out, and a profit margin, on a square metre basis (economic rent) exceeds the rent obtainable from prospective tenants (market rent). Not all the gap between economic and market rents can be pinned on green standards, now essential for investor interest. But they are an undeniable factor. On one estimate, by consultants Davis Langdon, achievement of a 4 to 6 star NABERS rating can add between 3 and more than 11 per cent to construction costs.

    If supply constraints are serious in Parramatta, where the federal and NSW governments have relocated several agencies and departments, apparently they are acute in more suburban locations. According to a newspaper report in April 2011, “the trend across the Sydney metropolitan markets is falling [office] supply … this is evident across all key markets including North Sydney, St Leonards, Parramatta, North Ryde, Rhodes and Homebush … at present there is no speculative development across these suburbs, so the problem of reduced A-grade space will only increase during the next couple of years, putting pressure on rents and incentives.” The only speculative office block started at the time was at Norwest, says the report, a specialised business park in north-west Sydney. The building was designed for a 4.5 star NABERS rating.

    These weak conditions have various causes, but green standards shouldn’t be underestimated. Investors have lost interest in non-rated projects, and the economics of rated projects are trickier beyond high-rent centres like the CBD or business parks. According to a CBRE director, as of June 2011 there was “more capital looking to invest in the office sector than was evident before the global financial crisis … however, the majority of this capital is only chasing prime assets with very few groups willing to consider smaller secondary assets and non-central business locations.” For their part, more demanding tenants are also retreating to the green citadels and ABW theme-parks of Sydney CBD. Noting the CBD’s low office vacancy rate, Jones Lang Lasalle explain that “any downsizing that has occurred in the financial services sector has been offset by tenant centralisation … [a]s companies continue to look to improve the environment and amenity for staff as a means of attracting and retaining the best talent.” They detect a “trend to centralisation”.  Similarly, a Colliers director observed that “tenants were being driven out of metro markets by tight vacancy rates for quality space and are attracted by a greater ability to attract and retain staff if located in the CBD.”

    Phrases like “attract and retain staff”, of course, suggest NABERS rated buildings adapted for ABW. The portability of communications devices should be liberating workers from fixed locations, not just assigned desks. ABW advocates love phrases like “work is a thing you do not a place you go” and “work is becoming a process not a place”. But green imposts are having a countervailing effect.

    This withdrawal of capital and tenants is bound to choke-off a range of suburban and peripheral businesses, the small to medium sized service operators, start-ups, microbusinesses, consultants, franchisees and sole traders which rely on freely-available space and low rents.  

    To all but the greenest ideologues, it should be clear that the decentralisation of offices – as well as factories and warehouses – over recent decades has fuelled Sydney’s prosperity, enabling the city to absorb an extra 1.5 million people since the mid-1980s. Equally, it should be clear that decentralisation offers better outcomes on access to affordable housing, traffic congestion and employment dispersion. On average, peripheral Local Government Areas (LGAs) still experience higher unemployment rates than central LGAs. That’s why the centralising forces unleashed by green planning and building codes pose serious dangers to economic vitality across the greater metropolitan region. Plenty of attention has been lavished on the pampered few in their ABW playgrounds. Some should be spared for the vast majority who seek to make a life in Sydney.

    John Muscat is a co-editor of The New City, where this piece originally appeared. 

    Photo by Christopher Schoenbohm.