Category: Economics

  • A Most Undemocratic Recovery

    Unemployment over nine percent, the highest rate this far into a “recovery” in modern times, reflects only the surface of our problems. More troubling is that over six million American have been unemployed for more than six months, the largest number since the Census began tracking their numbers. The pool of “missing workers” – those neither employed nor counted as unemployed – has soared to over 4.4 million, according to the left-of-center Economic Policy Institute.

    Not surprisingly, working class and even educated middle class Americans have become increasingly pessimistic about their children’s ability to achieve their level of well-being.2 Average consumers are more pessimistic about their financial prospects that at any time for a quarter century.3 The failure of this “recovery” to reach the middle class is unprecedented in modern American history in its scope. The consequences – economic and political – could be profound.

    In sharp contrast, for the affluent few, things improved rapidly even before the recovery started. Large financial institutions, in particular, have been blessed with cheap money and implicit government guarantees for their survival; this has boosted the size, profits and wealth among the very sector most implicated in creating the great financial crisis. Top pay for CEOs of financial companies, including those bailed out by the taxpayers, is once again soaring.4 Stock prices have risen, mostly benefiting the top one percent, who own some forty percent of equities and sixty percent of financial securities.

    How did this very undemocratic scenario unfold? One explanation lies in the significant demographic, economic and geographic shifts within the Democratic Party, epitomized by Barack Obama.

    The Triumph of Gentry Liberalism
    From the beginning, Obama has been first and foremost a gentry candidate. Even in the Democratic primaries, his strongest base lay, outside of the African-American community, within college towns, affluent urban areas and the toniest suburbs. Unlike his predecessors Bill Clinton or Jimmy Carter, he never connected well with working class and middle class suburbs.

    The gentrification of the Democratic Party, of course, predates Obama. Starting in the 1970s, the party has focused more on the liberal social and green values of concern to the urban upper classes than the bread and butter issues of middle or working class voters.

    For financial support, Obama and his Party have become increasingly close to Wall Street. Hedge fund managers have done very, very well under Obama; the top 22 managers in 2010 earned a remarkable $25 billion. Overall in 2010, Wall Street compensation hit a new record of $135 billion. And despite the fact that some hedge fund and bank executives have recoiled at the President’s occasional public chastisement, the financial community and the Republican Party, as the American Prospect recently noted, are the ones “drifting apart.” One source of division lies with the Tea Party movement that, along with its radical fringes, reflects a genuine grassroots middle class disdain for the financial hegemons and their political allies.

    This does not necessarily apply to many Republicans who may play up to Tea Party populist sentiments but in practice favor policies – for example in terms of financial legislation and taxation – that favor financial hegemons and large corporations. As you speak to business groups around the country, particularly in small and mid-sized cities, one senses little more enthusiasm for corporatist Republicans than for their Democratic counterparts.

    Obama’s gentry liberalism is no less corporate and tailored to the powerful than that of the Republicans but differs in what constitutes its economic and political base. President Obama’s other key pillars of support include “new economy” centers as Silicon Valley, Hollywood and the heavily subsidized “green” industrial complex. From the beginning, “green jobs” have been one of the linchpins of the Administration’s job creation strategy and arguably one of its biggest disappointments. Heavily dependent on government mandates and subsidies, the growth trajectory of solar, wind and battery companies, at least in the near term, remains dubious, particularly against even more lavishly subsidized foreign competition.

    At the same time, the Administration has been almost unfailingly hostile to the green-industrial complex’s greatest nightmare, the orderly development of the nation’s prodigious oil and gas resources. This has occurred despite rising fossil fuel prices, expanded off-shore drilling in ascendant countries such as Brazil, and the fact that the country continues to burn a dirtier fuel – coal – while buying much of its oil from other nations.

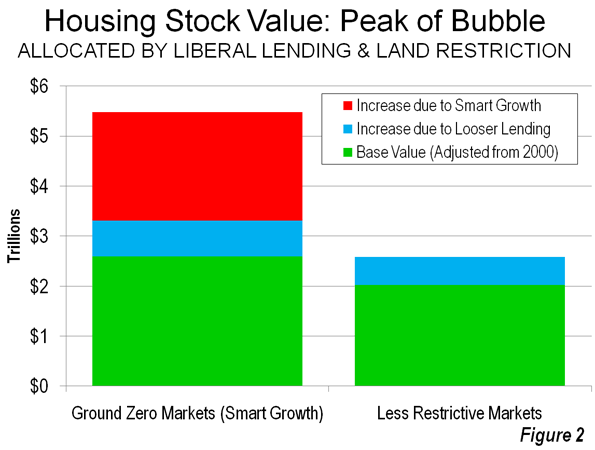
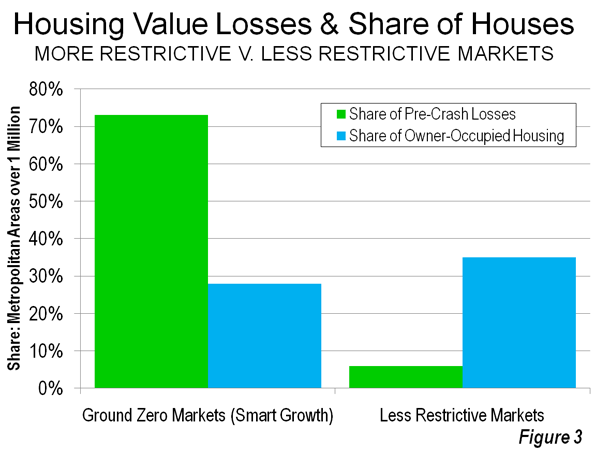
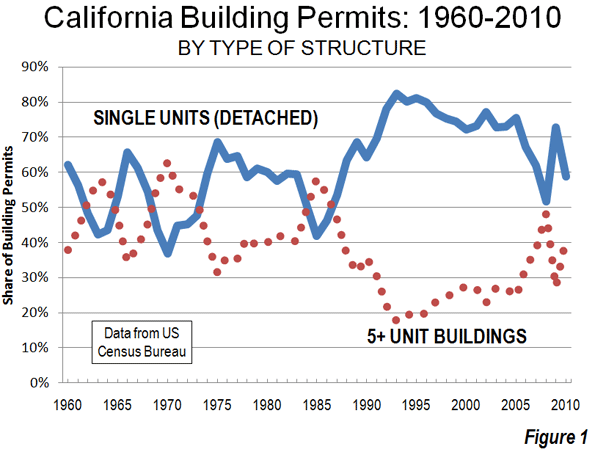
    The Administration’s green tilt also infects its urban policy. The dogged emphasis on expensive programs like high-speed rail and support for “smart growth” initiatives around the country reveal a cultural mindset that rejects the fundamental aspirations of a vast majority of Americans to own their homes in low-density neighborhoods.

    Here is the ultimate political irony of the Obama era and gentry liberalism: the metropolitan areas most passionately committed to the progressive agenda – which have adopted them on the state and local level – also tend to be those with the highest rates of inequality and the deepest poverty. Indeed, if cost of living is included, most of the urban counties with the highest percentage of poor people are located in the very bluest areas of New York, California or Washington, D.C., which together account for five of the nation’s ten poorest counties. As a state, California, once a prototype for democratic capitalism, now suffers the worst income inequality in the country.

    This is also the case in New York, the other anchor of the Obama economy. Wall Street – the beneficiary of Administration fiscal and monetary policies – is booming, but as the Fiscal Policy Institute notes, the poorest 50 percent claimed barely 8 percent of the city’s income while a shrinking middle class just about 34 percent. Overall, Gotham has become, as The Nation recently noted, “the most unequal large city in America.”

    In contrast to much of the country, government centers, notably Washington and its suburbs, are flourishing. Five of the richest counties in the country are located in the belt around the nation’s capital. The region is also the only one in the nation seeing real estate price gains.

    If you believe some pundits, California, New York and Washington, D.C. represent progress due to the enlightened social and environmental rhetoric espoused by the media, academics and politicians based in these regions. But in reality this new ruling class seems likely to create an American future that looks a lot like today’s Great Britain, with a significant affluent population concentrated in core cities and some affluent suburbs that lives an exciting life at the top of the world economy, surrounded by a large underclass and a fading middle class.

    Learning from the New Deal
    The gentry liberalism that has triumphed in the Obama era differs radically from its New Deal forbearers. For one thing, many places closest to Obama are themselves almost “failed states,” including the President’s nearly-insolvent home state of Illinois. In contrast, the New Deal was forged by a New York that was at the time a leader in economic growth, infrastructure development and social democracy. In the 1920s and 1930s, small entrepreneurs and skilled craftsmen, office workers and the unskilled flocked to New York. Today those same populations are deserting the Obama bastions in huge numbers for places, notably Texas, that embrace a very different political philosophy.

    Unlike the urban-centered Obama, Roosevelt also focused heavily on the nation’s less developed regions. Indeed, the Hudson Valley gentleman farmer had among his stated goals “to make the country in every way as desirable as city life…” The New Deal great hydro-electric plants, for example, literally brought light to large areas that had barely emerged from semi-feudalism, particularly in the South.

    Instead of narrowing his base, Roosevelt’s policies expanded the Democratic Party’s sway from cities to many rural areas which historically might have opposed a progressive agenda. Similarly his successors – notably Truman, Johnson and Clinton – embraced suburbanization as means to assure upward mobility and reduce the overcrowding and unhealthy living conditions associated with cities. To be sure, sometimes bipartisan enthusiasm sparked a surplus of unwise credits to boost homeownership, but at least the party embraced the lifestyle aspirations of Americans, as opposed to seeking to transform them to an urbanist model.

    These approaches must be changed if the Administration and their allies want to create the basis for, as they often claim, a long-term progressive era. Here again the New Deal model could be helpful. One idea, particularly in an era of long-term persistent unemployment, would be to revive the Work Progress Administration (WPA), which along with the Civilian Conservation Corps, which employed roughly three million of the unemployed during the height of the Depression. To be effective, and worth it to the public, a new WPA should concentrate on such things as the expansion of ports, roads, electrical transmission lines and other critical elements needed to revive American industry.

    Most future growth would come from the private sector, but one has to ask what kind of industries should be fostered. Do we really need to spend money for more post-modernist English professors and lawyers, or to lend billions to investment bankers? Perhaps policies should be redirected instead towards bolstering those “basic industries” – notably agriculture, energy and manufacturing – that since the beginning of the Administration have received, at best, mixed signals.

    This approach would counter the fashion, common among both techno-libertarians and “creative class” enthusiasts, asserting that the country’s future can be assured by hip startups, software companies and videogame producers alone. As Intel co-founder Andy Grove has noted, we cannot rebuild our job base just with sexy start-ups; we need to also “scale up” our emerging companies, the very thing that made Silicon Valley and its counterparts across the country such prodigious opportunity regions in the past.

    Rather than being excoriated, for example, the oil and natural gas industries need, with improved regulation, to expand at a time of growing global demand and rising prices. Farmers, notably in the West, have been greeted with pronouncements by senior Interior Department officials about the end of dam-building, a critical source of water, at a time of generally rising demand and prices.

    Manufacturers, particularly smaller ones, have been hard-pressed by regulatory reform when their competitors elsewhere are dialing into the developing country market. There is a pervasive sense that the Administration favors only large and well-connected crony firms, such as General Electric (which paid no taxes last year) and the kinds of green start-ups backed by John Bryson, who has been selected to be Obama’s next Commerce Secretary.

    The well-connected sections of the investment community may well howl at such changes, but ultimately the future of our financial industry depends upon the health of the America’s productive sectors. Without a strong US economy at its back, in the long-term, Wall Street will become ever weaker in its growing competition with London, Frankfurt, Singapore, Shanghai and Hong Kong.

    Ultimately, the only progressive agenda that can work – from the environment to healthcare to education – rests on the foundation of widely dispersed economic growth, not upon policies that favor a few influential sectors at the expense of everyone else.

    This piece was originally published by The New America Foundation Economic Growth Program Decent Jobs Forum.

    Joel Kotkin is executive editor of NewGeography.com and is a distinguished presidential fellow in urban futures at Chapman University, and an adjunct fellow of the Legatum Institute in London. He is author of The City: A Global History. His newest book is The Next Hundred Million: America in 2050, released in February, 2010.

    FDR fireside chat statue photo by Tony the Misfit

  • America’s Burgeoning Class War Could Spell Opportunity For GOP

    Last week’s disappointing job reports, with unemployment rising above 9%, only reinforced an emerging reality that few politicians, in either party, are ready to address. American society is becoming feudalized, with increasingly impregnable walls between the classes. This is ironic for a nation largely defined by its opportunity for upward mobility and fluid class structure.

    According to the latest data, the current unemployment rate is the highest it has been so deep into a recovery since the 1940s.  Even more troubling, over 6 million Americans have been unemployed for more than six months — the largest number since the feds have begun tracking this number decades ago.

    That’s not the worst of it.  The pool of “missing workers” — those who are unemployed but are not counted as such — has soared to over 4.4 million. And under the first African-American president the employment rate for black men now sits at a record low since the government started measuring the statistic four decades ago.

    This recovery has been particularly parlous to the middle class, of all races. Despite the massive stimulus, small businesses — the traditional engines of job growth and upward mobility — have barely gotten off the matt. Indeed, according to a recent National Federation of Independent Business survey, they are now more likely to reduce payrolls than expand them.

    Many blue-collar and middle-class Americans are becoming increasingly pessimistic about the future and their children’s chances for achieving their level of well-being. Middle-age college graduates, who supported Obama previously, increasingly have shifted from the administration.  Even the young seem to have lost their once fervent enthusiasm. After all, they are seeing their prospects dim dramatically.

    Overall disapproval of President Obama’s economic policies now stands at 57% and will likely grow due to the latest job numbers.  And while the middle and working classes have seen their prospects worsen, the very rich have enjoyed a huge boom.

    Of course, no one in a capitalist country should begrudge the earned wealth of the rich.  But there must be some sense that the prospect of greater prosperity extends beyond the privileged. The policies of Fed chief Ben Bernanke and Treasury Secretary Tim Geithner have done little for the small businesses on Main Street while enriching the owners and managers of financial companies by showering them with cheap money and implicit government guarantees for their survival. Top pay for CEOs of financial companies, including those bailed out by the taxpayers, has soared.  The rise in stock prices has benefited the wealthiest 1% of the population, which owns some 40% of equities and 60% of financial securities.

    The consequences will be profound — socially and politically.  For one thing, the president, despite his occasional barbs against “the rich,” has turned out something of a faux populist. If a George Bush recovery was as bad as this one, we would never hear the end of it from the “progressives” who still cling to Obama.

    Of course, not all the blame belongs to the White House. The formerly Democrat-controlled Congress largely ignored the middle class’ concerns over the economy and jobs. Instead they focused on health care — which, according to the Pew Foundation survey, ranks as only a middling concern among voters — and climate change, which ranked dead last among the top 20 issues for the electorate.

    Even with the Main Street economy grasping for air, Congress chose to impose new regulations and taxes on the entrepreneurial class. Meanwhile Washington has given huge government support to often marginal green ventures such as Tesla, which is building $80,000 plus electric cars. Such assistance was not extended to the struggling garment-maker or semiconductor plant forced to compete globally largely on their own.

    Of course Democrats resort to stirring up class resentments, but their credibility is thin. After all it’s New York Sen. Charles Schumer, not some fat-cat Republican, who remains the financial industry’s designated hitter on the Hill. Instead of chastising the big financial institutions, the administration has largely coddled them. Despite the obvious abuses behind the financial crisis, there have been virtually no prosecutions against what Theodore Roosevelt once identified as “the malefactors of great wealth.”

    This has created a class divide large enough to propel a Republican sweep next year. Some Republicans, like former Bush aide Ryan Streeter, understand this opportunity. Streeter argues for the GOP to become more economically populist approach.  He calls for an “aspiration agenda” based on policies to spark private sector economic growth and a wide range of entrepreneurial ventures. To succeed, the GOP needs a viable alternative to middle and working class voters who are losing faith in Obama-style crony capitalism but who do not want to replace it with policies focused on enhancing the bottom-lines of the top 1% of the population.

    Yet at a time when people are worried primarily about paying their bills and prospects for their children, many Republicans seem determined to campaign on social fundamentalism, something that is already distressingly evident in the Iowa primary race. This may have worked in the past, in generally more prosperous times. Right now what sane person thinks gay marriage is the biggest issue facing the nation?

    Neither right-wing ideology nor mindless support for corporate needs constitute a winning strategy in a nation plagued by a sense that the system works only for the rich and well-connected.  Only by focusing on working and middle class concerns can the GOP permanently separate the people from the party which pretends to represent them.

    This piece originally appeared at Forbes.com.

    Joel Kotkin is executive editor of NewGeography.com and is a distinguished presidential fellow in urban futures at Chapman University, and an adjunct fellow of the Legatum Institute in London. He is author of The City: A Global History. His newest book is The Next Hundred Million: America in 2050, released in February, 2010.

    Official White House Photo by Pete Souza

  • A Guide to China’s Rising Urban Areas

    From a Rural to Urban Dispersion in the Middle Kingdom

    China’s rise to economic prominence over the past 30 years has rested in large part to its rapid    urbanization. Prior to ‘reform and opening up’ that started in earnest during the 1970s, cities in China were viewed as pariahs by the party leadership. Millions of young urban dwellers were forced into the countryside to labor on farming communes during the Cultural Revolution. In stark contrast, today millions of rural migrants make their way to the city.

    The scale at which this is happening is unprecedented. Currently, there are 85 metropolitan areas in China with more than 1 million people, compared to 51 in the US. By 2015, urban regions will account for half of China’s population and by 2025, the urban population’s share should reach about 75%.

    To date, international attention has remained fixated on China’s largest cities of Beijing and Shanghai (and to a lesser extent, Guangzhou and Shenzhen). This is not without good reason, as Beijing and Shanghai are not only the respective government and financial centers of mainland China, but both were host to two of the most visible world events of the past decade: the 2008 Summer Olympics and the recently concluded World Expo.

    Second and Third-Tier Cities Enter Onto the World Stage

    Increasingly, however, the real trajectory of urban growth is shifting to China’s so-called ‘second-tier’ and ‘third-tier’ cities. To the outside observer, China’s lesser-known cities might seem all too similar to one another given the monotonous aesthetic of their newly constructed cityscapes. Indeed, the newfound appearance of Chinese cities is a point of contention among local urban development scholars who are concerned about the converging ‘identical faces’ of these urban areas.

    Yet to Chinese locals and foreigners who have spent some time living here, it Chinese cities are defined more by their local cuisine, dialect, history, geography, culture and climate rather than their architectural character. These often-overlooked nuances of local culture are much more essential to the identity of these cities than buildings. In the future, these distinctions may prove more effective in attracting investment and talent than flashy new construction projects.

    Here’s a short guide to these rising urban areas by region and their current identities and prospects.

    TOP 20 URBAN AREAS IN CHINA: 2010 ESTIMATES
    Rank
    Urban Area
    2010
    Area: SqMi
    Density
    Area: SqKM
    Density
    Base Year
    Base Year Pop.
    1 Shanghai, SHG 18,400,000 1,125 16,400 2,914 6,300 2010 18,400,000
    2 Shenzhen, GD 14,470,000 550 25,900 1,425 10,000 2008 14,000,000
    3 Beijing, BJ 13,955,000 1,275 10,800 3,302 4,200 2008 13,545,000
    4 Guangzhou-Foshan, GD 13,245,000 760 17,000 1,968 6,600 2007 12,600,000
    5 Dongguan, GD 10,525,000 535 19,200 1,386 7,400 2007 10,000,000
    6 Tianjin, TJ 6,675,000 500 13,100 1,295 5,000 2007 6,400,000
    7 Chongqing, CQ 5,460,000 280 19,100 725 7,400 2007 5,240,000
    8 Hangzhou, ZJ 5,305,000 250 20,600 648 8,000 2007 5,015,000
    9 Wuhan, HUB 5,260,000 275 18,700 712 7,200 2007 5,040,000
    10 Shenyang, LN 5,160,000 280 18,100 725 7,000 2007 4,950,000
    11 Chengdu, SC 4,785,000 220 21,300 570 8,200 2007 4,585,000
    12 Xi’an, SAA 3,955,000 205 18,900 531 7,300 2007 3,785,000
    13 Harbin, HL 3,615,000 235 15,100 609 5,800 2007 3,460,000
    14 Suzhou, JS 3,605,000 245 14,300 635 5,500 2007 3,400,000
    15 Nanjing, JS 3,550,000 330 10,500 855 4,100 2007 3,400,000
    16 Dalian, LN 3,255,000 270 11,800 699 4,500 2007 3,105,000
    17 Changchun, JL 3,170,000 145 21,300 376 8,200 2007 3,010,000
    18 Kunming, YN 3,070,000 130 23,100 337 8,900 2007 2,925,000
    19 Wuxi, JS 2,925,000 150 19,000 389 7,300 2007 2,760,000
    20 Taiyuan, SAX 2,900,000 120 23,600 311 9,100 2007 2,755,000
    Source: Demographia World Urban Areas: Population & Projections: 6th Edition. http://demographia.com/db-worldua.pdf


    The Interior Rises

    Chengdu (成都): It was the devastating 2008 Wenchuan Earthquake that first out Chengdu onto the international radar, but it’s the rapid expansion of its massive high tech sector that may define its long term prospects.  The aerospace industry also plays an important role in the capital city of Sichuan Province as it is the site of the development of China’s first stealth fighter, the Chengdu J-20. Despite all the new development, Chengdu remains a pleasant city, known for pandas and spicy food as well as its generally relaxed and agreeable disposition. The local government has done a good job of promoting ‘quality of life’ and relatively low cost of living to attract both investment dollars and skilled labor away from the prohibitively expensive eastern metropolises.

    Chongqing (重庆): Also known for spicy food, this municipality, which falls under direct control of the central government, is bisected by the Yangtze River. Its urban vista is unique, with deep gorges. It long has been known as a rough and tumble place, long plagued by organized crime. This has abated under the leadership of Communist Party Secretary Bo Xilai who has waged a war against organized crime in Chongqing since assuming office there in 2007. Though a controversial leader with a penchant for strong “red” leanings, the ambitious Bo has been applauded for cleaning up the city and implementing a large-scale public housing program.

    Kunming (昆明): The city of Eternal Spring and the capital of China’s ethnically diverse southern Yunnan Province, Kunming claims the best weather in the country. As such, Kunming’s residents would rather enjoy the sunshine then spend their days indoors working in factories. The lack of industrial production doesn’t mean this city isn’t important- as Kunming has China’s 6th busiest airport and is the country’s gateway to Southeast Asia. If China goes forward with its ambitious plans to link itself with Southeast Asia via high-speed rail, Kunming could enhance its status an international transportation node.

    Wuhan (武汉): Wuhan, capital of Hubei Province, is an important rail and river transport hub at China’s central crossroads. Known for its unbearably hot summers, Wuhan sits on the Yangtze River a few hundred kilometers downstream from the infamous Three Gorges Dam. The city is China’s center for the optical-electronic industry, with a focus on the production of fiber-optics. It was also recently announced that Wuhan will get China’s third tallest building, the 606 meter Greenland Center.

    Xi’an (西安): Once known as Chang’an (‘eternal peace’), Xi’an was the capital of multiple Chinese dynasties throughout history. It remains as one of the most popular international tourist destinations in China thanks to its world-renowned Terracotta Warriors. But today this ancient city and present day capital of Shaanxi Province is also positioning itself as a hub for the development of the software and aerospace industries. The city is also host to several reputable universities, which could help supply a strong local talent pool.


    Yangtze River Delta (Greater Shanghai)

    Hangzhou (杭州): Arguably China’s most naturally beautiful large city, Hangzhou is famous for its scenic Xihu or ‘West Lake’, which just became a UNESCO Heritage Site. The capital of Zhejiang Province not only attracts tourists, but investment as well, especially in the light manufacturing and textile industries. Already somewhat of a ‘bedroom community’ for Shanghai’s wealthy, The recently inaugurated Shanghai-Hangzhou high-speed rail line, which has cut travel time down to 45 minutes between the two cities, means that Hangzhou stands to further benefit from this connection.

    Nanjing (南京): One of the ‘Four Great Ancient Capitals of China’, the capital of prosperous Jiangsu province is today a bustling modern metropolis. Located on the Yangtze River, Nanjing has greatly benefitted its location within the greater Yangtze River Delta Region. The city’s close proximity to Shanghai means that is has absorbed some spillover from investors looking for a lower-cost alternative. Nanjing is also home to one of China’s tallest towers, the newly opened Nanjing Greenland Tower and Asia’s largest railway station.

    Suzhou (苏州): Situated in Jiangsu Province en route from Shanghai and Nanjing, Suzhou is strategically located in the center of a booming region. Often referred to as the ‘Venice of the East’, the city is famous for its historic canals and classic Chinese gardens. In addition to being a popular tourist destination Suzhou is an emerging hi-tech center. The China-Singapore Suzhou Industrial Park, the largest strategic partnership between the two governments, has been established in the city.

    Wuxi (无锡): Only 50 km from Suzhou, Wuxi straddles the north shores of Lake Taihu. With 3,000 years of history, Wuxi is today one of China’s most business friendly cities. Wuxi is particularly attractive to Japanese businesses, with companies like Sony, Nikon, and Konica Minolta owning manufacturing and assembling facilities in the city’s New District. The city’s relatively new airport, which opened in 2004, serves the city as well as neighboring Suzhou.


    The Industrial North: China’s Rustbelt

    Changchun (长春): Changchun was the last capital of Manchuria and the seat of Japan’s ‘Puppet Government’ during their occupation of the region during WWII. Today the capital of China’s northern Jilin Province stands as “China’s Detroit” as the country’s largest automobile producer.The Changchun Automotive Economic Trade and Development Zone is home to the country’s biggest wholesaler of used cars, automotive spare parts and tires.

    Dalian (大连): Consistently ranked as one of the ‘most livable’ of China’s big cities, Dalian sits strategically on the Liaodong Peninsula making it the principle seaport for the country’s northeast (‘DongBei’) region. Banking and IT is big here, with semiconductor giant Intel just having recently opened a $2.5 billion manufacturing facility in the city. The Dalian Commodity Exchange, highlighted by the trading of soybean contracts, is China’s largest futures exchange. Bo Xilai also left his mark on the city when he was Mayor before heading to Chongqing by initiating a campaign to add significant green space to the city.

    Harbin (哈尔滨): The capital of Heilongjiang province, Harbin is the country’s northernmost big city. Famous for its local beer and annual winter ice sculpture festival, Harbin is China’s gateway to neighboring and resource-rich Russia. Russian culture has also left its mark on the city, influencing everything from the local cuisine to the architecture. Today Harbin’s economy is focused on textiles and power equipment manufacturing.

    Shenyang (沈阳): Shenyang, the capital of Liaoning province, is the largest city in China’s northeast. Once the capital of the Manchurian Empire during the 17th Century, Shenyang is today an industrial powerhouse producing industrial equipment,  construction vehicles, power tools, and biomedical equipment. Shenyang is also a hub for agriculture and the production of foodstuffs.

    Taiyuan (太原): The capital of coal producing Shanxi province, Taiyuan is moving up on China’s urban radar. The city serves as the administrative center for both Chinese state-owned and foreign enterprises involved in the coal mining business. The city is also home to the Taiyuan Steel and Iron Company, China’s largest producer of stainless steel. Unfortunately, due to the heavy industrial activity in the region, Taiyuan is also one of the country’s most polluted cities.

    Tianjin (天津): Long ridiculed by Beijingers, Tianjin is ambitiously positioning itself as a financial and sea logistics center for northern China. One of China’s four direct-controlled municipalities, Tianjin is less than 30 minutes from nation’s capital by high-speed train yet still has a distinct dialect and culture. The city is divided into two distinct parts: the charming historic city center, which retains colonial buildings from 19th Century foreign concessions, and the Binhai New Area, an up-and-coming Special Economic Zone next to the Bohai Sea. Tianjin is also aiming to become the center of China’s burgeoning biotech industry.


    The Outlier

    Dongguan (东莞): As the fifth largest city in China by population, Dongguan should register more prominently on the international radar. Unfortunately the most defining characteristic about this urban amalgam is its lack of character. A sprawling unplanned mass of factories in the Pearl River Delta situated between Shenzhen and Guangzhou, Dongguan is the largest city in the world without an airport. As the Pearl River Delta de-industrializes as more factories move into the lower-cost inland regions of China, Dongguan will need to reinvent itself.

    Adam Nathaniel Mayer is an American architectural design professional currently living in China. In addition to his job designing buildings he writes the China Urban Development Blog.

    Photos: Chengdu and Chongqing photos by author. All other photos by Wendell Cox.

  • The Costs of Smart Growth Revisited: A 40 Year Perspective

    “Soaring” land and house prices “certainly represent the biggest single failure” of smart growth, which has contributed to an increase in prices that is unprecedented in history. This  finding could well have been from our new The Housing Crash and Smart Growth, but this observation was made by one of the world’s leading urbanologists, Sir Peter Hall, in a classic work 40 years ago. Hall led an evaluation of the effects of the British Town and Country Planning Act of 1947 (The Containment of Urban England) between 1966 and 1971. The principal purpose of the Act had been urban containment, using the land rationing strategies of today’s smart growth, such as urban growth boundaries and comprehensive plans that forbid development on large swaths of land that would otherwise be developable.

    The Economics of Urban Containment (Smart Growth): The findings of Hall and his colleagues were echoed later by a Labour Government report in the mid-2000s which showed housing affordability had suffered under this planning regime. Author Kate Barker was a member of the Monetary Policy Committee of the Bank of England, which like America’s Federal Reserve Board, is in charge of monetary policy. Among other things, the Barker Reports on housing and land use found that urban containment had driven the price of land with "planning permission" to many multiples (per acre) above that of comparable land where planning was prohibited. Under normal circumstances comparable land would have similar value.

    Whether coming from the left or right, economists have demonstrated that prices tend to rise when supply is restricted, all things being equal.  Certainly there can be no other reason for the price differentials virtually across the street that occur in smart growth areas. Dr. Arthur Grimes, Chairman of the Board of New Zealand’s central bank (the Reserve Bank of New Zealand), found the differential on either side of Auckland’s urban growth boundary at 10 times, while we found an 11 times difference in Portland across the urban growth boundary. 

    House Prices in America: The Historical Norm: Since World War II, median house prices in US metropolitan areas have generally been between 2.0 and 3.0 times median household incomes (a measure called the Median Multiple). This included California until 1970 (Figure 1). After that, housing became unaffordable in California, averaging nearly 1.5 times that of the rest of the nation during the 1980s and 1990s (adjusted for incomes). Even after the huge price declines from the peak of the bubble, house prices remain artificially high in Los Angeles, San Francisco, San Diego and San Jose, with median multiples of six or higher.

    William Fischel of Dartmouth University examined a variety of justifications for the disproportionate rise of California housing prices and dismissed all but more restrictive land use regulation. He noted that "growth controls (restrictive land use regulations) have the undesirable effect of raising housing prices." Throughout the rest of the nation, more restrictive land use regulations have been present in every market where house prices rose substantially above the historic Median Multiple norm, even during the housing bubble. No market without smart growth has ever reached these heights.

    Setting Up for the Fall: Excessive Cost Increases in Smart Growth Markets: The Housing Crash and Smart Growth, published by the National Center for Policy Analysis, examined the causes of house price increase during the housing bubble. The analysis included all metropolitan areas with more than 1,000,000 population. It focused on 11 metropolitan areas in which the greatest cost increases occurred (the "ground zero" markets), comparing them to cost increases in the 22 metropolitan areas with less restrictive land use regulation (Note 1).

    • Less Restrictively Regulated Markets: In the less restrictively regulated markets, the value of the housing stock rose approximately $560 billion, or 28 percent from 2000 to the peak of the bubble (Note 2). In nearly all of these markets, the Median Multiple remained within the historical range of 2.0 to 3.0 and none approached the high Median Multiples that occurred in the "ground zero" markets.
    • Ground Zero Markets The value of the housing stock rose $2.9 trillion from 2000 to the peak of the bubble in the "ground zero" markets, all of which have significant land use restrictions (Note 3). The 112 percent increase in the "ground zero" markets was four times that of the less restrictively regulated markets. The Median Multiple rose to unprecedented levels in each of the "ground zero" markets, peaking at from 5.0 to more than 11.0, four times the historic norm.

    The 28 percent increase in relative house value that occurred in the less restrictively regulated markets (those without smart growth) is attributed to the influence of loosened lending standards. The excess above 28 percent, which amounts to $2.2 in the "ground zero" markets is attributed to to the supply restricting strategies of smart growth (Figure 2).

    The Fall: Smart Growth Losses

    The largest house price drops occurred in the markets that had experienced the greatest cost escalation, both because prices were artificially higher but also because prices in smart growth markets are more volatile.  The "ground zero" markets, with only 28 percent of the owner occupied housing stock, accounted for 73 percent of the pre-crash losses ($1.8 trillion). Thus, much of the cause of the housing crash, which most analysts date from the Lehman Brothers bankruptcy (September 15, 2008), can be attributed to these 11 metropolitan areas.

    By contrast, the 22 less restrictively regulated markets accounted for only six percent ($0.16 trillion) of the pre-crash losses. These 22 markets represented 35 percent of the owned housing stock (Figure 3).

    If the losses in the ground zero markets had been limited to the rate in the less restrictively regulated markets (the estimated impact of cheap credit), losses would have been $1.6 trillion less (Note 4). The Great Recession might not have been so "Great."

    Economic Denial and Acknowledgement: In his writing forty years ago, Dr. Hall noted that English planners denied the connection between the unprecedented house price increases and urban containment. This same denial also informs smart growth advocates today. This is perhaps to be expected, because, as Hall noted 40 years ago, an understanding of the longer term consequences would have undermined support for these policies.

    To their credit, some advocates recognize that smart growth raises house prices. The Costs of Sprawl – 2000¸ a volume largely sympathetic to smart growth, also indicates that urban containment strategies can raise housing prices. The only question is how much smart growth raises house prices. The presence of urban containment policy is the distinguishing characteristic of metropolitan markets where prices have escalated well beyond the historic norm.

    The Social Costs of Smart Growth: Moreover, the social impacts of smart growth are by no means equitable. Peter Hall says that the "less affluent house-owner … has paid the greatest price for (urban) containment" (Note 5). He continues: "there can be little doubt about the identity of the group that has got the poorest bargain. It is the really depressed class in the housing market: the poorer members of the privately-rented housing sector." Finally, Hall laments as well the impact of these policies on the "ideal of a property owning democracy."

    Hall’s four decades old concern strikes a chord on this side of the Atlantic. Just last week, a New York Times/CBS News poll found that nine out of ten respondents associated home property ownership with the American Dream. Planning needs to facilitate people’s preferences, not get in their way.

    ——–

    Note 1: The housing stock value uses a 2000 base, which adjusts house prices based upon the change in household incomes to the peak.

    Note 2: The underlying demand for housing was substantial in some of the less restrictively markets, which is illustrated by the strong net domestic migration to metropolitan areas such as Atlanta, Austin, Dallas – Fort Worth, Houston, Raleigh and San Antonio. At the same time, some more restrictive markets (smart growth) that hit historically experienced strong demand were experiencing huge domestic outmigration, indicating little in underlying demand. This includes Los Angeles, San Francisco, San Diego and San Jose. Demand, however is driven upward in more restrictively metropolitan areas by speculation which, according to the Federal Reserve Bank of Dallas is attracted by supply constraints.

    Note 3: The 11 "ground zero" metropolitan markets were Los Angeles, San Francisco, San Diego, San Jose, Sacramento, Riverside-San Bernardino, Las Vegas, Phoenix, Tampa-St. Petersburg, Miami and the Washington, DC area.

    Note 4: The pre-crash losses in the 18 other restrictively regulated markets were $0.5 trillion. These markets accounted for 37 percent of owner occupied housing in the metropolitan areas of more than 1,000,000 population, compared to 35 percent in the less restrictively regulated markets, yet had losses three times as high.

    Note 5: The Containment of Urban England also indicates that new house sizes have been forced downward by the planning regulations (see photo at the top of the article).

    Photograph: New, smaller exurban housing in the London area (by author)

    Wendell Cox is a Visiting Professor, Conservatoire National des Arts et Metiers, Paris and the author of “War on the Dream: How Anti-Sprawl Policy Threatens the Quality of Life

  • The Next Boom Towns In The U.S.

    What cities are best positioned to grow and prosper in the coming decade?

    To determine the next boom towns in the U.S., with the help of Mark Schill at the Praxis Strategy Group, we took the 52 largest metro areas in the country (those with populations exceeding 1 million) and ranked them based on various data indicating past, present and future vitality.

    We started with job growth, not only looking at performance over the past decade but also focusing on growth in the past two years, to account for the possible long-term effects of the Great Recession. That accounted for roughly one-third of the score.  The other two-thirds were made up of a a broad range of demographic factors, all weighted equally. These included rates of family formation (percentage growth in children 5-17), growth in educated migration, population growth and, finally, a broad measurement of attractiveness to immigrants — as places to settle, make money and start businesses.

    We focused on these demographic factors because college-educated migrants (who also tend to be under 30), new families and immigrants will be critical in shaping the future.  Areas that are rapidly losing young families and low rates of migration among educated migrants are the American equivalents of rapidly aging countries like Japan; those with more sprightly demographics are akin to up and coming countries such as Vietnam.

    Many of our top performers are not surprising. No. 1 Austin, Texas, and No. 2 Raleigh, N.C., have it all demographically: high rates of immigration and migration of educated workers and healthy increases in population and number of children. They are also economic superstars, with job-creation records among the best in the nation.

    Perhaps less expected is the No. 3 ranking for Nashville, Tenn. The country music capital, with its low housing prices and pro-business environment, has experienced rapid growth in educated migrants, where it ranks an impressive fourth in terms of percentage growth. New ethnic groups, such as Latinos and Asians, have doubled in size over the past decade.

    Two advantages Nashville and other rising Southern cities like No. 8 Charlotte, N.C., possess are a mild climate and smaller scale. Even with population growth, they do not suffer the persistent transportation bottlenecks that strangle the older growth hubs. At the same time, these cities are building the infrastructure — roads, cultural institutions and airports — critical to future growth. Charlotte’s bustling airport may never be as big as Atlanta’s Hartsfield, but it serves both major national and international routes.

    Of course, Texas metropolitan areas feature prominently on our list of future boom towns, including No. 4 San Antonio, No. 5 Houston and No. 7 Dallas, which over the past years boasted the biggest jump in new jobs, over 83,000. Aided by relatively low housing prices and buoyant economies, these Lone Star cities have become major hubs for jobs and families.

    And there’s more growth to come. With its strategically located airport, Dallas is emerging as the ideal place for corporate relocations. And Houston, with its burgeoning port and dominance of the world energy business, seems destined to become ever more influential in the coming decade. Both cities have emerged as major immigrant hubs, attracting on newcomers at a rate far higher than old immigrant hubs like Chicago, Boston and Seattle.

    The three other regions in our top 10 represent radically different kinds of places. The Washington, D.C., area (No. 6) sprawls from the District of Columbia through parts of Virginia, Maryland and West Virginia. Its great competitive advantage lies in proximity to the federal government, which has helped it enjoy an almost shockingly   ”good recession,” with continuing job growth, including in high-wage science- and technology-related fields, and an improving real estate market.

    Our other two top ten, No. 9 Phoenix, Ariz., and No. 10 Orlando, Fla., have not done well in the recession, but both still have more jobs now than in 2000. Their demographics remain surprisingly robust. Despite some anti-immigrant agitation by local politicians, immigrants still seem to be flocking to both of these states. Known better s as retirement havens, their ranks of children and families have surged over the past decade. Warm weather, pro-business environments and, most critically, a large supply of affordable housing should allow these regions to grow, if not in the overheated fashion of the past, at rates both steadier and more sustainable.

    Sadly, several of the nation’s premier economic regions sit toward the bottom of the list, notably former boom town Los Angeles (No. 47). Los Angeles’ once huge and vibrant industrial sector has shrunk rapidly, in large part the consequence of ever-tightening regulatory burdens. Its once magnetic appeal to educated migrants faded and families are fleeing from persistently high housing prices, poor educational choices and weak employment opportunities. Los Angeles lost over 180,000 children 5 to 17, the largest such drop in the nation.

    Many of L.A.’s traditional rivals — such as Chicago (with which is tied at No. 47), New York City (No. 35) and San Francisco (No. 42) — also did poorly on our prospective list.  To be sure,  they will continue to reap the benefits of existing resources — financial institutions, universities and the presence of leading companies — but their future prospects will be limited by their generally sluggish job creation and aging demographics.

    Of course, even the most exhaustive research cannot fully predict the future. A significant downsizing of the federal government, for example, would slow the D.C. region’s growth. A big fall in energy prices, or tough restrictions of carbon emissions, could hit the Texas cities, particularly Houston, hard. If housing prices stabilize in the Northeast or West Coast, less people will flock to places like Phoenix, Orlando or even Indianapolis (No.11) , Salt Lake City (No. 12) and Columbus (No. 13). One or more of our now lower ranked locales, like Los Angeles, San Francisco and New York, might also decide to reform in order to become more attractive to small businesses and middle class families.

    What is clear is that well-established patterns of job creation and vital demographics will drive future regional growth, not only in the next year, but over the coming decade.  People create economies and they tend to vote with their feet when they choose to locate their families as well as their businesses.  This will prove   more decisive in shaping future growth   than the hip imagery and big city-oriented PR flackery that dominate media coverage of America’s changing regions.

    Cities of the Future Rankings
    Rank Metropolitan Area
    1 Austin, TX
    2 Raleigh, NC
    3 Nashville, TN
    4 San Antonio, TX
    5 Houston, TX
    6 Washington, DC-VA-MD-WV
    7 Dallas-Fort Worth, TX
    8 Charlotte, NC-SC
    8 Phoenix, AZ
    10 Orlando, FL
    11 Indianapolis, IN
    12 Salt Lake City, UT
    13 Columbus, OH
    14 Jacksonville, FL
    15 Atlanta, GA
    16 Las Vegas, NV
    16 Riverside, CA
    18 Portland, OR-WA
    19 Denver, CO
    20 Oklahoma City, OK
    21 Baltimore, MD
    22 Louisville, KY-IN
    22 Richmond, VA
    24 Seattle, WA
    25 Kansas City, MO-KS
    26 San Diego, CA
    27 Miami, FL
    28 Tampa, FL
    29 Sacramento, CA
    30 Birmingham, AL
    31 New Orleans, LA
    32 Philadelphia, PA-NJ-DE-MD
    33 Minneapolis, MN-WI
    34 St. Louis, MO-IL
    35 Cincinnati, OH-KY-IN
    35 New York, NY-NJ-PA
    37 Boston, MA-NH
    38 Memphis, TN-MS-AR
    39 Pittsburgh, PA
    40 Virginia Beach, VA-NC
    41 Rochester, NY
    42 Buffalo, NY
    42 San Francisco, CA
    44 Hartford, CT
    45 Milwaukee, WI
    45 San Jose, CA
    47 Chicago, IL-IN-WI
    47 Los Angeles, CA
    49 Providence, RI-MA
    50 Detroit, MI
    51 Cleveland, OH

    This piece originally appeared at Forbes.com.

    Joel Kotkin is executive editor of NewGeography.com and is a distinguished presidential fellow in urban futures at Chapman University, and an adjunct fellow of the Legatum Institute in London. He is author of The City: A Global History. His newest book is The Next Hundred Million: America in 2050, released in February, 2010.

    Photo by Exothermic Photography

  • Living and Working in the 1099 Economy

    We used to call it “Free Agent Nation.”  Now, it seems like the new term of art will be “The 1099 Economy.”   While the names may change, they all point to a phenomenon of rising importance: the growing number of Americans who don’t have a “regular job” but instead work on individual contracts with employers or customers.   These folks don’t get the traditional W-2 paystub at the end of the year; they report their taxes with the IRS form 1099.

    The 1099ers are a growing part of our economy.   There are a number of ways to slice the data.  If you look at US Census Bureau figures on the self-employed, we find 21.4 million self-employed Americans in 2008.  Recent data from EMSI suggests that the figures might be even higher.   Tracking workers who are not covered by unemployment insurance, the EMSI researchers suggest that more than 40 million Americans operate in the 1099 economy.   This represents about 1/5 of the total US workforce.

    As someone who has operated in the 1099 Economy for a decade, I can state that there are many benefits to this status:  more flexibility, more opportunities for unique and creative work, and more control over one’s work circumstances.    And, 1099 status can be profitable. Many fast growing ventures operate as sole proprietorships.  For example, in 2008, the Inc. 500 list looked at the ownership structures of firms on this list of US’s fast growing companies.  The largest sole proprietorship, Milwaukee’s Service Financial, had $11 million in revenue, but only one employee, its owner. 

    While the freedom of operating in Free Agent Nation can be tempting, there are downsides.  The data suggests that for many people, operating in the 1099 Economy may not be their first choice.  The EMSI research cited above found that the number of non-covered jobs in the US grew by 4 million between 2005 and 2009.   The fastest growth occurred in the mining, quarrying, and oil/gas extraction sectors where more than half of all workers are now non-covered.  Other areas with high concentrations of 1099 workers are in real estate (74% of workers are non-covered) and agriculture/forestry (74%).  This non-covered status creates a more flexible labor market, but it also creates potential challenges for these workers operating in notoriously unstable industries. 

    The 1099 Economy has emerged somewhat below the radar over the past decade.  Few economic development organizations have devoted much thought or research to the needs of this segment of the economy.  And, that’s not a good thing if 20% of the local workforce is invisible to community leaders.   Based on my experience, I see several segments within the broad category of the 1099 economy:  the reluctant 1099ers, the entrepreneurial 1099ers, and the “gig economy” work force. 

    The Reluctant 1099ers:  This group includes those who operate in the 1099 economy because they have no choice.   This group includes those sectors that have previously operated with traditional employment contracts, but have now shifted to the new structures.  Examples include mining, utilities, finance and insurance, and some administrative fields.  While individuals in these specific jobs may be happy with their circumstances, the workers, in a collective sense, face a more uncertain and probably less profitable work situation as 1099 contractors.

    The Entrepreneurial 1099ers:   Many budding entrepreneurs operate in the 1099 economy.  Sole proprietorships and LLCs/LLPs may have numerous workers under contract, yet appear in government statistics as a self-employment venture.  While most sole proprietorships are quite small and generate limited revenue, a sizable portion does generate significant incomes and may be poised for rapid revenue and job growth.  These individuals and their firms are the invisible portion of many local entrepreneurial ecosystems.

    The “Gig Economy” Workforce:   Last but not least, the gig economy workforce refers to those who operate in industries that traditionally operate on a project or “gig” basis.  Perhaps the best known example is film-making where crews come together for a film and then break up for other projects.  Other examples include the arts, theatre, writing, web design, and construction.  These sectors have a long history of operating via these structures.  It is clear that more industries are moving in this direction as well.   In response, a host of new kinds of support organizations, such as New York’s Freelancer’s Union, are emerging.  If current trends continue, we can expect to see similar groups arising across the US.

    Regardless of how one classifies these workers, they remain largely invisible to policy makers and to economic and workforce developers.   That needs to change.  In addition to recognizing the importance of this part of the workforce, we also need to develop a more nuanced understanding of their concerns and needs.   At a minimum, providing a stronger safety net—as suggested by the Freelancer’s Union and others—makes sense.   It also makes sense to develop work spaces that support the 1099ers.   Here, the recent growth in co-work spaces is a positive trend.    Finally, we need new kinds of support and services for the 1099ers.  These might include traditional training in business development, but other supports, such as networking or peer-to-peer lending or on-line tools to find customers and partners should also be part of the mix.    It’s time to recognize that the 1099 economy is here to stay and will be an important part of every community’s workforce for decades to come.

    Erik R. Pages is the President of EntreWorks Consulting, an economic development consulting and policy development firm focused on helping communities and organizations achieve their entrepreneurial potential.

  • Drones on the Prairie

    When the Base Realignment and Closure Commission was drawing up its list of military installations to close back in 2005, consultants assured the city of Grand Forks, North Dakota, that its Air Force base would be spared. Days before the list was made public, though, word leaked out that Grand Forks was on the chopping block, after all.

    North Dakota’s Congressional delegation swung into action and managed to win the base a reprieve; its KC-135 Stratotankers would be reassigned, but they would be replaced by unmanned aerial vehicles (UAVs). Earlier this month, in a ceremony that drew local dignitaries, industry executives, and military brass, Grand Forks Air Force Base marked the arrival of its first Global Hawk aircraft.

    Gunmetal gray, with long, white wings stretching out from the fuselage, the Global Hawk can stay aloft for 30 hours at a time, transmitting sensor data back to operators on the ground. The plane, manufactured by aerospace giant Northrop Grumman, has become a staple of the Air Force’s intelligence, surveillance, and reconnaissance efforts in Iraq and Afghanistan. Eleven Global Hawks will eventually be stationed at Grand Forks, along with 450 additional base personnel.

    “The base is our second largest economic engine,” said Eric Icard, senior business development officer at the Grand Forks Region Economic Development Corporation. “To have a new mission with a new technology solidifies the Air Force’s commitment to the Grand Forks region.”

    Sgt. Joseph Kapinos couched the plane’s arrival in more personal terms: “I think people are excited, because they feel like we have a mission again.”

    Grand Forks AFB

    Col. Don Shaffer, Commander of the 319th Air Base Wing at Grand Forks Air Force Base, told a crowd of dignitaries that the arrival of the Global Hawk marked a transition for the base to a "global vigilance mission." Photo by Marcel LaFlamme

    The ceremony came on the eve of the fifth Unmanned Aircraft Systems Action Summit in Grand Forks, which was sponsored by the Red River Valley Research Corridor. With military procurement of unmanned aircraft projected to double over the next decade, North Dakota has worked to position itself as one of the nation’s hubs for UAV research and training. Last month, the University of North Dakota (UND) awarded degrees to the first five graduates of its unmanned aircraft operations program. At the Summit, Northrop Grumman presented Minnesota’s Northland Community and Technical College with a full-scale model of a Global Hawk for use in its UAV maintenance and repair shop.

    It’s too soon to say whether the Upper Great Plains will emerge as a new powerhouse of the military-industrial complex, a new buckle on what regional planners have dubbed the Gunbelt. Participants at the Summit said that the real economic boom would come as UAV technologies begin to find commercial applications. One major impediment is the ban on flying UAVs in the National Airspace System; North Dakota Congressman Rick Berg has pushed for the creation of test sites where UAVs could fly (and it’s no secret that North Dakota is angling to be one of them), but the FAA reauthorization bill that would make that possible is currently mired in conference committee.

    North Dakota has been riding a wave of media adoration as of late, buoyed by low unemployment numbers and a massive oil strike. But 42 of its 53 counties still posted population losses in the 2010 Census.

    How, the question remains, do rural communities stand to benefit from the burgeoning UAV industry? Are all of these "knowledge economy" jobs bound to spring up in Grand Forks
    and Fargo, even as the state’s struggling farm communities continue to wither away?

    Not if Carol Goodman has anything to say about it. Goodman heads the Job Development Authority in Cavalier County, up by the Canadian border; the county lost 17% of its population between 2000 and 2010, dipping below 4,000 people for the first time in over a century. She’s working to redevelop an abandoned missile base from the Cold War era as a UAV testing site, which could create as many as 670 jobs in the county.

    “Tell them to send some of those UAVs over here,” said Bob Wilhelmi, owner of the lone bar in the wind-blown town of Nekoma. A man from neighboring Walsh County said that, the year after next, his school district will not have a single child enrolled in kindergarten. 

    Mickelsen Safeguard Complex

    The Stanley R. Mickelsen Safeguard Complex: once an antiballistic missile site with its eyes on Moscow, now a potential test bed for unmanned aircraft. Photo by Marcel LaFlamme

    The unmanned aircraft industry in North Dakota is a sort of test case for what happens when a traditionally agrarian state decides to pursue high-tech growth. It’s still not clear whether the state will succeed. But to watch those airmen jostle for a picture with their base’s newest piece of hardware, or to hear a recent UND graduate pitch the start-up company that will keep him in Grand Forks, or even to look up for a while at the clear, empty Dakota sky, you start to think that the state’s drone charmers may just have a shot.

    This piece originally appeared at Daily Yonder.

    Marcel LaFlamme is a graduate student of the Department of Anthropology at Rice University in Houston.

    Lead photo: Official U.S. Air Force

  • Can Florida Escape the Horse Latitudes?

    When it comes to the winds of change, Florida remains in the horse latitudes.  This zone of the Atlantic around 30 degrees latitude was so named by ship captains because their ships, becalmed in the water, seemed to move faster when they lightened their load by throwing off a few horses.  Florida’s governor Rick Scott, who campaigned on a promise to create 700,000 jobs in this state, appears to have adopted the same tactic by throwing overboard the Department of Community Affairs, the state agency that regulated real estate development.  Other bureaucracies may be next in line if the state doesn’t show signs of improvement soon.

    Billy Buzzett, appointed head of this bureaucracy, was in Orlando last week to discuss the new future of Florida growth management.  Growth will now be lightly monitored by the Department of Economic Opportunity , which is in charge of reviewing development plans, and will handle unemployment benefits as well.  Mr. Buzzett stated that the department’s mission will also include items such as weatherization of structures for hurricanes. All of this is good, but it’s a puzzling mix to throw into a single bureaucracy.  Obviously, real estate regulation is not the focus of this governor, who saw regulation as one of the chief obstacles to creating jobs in this state.

    The Department of Community Affairs was created in 1985 to set some standards for quality of life as well as for environmental protection.  Failing at both tasks, the DCA came under fire during the last election cycle as a statewide referendum (Amendment 4) on growth gained support from people tired of seeing forests converted into strip malls.  The referendum, narrowly defeated, would have people vote in Cailfornia-style ballots for such changes.  This may have been a bad idea, based on how California’s growth controls have stifled its once vibrant economy.

    In this era of minimal new building, the reinvention of growth management may be seen as a way to pass the time while we wait for the economy to recover.  In reality, however, there are some very large implications in the future.

    Governor Scott wants the state to be more like Texas, which regulates with a far lighter hand and seems to be navigating through this particularly horrid recession better than other big states.  Texas has growth and does not have an onerous, time-consuming process which weeds out all but the deepest pocketed investors.  Unlike Texas, however, Florida has few natural resources like oil and mineral wealth to fall back on for revenue, and therefore deregulates itself without any diversification of income stream.

    What this means to the local economy will be hard to predict.  Certainly, the DCA was able to negotiate with private developers, and helped to shield cities and counties from a lot of the pressure from out-of-state interests.  Without the DCA, it will be interesting to watch which of Florida’s regions stand up to this pressure and which regions, starved for cash, cave in to the pressures of growth.

    Although defeated, Amendment 4 clearly scared the real estate interests to death.  Legislation now prevents anything like that from happening again.  While real estate development clearly needs to be left in the hands of professionals, it also seems to have risen to the top of citizens’ awareness.  Whether it stays there or not is up to the state’s citizens, most of whom immigrated from elsewhere in search of the good life.  Growth benefitted the lowest economic class by creating cheap housing, construction jobs and access to consumer goods.  Florida, however, by grabbing the bottom tranche of workers, has missed a chance to build a more vertically integrated middle class with higher skilled workers.

    Orlando in particular is in an unfortunate situation, as it has no natural hard boundaries like the sea.  Like Atlanta, Central Florida’s metropolitan area can grow in concentric rings forever and ever, gobbling up more agriculture, wetlands, and forests.  Such a development pattern puts value on the rim, rather than in the center, leaving the older parts of the city devoid of investment, energy, and hope.  With private interests, whose mission is to grab the low hanging fruit, in chargethere will be little redevelopment of these interior districts, despite the sunk costs of infrastructure that could give them an edge. 

    Making more stuff is the business of growth.  Making stuff better is the business of development.  And development is what older neighborhood areas like this sorely need.  Successful in-fill redevelopment, in both suburban and urban locations, can still happen if employment can be added to the mix.

    It is up to our region’s leadership to turn this pattern around, and start valuing our real estate a little differently than in the past.  For example, debasing our wetlands to their mere economic value overlooks their larger value in terms of biodiversity.  Bringing wetlands and agriculture into our growth management policy would be a good first step towards creating a sustainable future for Central Florida.  Florida’s environmental movement need not turn into a shrill anti-growth machine as has happened elsewhere, but should be a partner with the real estate interests to protect the more long-term natural assets that bring so many to the Sunshine State in the first place.

    Recycling also need not be just the job of the utility department.   Recycling land through the EPA’s brownfield program is already underway by many municipalities, and provides a vehicle to reinvent neighborhoods that have failed. 

    As always, clean water will be the limiting factor to growth.  Already a concern of Florida, the state is divided into various water management districts, who regulate how clean water can be removed from the aquifer, and what kind of dirty water can be put into it.  No doubt this regulation will be under assault next.

    Without Secretary Buzzett’s new department, Florida is already showing signs of new employment opportunities and diversity.  Military spending in Florida is up, thanks to the National Center for Simulation, and medical research spending is continuing at a steady pace.  These were added to the mix of growth, tourism, and agriculture upon which Florida has traditionally relied. More jobs that revolve around these two industries will include support technology, computer science, manufacturing, and services. 

    These industries grew despite the regulatory burden of the state.  What is dangerous about Secretary Buzzett’s new department is its blasé treatment of the public’s genuine desire for better environmental management and a better quality of life.  Like many places, Florida has its share of “not in my backyard” sentiment reacting against more development.  The anger voiced in 2010 through Amendment 4, however, represented something new and deeper:  a collective sense that enough is enough.  Speculative development, built during the boom and remaining unoccupied to this day, is in every community, urban and rural.  Few believe that the empty condos, ghost town subdivisions, empty strip shopping centers, and vacant office parks are improvements over what was there before, and fewer still want this kind of insanity to return.

    So the death of the DCA, which allowed speculative development to the point of embarrassment, may have been a good thing.  Employment-based growth, which so far has eluded Florida’s regions, may now have a chance to take place.  With the new industries arriving, job creation is already a reality – no horses had to be thrown overboard to make that happen. What Florida needs now is some leadership at the local level to promote more employment-based growth that is slow, but sure, and that is sustainable for the long haul.   

     Richard Reep is an Architect and artist living in Winter Park, Florida. His practice has centered around hospitality-driven mixed use, and has contributed in various capacities to urban mixed-use projects, both nationally and internationally, for the last 25 years.

    Photo: Desiree N. Williams

  • The Rise Of The Third Coast: The Gulf Region’s Ascendancy In U.S.

    For most of the nation’s history, the Atlantic region — primarily New York City — has dominated the nation’s trade. In the last few decades of the 20th Century, the Pacific, led by Los Angeles and Long Beach, gained prominence. Now we may be about to see the ascendancy of a third coast: the Gulf, led primarily by Houston but including New Orleans and a host of smaller ports across the regions.

    The 600,000 square mile Gulf region has long been derided for its humid climate, conservative political traditions and vulnerability to natural disasters. Yet despite these factors, the Gulf is destined to emerge as the most economically vibrant of our three coasts. In our rankings of the fastest-growing job markets in the country, six Gulf cities made the top 50: Houston, Corpus Christi and Brownsville, in Texas; New Orleans; and Gulfport-Biloxi and Pascagoula, in Mississippi. In contrast, just one Pacific port, Anchorage, Alaska, and one small Atlantic port, Portsmouth, N.H., made the cut.

    This reflects a long-term shift of money, power and jobs away from both the North Atlantic and the Pacific to the cities of the Gulf. The Port of Houston, for example, enjoyed a 28.1% jump in foreign trade this year, and trade at Louisiana’s main ports also reached records levels.

    This growth stems from a host of factors ranging from politics, demographics and energy to emerging trade patterns and new technologies. One potential game-changer is the scheduled 2014 $5.25 billion widening of the Panama Canal, which will allow the passage to accommodate ships carrying twice as much cargo as they are able to carry currently. This will open the Gulf to megaships from Pacific Basin ports such as Singapore, Shanghai, Pusan and Kaohsiung, which have mostly sent their cargos to West Coast ports such as Los Angeles and Long Beach. Some analysts predict that more than 25% of this traffic could shift to Gulf and South Atlantic ports. “More of Asia will be heading to this part of the world,” says Jimmy Lyons, CEO of the Alabama State Port Authority.

    The area also is getting a big jolt from ascendant Latin America, the Gulf’s historic leading trade partner. Bill Gilmer, an economist with the Federal Reserve Bank of Dallas, notes that Latin America is home to many of the world’s fastest-growing economies, with overall growth rates last year exceeding 6.1%. Since 2002 about 56 million people in the region have risen out of poverty, according to the World Bank.

    Trade with Latin American partners — including Mexico — is ramping up growth in Houston as well as other Gulf ports. Brazil, for instance, has risen to become Mobile, Ala.’s leading trade partner.  Latin immigration to virtually all the Gulf cities, including New Orleans, can only strengthen these economic ties.

    The energy industry represents another critical force in the Gulf’s resurgence. It employs at least 55,000 workers in the Gulf, which produces roughly one-quarter of the nation’s natural gas and one-eighth of its oil. Although Houston seems assured of its spot as the focal point of the world fossil fuel industry, oil and gas also boosts numerous economies throughout the region, notably in Corpus Christi and various ports across Southern Louisiana.

    Though the Obama administration puts its bets on subsidizing “green jobs,” traditional energy jobs may prove, in the short and medium term, far more important.  There is even widespread talk about the Gulf emerging as a center for the export of natural gas. Over $ 6 billion in new investments are already being proposed for export facilities, notes David Dismukes, associate director of the Louisiana State University Center for Energy Studies.

    The energy-related economy produces high-wage jobs that range from geology and engineering to the muscle work on the oil rigs, which provide well above average wages for blue collar workers. Such growth is particularly critical to regions such as New Orleans, long dependent on generally lower-wage industries like hospitality and personal services. The energy business also will help accelerate the expansion of business services such as law, accounting, architecture and advertising.

    The shift to the Gulf includes some rapid industrial expansion, particularly for energy intensive industries. Huge natural gas supplies are creating enormous opportunities for expanding petrochemical industries. The German firm Thyssen Krupp opened a new $5 billion steel mill last year, and Nucor Steel announced a large new facility to be built just outside New Orleans. Like energy production, these facilities tend to pay above-average wages for blue collar workers, which will likely raise living standards for a region that has lagged historically.

    At the same time, demographic trends suggest these areas will continue to become more attractive to international commerce. Despite a legacy of hurricanes and floods, Houston, with over 5 million people, has emerged as among the fastest-growing large metropolitan regions in the country. The region’s population is expected to double in the next 20 years. Most of the economies its port serves — Dallas-Fort Worth, San Antonio and Austin — also have experienced rapid growth. Recoveries are in place in many other hurricane-devastated areas, including greater New Orleans.

    Overall the Gulf is expected to be home to 61.4 million people by 2025, a nearly 50% increase from its 1995 base. This expanding domestic market — along with the possibilities posed by the canal — have already persuaded two larger retailers, Wal-Mart and Home Depot, to establish modern new distribution centers in Houston.

    Finally there is the matter of political will. Both the Northeast and the Pacific regions are increasingly dominated by environmental, labor, urban land and other interests often hostile to wide-ranging industrial expansion.  A legacy of labor unrest, most notably a big strike of West Coast ports in 2002,   convinced some shippers to diversify their operations elsewhere.   Growing regulation in California, suggests economist John Husing, a leading expert on port-related issues, makes the prospects for growing warehouse, logistics and manufacturing jobs increasingly “impossible”  there.

    East Coast ports, subject to some of the same pressures, may be slow to make the “intense capital improvements” required to capture expanding trade. In contrast, the Gulf’s leaders in both parties support   broad based economic growth.  New Orleans’ Democratic Mayor Mitch Landrieu is no less friendly to industrial and port expansion  than Republican Gov. Bobby Jindal. Houston Democratic mayors like Annise Parker, Bill White and Bob Lanier have been as strongly in favor of critical business and infrastructure investment as their Republican counterparts.

    Such differences in attitude have driven power shifts   throughout American economic history. In the 19th century New York through a combination of ruthless ambition and greater vision  overcame aristocratic Boston and more established Philadelphia. Icy Chicago performed a similar coup over its then far more established and temperate rival, St. Louis, in the mid- and late 1800s.

    In the last century, unfashionable Los Angeles, without a great natural port, overcame the grand Pacific dowager San Francisco, blessed by one of the world’s great natural harbors, as the economic center of the West Coast. Los Angeles built a vast new modern and largely artificial port to make up for what nature failed to provide, and also nurtured a host of   industries from aerospace, oil and entertainment to garments.

    Now history is about to repeat itself as Texas, Louisiana and other Gulf Cities seek to reorder the nation’s economic balance of power.  Unless California and the Northeast awaken to the challenge, they will be increasingly supplanted by a region that seems more determined to expand their economic dominion.

    This piece originally appeared at Forbes.com.

    Joel Kotkin is executive editor of NewGeography.com and is a distinguished presidential fellow in urban futures at Chapman University, and an adjunct fellow of the Legatum Institute in London. He is author of The City: A Global History. His newest book is The Next Hundred Million: America in 2050, released in February, 2010.

    Photo by NASA Goddard Photo and Video

  • Outlawing New Houses in California

    UCLA’s most recent Anderson Forecast indicates that there has been a significant shift in demand in California toward condominiums and apartments. The Anderson Forecast concludes that this will cause problems, such as slower growth in construction employment because building multi-unit dwellings creates less employment than building the detached houses that predominate throughout California and most of the nation. The Anderson Forecast says that this will hurt inland areas (such as the Riverside-San Bernardino area and the San Joaquin Valley) because their economies are more dependent on construction than coastal areas, such as Los Angeles, the San Francisco Bay Area and San Diego.

    Detached Housing Permits Remain Strong in the Historic Context: The Anderson Forecast reports that multi-unit building permits have recovered more quickly than building permits for detached housing. However, any such shift is likely to be highly volatile. Since the peak of the bubble, the distribution of building permits between detached and multi-unit in California has been on a roller coaster. Indeed the Anderson Forecast characterizes the "2010 US Census" as "showing a significant shift in demand toward condominiums and apartments." Actually, the 2010 US Census asked no question from which such a conclusion about housing types or any question from which such a conclusion could be drawn.

    The trends in the building permit data are not completely clear. In 2005, the year before prices started to collapse, 75 percent of building permits in California were for detached housing. This trended downward, reaching a low of 52 percent in 2008. In 2009, the detached housing recovered to account for 73 percent of all housing building permits. Then the figure fell back to 59 percent in 2010.

    With these erratic trends, it is tricky to forecast longer term market trends and consumer demand.  Economic projections in 1934 would have suffered from a similar problem, as the Great Depression was continuing and no one could really tell when it would end. Today’s continuing housing depression may be similar.

    Moreover, as the Anderson Forecast notes, detached housing construction declined in the early 1980s, dropping to 42 percent in 1985. In fact, over the 25 years between 1960 and 1985, detached houses accounted for an average of only 54 percent of new housing construction in California, well below the 2010 figure of 59 percent (Figure 1).

    Equally important, the condominium market remains in a deep depression. In 2010, less than four percent of houses built for sale in the United States were multi-unit buildings, including condominiums (Figure 2), as an increasing majority of multi-unit buildings have been built as rentals (Figure 3). Comparable California data is not available, but from the peak of the bubble (2006/7) to 2009, there was a loss of more than 3,000 owner occupied  multi-unit dwellings with 10 or more units, while owner occupied detached houses increased by nearly 100,000 (Note 1).

    If there is an intrinsic pent-up preference for condominium living, it is not evident in the poor performance of high-density developments even in such theoretically desirable places as Santa Monica, San Francisco, Oakland, San Jose and North Hollywood. Condominium prices, for example, have fallen 52 percent in the major California metropolitan areas, compared to 48 percent for single-family houses (Figure 4). Naïve developers, relying too much on the much promoted notion that suburban empty-nesters were chomping at the bit to move to new housing in the core area, often watched their empty units liquidated at $0.50 or less on the dollar or turned into rentals.  Further, if people are moving to apartments, it’s not for love of density but more likely due weakening economic circumstances.

    Inland California Continues to Grow Faster: The Anderson Forecast also suggests that growth in interior California will suffer because "workers are less likely to move inland into an apartment and commute toward the coast." This assumption of slower inland growth reflects the conventional wisdom that areas outside the large coastal metropolitan areas have stopped growing since the burst of the housing bubble as people flock towards the coastal urban core (Note 2). The reality is different, as interior California and the peripheral metropolitan areas of the larger metropolitan regions (Note 3) continue to grow more strongly even in bad economic times. After the burst of the bubble, from 2008 to 2010 (Figure 5):

    • In the Los Angeles area, the adjacent Riverside-San Bernardino ("Inland Empire") and Oxnard metropolitan areas, combined, have grown at seven times the rate of the core Los Angeles metropolitan area.
    • In the San Francisco Bay area, the adjacent Napa, Santa Cruz, Santa Rosa and Vallejo metropolitan areas, combined, have grown nearly twice as quickly as the core San Francisco and San Jose metropolitan areas.
    • California’s deep interior, the San Joaquin Valley has grown even faster than the exurban areas of Los Angeles and San Francisco.

    One key reason: most people who move to interior areas do not commute toward the core.  For example, less than 10 percent of workers in the Riverside-San Bernardino metropolitan area commute into Los Angeles County, a market share that declined 15 percent between 2000 and 2007. Many also simply cannot afford the higher cost of living in the coastal metropolitan areas, which likely will continue to retard growth in the core metropolitan areas.

    The Policy Threat to New Houses : A survey by the Public Policy Institute of California suggests a vast preference (70%) for detached housing among the state’s consumers.  This continuing preference is demonstrated by detached housing prices that are generally two times historic norms relative to incomes in the coastal metropolitan areas (Los Angeles, San Francisco, San Diego and San Jose).

    Yet now, this choice is under a concerted assault by both the state and many local governments, cheered on by most media and the academic community.  For years, planning regulations have driven land prices so high that house prices have risen to well above the rest of the nation (Figure 5) under regulations referred to by terms such as "smart growth" and "urban containment." The regulations and the inevitably resulting speculation propelled a disproportionate rise (nearly $2 trillion) in California house prices compared to national norm. If California house prices had risen at the same rate relative to incomes as in more liberally regulated areas, the loss to financial markets could have been hundreds of billions of dollars less when the bubble burst (Figure 6).

    Planning for Crowding and Density: California’s assault on detached housing is taking on a distinctly religious fervor.  The state’s global warming law (Assembly Bill 32) and urban planning law (Senate Bill 375) is providing a new basis to impose draconian limits on the construction of detached housing. For example, in the San Francisco Bay area, it has been proposed that 97 percent of new housing be built within the existing urban footprint. That would mean an emphasis on multi-unit housing and little or no new housing on the urban fringe. The option of a single family home will be all but non-existent for   even solidly middle income Californians.

    Planning authorities in the Bay Area seem oblivious to the fact that destroying affordability also destroys growth, already evident by the state’s poor economic performance and ebbing demographic vigor.    Planners rosily project 2 million more people between 2010 and 2035 in the San Francisco Bay area. The growth rate over the past 10 years suggests a number less than half that (Figure 7) and given the rapid aging of the area, even this estimate may be too high. The planners also project more than 1.2 million   new jobs, something difficult to believe given the more than 300,000 job loss (Note 4) that occurred in the Bay Area between 2000 and 2010 (Figure 8).

    The Environmental "Fig Leaf:" The environmental justification for these policies is fragile . Research supporting higher density housing has routinely excluded the greater emissions from construction material extraction and production, building construction itself and common greenhouse gas emissions from energy consumption that does not appear on consumer bills. Further, higher densities are associated slower and more erratic speeds, which retards fuel efficiency and increases greenhouse gas emissions, a factor not sufficiently considered.

    The report seems to ignore any other options besides rapid densification, which as McKinsey Global Institute has pointed out is not at all necessary to reduce GHG emission reductions. They point to other factors as more fuel efficient cars.   

    Oddly, the San Francisco Bay Area proposal does not even mention working at home (much of it telecommuting), the most environmentally friendly way of accessing employment. Working at home has grown six times the rate of transit since 2000 in the Bay Area.

    Outlawing New Houses Detached housing remains the overwhelming choice of Californians. There is no indication that this preference is about to be replaced by a preference for high-density housing.  Current and future middle class Californians could be corralled into more crowded conditions, because questionable planning doctrines mandate that detached housing should be outlawed.

    —-

    Notes:

    1. Calculated from 2006, 2007 and 2009 American Community Survey data. The over ten unit category is used because is more generally reflective of the dense condominium development generally favored by densification advocates (Latest data available).

    2.  Another questionable tenet of conventional wisdom is that the price declines in the outer suburbs were greater than in the cores. When the price declines reached their nadir, core California markets were generally at least as depressed from their peak prices as suburban markets.

    3. Metropolitan region refers to combined statistical areas, which have a core metropolitan area, such as the Los Angeles MSA and include surrounding metropolitan areas, such as the Riverside-San Bernardino MSA and the Oxnard MSA.

    4. Annual, 2000 to 2010, calculated from California Economic Development Department data.

    Lead photo: Houses in Los Angeles. Photograph by author.

    Wendell Cox is a Visiting Professor, Conservatoire National des Arts et Metiers, Paris and the author of “War on the Dream: How Anti-Sprawl Policy Threatens the Quality of Life