Category: Economics

  • Germany’s Role in the Green Energy Economy

    Germany likes to brag about its green credentials. It is a source of pride and it is justified to a certain extent. The country, which is located on the same latitude as Canada, had the largest number of installed solar panels as of 2007.

    The key to growth clearly has not been abundant sunshine, but massive subsidies. Germany sponsors its solar industry with generous tax credits that take the form of feed-in tariffs, i.e. payment above the going market rate for energy from renewable sources like solar panels, it can run anywhere from twice to three times the market rate for a conventionally produced kilowatt. These tariffs can run high. They are being lowered slowly but perhaps a bit too slowly. As we have recently seen with the disasters impacting Spain’s renewable energy industry, dependence on subsidies can create a potential catastrophic downturn once the spigot is turned off.

    Would a similar model be appropriate for sponsoring renewable energy in the US? Probably not, in large part the technology is already developed. The Germans and now the Chinese have already subsidized their industries. The legwork has been done and anti-greenhouse legislation will sustain the market without massive subsidization.

    The first factor is that most of the investment in research and development has created the pre-conditions for grid parity within the next few years for southern countries. Even Germany will achieve it by 2012 according to the German business newspaper Handelsblatt. The economies of scale are sinking unit costs dramatically and production technologies like thin film are allowing solar cell manufacturers to produce ever more efficient panels with less and less silicon. Several silicon production plants are set to come on line in China soon.

    The US, whose fiscal situation is parlous compared to China and even Germany, wants to waste years developing already available technologies from scratch. It could try the European approach but would probably be much better off to follow the same path that it followed with the automobile or the motion picture: allow other countries to get the basic technology in place and concentrate its exceptional energy on marketing and scaling up the technologies from abroad.

    China’s entry into the market seems destined to create a dramatic collapse in the price of what was until a few years ago essentially a cost plus industry. China has low labor costs and inflation busting economies of scale. China’s entry into the silicon wafer market already has depressed prices for the once dear raw material. They are also working on a massive power plant with First Solar of the United States.

    Some are predicting that China’s entry into the renewable energy market will have the same effect as its entry into the consumer electronics market, i.e. it will make the expensive affordable and then cheap. German solar cell production companies have suffered much like its chip producers but to the general benefit of the economy. China will drive production costs further down. Germany is still coming to terms with this.

    A recent article in Die Zeit illustrates the growing discrepancy between renewable energy policy and the market potential. The feed-in tariffs have the perverse effect of making solar energy far more expensive than it actually needs to be. The government subsidies are essentially shielding domestic producers from China making the consumers pay the higher rates. Germany needs to focus on its traditional strengths in producing industrial machinery and carve a niche for itself. The US would be better off to maintain trade relations with China and let Adam Smith’s invisible hand work its magic. It would be far cheaper than trying to use protectionist measures to protect domestic manufacturers.

    All this is predicated on the assumption that the price of oil will only increase in price in the coming decades as China and India motorize their masses. This in turn will drive up conventional power costs. Even at its current price of around $70 a barrel, oil is still 7 times more expensive than it was just a decade ago. Some are predicting that that last year’s prices of almost a $150 a barrel represent a taste of what will confront the world when the economy begins to grow again

    This, however, will be a gradual process, based on undulating prices. The hysterical claims of Peak Oil have been delayed again and again by technological improvements. The latest finds off of Brazil and the Gulf of Mexico represent dramatic examples. Massive new gas reserves in North America represent another countervailing force. In the end, fossil fuels will be more expensive, but they will make renewable energy more competitive only at reasonable price points.

    Politics will also play a role. Climate change and the perceived need to combat it has gained enormous currency among world leaders including German Chancellor Angela Merkel. Regardless of what one thinks of the arguments calling for action, we will probably see some sort of carbon tax in the future, whether it be cap and trade or some other means of increasing the costs of carbon emissions. Conventional fuels like coal, oil, and natural gas are only going to get more expensive for political if not economic reasons. The growing consensus, regardless of its veracity, is set to create huge costs for non-renewable sources of energy.

    Over time, this will make renewable energy more attractive and unit costs will shrink as economies of scale start to kick in. The European cheerleaders of climate legislation are not doing it out of the goodness of their heart. They want to see a return on the billions spent on developing renewable technology. The US would be ill-advised to simply try to create technologies that are already up and running. Take the technology, commercialize it and thank the Europeans for footing the bill.

    The US would be well advised to keep their renewable energy markets open. The Europeans will come and are coming. The solar energy trade fairs in Germany focus on the immense potential available in the US market. Several large German producers are expanding aggressively on the American market bringing with them the technologies that they have created. China will also start to flood the market with cheap silicon wafers and further reduce solar panel costs. The US does not need to subsidize this technology lavishly. It simply needs to allow the companies that have it to sell it on their market. The initial support provided by countries like Germany was more than enough to get the technology to the point where it is ready to survive on the free market.

    Kirk Rogers resides in Bubenreuth on the outer edges of Nuremberg and teaches languages and Amercan culture at the University of Erlangen-Nuremberg’s Institut für Fremdsprachen und Auslandskunde. He has been living in Germany for about ten years now due to an inexplicable fascination with German culture.

  • Crash in High-end Real Estate or a Roller Coaster Recession? :

    During the first ten days of October 2008, the Dow Jones dropped 2,399.47 points, losing trillions of investor equity. The Federal Government pushed TARP, a $700 billion bail-out, through Congress to rescue the beleaguered financial institutions. The collapse of the financial system was likened to an earthquake. In reality, what happened was more like a shift of tectonic plates.

    *******************************************

    In September 2009 the Fed proclaimed “The Recession is Over.” President Obama said his Stimulus Package saved the US economy and his international actions have “brought the global economy back from the brink.” Vice-President Biden declared, “The Stimulus Package worked beyond my wildest dreams.” I feel so much better. Living in California, I must have missed these events.

    If the recession is over, why is unemployment in California 12.2%? (Functional unemployment, the real number, is closer to 16%). In decimated areas like the Central Valley, unemployment is at Great Depression levels of 26%. If the economy was saved, why do our homes continue to lose value? And it is not just “our homes” that are impacted. Treasury Secretary Timothy Geithner was forced to rent out his Larchmont, N.Y., home after it failed to sell. President Obama’s Chicago home, purchased for $1.65 million with a $1.3 million jumbo mortgage at the height of the real-estate bubble is now worth less than $1.2 million according to an estimate by Zillow.

    The recession may be over but Americans are now experiencing The Roller Coaster Recession. Like a roller coaster chugging its way up to the top, home values climbed between 2002 and 2007. Beginning in the fall of 2007, home values declined, first slowly but inexorably until they bottom out and began to climb again. Have we bottomed out? The Atlantic screamed, “Home sales soared 11% in June”.

    Not so fast. Like the cars in a roller coaster, the first cars will begin to climb out while the last cars are still screaming downward at top speed. The Commerce Department reported sales in August rose a tepid .07% in August. What they did not highlight is that new home sales of 429,000 are at historical off the chart low compared to the last 50 years (see chart below).

    Such is the case with the Roller Coaster Recession. In California’s roller coaster ride the first car, The Inland Empire, crested the top in 2007. When pink slips were issued, these homeowners did not have deep pockets to sweat it out. All of their savings had been plowed into their down payment. When values declined, they had no staying power. They were gone in the first wave of foreclosures.

    Meanwhile, the rear car, Coastal California, continued to climb in value seemingly immune to the problems inland. The reason was staying power. The residents of tony Corona Del Mar were able to dump their third car, the Range Rover to keep solvent. When that ran out, Coastal California tapped their savings and finally used their equity lines to maintain their high mortgage payments while they waited for a buyer. But it is 2009 and the buyers have not materialized. More Jumbo Loans are falling behind in their payments. Watch the 60-day delinquency rate on prime Jumbo Loans. According to First American Core Logic, Jumbos in default jumped to 7.4% in May versus 4.9% for conforming loans

    Like our proverbial roller coaster, now it’s the turn for the first cars to rise. As the Inland Empire seems to have bottomed, Coastal California is still racing downward. There are 200 homes for sale between $1.5 and $3 million in ritzy Corona Del Mar. Even with a hefty 25% down payment, a $2 million property will require a $1,500,000 mortgage. Today’s lenders will require proof that the borrower can afford the $7,500 per month mortgage payment. They will demand a W-2 or 2008 tax return showing at least $22,500 per month in income to support a 30% housing expense ratio.

    The reality is there simply are not enough buyers earning $250,000 per year to buy up the 200 homes in Corona Del Mar. The current inventory will take 17 months to sell out but, as the recession continues, more homes are posting For Sale signs each month. Coastal California has not yet seen their bottom and they are still heading down at a rapid pace.

    Our national leaders may proclaim the end of the recession, but Californians have no reason to party. The Stimulus Package that shipped $50 billion to California was a one-time windfall that delayed but did not end California’s structural $26 billion budget deficit.

    Add to that the “Mortgage Armageddon” that is scheduled to hit next February. As the sub-prime mortgage defaults subside, the Option ARMS (adjustable rate mortgages) and Prime ARMs will begin to reset in early 2010 (see chart). This is not a working class but primarily a middle and upper-class problem. It is more a coastal than inland crisis; in New York terms, more Larchmont and less exurbia.

    There is a problem, however, with dinging the rich. They are the very folks expected to spend in our consumer-driven economy and invest in new ventures. If they have to re-route more dollars to mortgage payments, they not going to be able to help the economy.

    The Roller Coaster Recession will see more rises and dips before a sustainable recovery comes to California and other high-priced marekts. Those in the first car, like The Inland Empire, have nearly completed their ride. Any remaining dips will be minor in drop and brief in duration. But the genteel folks in the last car, in places like Coastal California, have another precipitous drop in front of them. This may come as a surprise to those believing the headlines that the recession was over. The wild ride for many is hardly over yet.

    ***********************************

    This is the fourth in a series on The Changing Landscape of America. Future articles will discuss real estate, politics, healthcare and other aspects of our economy and our society.

    Robert J. Cristiano PhD is a successful real estate developer and the Real Estate Professional in Residence at Chapman University in Orange, CA.

    PART ONE – THE AUTOMOBILE INDUSTRY (May 2009)
    PART TWO – THE HOME BUILDING INDUSTRY (June 2009)
    PART THREE – THE ENERGY INDUSTRY (July 2009)

  • When Thanatos Beat Eros, Mapping Natural Population Decreases

    For an advanced capitalist society, the United States has a quite high birth rate, and substantial natural increase. Yet despite this, almost a third experienced natural decrease, an excess of deaths over births, over the recent 2000-2007 period. Some counties with natural decrease still grow in population because of sufficient in-migration, but more typically, natural decrease is associated with high levels of out-migration and with long term population decline.

    My first map, Figure 1, depicts counties with natural decrease at five levels, with warm colors marking the higher “rates” (actually here, simply the share that natural decrease is of the base population in 2000), and cool colors lower rates, blue being closest to a balance of births and deaths.

    The Great Plains, the part of the country most dependent on agriculture, has led this trend as it has been since probably 1960, with counties from Texas to North Dakota, Montana (and beyond into Canada) experiencing among the highest levels of natural decrease. Others include central Florida, Appalachia, and some interior parts of New England, the upper Michigan to northern Minnesota iron range, and a sizable scatter of counties across the west.

    What causes natural decrease? First is a pattern of long term out-migration of the surplus young, who could not be supported by the limited rural economy and other natural resource based industries. Second is the growth of the elderly population from selective migration to amenity retirement areas. Florida is the “flagship” case, but to a lesser degree it occurs in favored local environments in most of the country. Third would be a situation of natural decrease because of unusually high mortality. Fortunately, there is no example of this in the United States.

    The geography of natural decrease

    First there is a small set of counties with natural decrease, more deaths over births, but still net positive growth due largely to net domestic in-migration (magenta and yellow on the county types map, Figure 2). The bulk of these counties are retirement amenity areas, mostly but not entirely in the Sunbelt, and mostly but not entirely in the south and west. Another even smaller group is characterized by long term declining industry and mining based economies, but also offers affordable housing stock for second homes and later retirement. We see this especially in Appalachia.

    The largest cluster of the first type of places covers a swath of central Florida, including such cities as St. Petersburg, Sarasota, Port Charlotte, Melbourne, Daytona Beach, followed by southwestern Oregon, northwestern Arizona (Prescott, Lake Havasu City), central Colorado (west of Colorado Springs), parts of rural Northern California, Wyoming, South Dakota, Montana and Washington state.

    The main cluster of the second type, areas with industrial decline that have become amenity retirement destinations, are in Appalachia, especially the North Carolina – Tennessee border area (Great Smokies), selected counties in northern West Virginia and exurban counties around Pittsburgh. A prominent cluster is the Scranton-Wilkes-Barre, Hazleton area of east central PA. Scattered Midwestern examples include places like Hot Springs, Arkansas, 3 counties in Southeast Illinois, along with areas along Lake Superior, parts of Arkansas as well as on the Texas Gulf coast.

    The more rural natural decrease counties with net in-migration (215 counties, yellow on the map) tend to occur in the same regions. The two main “belts” of such counties are retirement and resort counties extending from the central Texas hill country through Ozark plateau and lakes, and again parts of Appalachia. Virginia has the largest number of such counties, some just beyond the commuter zone of Washington. Similar areas occur across the far north, characterized by recreation and retirement as well as ex-logging or mining. A third area includes areas in western Montana, popular with California retirees, and a fourth is far northern CA.

    Then there are counties losing population from natural decrease and net internal out-migration. Two-thirds (576) of counties with natural decrease experience this expected pattern of long term decline of resource-based economies. Of these 105 have at least a 50 percent urban population (green on the map), but most (471 of all 861) natural decrease counties are predominantly rural (blue on the map).

    The Great Plains, from Texas though Dakotas and eastern Montana to Nebrasla represents the largest region for natural decrease and populatiob loss. represents the largest region for such losses. This is quintessential high plains farm belt, which continues to experience mechanization, loss of local businesses and out migration of the young for at least 80 years now. But although the large majority of rural counties with net out-migration (blue on the map) are in the Great Plains belt, significant numbers also occur in the forest and mining counties in Maine, Michigan, eastern Oregon, northeastern New York, and northern Appalachia.

    This leaves an interesting scattering of counties from Texas, northern Louisiana, Arkansas, Alabama, and the North Carolina-Virginia border region. These are mainly farming areas, often with significant (35 to 60 percent) Black population shares, largely elderly, areas somewhat “left behind” in the growth of industrialization and urbanization of the south. This is where young Blacks have left for city opportunities, just as young whites have from the prairies and the mines.

    What will the future bring?

    I examined maps of counties with 0 to 1% natural increase, or with high shares of the population between 45 and 64, which are plausible candidates for a shift to natural decrease, but also looked at counties with 0 to 1 % natural decrease, which are candidates for a shift to natural increase.

    The most likely future areas for a shift to natural decrease include many in a wider Appalachian belt, within the greater Mississippi valley from Louisiana to Canada. Hundreds of these counties have the potential to shift to natural decrease by 2025, as the vanguard of the Babyboomers reach 80. The likelihood of the shift does depend on the proximity of the county to vigorous urban and metropolitan areas and on counties’ relative success or failure at attracting retirees. Other commentators have talked of the “slowdown” of migration to and growth of Florida, and the spread of retiree settlement to many other parts of the country. This is already evident on the map, but it is premature to write off Florida’s appeal to retirees, particularly as house prices there have plunged.

    There are also forces that may slow, or even reverse, natural decrease. Northward expansion of the Hispanic population will have the contrary effect of raising birth rates and a shift to natural increase. Some areas that have attracted affluent retiree migrants also could experience sufficient investment to foster more general growth.

    At the same time, the retirement geography of the massive Baby Boomer cohort has the potential of redrawing the map. But overall, I believe we will see more counties experiencing natural decrease.

    This process has now reached around 800 counties. But we will see more of this when the nation approaches ZPG, zero population growth, perhaps after 2050, in many counties

    Richard Morrill is Professor Emeritus of Geography and Environmental Studies, University of Washington. His research interests include: political geography (voting behavior, redistricting, local governance), population/demography/settlement/migration, urban geography and planning, urban transportation (i.e., old fashioned generalist)


    References:
    Morrill, Richard, 1993, The spread of natural decrease, FOCUS,43- 30-33
    Morrill, Richard\, 1994, Aging in place, age specific migration and natural decrease, Annals of Regional Science, 28- 1-26
    Cromartie, John and Kandel, William, 2008 Rural population and Migration-Trend 4,Natural decrease on the rise. Economic Research Service,USDA \
    Cromartie, John and Nelson, Peter, 2008, BabyBoomer migration and socioeconomic change in “no growth’ counties. Paper, Rural Sociological Society.
    Frey, William,, 2004, Generational Pull, American Demographics
    Johnson, Kenneth and Beale, Calvin, 1992, Natural population decrease in the United States, Rural Development Perspectives, 8 , pp 8-15
    Johnson, Kenneth
    Hull, Victor, Retirement choices stretch beyond Florida. 2006,

  • Purple Politics: Is California Moving to the Center?

    You don’t have to be a genius, or a conservative, to recognize that California’s experiment with ultra-progressive politics has gone terribly wrong. Although much of the country has suffered during the recession, California’s decline has been particularly precipitous–and may have important political consequences.

    Outside Michigan, California now suffers the highest rate of unemployment of all the major states, with a post-World War II record of 12.2%. This statistic does not really touch the depth of the pain being felt, particularly among the middle and working classes, many of whom have become discouraged and are no longer counted in the job market.

    Even worse, there seems little prospect of an immediate recovery. The most recent projections by California Lutheran University suggest that next year the state’s economy will lag well behind the nation’s. Unemployment may peak at close to 14% by late 2010. Retail sales, housing and commercial building permits are not expected to rise until the following year.

    This decline seems likely to slow–or even reverse–the state’s decade-long leftward lurch. Let’s be clear: This is not a red resurgence, just a shift toward a more purplish stance, a hue that is all the more appropriate given the economy’s profound lack of oxygen.

    There is growing disenchantment with the status quo. The percentage of Californians who consider the state “one of the best places” to live, according to a recent Field poll, has plummeted to 40%, from 76% two decades ago. Pessimism about the state’s economy has risen to the highest levels since Field started polling back in 1961.

    Inevitably, this angst has affected political attitudes. Though still lionized by the national media, Gov. Schwarzenegger’s approval ratings have fallen from the mid-50s two years ago into the low 30s. The 12% approval rate for the state legislature, according to a Public Policy Institute of California survey in May, stands at half the pathetic levels recorded by Congress.

    Moreover, voters now favor lower taxes and fewer services by a 49-to-42 margin–as opposed to higher taxes and more services. Support for ultra-green policies aimed to combat global warming has also begun to ebb. For the first time in years, a majority of Californians favors drilling off the coast. Californians might largely support aggressive environmental protections, but not to the extreme of losing their jobs in the process.

    Remarkably, state government seems largely oblivious to these growing grassroots concerns. The legislature continues to pile on ever more intrusive regulations and higher taxes on a beleaguered business sector. Agriculture, industry and small business–the traditional linchpins of the economy–continue to be hammered from Sacramento.

    Agriculture now suffers from massive cutbacks in water supplies, brought about in part by drought, but seriously worsened by the yammerings of powerful environmental interests. Large swaths of the fertile central valley are turning into a set for a 21st-century version of Steinbeck’s Grapes of Wrath.

    At the same time, the state’s industrial base is rapidly losing its foundation. Toyota recently announced it was closing its joint venture plant in Fremont, the last auto assembly operation in the state, shifting production to Canada and Texas. Even the film business has been experiencing a secular decline; feature film production days have fallen by half over the decade, as movie-making exits for other states and Canada.

    Most important, California may be undermining its greatest asset: its diverse, highly creative and adaptive small-business sector. A recent survey by the Small Business and Entrepreneurship Council ranked California’s small-business climate 49th in the nation, behind even New York. Only New Jersey performed worse.

    Regulation plays a critical role in discouraging small-business expansion, a new report from the Governor’s Office of Small Business Advocate suggests. Prepared by researchers from California State University at Sacramento, the report estimates that regulations may be costing the state upward of 3.8 million jobs. California currently has about 14 million jobs, down 1 million since July 2007.

    Ironically, the regulatory noose is now slated to tighten even further as a result of radical measures–from energy to land use–tied to reducing greenhouse gases. Another study, authored by California State University researchers, estimates these new laws could cost an additional million jobs.

    Many in the state’s top policy circles, as well as academics and much of the media, dismiss the notion that regulations could be deepening the recessionary pain. Some of this stems from the delusion–always an important factor in this amazing state–that ultra-green policies will actually solidify California’s 21st-century leadership. Few seem to realize that other states, witnessing the Golden State’s economic meltdown, might not rush to emulate California’s policy agenda.

    Internally, discontent with the current agenda seems particularly strong in the blue-collar, interior regions of the state. Brookings demographer Bill Frey and I have described this area as the “Third California.” In the first part of the decade, this region expanded roughly three times as rapidly as Southern California, while the Bay Area’s population remained stagnant.

    Today the Third California represents roughly 30% of the state’s population, compared with barely 18% for the ultra-blue Bay Area. The most conservative part of the state has skewed somewhat more Democratic in recent elections, largely due to migration from coastal California and an expanding Latino population.

    But the intense economic distress now afflicting the interior counties–where unemployment rates are approaching 20%–may now reverse this process. The ultra-green politics embraced by the Democrats’ two prospective gubernatorial nominees-Attorney General Jerry Brown and San Francisco Mayor Gavin Newsom–may not appeal much to a workforce heavily dependent on greenhouse-gas-emitting industries like farming, manufacturing and construction.

    Eventually, the Democrats may rue their failure to run a pro-business, pro-growth candidate, particularly one with roots in the interior region. This oversight could cost them votes among, say, Latinos, who have been far harder hit by the recession than the more affluent (and overwhelmingly white) coastal progressives epitomized by Brown and Newsom. Along with independents, roughly one-fifth of the electorate, Latinos could prove the critical element in the state’s purplization.

    This, of course, depends on the Republicans developing an attractive pro-growth alternative. In recent years, the party’s emphasis on conservative cultural issues and xenophobic anti-immigrant agitation has hurt the GOP in the increasingly socially liberal and ethnically diverse California.

    Although he has proved a poor chief executive, Gov. Schwarzenegger did at least show such a political approach could work. The recent emergence of three attractive Silicon Valley-based candidates, including former eBay CEO Meg Whitman and State Insurance Commissioner Steve Poizner, as well as the likable libertarian-leaning former congressman Tom Campbell, could score well at the polls.

    This political course-correction should be welcomed not only by Republicans but by California’s moderate Democrats and Independents. However blessed by nature and its entrepreneurial legacy, California needs to move back to the pro-growth center if it hopes to revive both its economy and the aspirations of its people.

    This article originally appeared at Forbes.

    Joel Kotkin is executive editor of NewGeography.com and is a distinguished presidential fellow in urban futures at Chapman University. He is author of The City: A Global History. His next book, The Next Hundred Million: America in 2050, will be published by Penguin Press early next year.

  • Perspective on G-20: Don’t Trip on those Green Shoots

    Everywhere you look – from the White House to Wall Street – they are painting a sunny picture of recovery, free from any gloomy ideas. Bernie Madoff is in jail, Goldman Sachs is repaying their bailout money, and everywhere they look they see “green shoots.”

    Yet according to the Congressional Budget Office (CBO), the US economy and federal government are headed for doom. We are on a completely unsustainable path economically and financially. The CBO updated their forecasts after our June piece on the State of the Economy. In their updated Budget and Economic Outlook, CBO clearly concludes that the current rate of high spending and low revenues has the nation on an unsustainable fiscal course. Unemployment won’t drop below 5% until 2014. As a result, according to the latest country risk rankings by Euromoney magazine [http://www.euromoney.com, subscription required for full access] Canada, Australia and most of Scandinavia have passed the US as safer places to invest in business.

    These predictions of doom are, in fact, based on the best-case scenario of 3 percent economic growth next year and 4 percent the year after that; plus the expiration of tax cuts and no new stimulus or bailout packages. Whether we call it a Panic, a Depression, a Recession or a Downturn, it all means the same thing. The nomenclature has been softened over the decades to remove that ever so gloomy feeling folks get when things are bad. If you still have a job, you know someone who has been laid off, had their hours cut, etc. I just received my first new piece of business since February. Things are tough everywhere you look.

    GDP this year ($14,143 billion) is about where it was two years ago in actual dollar terms ($14,180 billion, third-quarter 2007). Accounting for inflation in consumer prices, our economy is closer to the level it was at the end of March 2006 or even back to the end of 2005. Actual dollar GDP peaked in September 2008 but I prefer the regular “real” GDP, adjusted for changes in what a dollar will buy you, which peaked in the third quarter of 2007 – we live in the real world, using real dollars to pay for real things.

    The importance of changes in the real-dollar economy become most obvious when we consider international trade, which has been on the minds of the leaders of the G-20 nations in Pittsburgh this week. The fact that US consumers sustained and even increased their demand for imported goods until the onset of the global recession and in the face of a declining dollar lends credence to President Obama‘s plan to discuss what the world, not just what the US, can do to “lay the groundwork for balanced and sustainable economic growth.”

    On the one hand, our consumption of imported goods contributed to ours and the world’s economic growth. This fuels concern over whether or not the US can keep the promise to not impose new trade barriers before the end of 2010 and the world’s willingness to continue to buy our debt in the form of US Treasury bonds. At the same time, as Kansas City Federal Reserve Bank President Thomas Hoenig said last week in a speech I attended in Omaha, we need the world’s consumers to continue buying US goods in order to maintain our position as the “industrial leader of the world.” It’s a delicate balance, at best.

    The late 2007 nose dive in the “real” economy exposed the trouble brewing on the housing front, when we became aware of the explosion in credit derivatives, and when many of us started warning people about the insanity taking place in U.S. bond markets. No matter how you measure it, we would need about a 3 percent increase in GDP by next summer just to get back to where we were the last time everyone felt good about their money.

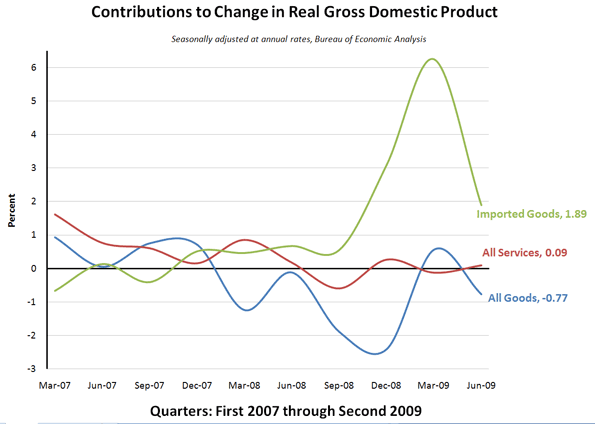
    Data from Bureau of Economic Analysis; author’s calculations

    So, why are we hearing such a positive spin on the economic news? One reason is the lack of understanding among reporters – most of them probably studied literature or journalism in college – not finance or economics. New York Times economics reporter Edmund L. Andrews is a perfect example. He just published a book describing “how he signed away his life for a toxic loan to buy a house in Silver Spring that he couldn’t really afford.” The Washington Post reviewer called the book “bright and breezy.” No gloom there!

    At the same time that he was signing the papers for an outsized mortgage, Andrews was writing articles like this gem from September 1, 2007 – just as the real economy was perched on the edge of the cliff – where he reports on Federal Reserve Bank Chairman Ben Bernanke saying he will “prevent chaos in the mortgage markets from derailing the economy.” The stock market climbed nearly 1 percent that day to close at 13,357.74 – it closed at 9,820.20 last Friday. Yet, Mr. Andrews still has a job with the New York Times – unlike millions of his readers – writing about topics like troubled mortgages.

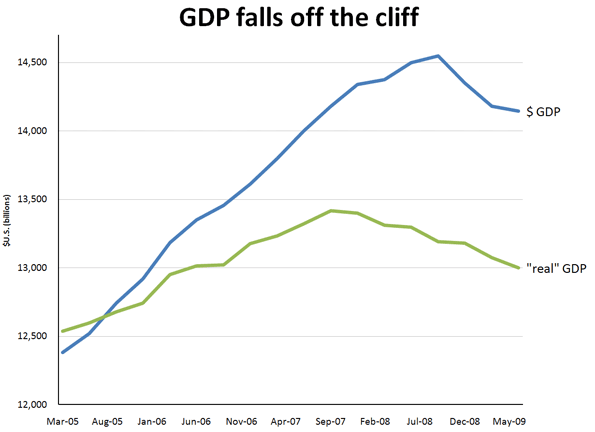
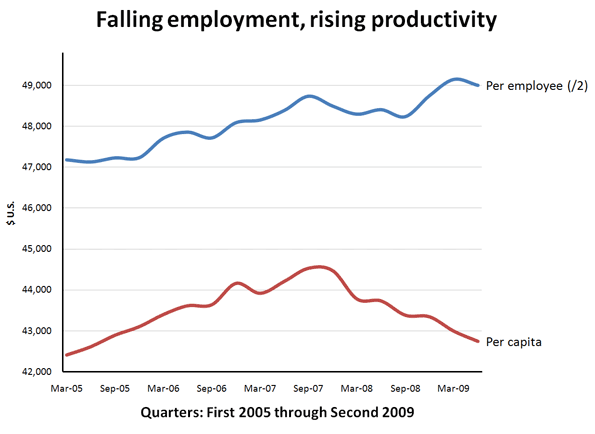
    Data from Bureau of Economic Analysis and Census Bureau. Per employee divided by 2 for scale.

    But what about the recent stock market rise? We should not be surprised if business profits are up: fewer people working means that the output per worker has been increasing since the end of 2008. GDP per capita (per person in the population), on the other hand, has been decreasing since the end of 2007 – an indication of a falling standard of living.

    The next few months are a time to focus, concentrate, plan, and follow-through. We are at a turning point comparable to the beginning of the Industrial Revolution and the system of capitalism that financed it. By frantically printing money and creating credit through bank bail-outs, the Federal Reserve and the Treasury are boosting the stock market by pumping in about $150 billion a month into corporate securities, increased auto sales (with government rebates) and home sales (with government first-time buyer tax credits).

    The problem is that these three pieces – banking, cars and homes – are not the whole economy, and, since they depend on government debt, none of these “green shoots” are sustainable on their own. Keep your eye on the big picture (the Kiplinger Recovery Index is a handy one-stop) – and don’t relax until all the indicators are green.

    Susanne Trimbath, Ph.D. is CEO and Chief Economist of STP Advisory Services. Her training in finance and economics began with editing briefing documents for the Economic Research Department of the Federal Reserve Bank of San Francisco. She worked in operations at depository trust and clearing corporations in San Francisco and New York, including Depository Trust Company, a subsidiary of DTCC; formerly, she was a Senior Research Economist studying capital markets at the Milken Institute. Her PhD in economics is from New York University. In addition to teaching economics and finance at New York University and University of Southern California (Marshall School of Business), Trimbath is co-author of Beyond Junk Bonds: Expanding High Yield Markets.

  • Pittsburgh Renaissance?

    In the third of a three part New Geography series on Pittsburgh for the G-20 summit, Aaron Renn assesses Pittsburgh’s value as a model region for other cities suffering decline.

    As the G-20 leaders prepare to convene in Pittsburgh, expect the recent chorus of praise for that city’s transformation to reach a crescendo. Pittsburgh, once the poster child for industrial decline and devastation, is now the media darling as an exemplar of how to turn it around. The New York Times talks about how “Pittsburgh Thrives After Casting Steel Aside” while the New York Post informs us that “Summer in Pittsburgh Rocks”. The Economist named Pittsburgh America’s most livable city. This emerging reputation for cracking the code on revitalization is prompting struggling burgs like Cleveland and Detroit to ask what lessons the Steel City holds for them.

    But does reality live up to the hype? Has Pittsburgh really turned the corner? For the most part, a look at the data suggests otherwise:

    1. Population Is Shrinking. The city of Pittsburgh has lost over 50% of its population since its peak and it is still declining. Just since the 2000 census Pittsburgh has lost nearly 25,000 people – over 7% of its population. The metro area is shrinking too, making Pittsburgh one of only a handful of large metro areas with the dubious distinction of population decline. Others on that list: Buffalo, Cleveland, Detroit, and New Orleans. Since 2000, metro Pittsburgh has actually lost a greater percentage of its population than metro Detroit.
    2. People Are Leaving. Part of Pittsburgh’s population loss is a result of a rare case of more deaths than births. But the region has net outmigration too. Few other stats are so telling about a city. Is this a place people are voting with their feet to move to or leave from? They may come to school or an internship at a local hospital, but, more often than not, they are not putting down roots. With more people moving out than moving in, Pittsburgh is clearly not a destination city
    3. International Immigrants Are Staying Away. Metro Pittsburgh’s foreign born population percentage was 2.6% in 2000 – very low. The Pittsburgh Technology Council summed it up best when it said, “Our region has negligibly grown its foreign born population.” Contrast Pittsburgh with the national average for foreign born population of 5.7%, and regions like Boston (11.2%), Denver (9.3%), and even Detroit (6.1%).
    4. Poverty Is High. Pittsburgh’s economic area poverty rate is worse than all cities benchmarked against it by Pittsburgh Today at 11.6% versus 9.3% in Milwaukee, 9.9% in Cincinnati, and 10.5% in Cleveland among 14 comparison cities.
    5. The City Is in Debt – Bigtime. Pittsburgh is buried under a mountain of liabilities. Its unfunded pension liability is over $1 billion. Its annual interest on its debt is $352 per capita, far higher than peer cities. Pittsburgh Quarterly is very direct: “Put simply, compared with all the benchmark regions, Pittsburghers have been saddled by their governments with relatively huge amounts of public debt.”

    Still, by other measures Pittsburgh is, if not thriving, certainly outperforming both the Rust Belt and the nation as a whole. Its July metro unemployment rate of 7.8% is well below the national average. In the last 12 months, Pittsburgh lost 2.8% of its jobs, which is a much better performance than regions like Chicago (-4.5%), Atlanta (-4.9%), and Portland (-5.8%). Its housing market, having never boomed to begin with, has not experienced the declines of most of the rest of the country, making it a Rust Belt outpost of the “zone of sanity”.

    Pittsburgh has a large “eds and meds” sector, led by the University of Pittsburgh, whose medical center employs over 25,000 people, and Carnegie-Mellon University. Pittsburgh was early to the game in this approach, with steel fortunes powering the development of these institutions starting in the 1950s. There are now seven universities within a five mile radius of downtown.

    Eds and meds employment is quasi-public sector. It can be a source of stability, but it’s not proved to be the source of dynamism that you see in Silicon Valley, around Boston or even Madison. Sure, there have been some high tech successes in Pittsburgh, but the city is far from a hub of the innovation economy.

    Pittsburgh’s downtown remains an employment center with a density uncommon in a Rust Belt full of cores defined more by parking lots than vital streetscapes. Pittsburgh has long had a rich fabric of dense, urban neighborhoods, and many of those are strengthening. The city’s geography retains its charm, and a lot of former industrial areas along the three rivers have been repurposed for recreational use.

    The truth is that the Pittsburgh story is still being written. It’s still more “green shoots” than a true renaissance so far. Until its migration statistics change course, and it demonstrates sustained and growing economic dynamism, the city cannot claim to have truly turned itself around. Still, the signs of progress are better than in places like Cleveland and Detroit.

    What accounts for this? A few success factors come to mind:

    1. Passion for the City. Older river cities like Cincinnati and New Orleans tend to have strong provincial cultures, with all the good and bad that implies. You see this in Pittsburgh in the unique local “yinzer” dialect, traditions like the cookie table at weddings, and of course the Steeler Nation. There’s a strong attachment to the native soil in Pittsburgh, even for those who left.
    2. Starting Early Into the Cycle. Jane Jacobs pegged Pittsburgh’s economic stagnation to 1910. The steel industry collapsed decades ago. Pittsburgh had troubles before other cities, so it is figuring out how to deal with them before other cities. It takes a long time to recover from a hundred years of status quo thinking.
    3. Shrinkage. There’s no longer a need for a Fort Pitt to project military power. The steel industry is gone and with it the need for thousands of steelworkers. Part of the issue in the Rust Belt is that there is no longer any economic raison d’etre for some of these big cities. Pittsburgh long was too big for its role in today’s economy, so shrinkage was good. This also created the rather unique institution of the Pittsburgh diaspora, best known through the Steeler Nation. Like the Indian and Chinese diasporas, it’s a network of people who went out, made connections in the world, built new skills, etc. that Pittsburgh can now tap into, as tirelessly documented by Jim Russell.
    4. The Totality of the Collapse. On Wall Street they call it “capitulation”, where the markets hit bottom and there is no positive sentiment. You have to hit that bottom to start back up. Pittsburgh went through a civic devastation when the steel industry collapsed the likes of which few American cities have seen. This shock to the system created the conditions necessary for change that a more gradual decline would not have.
    5. Dramatic Educational Improvements. The Chicago Fed reported that Pittsburgh’s national rank for percentage of adults who were high school grads went from 55th to 3rd. And for college grads it went from 69 to 37. These are amazing numbers.

    Is the Pittsburgh model transplantable elsewhere in the Rust Belt? In the short term, no. Pittsburgh’s successes of today are rooted in 30 years of steel industry collapse, shrinkage, and boosting its brain power. The auto industry restructuring eventually might bring a needed jolt to Detroit and other Rust Belt cities, but recovery is a long term game that requires sustained commitment over many years to things like education. Pittsburgh has achieved some of this, perhaps not as spectacularly as the media suggests, but in ways that are still useful for other Rust Belt cities to ponder.

    Aaron M. Renn is an independent writer on urban affairs based in the Midwest. His writings appear at The Urbanophile.

  • Hyping Pittsburgh: With the Global Economy in Dire Straits, Hell with the Lid Blown Off Never Looked Better

    As host of the G-20 summit, Pittsburgh briefly will sit in the global spotlight. In this second article of a three part series featuring Pittsburgh, rust belt observer Jim Russell digs into migration and education trends and what it may mean for the region.

    Chris Briem (the blogger behind Null Space) jokingly called it the “Mystic Order of the Yinzerati”. He would later take the idea about the influence of Pittsburgh expatriates more seriously. I’ve referenced talk about a conspiracy theory involving the diaspora and how the current US President seems to favor the Steel City. How else does one explain the location of the upcoming G-20 economic summit?

    Site Selection magazine is the latest conduit for Pittsburgh’s aggressive image makeover. By now, the narrative is polished. As an active consumer of all media about Pittsburgh, I find the story stale. The lines are well-rehearsed and remind me of an article I read last year in the New York Times or a decade ago in the Wall Street Journal. More often than not, I would discover that the writer of the glowing review has a Pittsburgh connection.*

    Recently, a journalist from Forbes interviewed me about the Pittsburgh renaissance. I mentioned the positive press the city has received and how the Burgh Diaspora seemed to be behind it all. At that point, she confessed that she was from Pittsburgh. The result? Pittsburgh is an archetype for the thriving 21st century city.

    I’m an avid Pittsburgh booster and I would bet that this round of rebranding will finally take root. However, that doesn’t mean I believe everything I read. Left out are all the challenges the region faces. Local bloggers fret about the city pension crisis getting swept under the rug, pointing out that the many myths used to promote Pittsburgh are disingenuous. Some natives have gone so far as to suggest that all the propaganda is nothing more than gilding a turd. After all, the population of Pittsburgh is still in decline. What about the brain drain?

    Ironically, the brain drain from Pittsburgh is the reason why I’m so bullish on this region’s future. Taking notice of the prolific Yinzerati, I began to see talent out-migration in a different light. Not every Rust Belt city could marshal the kind of sustained campaign that has benefited the New Pittsburgh. The more fantastic the fabrication, the more impressive the media blitz would seem. Surely expatriates from other shrinking cities could do the same. I’ll tell you why they haven’t.

    As brain drain is commonly understood, every region suffers from the same affliction. But the exodus from Pittsburgh was exceptional. Chris Briem charted the difference between unemployment rates in Pittsburgh and the national average from 1970 to present day. You might note that right now, never has the job market looked relatively better. What should really stand out is how bad the economy was in the early 1980s. It was a remarkable period of out-migration for young talent, robbing Pittsburgh of almost an entire generation.

    As I began to understand the connection between educational attainment and geographic mobility, I speculated that Pittsburgh’s brain drain was the result of a substantial investment in local human capital. The chronic decline in population is the result of successful workforce development policy. At least, that was my theory.

    Bill Testa, who works for the Federal Reserve Bank of Chicago, provided the evidence I was seeking. Compared with other Rust Belt cities and the nation over the period 1969-2006, Pittsburgh has anemic total employment growth. Strangely, Pittsburgh is a cohort outlier (in positive respects) if we consider gains in per capita income.

    Testa hints at the reason behind the surprising statistic:

    While Pittsburgh ranked low in college attainment in 1970, its gains in this metric since then have been the most rapid. Perhaps not accidentally, Pittsburgh’s growth in per capita income also outpaced other cities in the region.

    Pittsburgh did a great job of educating its populace. This policy would betray the region during the hard times of the early 1980s. Dynamic labor mobility found expression in the only avenue available, relocation. The Mysterious Order of the Yinzerati was born.

    Pittsburgh hasn’t been able to cash in on the diaspora dividend until the last decade. As I noted above, positive spin about Pittsburgh isn’t anything new. During the early 1990s, the work of urban planner Paul Farmer was nationally admired. Cities such as Minneapolis hoped to mimic Pittsburgh success. Former mayor Tom Murphy, not remembered fondly in Pittsburgh, enjoys a strong reputation as a wizard of downtown revitalization almost everywhere else. I imagine the Burgh Diaspora actively evangelizing their hometown’s dramatic transformation. But if anyone was listening, they didn’t move there on the advice of these expatriates.

    The demographics quietly improved. What little immigration there was tended to be highly educated. Furthermore, the numbers of college educated residing in Pittsburgh are becoming more concentrated. All the while the population continues to decline and that’s what makes the front page, which brings me back to positive publicity push leading up to the G-20.

    Pittsburgh is finally ready to take advantage of the spotlight. With the global economy in dire straits, hell with the lid blown off never looked better. The underlying numbers, such as unemployment, are relatively strong. Pittsburgh is a place of brain gain, not drain. When national growth returns, people will begin to move again. Pittsburgh will be one of the places they will consider.

    Thanks to the considerable influence of the Yinzerati, historic federal expenditures will rain down on the land of Three Rivers. Chris Briem can tell you how many Yinzers end up in Washington, DC. Or, ask the head coach of the Washington Redskins. The point is that even if you don’t know much about Pittsburgh, many people inside the beltway do. The G-20 is just the tip of the iceberg.

    *For the record, my Pittsburgh connection is through my wife who grew up in the North Hills.

    Read Jim Russell’s Rust Belt writings at Burgh Diaspora.

  • Play It Cool at the G-20, Mr. President

    Barack Obama goes to this week’s Pittsburgh G-20 with what seems the weakest hand of any American president since Gerald Ford. In reality, he has a far stronger set of cards to play — he just needs to recognize it.

    Our adversaries may like our new president, but they don’t fear him. And, on the surface, why should they? The national debt is rising faster than the vig for a compulsive, debt-ridden gambler. And our primary rivals, the Chinese, continue to put the squeeze on American producers by devaluing their currency, subsidizing exports and penalizing imports.

    When the Chinese threaten to call in their debts, they can count on Timmy Geithner to kowtow like an obedient vassal. Some of Obama’s most important supporters — like Warren Buffett and The New York Times‘ Thomas Friedman — have discovered what Friedman calls “the great advantages” of autocracy over our cockamamie, boisterous democracy.

    From Virgil, Maecenas and the court of August to Hitler-admirers Henry Ford and George Bernard Shaw, as well as Stalin-fan Max Eastman, imperial scribes and money lenders have long demonstrated a weakness for even the worst autocrats. But our bedraggled democracy may have a lot more aces to play than many recognize.

    Just look at the other players around the table. French President Nicolas Sarkozy, when not worrying about his (lack of) height, tells his countrymen to stop worrying about gross domestic product. Productivity, one presumes, doesn’t mean as much as a good baguette, long vacation or wet kiss from a former model.

    Across the channel, Prime Minister Gordon Brown seems determined to take the Good Ship Brittania further underwater. According to Tony Travers of the London School of Economics, Britain, with the exception of London, is already well on its way to becoming “a second- or third-tier country.” And as my colleague Ryan Streeter points out, New Labour’s response to the economic crisis — basically raising taxes and doubling down on regulation — doesn’t seem a formula for a vibrant economy.

    Germany, Italy, Spain and the rest of E.U. face equally daunting problems. These “progressive” role models suffer from unsustainably low birthrates, and many face a future more Islamic than European. Their “green” rhetoric may thrill some fans in the U.S., but these economies still run largely on oil and natural gas, which makes them ever more dependent on the autocrat of all — Russia.

    And Japan, once considered the mega-tiger of the future by American policy wonks, is transforming itself into something of a post-modern pussycat. It won’t take immigrants even as its population begins to shrink. Largely dependent on exports, its new government does not like globalization and wants to expand its welfare state. Moreover, Japan seems to be wobbling toward a future as a quiescent vassal for the Greater Chinese East Asian sphere.

    So how does America compare? Let’s start with the basics. The U.S. is the only major advanced country that enjoys a steady population increase. Yes, immigrants are driving much of that growth, but our newcomers are generally very different from the largely alienated and isolated Muslim communities now nesting in Europe. America’s Mexicans, Chinese, Indians, Armenians, Caribbeans and Africans — and more pointedly Arabs and Iranians — do not constitute a hostile “them.” Instead they are the ones redefining us by adding new dimensions to what Nathan Glazer once described as “a permanently unfinished country.”

    Of course, it helps to be the only serious global military presence in the world. A strong military represents an invaluable asset in a world dominated by autocrats and lunatics. That doesn’t mean Obama should swagger like a Viagra-enhanced neo-con. He just needs to follow Teddy Roosevelt’s dictum: Speak softly, but keep a hold on that big stick.

    A powerful military and better demographics represent just part of America’s strong hand. Compared with the E.U., Japan, China or even India, the U.S. remains phenomenally rich in resources.

    Take our most basic need: food. The U.S. has the most arable land in the world and is its largest food exporter. Our $1.4 trillion food sector accounts for 12% of our economy, and prospects for expansion are enormous. By 2050, the population of the planet will be around 9 billion people — up from 6 billion today. More than 85% of the world’s population will reside in developing countries, most in cities, and they will constitute a gigantic future market.

    Equally important, the U.S. is sitting on huge energy resources. Of course, renewable fuels should become a major, even dominant, factor, but in the short- and maybe mid-term, oil, gas and even coal will continue driving the economy. The Great Plains and even the Northeast, particularly Pennsylvania, have enough natural gas to become a junior Abu Dhabi.

    Furthermore, despite its many weak links, our industrial base remains the most advanced in the world. If mindless “green” policies don’t force us to dismantle it, we could produce, through the use of new technology and a better-trained workforce, virtually everything we buy from the Chinese and the Europeans.

    This is not to argue for strict protectionism. But right now we buy almost $4.50 from the China for every $1 we sell there. China’s trade with us is worth 13 times to its economy what our trade with them is worth to us.

    Fundamentally, this means that the Chinese are more exposed to a potential trade war than we are. Without rising exports to the U.S., China’s leaders could face massive unemployment and internal unrest. For us, reducing Chinese imports means somewhat higher prices at Wal-Mart — and perhaps more vigorous business with better partners such as Mexico, whose future prosperity is directly tied to ours.

    All this suggests that Obama has more leverage to demand better trade terms than some might think. There’s nothing in the Constitution that mandates that Americans be the world’s trade chumps. So you want trade war, President Hu? Give him a little Clint Eastwood. Make. My. Day. Then give them a wink or a chance to think about it.

    How about the $1.5 trillion that the Chinese are holding? Well, they could call in their $1.5 trillion for yen or euros, ruining those economies by inflating their currencies. Polish zlotys? Iranian rials?

    Of course, losing Chinese investors and cheap products would hurt in the short term, but it could prove beneficial in the long run. After all, during World War II, we learned to thrive without German machinery or Southeast Asian rubber. Best of all, a Chinese withdrawal could force Washington to live on a budget, just like the rest of us.

    None of this suggests that Obama should discard his charm and morph into a svelte Dick Cheney. America’s preeminence rests on far more than missiles, resources, land or machines. The U.S. is more than a geographic place, or the home of a race, but, as Lincoln noted, the great human experiment about self-government and individual aspirations.

    Whatever his faults — and there are plenty — Obama epitomizes this ideal with his very being. When he arrives in Pittsburgh, our president should play the American hand like the guy who knows he holds aces in the hole.

    This article originally appeared at Forbes.

    Joel Kotkin is executive editor of NewGeography.com and is a distinguished presidential fellow in urban futures at Chapman University. He is author of The City: A Global History. His next book, The Next Hundred Million: America in 2050, will be published by Penguin Press early next year.

    Photo: White House Photo/Pete Souza

  • Baseball Goes For Broke

    Other than the banking business, is there an industry more dependent on government handouts, sweetheart tax breaks, and accounting gimmicks than major league baseball?

    What other than a baseball depletion allowance explains the economics of a team like the New York Yankees, which is paying Alex Rodriguez $275 million over ten years while building a new $1.3 billion stadium and charging front row season tickets holders $800,000 for a box of four seats?

    If the rules of baseball included free enterprise, the Yankees would be playing on a diamond in Central Park, and skyboxes (which would not be deductible business expenses) would be limited to nearby apartment buildings.

    What accounts for all the growth in baseball economics — the salaries, the extortionate ticket prices, the new stadiums — is that the game varies little from some nineteenth century oligopoly trust, not unlike J.P. Morgan’s railroads or Andrew Carnegie’s steel mills.

    Let’s start with the basics: Since 1922, baseball has enjoyed anti-trust exemption, which means that league owners (best understood as robber barons) cannot move teams about willy-nilly. At the same time, the law makes it nearly impossible for competitors to establish rival competing franchises.

    The Yankees coughed up $1.3 billion for their new Yankee Stadium (of which local and state government are in for about $520 million) with the knowledge that neither the Royals nor the Pirates are allowed to move their home games to the Bronx or Brooklyn.

    The reason state and municipal governments — not just in New York, but all over the country — put taxpayer money into stadium white elephants is because voters identify more passionately with their professional teams than they do with their local politicians. Imagine the vote in New York if the choice was between Derek Jeter and Governor David Patterson?

    Just because modern baseball is fixed with more precision than the 1919 World Series was does not mean that the game (or at least a number of its teams) will not someday go bankrupt.

    Anti-trust exemptions, Tammany Hall municipal bond financings, and incestuous cable franchise awards may explain why teams like the New York Mets feel that they can spend $12 million a year on pitcher Oliver Perez. But it does not mean that they will be able to cover their obligations when the economy goes O-for-August (as once happened to Darryl Strawberry).

    To best understand baseball economics, think of the sport as similar to the investment banking business: a few large market firms (that have monopoly pricing power and cozy government relations) and then a lot of boutique establishments betting the franchise on some out-of-the-money option (Milton Bradley, Alfonso Soriano, and Alex Rios come to mind). The 2009 payroll for the Yankees is $201 million; for the Florida Marlins, it’s $36 million.

    To close the gap between rich and poor teams, municipalities from Philadelphia ($173 million) to Seattle ($392 million) have subsidized new stadiums, on the hope that sky-boxed, sellout crowds will allow team owners, usually mayoral pals, to pay for free agents. In turn, winning teams are to do for the local economy what the stimulus money may fail to achieve, namely, provide faith in the political system and interest cover for outstanding municipal bonds.

    Keep in mind that the baseball season is shorter than that for gladiolas. Many teams are out of the playoffs by July 4th, which means that the big, revenue-paying crowds must be attracted in the first three months of the season…when Kansas City fans still believe that they have a chance. Not long ago a double header between the Reds and Pirates started and ended with about seventy-five, yes that’s 75, fans in the stadium.

    Is it any wonder that the players union and many team managements, the Yankees included, turned a blind eye to steroids in order to pump up their products? In banking, executives went into sub-prime, hedge funds, and pyramid schemes to cover their bonuses. In baseball, the clear and the cream explain how the owners figured they would be able to afford the likes of Manny Ramirez.

    No one quite knows the precise debt figures of major league baseball, but the liability side of the balance sheet looks something like this: the league itself funds money-losing teams with a revolving line of credit, drawn against anticipated television rights. That’s like borrowing against next year’s equity in a house that has yet to be built.

    As for team debts, some franchises backload free agent contracts in order to defer liabilities until a new general manager may be on the job or the team has won a wild card game. Plus many teams have huge debts on new stadiums and skyrocketing payrolls. Even the Detroit Tigers, who play in a ghost town, run up $115 million per year.

    By my calculations, the Tigers would have to attract an average of about 40,000 fans per game, paying $35 a ticket, just to break even. In 2008, they averaged 25,000 fans a game, and I bet a lot of the unemployed autoworkers who attended didn’t pay $35 a ticket. Some of the debt service for the new Detroit stadium needs to be covered with casino money from an Indian reservation. (Pete Rose’s problem was that he played in casinos but did not own one.)

    To be sure, the plug figures in major league baseball’s finances are the local and national television contracts, not to mention the intramural luxury tax that has rich teams helping out the poor. National television revenue amounts to about $400 million per year, much of which is shared with the teams. That’s another attraction of anti-trust exemption; it limits supply. Why share the pie with, say, a hundred owners?

    Total revenue in the sport is about $6 billion, or an average of $200 million per major league team. Overall, baseball economics would work only if fans were prepared to spend $200 per game on warm beer and cold hot dogs, and renew cable television subscriptions to get games that have little meaning after July.

    The model is also predicated on the assumption that corporations can write off $800,000 in season ticket subscriptions, that the Internet does not blow away TV ads, and that Mariners fans will show up in September to watch their $99 million team wallow 10 games out of first place.

    If I had to bet on an MLB franchise going broke, my action would be on the Mets, who after all play in the House That Sub-prime Built, “Citi Field.”

    Not only did the owners, the Wilpon family, bet the ranch with Bernie Madoff, but they also spent $850 million on the new ballpark, and $25 million (over four years) on the likes of second baseman Luis Castillo. Attendance is down about 20 percent from 2008, and that’s before the team collapsed in the standings or bankrupt ex-Met Lenny Dykstra started sleeping in his car.

    Of course, baseball is no more exposed to the vagaries of the free market than is the banking business. Federally-funded banks, for example, can discount government-granted cable contracts, and pump money into the sport. Or a city like Washington can bailout another failing franchise, as it did with the Expos, and tax dollars can build a second $611 million stadium near the Potomac.

    Anti-trust exempted owners can even mothball a few teams (as they tried to do to the Twins a few years back), and boost the revenue share in that manner. Think of Commissioner Bud Selig’s office as a variant on the Texas Railroad Commission.

    Nevertheless, financial failure is nothing for baseball to dread. The only reason the Yankees could acquire Babe Ruth from the Red Sox in 1919 is because the Boston owner needed cash to invest in the Broadway show, “No, No, Nanette.” Maybe if they are squeezed, the Wilpons can swap Oliver Perez for some of their Madoff paper? At the very least they could get behind the sure hit, “Bye, Bye, Bernie.”

    Matthew Stevenson was born in New York, but has lived in Switzerland since 1991. He is the author of, among other books, Letters of Transit: Essays on Travel, History, Politics, and Family Life Abroad. His most recent book is An April Across America. In addition to their availability on Amazon, they can be ordered at Odysseus Books, or located toll-free at 1-800-345-6665. He may be contacted at matthewstevenson@sunrise.ch.

  • Healthcare: The Cost Of The Greatest Wealth

    This week and over the coming weeks the media and the nation will once again focus on healthcare. Before we launch into the next phase of the argument, though, we should first dismiss a couple of “Red Herring” claims that we spend too much on health care.

    These claims are the ones based on a view of healthcare spending as a percentage of Gross Domestic Product (GDP), or that look at the increase in healthcare spending over time. Proponents say that spending 14 to 17 percent of gross product on health care is evidence that we spend too much. Or, they say that health care spending is increasing at a far faster rate than the economy is growing.

    So what?

    There is no optimal amount of healthcare as a percentage of GDP. Remember, healthcare is a good thing.

    We live far healthier and longer lives today than we did just a few decades ago. The technology is constantly improving, and marginal improvement is expensive. Life expectancy, both at birth and conditional on age, is constantly increasing; our population is getting older. Our income has been increasing, at least it was prior to the recession, and I’m confident that it will eventually resume growing. All this would imply that we would expect to see increasing healthcare spending. As Virgil said, “the greatest wealth is health.”

    That is not to say that there is no waste in our healthcare system today. We do way too much diagnostic testing in the United States. Our doctors work in constant fear of lawsuits. Consequently, they order far too many diagnostic tests and procedures. The problem is that in a U.S. court — long after the fact and with years to reflect — any test that would have diagnosed the problem always looks as if it would have been the right thing to do. This is true even if not one in a thousand doctors would have performed the test in the same situation.

    In contrast, some countries have special courts for the medical industry. These courts are well-versed in the reasonable procedures and diagnostics that competent, reasonable doctors would perform. Consequently, there are fewer suits, smaller judgments, and less money spent on unnecessary diagnostic tests or procedures. Implementing something like this, or some other tort reform, would lead to potentially huge savings.

    In addition, American healthcare is still a paper-based system. Even after just about every other sector has converted to computer-based record-keeping, the medical sector persists in maintaining paper files. There are estimates that as much as a $300 billion could be saved by digitizing medical records while improving service and health care.

    Arthur Laffer, in an August 5, 2009 Wall Street Journal opinion piece, argued that the problem with US healthcare is that the payer of healthcare services and the user are not the same person or entity. He correctly pointed out that this creates a wedge that enables excessive consumption of healthcare. It’s as if you had a brother-in-law who eats hamburgers, French fries and sodas when he pays his own dinner bill, but orders prime rib and wine when you purchase his meal. He may also be willing to use a generic drug if he is paying for his medicine, but will insist on a more expensive name-brand if someone else is paying. Laffer argues that a private, low-cost, high deductible, catastrophic insurance program would be more efficient. Basically, he wants to let the markets work.

    That’s a great idea. But there is no way we will let markets work. Efficient markets would require that we pay for insurance or medical care or go without.

    It is not going to happen. As a nation, we’re not about to let someone suffer or die because they didn’t purchase insurance, or they can’t pay the deductible, or they can’t afford insurance or medical care.

    A market-driven, high-deductible catastrophic plan would work just fine for many people, but it won’t work for everyone. Some people just can’t afford medical care or insurance, and we have lots of potential ways to help them. A progressive negative income tax could provide a minimal standard of living that included healthcare and an incentive to work, but there are other ways. The government could provide medical care or insurance, or it could simply require that medical providers perform an adequate amount of pro-bono work.

    The real problem lies with people who can afford to purchase insurance, but who rationally may choose to be uninsured—call them the intentionally uninsured. A healthy young person could very well elect to be uninsured, even if we were to allow him or her to suffer the consequences of an uninsured accident or disease. Knowing that we are unwilling to let him face those consequences only makes the decision to be uninsured more attractive.

    How to deal with this incentive problem? Require medical financial responsibility, even though the approach would face some challenges. The result could be something parallel to the requirements California and other states have for automobile drivers. To qualify for a driver’s license, or to register your vehicle, you have to have insurance. Even with these requirements in place, I don’t know of anyone who drives without additional insurance protection for encounters with uninsured motorists.

    Of course, you don’t need a license to live. Knowing that medical treatment is available if needed, many would go uninsured. The question of how we should deal with the intentionally uninsured when they come into the emergency room is a real problem with important implications. These are people who would contribute more than they would consume, and cut the cost to other recipients. It would also increase total spending on health care, as the people would access service more often if they were insured.

    But that’s OK… health care is a good thing.

    Bill Watkins is a professor at California Lutheran University and runs the Center for Economic Research and Forecasting, which can be found at www.clucerf.org.