Category: housing

  • The Cities Where Your Salary Will Stretch The Furthest 2015

    Average pay varies widely among U.S. cities, but those chasing work opportunities would do well to keep an eye on costs as well. Salaries may be higher on the East and West coasts, but for the most part, equally high prices there mean that the fatter paychecks aren’t necessarily getting the locals ahead.

    To determine which cities actually offer the highest real incomes, Mark Schill, research director at Praxis Strategy Group, conducted an analysis for Forbes of the 53 largest metropolitan statistical areas, adjusting annual earnings by a cost factor that combines median home values from the U.S. Census (20%) with a measure of regional price differences from the U.S. Bureau of Economic Analysis (80%).

    The takeaway: When cost of living is factored in, most of the metro areas that offer the highest effective pay turn out to be in the less glitzy middle part of the country. 

    Ranking first is the Houston-the Woodlands-Sugar Land metro area, followed by one high-cost outlier: San Jose-Sunnyvale-Santa Clara, Calif., aka Silicon Valley. Although average wages in the San Jose area are $38,000 higher than Houston’s $60,096, the much lower cost of living in Houston means residents there are effectively slightly better off. Adjusted for costs, Houston’s average real income is $62,136. A big contributing factor is Houston’s low home prices: the ratio of the median home price there ($215,000 in the third quarter) to median annual household income is 3.1, compared to 7.5 in the San Jose area (median 3Q home price: $795,000).

    San Jose’s high ranking is somewhat of an anomaly: the very high salaries paid by the tech industry in a metro area made up of largely affluent suburban communities go a long way to make up for the high prices. San Jose’s prices were the third highest among major U.S. metro areas in 2013, the most recent year for which the BEA has data — 21.3% above the national average — while the average annual wage of $98,247 as of this year ranks first.

    Another example of a higher-cost success story is the Hartford, Conn., metro area, which ranks fourth on our list with adjusted annual real earnings of $54,590. One of the lowest-density regions in the country, it boasts many small, prosperous communities with high housing prices surrounding a largely impoverished but small core city (population: 125,000 ). In 2011, the Harford metro area was ranked by Brookings as the most productive metropolitan region in the world.

    But for the most part, it’s the low-cost heartland that dominates the top 15 of our ranking of Cities Where Your Salary Stretches The Furthest. Manufacturing powerhouse Detroit-Warren-Dearborn ranks third with cost-adjusted annual earnings of $55,950. The metro area is comfortably affordable, including an average home price value of $136,400, but also boasts strong wages given the area’s high concentration of factory and engineering jobs, which tend to pay better than other industries, particularly for blue-collar workers.

    Low costs are an advantage that unites a number of the top-ranked heartland metro areas, including Cleveland-Elyria (seventh), where prices of goods and services are 10.5% below the national average, and Cincinnati (ninth), where prices are 9.5% below the national average. In all these areas, the cost of a house is about 20% of what passes for normal in Silicon Valley.

    Hip, But Increasingly Not Worth It

    Perhaps the biggest surprise in our survey is the low rankings of the “cool” cities that are widely discussed as the places that offer the best economic opportunities.

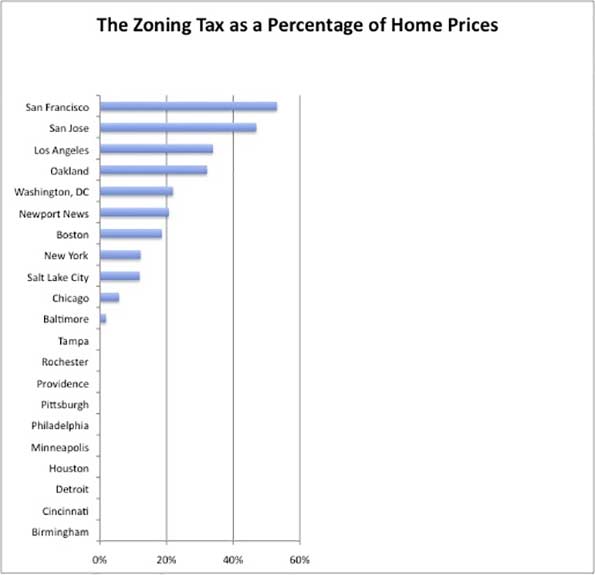
    Take for instance San Francisco, a city that has become the epicenter of “disruptive” tech companies Uber, Lyft, Airbnb, Salesforce.com that are changing our service economy, as well as Twitter. With an average annual salary of $74,794, you would think people would be fat and happy in Baghdad by the Bay. But soaring home prices — median value, $657,300 — have raised costs so high that the area ranks a poor 41st on our list.

    The tech boom has also raised prices in Austin, which ranked fifth when we last did this ranking in 2012, but falls to 19th this year. Over the past year, the average home value in the Texas capital has risen by $24,000, twice the increase experienced in the rest of the country. Median prices now average $217,9000, well above the national median of $188,000 for all large metropolitan regions. This is still not ridiculous, but costs do seems to be eroding some of Austin’s still powerful advantage.

    Similarly, greater New York City also fared poorly, ranking 33rd, in large part due to high housing prices and the overall cost of living: prices there are 22.3% above the national average, according to BEA data, making it the second-costliest metro area in the nation.

    Some of the biggest gaps between cost of living and salary are in Southern California, which has experienced significant house price gains without the income growth that makes San Jose more competitive. Already high, prices in San Diego-Carlsbad (51st), Los Angeles-Long Beach-Anaheim (52nd) and Riverside-San Bernardino (last among the 53 largest metro areas) have all risen considerably above the national average.

    Long-Term Implications

    Our paycheck analysis does not impact everyone equally. Given the central role of housing, for example, long-term residents who bought their homes before prices began to rise dramatically can keep a bigger portion of their take-home pay, and if they decide to sell, they’ll benefit greatly from inflated values. More directly impacted may be young adults and immigrants, most of whom do not own their own homes, and often lack the resources to buy in the more expensive markets.

    Over time this could influence where young families and singles chose to migrate. Since 2010, according to an upcoming study by Cleveland State’s Center for Population Dynamics, there has been a marked shift of college educated workers aged 25 to 34. While between 2008 and 2010, metro areas like San Francisco, New York, Los Angeles, San Jose and Chicago enjoyed the biggest upticks in this coveted population, over the most recently studied period, 2010-13, the leaders were generally less expensive places like Nashville, Pittsburgh, Orlando, Cleveland, San Antonio, Houston and Dallas-Ft. Worth.

    This suggests that areas that have both high-wage jobs and low costs are likely to gain momentum in coming years, particularly if the economy expands. This is not to say that people do not like the excitement and culture associated with San Francisco, Los Angeles or New York, but many may be finding that the price of admission to these fabled places may be too high.

    This could be a great opportunity for less-heralded communities, from Arizona and Texas to Ohio, to gain more educated workers and the companies that require them.

    Metropolitan Average Annual Earnings Adjusted for Cost of Living and Home Values
    Rank MSA Name Adjusted Ave Annual Earnings
    1 Houston-The Woodlands-Sugar Land, TX $62,136
    2 San Jose-Sunnyvale-Santa Clara, CA $56,147
    3 Detroit-Warren-Dearborn, MI $55,950
    4 Hartford-West Hartford-East Hartford, CT $54,590
    5 Dallas-Fort Worth-Arlington, TX $54,497
    6 Atlanta-Sandy Springs-Roswell, GA $53,922
    7 Cleveland-Elyria, OH $53,841
    8 Pittsburgh, PA $53,726
    9 Cincinnati, OH-KY-IN $53,405
    10 St. Louis, MO-IL $53,115
    11 Charlotte-Concord-Gastonia, NC-SC $52,508
    12 Birmingham-Hoover, AL $51,710
    13 Kansas City, MO-KS $51,460
    14 Memphis, TN-MS-AR $51,339
    15 Boston-Cambridge-Newton, MA-NH $50,373
    16 Columbus, OH $50,369
    17 Chicago-Naperville-Elgin, IL-IN-WI $50,351
    18 Nashville-Davidson–Murfreesboro–Franklin, TN $50,168
    19 Austin-Round Rock, TX $50,154
    20 Minneapolis-St. Paul-Bloomington, MN-WI $50,117
    21 Indianapolis-Carmel-Anderson, IN $49,790
    22 Oklahoma City, OK $49,771
    23 Seattle-Tacoma-Bellevue, WA $49,514
    24 Philadelphia-Camden-Wilmington, PA-NJ-DE-MD $48,976
    25 Louisville/Jefferson County, KY-IN $48,807
    26 Milwaukee-Waukesha-West Allis, WI $48,341
    27 Denver-Aurora-Lakewood, CO $48,287
    28 Washington-Arlington-Alexandria, DC-VA-MD-WV $48,102
    29 Buffalo-Cheektowaga-Niagara Falls, NY $48,071
    30 New Orleans-Metairie, LA $47,956
    31 San Antonio-New Braunfels, TX $47,837
    32 Rochester, NY $47,660
    33 New York-Newark-Jersey City, NY-NJ-PA $47,649
    34 Jacksonville, FL $47,230
    35 Raleigh, NC $47,164
    36 Richmond, VA $47,002
    37 Grand Rapids-Wyoming, MI $46,480
    38 Phoenix-Mesa-Scottsdale, AZ $46,281
    39 Tampa-St. Petersburg-Clearwater, FL $45,826
    40 Baltimore-Columbia-Towson, MD $45,184
    41 San Francisco-Oakland-Hayward, CA $45,082
    42 Portland-Vancouver-Hillsboro, OR-WA $44,451
    43 Salt Lake City, UT $43,857
    44 Sacramento–Roseville–Arden-Arcade, CA $43,254
    45 Miami-Fort Lauderdale-West Palm Beach, FL $42,976
    46 Las Vegas-Henderson-Paradise, NV $42,960
    47 Providence-Warwick, RI-MA $42,827
    48 Orlando-Kissimmee-Sanford, FL $42,463
    49 Tucson, AZ $42,264
    50 Virginia Beach-Norfolk-Newport News, VA-NC $42,226
    51 San Diego-Carlsbad, CA $37,395
    52 Los Angeles-Long Beach-Anaheim, CA $35,691
    53 Riverside-San Bernardino-Ontario, CA $34,040
    Figure is the average annual wages, salaries and proprietor earnings adjusted for cost of living usine BEA Regional Price Parities (80%) and variation in Census median home value among the 53 regions (20%). Data Sources: EMSI 2015.2 Employment Data, U.S. Bureau of Economic Analysis Regional Price Parities, U.S. Census American Community Survey
    Analysis by Mark Schill, mark@praxissg.com


    This piece first appeared at Forbes.com.

    Joel Kotkin is executive editor of NewGeography.com and Roger Hobbs Distinguished Fellow in Urban Studies at Chapman University, and a member of the editorial board of the Orange County Register. He is also executive director of the Houston-based Center for Opportunity Urbanism. His newest book, The New Class Conflict is now available at Amazon and Telos Press. He is also author of The City: A Global History and The Next Hundred Million: America in 2050. He lives in Orange County, CA.

    Photo by w:Flickr user Bill Jacobus [CC-BY-2.0], via Wikimedia Commons

  • How Land Use Regulations Hurt the Poor

    Sandy Ikeda and I have published a new Mercatus paper on the regressive effects of land use regulation. We review the empirical literature on how the effects of rules such as maximum density, parking requirements, urban growth boundaries, and historic preservation affect housing prices. Nearly all of the studies on the price effects of land use regulations find that — as supply and demand analysis would predict — these rules increase the price of housing. While the broad consensus on the price effects of land use regulations is probably to no surprise to Market Urbanism readers, some policy analysts continue to insist that in fact rules requiring detached, single family homes help cities maintain housing affordability.

    Ed Glaeser, Joseph Gyourko, and Raven Saks estimate the effects of regulations on house prices in their paper “Why Is Manhattan So Expensive? Regulation and the Rise in Housing Prices.” They estimate what they call the “zoning tax” in 21 cities. The zoning tax indicates the proportion of housing costs that are due to land use regulations. The chart below shows the percentage of housing costs that this “tax” accounts for:

    The zoning tax as calculated by Edward Glaeser, Joseph Gyourko, and Raven Saks in 'Why Is Manhattan So Expensive? Regulation and the Rise in House Prices' (2003).

    The zoning tax as calculated by Edward Glaeser, Joseph Gyourko, and Raven Saks in “Why Is Manhattan So Expensive? Regulation and the Rise in House Prices” (2003).

    Policies that increase housing costs have a clear constituency in all homeowners, but they hurt renters and anyone who is hoping to move to an expensive city. The burden of land use regulations are borne disproportionately by low-income people who spend a larger proportion of their income on housing relative to higher income people. These regressive effects of land use policy extend beyond reducing welfare if the least-advantaged Americans. Additionally, rules that increase the cost of housing in the country’s most productive cities reduce income mobility and economic growth.

    In our paper Sandy and I also discuss proposals for reducing the inefficiency of cities’ current land use regulation practices. David Schleicher has proposed some of innovative policy improvements, including a zoning budget that a city can implement to commit itself to permitting a certain amount of new development. A zoning budget would create a situation in which local policymakers are forced to make tradeoffs between different land use restrictions, as opposed to the current situation in which there is no limit to policies restricting building. Another proposal that Schleicher suggests is a tax increment local transfer, or a TILT. With TILTs, homeowners who live near new development would receive some portion of the additional property taxes that the city raises by allowing the development. The purpose of TILTs is to reduce NIMBY opposition to development.

    We hope that our paper will be a helpful resource to those looking for an accessible overview of this area of research and point to future research opportunities for institutional reforms to allow for the construction of affordable housing.

    This piece first appeared at Market Urbanism.

    Emily Washington is a policy research manager for the Mercatus Center at George Mason University. She manages the Spending and Budget Initiative and State and Local Policy Project portfolios. Her writing has appeared in USA Today, The Christian Science Monitor, Economic Affairs, and The Daily Caller. She contributes to the blogs Neighborhood Effects and Market Urbanism.

  • A Question of Values: Middle-Income Housing Affordability

    This is the Executive Summary from a new report “A Question of Values: Middle-Income Housing Affordability and Urban Containment Policy" authored by Wendell Cox and published by the Frontier Centre for Public Policy. Ailin He, a PhD doctoral candidate in economics at McGill University served as research assistant.

    The "report is a public policy narrative on the relationships between urban containment policy, housing affordability and national economies. It is a synthesis of economic and urban planning analysis that is offered as a policy evaluation of urban containment. The analysis is presented in the context of higher-order objectives of domestic policy: improving the standard of living and eradicating poverty" (Page 9). The research focuses on the international experience, especially in Canada, Australia, New Zealand, the United Kingdom and the United States. Download the full report (pdf) here.

    Middle-income housing affordability is important to people and the economy: Canada’s house prices have risen more than house prices in most other high-income nations. This is of concern, because higher house prices reduce discretionary incomes, which defines the standard of living and poverty. If discretionary incomes are reduced, households will have less to spend on other goods and services, which can retard job creation and economic growth. Improving the standard of living and eradicating poverty are among the highest-order domestic priorities.

    Urban containment policy can lead to higher house prices: Urban land-use regulation has become stronger in many metropolitan areas and often includes urban containment policy. Urban containment severely restricts or bans development in urban fringe areas. Consistent with basic economics, this increases land values and house prices (all else equal). The planning intention and expectation is that higher housing densities will offset the land-price increases and that housing affordability will be maintained.

    Severe losses in housing affordability have been experienced in urban containment markets: Top housing and economic experts attribute much of the loss in housing affordability to stronger land-use policy.

    Housing affordability losses have been sustained in the five nations this report focuses upon: Across the United Kingdom, Australia, New Zealand and some markets in Canada and the United States, house prices have nearly doubled or tripled compared with household incomes as measured by price to income ratios. Much of this has been associated with urban containment policy.

    Demand and supply: Some research suggests that the huge house-price increases have occurred due to higher demand and the greater attractiveness of metropolitan areas that have urban containment policy. However, the interaction of supply and demand sets house prices. Claims that metropolitan areas with urban containment policy are more attractive are countered by their net internal out-migration and diminished amenities for some households.

    An intrinsic urban containment amenity seems doubtful: Some urban containment advocates claim that urban containment policy intrinsically improves amenities (such as a dense urban lifestyle). However, whether a feature is an amenity depends on individual preferences. Moreover, the strong net internal migration away from many metropolitan areas with urban containment policy is an indication that there is no urban containment amenity for most households.

    Higher densities have not prevented huge losses in housing affordability: In contrast with planning expectations, the land-value increases expected from urban containment have not been nullified by higher densities within urban containment boundaries.

    Intervening urban containment boundaries are more influential than topographic barriers: It has been suggested that topographic barriers such as mountains and the ocean cause higher house prices. However, in urban containment metropolitan areas, urban containment boundaries are usually placed between the built-up urban areas and the topographic barriers. As a result, house-price increase associated with the land shortage will be principally associated with the urban containment boundary, not the topographic barrier.

    A competitive land supply is required for housing affordability: A risk with urban containment policy is that by limiting the land for sale, large landholders will seek to buy up virtually all of the land for future gain. Without urban containment, there will not be a land shortage, and there will not be an incentive to monopolize the land supply. A sufficient land supply can be judged to exist only if prices relative to incomes are not higher than before the urban containment policy came into effect.

    Urban containment policy has been associated with reduced economic growth: Evidence suggests that urban containment policy reduces job creation and economic growth. The increased inequality noted by French economist Thomas Piketty is largely attributed to the housing sector and is likely related to strong regulation. Other research estimated a US$2-trillion loss to the U.S. economy, much of it related to strong land-use regulation, and called this “a large negative externality.”

    Urban containment policy has important social consequences: There are also important social consequences such as wealth transfers from younger to older generations and from the less-affluent to the more-affluent households.

    Urban containment policy has failed to preserve housing affordability: Some have expressed concern that urban containment policy might not have been implemented if there had been the expectation of losses in housing affordability. In fact, the administration of urban containment policy has been deficient, with corrective actions largely not taken despite the considerable evidence of losses in housing affordability. In urban containment markets, programs should be undertaken to stop the further loss of housing affordability and transition toward restoring housing affordability. Further, urban containment should not be implemented where it has not already been adopted.

    Canada could be at risk: Canada could be at greater risk in the future. Already, huge losses in housing affordability have been sustained in Vancouver and Toronto. Other metropolitan areas are strengthening land-use regulations. This could lead to severe consequences such as lowering middle-income standards of living and greater poverty with less job creation and less economic growth.

    The urban containment debate is fundamentally a question of values: Ultimately, the choice is between the planning values of urban design or urban form and the domestic policy values of improving the standard of living and reducing poverty. Urban containment policy appears to be irreconcilable with housing affordability. Proper prioritization requires that the higher-order values of a better standard of living and less poverty take precedence.

    Download the full report (pdf) here.

    Wendell Cox is Chair, Housing Affordability and Municipal Policy for the Frontier Centre for Public Policy (Canada), is a Senior Fellow of the Center for Opportunity Urbanism (US), a member of the Board of Advisors of the Center for Demographics and Policy at Chapman University (California) and principal of Demographia, an international public policy and demographics firm.He is co-author of the “Demographia International Housing Affordability Survey” and author of “Demographia World Urban Areas” and “War on the Dream: How Anti-Sprawl Policy Threatens the Quality of Life.” He was appointed to three terms on the Los Angeles County Transportation Commission, where he served with the leading city and county leadership as the only non-elected member. He served as a visiting professor at the Conservatoire National des Arts et Metiers, a national university in Paris.

  • So Much For The Death Of Sprawl: America’s Exurbs Are Booming

    It’s time to put an end to the urban legend of the impending death of America’s suburbs. With the aging of the millennial generation, and growing interest from minorities and immigrants, these communities are getting a fresh infusion of residents looking for child-friendly, affordable, lower-density living.

    We first noticed a takeoff in suburban growth in 2013, following a stall-out in the Great Recession. This year research from Brookings confirms that peripheral communities — the newly minted suburbs of the 1990s and early 2000s — are growing more rapidly than denser, inner ring areas.

    Peripheral, recent suburbs accounted for roughly 43% of all U.S. residences in 2010. Between July 2013 and July 2014, core urban communities lost a net 363,000 people overall, Brookings demographer Bill Frey reports, as migration increased to suburban and exurban counties. The biggest growth was in exurban areas, or the “suburbiest” places on the periphery.

    How could this be? If you read most major newspapers, or listened to NPR or PBS, you would think that the bulk of American job and housing growth was occurring closer to the inner core. Yet more than 80% of employment growth from 2007 to 2013 was in the newer suburbs and exurbs. Between 2012 and 2015, as the economy improved, occupied suburban office space rose from 75% of the market to 76.7%, according to the real estate consultancy Costar.

    These same trends can be seen in older cities as well as the Sun Belt. Cities such as Indianapolis and Kansas City have seen stronger growth in the suburbs than in the core.

    This pattern can even be seen in California, where suburban growth is discouraged by state planning policy but seems to be proceeding nevertheless. After getting shellacked in the recession, since 2012 the Inland Empire — long described as a basket case by urbanist pundits — has logged more rapid population growth  than either Los Angeles and even generally healthy Orange County. Last year the metro area ranked third in California for job growth, behind suburban Silicon Valley and San Francisco.

    To those who have been confidently promoting a massive “return to the city,” the resurgence of outer suburbs must be a bitter pill. In 2011, new urbanist pundit Chris Leinberger suggested outer ring suburbs were destined to become “wastelands” or, as another cheerily described them, “slumburbs” inhabited by the poor and struggling minorities chased out of the gentrifying city.

    In this worldview, “peak oil” was among the things destined to drive people out of the exurbs . So convinced of the exurbs decline that some new urbanists were already fantasizing that suburban three-car garages would be “subdivided into rental units with street front cafés, shops, and other local businesses,” while abandoned pools would become skateboard parks.

    This perspective naturally appeals to people who write most of our urban coverage from such high-density hot spots as Brooklyn, Manhattan, Washington, D.C., or San Francisco. And to be sure, all these places continue to attract bright people and money from around the world. Yet for the vast majority, particularly families, such places are too expensive, congested and often lack decent public schools. For those who can’t afford super-expensive houses and the cost of private education, the suburbs, particularly the exurbs, remain a better alternative.

    Even as Houston, like other Sun Belt cities, has enjoyed something of a renaissance in its inner core, nearly 80% of the metro area’s new homebuyers last year purchased residences outside Beltway 8, which is far to west of the core city.

    If you want to know why people move to such places, you can always ask them. On reporting trips to places like Irvine, California, Valencia, north of Los Angeles, or Katy, out on the flat Texas prairie 31 miles west of Houston, you get familiar answers: low crime, good schools and excellent access to jobs. Take Katy’s Cinco Ranch. Since 1990, the planned community has grown to 18,000 residents amid a fourfold expansion in the population of the Katy area to 305,000.

    To some, places like Cinco Ranch represents everything that is bad about suburban sprawl, with leapfrogging development that swallows rural lands and leaves inner city communities behind. Yet to many residents, these exurban communities represent something else: an opportunity to enjoy the American dream, with good schools, nice parks and a thriving town center.

    Nor is this a story of white flight. Roughly 40% of the area’s residents are non-Hispanic white; one in five is foreign born, well above the Texas average. Barely half of the students at the local high school are Caucasian and Asian students have been the fastest-growing group in recent years, with their parents attracted to the high-performing schools.

    “We have lived in other places since we came to America 10 years ago,” says Pria Kothari, who moved to Cinco with her husband and two children in 2013. “We lived in apartments elsewhere in big cities, but here we found a place where we could put our roots down. It has a community feel. You walk around and see all the families. There’s room for bikes –that’s great for the kids.”

    Here Come The Millennials

    Potentially, the greatest source of exurban and peripheral revival lies with the maturation of the millennial generation. Millennials — born between 1982 and 2002 — are widely portrayed as dedicated city dwellers. That a cohort of young educated, affluent people should gravitate to urban living is nothing new. The roughly 20% who, according to an analysis by demographer Wendell Cox, live in urban cores may be brighter, and certainly more loquacious, than their smaller town counterparts, dominating media coverage of millennials. But the vast majority of millennials live elsewhere — and roughly 90% of communities’ population growth that can be attributed to millennials since 2000 has taken place outside of the urban core.

    To be sure, millennials are moving to the suburbs from the city at a lower rate than past generations , but this is more a reflection of slower maturation and wealth accumulation.

    According to U.S. Census Bureau data released last month, 529,000 Americans ages 25 to 29 moved from cities out to the suburbs in 2014 while 426,000 moved in the other direction. Among younger millennials, those in their early 20s, the trend was even starker: 721,000 moved out of the city, compared with 554,000 who moved in.

    This may well reflect rising cost pressures, as well as lower priced housing many millennials can afford. Three-quarters, according to one recent survey, want a single-family house, which is affordable most often in the further out periphery.

    Future trends are likely to be shaped by an overlooked fact: as people age, they change their priorities. As the economist Jed Kolko has pointed out, the proclivity for urban living peaks in the mid to late 20s and drops notably later. Over 25% of people in their mid-20s, he found, live in urban neighborhoods; but by the time they move into their mid-30s, it drops to 18% or lower. In 2018, according to Census estimates, the number of millennials entering their 30s will be larger than those in their 20s, and the trend will only get stronger as the generation ages.

    Some might argue that millennials will be attracted to more urban suburbs, places like Bethesda, Md.; Montclair, N.J.; or the West University or Bellaire areas of Houston, all of them located near major employment centers with many amenities. These suburban areas are also among the most expensive areas in the country, with home prices often in the millions. And a number of older inner ring suburbs, as we saw in the case of Ferguson, are troubled and have lost population — even as the number of residents in downtown areas have grown.

    So when millennials move they seem likely to not move to the nice old suburbs, or the deteriorating one, but those more far-flung suburban communities that offer larger and more affordable housing, good schools, parks and lower crime rates.

    Among the research that confirms this is a study released this year by the Urban Land Institute, historically hostile to suburbs, which found that some 80% of current millennial homeowners live in single-family houses and 70% of the entire generation expects to be living in one by 2020.

    The Future Of Exurbia

    Far from being doomed, exurbia is turning into something very different from the homogeneous and boring places portrayed in media accounts. For one thing exurbs are becoming increasingly ethnically diverse. In the decade that ended in 2010 the percentage of suburbanites living in “traditional” largely white suburbs fell from 51% to 39%.  According to a 2014 University of Minnesota report, in the 50 largest U.S. metropolitan areas, 44% of residents live in racially and ethnically diverse suburbs, defined as between 20% and 60% non-white.

    And how about the seniors, a group that pundits consistently claim to be heading back to the city? In reality, according to an analysis of Census data, as seniors age they’re increasingly unlikely to move, but if they do, they tend to move out of urban cores as they reach their 60s, and to less congested, often more affordable areas out in the periphery. Seniors are seven times more likely to buy a suburban house than move to a more urban location. A National Association of Realtors survey found that the vast majority of buyers over 65 looked in suburban areas, followed by rural locales.

    Trends among millennials, seniors and minorities suggest that demographics are in the exurbs’ favor. The movement to these areas might be accelerated by their growing sophistication, as they build amenities long associated with older cities, such as town centers, good ethnic restaurants and shops, diverse religious institutions and cultural centers. At the same time, the growth of home-based business — already larger than transit ridership in two-thirds of American metropolitan areas and growing much faster — increases the need for larger homes of the sort found most often in the outer rings.

    Rather than regard these communities as outrages to the urban form, planners and developers need to appreciate that peripheral developments remain a necessary part of our evolving metropolitan areas. With a new generation looking for affordable homes, good schools and low crime, it seems logical that many will eventually leave core cities that offer none of the above. The future of exurbia is far from dead; it’s barely begun.

    This piece first appeared at Forbes.

    Joel Kotkin is executive editor of NewGeography.com and Roger Hobbs Distinguished Fellow in Urban Studies at Chapman University, and a member of the editorial board of the Orange County Register. He is also executive director of the Houston-based Center for Opportunity Urbanism. His newest book, The New Class Conflict is now available at Amazon and Telos Press. He is also author of The City: A Global History and The Next Hundred Million: America in 2050. He lives in Orange County, CA.

  • Auckland Tackles Housing Affordability Crisis

    City of Auckland Chief Economist Chris Parker has called for establishment of a house price to income ratio objective of 5.0, to be achieved by 2030. The recommendation was included in a report commissioned by Auckland Mayor Len Brown and Deputy Mayor Penny Hulse.

    Housing Affordability and Urban Containment Policy

    The recommendation has been brought about in response to Auckland’s severely unaffordable housing. Recent reports indicate a price to income ratio over 9.0, at least triple that of New Zealand to the early 1990s.

    Like a number of metropolitan areas, Auckland has had urban containment land-use policy for some time. Auckland has drawn an urban growth boundary around development, largely banning new greenfield housing outside the boundary. As economics would predict, with a continuation of strong housing demand and the significant supply reduction, house prices have been shot skyward. The latest Demographia International Housing Affordability Survey showed Auckland to have a median multiple of 8.2 (the median multiple is the median house price divided by the median household income), though later data indicates a further deterioration (above).

    Avoiding the Consequences of Urban Containment

    House price volatility has been a growing concern in urban containment markets where house prices have escalated so strongly relative to incomes and economic productivity. The bursting of the US housing bubble in the last decade indicates the damage that can be inflicted on people and their finances when exorbitantly high house prices collapse. This is a fate governments seek to avoid not only in Auckland, but at the national level.

    According to Parker’s report, the city of Auckland is expected to add 1 million additional residents over the next 30 years. Parker indicated that: "If high house prices are sustained or continue to rise relative to incomes then … consequences and risks will become more significant:" He cited:

    "-loss of social cohesion — an increasingly socially divided city with a line drawn between those in the housing market and those outside

    -macroeconomic instability via rapid house price deflation.

    -Increased unemployment as businesses relocate activities to other more competitive cites locally (e.g. Christchurch, Hamilton, Tauranga) and internationally (e.g. Melbourne and Sydney)

    -Increased household crowding and related social ills."

    City Councilor Dick Quad echoed similar concerns in an email: "It’s staggering that Auckland’s homeownership is now down to 50% from 64% just 9 years ago. The social chaos we are creating can be seen on a daily basis with overcrowding, third world diseases (resulting from overcrowding) poor educational outcomes, and a city in which the landed gentry have grabbed all the wealth. We are engaged in a social experiment which is destined to end in disaster.”

    Councilor Quax applauded Parker’s work, but had concerns about implementation, indicating that the policy "flies in the face of what many of our politicians believe."

    According to Parker, reaching that the objective will include a number of both supply and demand side strategies. Most, importantly, Parker’s list includes opening greenfield land for development. Even urban containment (smart growth) theorists agree that the imposition of urban containment boundaries, such as in Auckland, is associated with higher land prices within the urban area. Their hopes that higher density housing would cancel out the housing affordability losses have been dashed, due to the massive increase in land costs. For example, comparable land on either side of Auckland’s urban containment boundary varies by a minimum of 8 times. Without the boundary, the expected difference would be virtually nil. In addition, high density housing is considerably more expensive to build than the detached housing people prefer.

    Yet, only in a few places have policymakers taken the important step from failed intentions to the reforms necessary to reverse the housing affordability losses. Among the major metropolitan areas with the most severe urban containment policies, house prices have risen to two to three times the rate of household incomes.

    The "Good:" Better than an Unattainable "Perfect"

    Even if the 5.0 price to income multiple were achieved by 2030, housing would remain seriously unaffordable in Auckland. Parker argues that a lower target (such as the 3.0 Demographia International Housing Affordability Survey standard) would not likely be achievable:

    "It is doubtful that a 5.0 median price multiple could be achieved considerably earlier than 2030. (Unless there was a substantial bust, which should be avoided, given that so much is now at stake with existing high prices and the macroeconomic risks that would result.) The types of changes needed are structural (and change at a glacial pace), and will take many years to compound."

    His point is well taken. The "perfect" strategy of a 3.0 objective could well be the enemy of the good.
    Reaching a 5.0 price to income multiple by 2030 would be a great improvement. Two decades of housing market distortion cannot be erased overnight.

    The alternative could be continued house price increases in a policy environment that continues to outlaw building the new housing that people prefer.

    As the city continues to examine options for improving housing affordability, it will be important to set interim objectives, such as annual improvements or perhaps improvements on a three year basis. Further, it will be important for the city to continually review its policies and liberalize regulation even further if the targets are not reached.

    Setting an Example

    Auckland could be taking a significant step by seeking to reverse the damage done by out-of-control house prices. Certainly, the prodding it has received from the New Zealand government has helped. Just a couple of weeks ago, Deputy Prime Minister Bill English told a university audience: "… while the justification for planning is to deal with externalities, what has actually happened is that planning in New Zealand has become the externality." Research commissioned by the Productivity Commission of New Zealand may have also been influential.

    The city’s Auckland Development Committee recently endorsed Parker’s proposal and agreed "in principle" to include the objective in the next update of Auckland’s metropolitan plan. By lowering  housing costs, the city  would improve standards of living and reduce poverty. Auckland could also become an example for metropolitan areas as diverse as Vancouver, San Francisco, Portland, and London, where all of the talk about improving housing affordability has remained just that, while prices continue to soar beyond the means of the middle class, particularly young families

    Wendell Cox is Chair, Housing Affordability and Municipal Policy for the Frontier Centre for Public Policy (Canada), is a Senior Fellow of the Center for Opportunity Urbanism (US), a member of the Board of Advisors of the Center for Demographics and Policy at Chapman University (California) and principal of Demographia, an international public policy and demographics firm.He is co-author of the “Demographia International Housing Affordability Survey” and author of “Demographia World Urban Areas” and “War on the Dream: How Anti-Sprawl Policy Threatens the Quality of Life.” He was appointed to three terms on the Los Angeles County Transportation Commission, where he served with the leading city and county leadership as the only non-elected member. He served as a visiting professor at the Conservatoire National des Arts et Metiers, a national university in Paris.

    Lead photo: City of Auckland Coat of Arms by Jayswipe (Heraldry photos) [Public domain], via Wikimedia Commons

  • The Houses Americans Choose to Buy

    The US preference for detached housing remains strong, according to the newest data just released in the 2014 American Community Survey, by the United States Census Bureau. In 2014, detached house and represented 82.4 percent of owned housing in the United States. This is   up 1.8 percentage points from the 80.6 percent registered in the 2000 census. The increase may be surprising, given the efforts of planners to steer people into higher density housing, especially apartments.

    The US Situation in 2014

    Among owned housing, mobile homes ranks second only to detached housing. Attached houses, which are ground oriented units with common walls, such as townhomes and semi detached homes (also called duplexes) are the third most popular form of owned housing, accounting for 5.7 percent of units in 2014. Perhaps surprisingly, the apartments planners prefer ranked fourth preference among households buying their own homes. Apartments, which include lower rise, midrise and high-rise condominiums account for 5.5 percent of owned housing. (Figure 1). The fifth, and by far the smallest category of owned housing is "Boats, RVs, Vans, Etc., which represented 0.1 percent of owned housing.

    Trend Since 2000

    There were approximately 4.7 million more detached houses in 2014 than in 2000. This means that 114 percent of the new owned housing stock was detached housing. Despite their second ranking among housing types, there were substantial losses in the number of mobile homes. In 2014 there were approximately 1.1 million fewer mobile homes and continuing losses could drop mobile homes below attached homes and apartments over the next decade. Mobile homes are often transitional for households aspiring to afford detached or even attached housing. Attached homes enjoyed a strong increase of approximately 410,000 units. The strong detached and attached housing increase could reflect, in part, the realization of those aspirations.

    Apartments, which were within 15,000 of attached houses in 2000, dropped to approximately 270,000 behind, while adding only 160,000 owned units. In view of the strong condominium construction rates in some cities, this may be surprising. On the other hand, it could be indicative of the "dark and empty" thesis that many of the new units have been purchased for only occasional use and not as primary residences, some rented out by owners (Figure 2).

    There was an 18,000 unit loss in "Boats, RVs, Vans, Etc."

    Owned Housing by Metropolitan Classification

    The preference for detached housing was pervasive, even in the metropolitan areas with the largest pre-World War II urban cores (identified using the City Sector Model). Nearly 71 percent of owned housing is detached in these metropolitan areas, which include New York, Los Angeles, Chicago, Philadelphia, Washington, Boston and San Francisco. The detached housing percentage rises to 85 percent in the other 46 metropolitan areas with more than 1 million population and is similar for the 53 metropolitan areas between 500,000 and 1 million population. Among the 106 metropolitan areas with more than 500,000 population, the percentage of detached housing increased in 86.

    The detached housing share is a smaller 80 percent outside these largest metropolitan areas.

    The defining difference between the metropolitan areas with the largest cores is in owned apartments, which represent 15 percent of owned housing. This is more than three times the rate of owned apartments in the other 46 major metropolitan areas and the 53 metropolitan areas with between 500,000 and 1,000,000 population (Figure 3).

    Housing Types by Metropolitan Areas

    Among the 106 metropolitan areas, 86 have detached percentages of owned housing of 80 percent or more. The highest detached housing percentage is in Omaha, at 94.8 percent. Modesto trails closely at 94.4 percent. This may not be surprising, since so many households have been driven away from close enough-for-a-long-commute San Francisco Bay Area by its exorbitant house prices and severely constrained housing choices. Detached housing is now a luxury in the Bay Area well beyond the resources of middle income households who did not buy their homes in the past, when prices were lower.

    The gap between second and third is much larger, with Dayton having a detached housing percentage of 92.8 percent, followed closely by Kansas City (92.7 percent), Memphis (92.6 percent) and Wichita (92.4 percent). Stockton, at 92.3 percent has attracted so many San Francisco Bay Area residents that it is now a part of the San Francisco Bay combined statistical area ranks eighth, (Figure 4).

    The lowest rates of detached owned housing are in Miami (63.8 percent), Philadelphia (63.9 percent), New York (65.4 percent), Baltimore (65.4 percent), and Honolulu (66.0 percent).

    Philadelphia and Baltimore compensate substantially for their low detached housing percentage by leading in attached housing, which is widely dispersed in both the core municipalities and the suburbs. More than 30 percent of Philadelphia’s owned housing is attached, and 27 percent of Baltimore’s. In Washington and Allentown more than 20 percent of owned housing is also attached (Figure 5).

    Honolulu has the largest percentage of owned apartment housing, at 26.6 percent. New York (24.1 percent) and Miami (23.6 percent) follow. Only two other metropolitan areas, have more than 15 percent of their owned housing in apartments, Boston and Chicago (Figure 6).

    All of the metropolitan areas with the 10 highest percentages of mobile homes are in the South, with the exception of Tucson. Lakeland, Florida has by far the largest mobile on percentage, and over 20 percent. McAllen, Sarasota, Baton Rouge and Tucson complete the top five, ranging from 12.6 percent to 14.5 percent (Figure 7).

    As noted above, the percentages of owned housing in the "Boats, RVs, Vans, Etc." category are much smaller. McAllen has the largest share at 1.2 percent. The top 5 is rounded out by Bakersfield, Phoenix, Portland (OR-WA) and Tucson (Figure 8).

    The Detached House: Still King

    Three decades ago, historian Robert Fishman wrote: "For the first time in any society, the single-family detached house was brought within the economic grasp of the majority of households" (Note). The US may have been first, but it is not alone. The same observation can be made for other nations, such as Japan, Canada, Australia, New Zealand and Norway. The detached house is alive and well in the United States and may even be increasing its domination.

    Note: This quotation is from Fishman’s "Bourgeois Utopias: The Rise and Fall of Suburbia" (page 183). The subtitle should not be interpreted to suggest that this is another superficial anti-suburban screed. In fact, Fishman’s point can be interpreted as indicating that suburbia has been replaced by a new type of city, even less connected with the former dominant (monocentric) core.

    Photo: Minneapolis-St. Paul suburbs (author)

    Wendell Cox is Chair, Housing Affordability and Municipal Policy for the Frontier Centre for Public Policy (Canada), is a Senior Fellow of the Center for Opportunity Urbanism (US), a member of the Board of Advisors of the Center for Demographics and Policy at Chapman University (California) and principal of Demographia, an international public policy and demographics firm.He is co-author of the "Demographia International Housing Affordability Survey" and author of "Demographia World Urban Areas" and "War on the Dream: How Anti-Sprawl Policy Threatens the Quality of Life." He was appointed to three terms on the Los Angeles County Transportation Commission, where he served with the leading city and county leadership as the only non-elected member. He served as a visiting professor at the Conservatoire National des Arts et Metiers, a national university in Paris.

  • How Urban Planning Made Motown Records Possible

    I’m reading Once in a Great City: A Detroit Story by David Maraniss, a book I plan to review for City Journal. But I want to highlight something briefly that really caught my eye about Motown Records. It’s no secret Detroit punches above its weight in musical influence, and the Motown sound was clearly a big part of that. Maraniss asks “Why Detroit? What gave this city its unmatched creative melody?” He lays out his theory of the case with regards to Motown Records.

    The family piano’s role in the music that flowed out of the residential streets of Detroit cannot be overstated. The piano, and its availability to children of the black working class and middle class, is essential to understanding what happened in that time and place, and why it happened, not just with Berry Gordy, Jr. but with so many other young black musicians who came of age there from the late forties to the early sixties. What was special then about pianos and Detroit? First, because of the auto plants and related industries, most Detroiters had steady salaries and families enjoyed a measure of disposable income they could use to listen to music in clubs and at home. Second, the economic geography of the city meant that the vast majority of residents lived in single family homes, not high-rise apartments, making it easier to deliver pianos and find room for them. And third, Detroit had the egalitarian advantage of a remarkable piano enterprise, the Grinnell Brothers Music House. [emphasis added]

    Like most things, the rise of Motown Records was multifactoral. Maraniss keys in on the prevalence of pianos in black homes. Note his factors creating this, to which one could also add the first rate musical education available to public school students at places like Cass Tech that he refers to multiple times throughout the text.

    But of course I highlight: “the vast majority of residents lived in single family homes, not high-rise apartments, making it easier to deliver pianos and find room for them.”

    It’s no secret that Detroit, like most Midwest cities, is a city of single family homes. Detached houses have a bad rep in planning circles today, but in this case the space they afforded allowed black families to have a piano – and in Motown Records founder Berry Gordy, Jr.’s case, a baby grand at that. This would be much more difficult in a microapartment to say the least.

    Let’s not get too carried away. As Gordy was founding Motown, Jane Jacobs was pointing out the trouble with Detroit’s “gray belts” of single families that were already being abandoned. Pete Saunders has highlighted Detroit’s housing stock as one of the nine key urban planning reasons Detroit failed (ironically, in part because today these houses are too small).

    Nevertheless, no preponderance of single family homes, no widespread pianos in black Detroit homes, and likely no Motown Records either. The history of American music was literally shaped by the single family housing character of Detroit. If we can acknowledge its flaws, it’s only fair to acknowledge it’s unique strengths too.

    What this suggests is that cities shouldn’t despair too much about their existing built form, even if in many cases they are struggling with it. The question might be, what does that form enable that you can’t get elsewhere? Grinnell Brothers Music figured out that auto money + under-served black households + single family homes meant a potential market for pianos. And the rest is history. What other market opportunities exit right before our urban planning eyes that we have not yet noticed?

    Aaron M. Renn is a senior fellow at the Manhattan Institute and a Contributing Editor at City Journal. He writes at The Urbanophile, where this piece originally appeared.

  • Jessie: Over-The-Rhine, Cincinnati

    This is Jessie. She’s a well educated thirty year old professional with a good income. She could live anywhere she wants. She was offered excellent positions with good companies in San Francisco. While she was excited by the opportunity to live in a top tier coastal city she was smart enough to actually run the numbers before taking a job. Her income would be comparable to what she was already making in Cincinnati, but her cost of living (particularly the astronomical cost of housing) in San Francisco meant that she would actually be accepting a massively lower standard of living in California compared to Ohio.

    IMG_3667 (1024x683)

    IMG_3661 (1024x683)

    Cincinnati isn’t just affordable. It’s also a fabulous place to live. Ten years ago the cost of property in San Francisco was high, but still within the reach of people like Jessie. No more. And ten years ago the urban core of Cincinnati hadn’t yet revived sufficiently to reach a critical mass of livability. But today the scales are tipped decidedly in Cincinnati’s favor as San Francisco (New York, D.C, Boston, Seattle, LA, etc.) have gone off the charts in terms of cost while Cincinnati has matured and proven itself.

    IMG_3694 (1024x683)

    IMG_3681 (1024x683)

    Last year Jessie bought this entire three family building in the Over-the Rhine neighborhood in Cincinnati for $279,000. She then spent $126,000 in renovations. So she’s in for a grand total of $405,000. She lives in the top two floors and rents two apartments on the lower levels. The rental income goes a long way to offsetting her monthly expenses. I just checked the real estate listings here in San Francisco. There’s a 300 square foot studio condo on the market for $399,999, but it will almost certainly sell for considerably more once potential buyers outbid each other. And the monthly HOA fees are ridiculous.

    IMG_3705 (1024x683)

    IMG_3730 (1024x683)

    IMG_3711 (1024x683)

    IMG_3718 (1024x683)

    IMG_3761 (1024x683)

    If you’d like a more detailed account of how older buildings in Cincinnati are being purchased and rehabbed by ordinary people, including Jessie, I encourage you to check out the “Owner Occupied OTR” episode of the Urban Cincy Podcast.

    John Sanphillippo lives in San Francisco and blogs about urbanism, adaptation, and resilience at granolashotgun.com. He’s a member of the Congress for New Urbanism, films videos for faircompanies.com, and is a regular contributor to Strongtowns.org. He earns his living by buying, renovating, and renting undervalued properties in places that have good long term prospects. He is a graduate of Rutgers University.

  • No Wiggle Room in Housing Market

    The salary gap – where top-end incomes are rising faster than middle- and lower-end salaries – plays a large role in the affordability of middle-class housing along with interest rates and prices. Which factor has more influence depends on where you live and how you make your living.

    Using some simplifying assumptions (20 percent down payment and a 30-year fixed-rate mortgage), today’s middle-class household increasingly cannot afford a middle-class home. Two things hurt this market: poor job outlook (impacts income) and interest rates (impacts affordability).

    Cities

    Salary Needed

    Mortgage Rate

    Salary Gap

    Jobs/People Ratio

    Unemployment Rate

    Cleveland

    $33,714.17

    3.96

    10%

    .59

    5.3

    Pittsburgh

    $33,838.57

    3.87

    7%

    .61

    5.1

    Detroit

    $37,544.40

    4.05

    2%

    .54

    5.6

    Cincinnati

    $36,357.35

    3.98

    1%

    .60

    4.0

    St Louis

    $36,784.94

    3.94

    0%

    .62

    5.0

    Atlanta

    $39,356.45

    3.97

    -7%

    .61

    5.5

    Phoenix

    $43,170.07

    3.97

    -19%

    .59

    5.3

    Tampa

    $41,488.22

    4.04

    -23%

    .56

    5.0

    Minneapolis

    $50,969.96

    3.96

    -20%

    .69

    3.5

    Philadelphia

    $54,385.77

    3.96

    -34%

    .59

    5.5

    Baltimore

    $55,842.76

    3.89

    -34%

    .62

    5.3

    Houston

    $53,684.45

    3.94

    -41%

    .64

    4.3

    Orlando

    $46,300.92

    3.99

    -52%

    .61

    4.8

    San Antonio

    $48,092.30

    3.99

    -50%

    .60

    3.4

    Dallas

    $52,947.58

    3.97

    -44%

    .65

    3.7

    Sacramento

    $61,517.63

    4.03

    -47%

    .55

    5.6

    Chicago

    $61,068.50

    3.97

    -58%

    .60

    5.5

    Portland

    $65,009.41

    4.01

    -61%

    .61

    5.5

    Denver

    $69,912.24

    4.04

    -68%

    .67

    3.7

    Miami

    $63,289.86

    4.00

    -93%

    .59

    5.2

    Washington

    $83,027.24

    3.90

    -61%

    .67

    4.3

    Seattle

    $78,118.97

    4.05

    -69%

    .66

    4.2

    Boston

    $86,164.15

    3.91

    -78%

    .63

    4.1

    New York City

    $90,750.14

    3.97

    -102%

    .58

    5.1

    Los Angeles

    $88,315.32

    3.94

    -124%

    .59

    6.0

    San Diego

    $104,839.73

    4.04

    -161%

    .56

    4.8

    San Francisco

    $157,912.06

    3.95

    -211%

    .63

    4.0

    Salary Gap expressed as percent of Median Salary (that is, Salary Gap = (Median Salary minus Salary Needed) divided by Median Salary); negative numbers mean the salary needed to buy the median-priced home is greater than the median salary in that city. Data on salary needed and mortgage rates from http://www.hsh.com/finance/mortgage/salary-home-buying-25-cities.html; data on median salary from http://www.bls.gov/oes/current/oessrcma.htm. Unemployment rate for August 2015 and Participation rate is 2014 annual average from www.bls.gov.

    In some ways, Minneapolis is not unlike San Francisco: both enjoy relatively low levels of unemployment and low mortgage costs. Nationally, the average 30-year mortgage rate is 4.09% (for July 17, 2015). Minneapolis and San Francisco are at 3.96% and 3.95%, respectively. Compared to the national unemployment rate of 5.3%, Minneapolis is at 3.5% and San Francisco is at 4.0%. So how do we explain the difference in affordability, aside from the realtor’s rant of “location, location, location”? San Francisco has a higher jobs/population ratio than Minneapolis, but that is only part of the story. As someone once told me when I was trying to understand why the jobs/housing relationship in Orange County didn’t fit the model: “What makes you think those people have jobs?”

    In other words, where a population is less dependent on the traditional economy, higher home prices may be sustainable. This occurs in areas with a concentration of rich (“high-net-worth”) individuals. Some cities, like San Francisco and New York, are also attractive to rich homebuyers from outside the US. About 5% of existing home sales in California were to buyers from China (mainland, Hong Kong and Taiwan), who spent about $12 billion on homes primarily in San Francisco, Los Angeles and San Diego. The Chinese buyers paid an average of $831,000 per home – 69% paid with all-cash. In that sense, San Francisco is more like New York. The New York metro has an unemployment rate slightly below the national average, but only 57.8% as many jobs as there are people, compared to the national average of 59.2%. Foreign buyers from Canada and Mexico – who, along with China, make up about half of all foreign home buyers in the US – tend to buy in lower-priced housing markets in Florida, Arizona and Texas. Although more units are sold to international buyers in Florida (about 21% in 2015), the higher dollar volume is in California and New York. Homebuyers from Canada spent $6.4 billion in Florida and Arizona last year while buyers from China spent a total of $12 billion in California and New York. These statistics hint at a population that is less job-dependent, less “middle-class” than the national average.

    The behavior of middle-class households in the decade before the 2008 collapse confirmed what I called a “distinct shift in the paradigm governing the housing market.” In November 2004, the stock market was climbing and the Fed was raising interest rates. The combination brought out talk of a real estate bubble. If investors started moving money away from housing they would be selling houses at a time when higher mortgage interest rates would make it more difficult to find buyers. That was 2004, mind you, not 2008; there were four years of housing prosperity ahead.

    Under the new paradigm, rising stock market prices are neither cause nor effect for changes in residential real estate prices. (One exception is the New York metropolitan area, where Wall Street drives home prices by virtue of its impact on employment and income.) The break in the statistical relationship between Wall Street and Main Street started around 1980. In 1979, the Federal Reserve changed their policy away from interest rate targeting. As they attempted to control the supply of money, interest rates began to swing wildly. Households put more money in real estate when they saw more uncertainty in the economy. At the time I dubbed housing “A New Kind of Gold.” It wasn’t that the prices of houses behaved the same way as gold prices but because of the shared attitude from buyers. Gold is a traditional hedge against economic uncertainty. In the 1990s, people started buying homes when other investments seemed uncertain.

    Prior to 1995, the Federal Reserve kept secret their monetary policy objectives. Twenty years later, we know that they are using the federal funds rate to reach targets for the money supply. Technically, the federal funds rate is the rate at which the Federal Reserve would like banks to lend to each other (although the banks are free to charge each other whatever they want). Banks also use the federal funds rate as the basis for setting consumer interest rates, like mortgage rates. Real estate investments are sensitive to interest rate changes in very specific ways. The total impact of current events on home prices will come from the Federal Reserve, regardless of what happens in the stock market. When interest rates rise it makes expansion more expensive for businesses by raising their borrowing costs. When businesses don’t expand, neither does employment. In addition to the fact that homes with mortgages become affordable to a smaller portion of the population, the impact on jobs is another reason why rising interest rates would reduce the demand for homes.

    The gap between the mean- and median-priced homes was increasing across the country before the 2008 crisis, indicating that prices at the top of the scale were rising faster than the prices of more modest homes. The return of the home price gap to pre-1995 levels could have equalized affordability for middle-class Americans if income had followed suit. In addition to the poor employment outlook, fewer and fewer people will be able to afford the higher priced homes because the gap between mean- and median-income is rising faster than the home price gap is falling.

    Median and mean (average) home sales prices are for new homes sold in the U.S. where the sales price includes land. Data from www.census.gov. Median and mean (average) salary from www.census.gov (Table H-13).

    If the long-anticipated strengthening in the jobs market had appeared after the Great Recession, it could have made a real difference for middle-America. But so far, the employment recovery has not appeared. As weak job growth appeared in September, the previously encouraging July and August growth numbers were revised downward. The labor force participation rate declined, leaving only 59.2% of the population working. Population growth in the US is less than 1% per year but job growth is not keeping up with it.

    Month 2015

    Civilian Population Growth

    Employment Growth

    June

    199,362

    -56,000

    July

    205,661

    101,000

    August

    220,858

    196,000

    September

    233,715

    -236,000

    4-Month Total

    859,596

    5,000

    Civilian Population Growth based on population estimates from www.FactFinder.census.gov, Employment Growth based on number of persons employed from www.bls.gov.

    As long as the monthly payments on median-priced homes are out of reach for median-income households, demand in the middle-class housing market cannot strengthen. This is one more reason the Federal Reserve cannot afford to raise interest rates this year. That doesn’t mean that they won’t do; just that they shouldn’t – that don’t always do that smart thing.

    Housing photo courtesy of BigStockPhoto.com.

    Susanne Trimbath, Ph.D. is CEO and Chief Economist of STP Advisory Services. Dr. Trimbath’s credits include appearances on national television and radio programs and the Emmy® Award nominated Bloomberg report Phantom Shares. She appears in four documentaries on the financial crisis, including Stock Shock: the Rise of Sirius XM and Collapse of Wall Street Ethicsand the newly released Wall Street Conspiracy. Dr. Trimbath was formerly Senior Research Economist at the Milken Institute. She served as Senior Advisor on United States Agency for International Development capital markets projects in Russia, Romania and Ukraine. Dr. Trimbath teaches graduate and undergraduate finance and economics.

  • Who Should Pay for the Transportation Infrastructure?

    Urban regions are significantly more important than any one city located within them. Housing, transportation, economy, and politics help produce uneven local geographies that shape the individual identities of places and create the social landscapes we inherit and experience. As such, decisions made within one city can ripple through the entire urban region. When affordable housing is systematically ignored by one city, neighboring cities become destinations for those who cannot afford higher housing costs. Even when the minimum wage is adjusted in one city, others cannot ignore it.

    In fact, a differential wage structure can produce diverse economic and labor geographies. Affordable housing and uneven economic development, in their turn, impact the regional transportation and infrastructure: if the cost of living and wages in one city in a particular region are high (as in San Francisco and Seattle), then low and middle-income workers will move to a more affordable neighboring city and pay a higher price, particularly in time spent, for transportation. They also pay more in fuel, and hence taxes that fund infrastructure maintenance and expansion.

    In other words, while companies and the more affluent population benefit from the agglomeration economies of alpha cities, it is the lower-wage workers and the population at large that pay for these uneven development. Therefore, a company deciding to locate in Seattle or San Francisco, or any location, does not have to bear the cost their decision imposes on urban transportation and the infrastructure needed to support their operation. Instead it’s their employees, particularly those with lower earning power, who do.

    How many LEED certified buildings and downtown redevelopment projects does it take to make up for this inequity?  Should a city be considered green, if a significant portion of its low earners has to commute to neighboring cities to afford a home? Can a city be seen as sustainable, if in a style akin to medieval cities, serfs have to leave every evening and return in the morning to make sure that the ‘creative class’ is adequately served?

    As states such as Washington engage with the old “pay as you go” policy of increasing fuel taxes to pay for the infrastructure, the question of what forces created the emergent commuting patterns remains unanswered. Was it just the commuters, acting as informed participants in the market economy, who sought to optimize their housing and transportation trade offs? Or did the locational choices of employers contribute to the growing commuting problems in the region? If commuters are subjected to “pay as you go” policies, shouldn’t employers who locate in expensive housing markets, irrespective of their employees’ income profile, be subjected to “pay as you locate” policies?

    Perhaps no metro region will make a better case study for this inequity than the area that ‘serves’ Seattle. The Puget Sound Region consists of four counties; however, to make sure that no one county that might have an economic connection with Seattle is left behind, we can look at six counties: Snohomish, King (where Seattle is located), Pierce, Kitsap, Thurston, and Mason.

    The entire urban region is served by a small number of highways, including Interstate 5. According to 2013 economic data, these six counties housed nearly 62% of all firms in the state. Furthermore, a quarter of all businesses in these counties were located within half a mile of a freeway. In terms of total employees, the six counties contained 69% of the state employment, and workplaces within half a mile of a freeway employed 37% of all employees in the counties. The inequity in the regional economic distribution is further exacerbated by the fact that the small area in West King county bounded by I-405 houses 30% of workplaces and 47% of employment, and generates a significant portion of the sales/revenue in the six counties. This area relies on I-5, I-405 and I-90 for the delivery of its employees from near and far.   

    The economic calculus of the early days of Interstate construction may have suggested that the trucking industry would benefit from this transportation infrastructure, but 1960s economists might be surprised by the type of companies now located within half a mile of freeways. In the six counties in Western Washington, the economic sectors over-represented in these geographies are: services and finance, real estate, and insurance (FIRE). Anyone driving on I-5 and I-405 (where Microsoft and other corporations are visible) can see this.  None of these workplaces require trucking. While their well-paid employees can afford to live in well-to-do places, including Bellevue and Seattle, many others reside in less expensive places such as Auburn, Tukwila, Tacoma, and Federal Way.

    A map of the region clearly suggests that neighboring counties and cities are housing those who work in West King County. Mobility has been the answer to unaffordability in this and other similar urban regions. If a city is unaffordable, is it fair to ask those who search for affordability in ‘other’ geographies pay for their so-called choices? Is this truly a choice? Are employers, current and future, asked to pay for their locational ‘choices?’ 

    Surely, we can do better than asking employees to bear the burden of a regional economic imbalance. Freeways should not be freer to some than others.  If this nation is about people paying for choices they make, then everyone should do so: employers and employees alike.

    Ali Modarres is the Director of Urban Studies at University of Washington Tacoma.  He is a geographer and landscape architect, specializing in urban planning and policy. He has written extensively about social geography, transportation planning, and urban development issues in American cities.

    Seattle photo courtesy of BigStockPhoto.com.