Category: housing

  • Some Kindly Advice From an Old White Guy

    Last month I bought an old fixer-upper for $15,000 in Cincinnati. It was originally offered at $17,000, but I got the sellers down a bit. The place is a complete disaster. All the copper pipes and wires have been stripped out of the building. It hasn’t seen paint for decades. Every window and door needs to be replaced. The roof is shot. There’s no insulation of any kind. The yard is a mess. And there are plenty of similar houses in the neighborhood. So why exactly did I buy it? I’ll get to that in a minute.


    Screen Shot 2015-06-20 at 2.39.06 PMGoogle

    Screen Shot 2015-06-20 at 3.43.32 PMGoogle

    Screen Shot 2015-06-20 at 2.51.09 PMGoogle

    But first I want to relate a conversation I had with a contractor this morning. He’s an older man who lives in the distant suburbs and has very definite opinions about the city. He spoke to me in a kindly grandfather voice. “Do you understand where this house is? Do you know what kind of people live there?” He used some colorful language which I won’t repeat. Let’s just say he’s a white guy of a particular generation from the South… He advised me to take the money I’m about to spend renovating the house and use it to buy a nice big new home on a good sized piece of land across the river in Kentucky instead.

    If this were 1980, or 1990, or 2000 this man’s recommendation would have been entirely valid from an economic perspective. Inner city neighborhoods all over the country were hemorrhaging population, jobs, and revenue for decades. It would have been a disastrous investment. But times have changed. Not everyone has noticed.

    Screen Shot 2015-06-20 at 1.15.34 PMGoogle

    Screen Shot 2015-06-20 at 1.16.17 PMGoogle

    Screen Shot 2015-06-20 at 1.11.49 PMGoogle

    Screen Shot 2015-06-20 at 1.12.31 PMGoogle

    Screen Shot 2015-06-20 at 2.12.12 PMGoogle

    Screen Shot 2015-06-20 at 2.12.43 PMGoogle

    Screen Shot 2015-06-20 at 2.19.56 PMGoogle

    Screen Shot 2015-06-20 at 2.20.21 PMGoogle

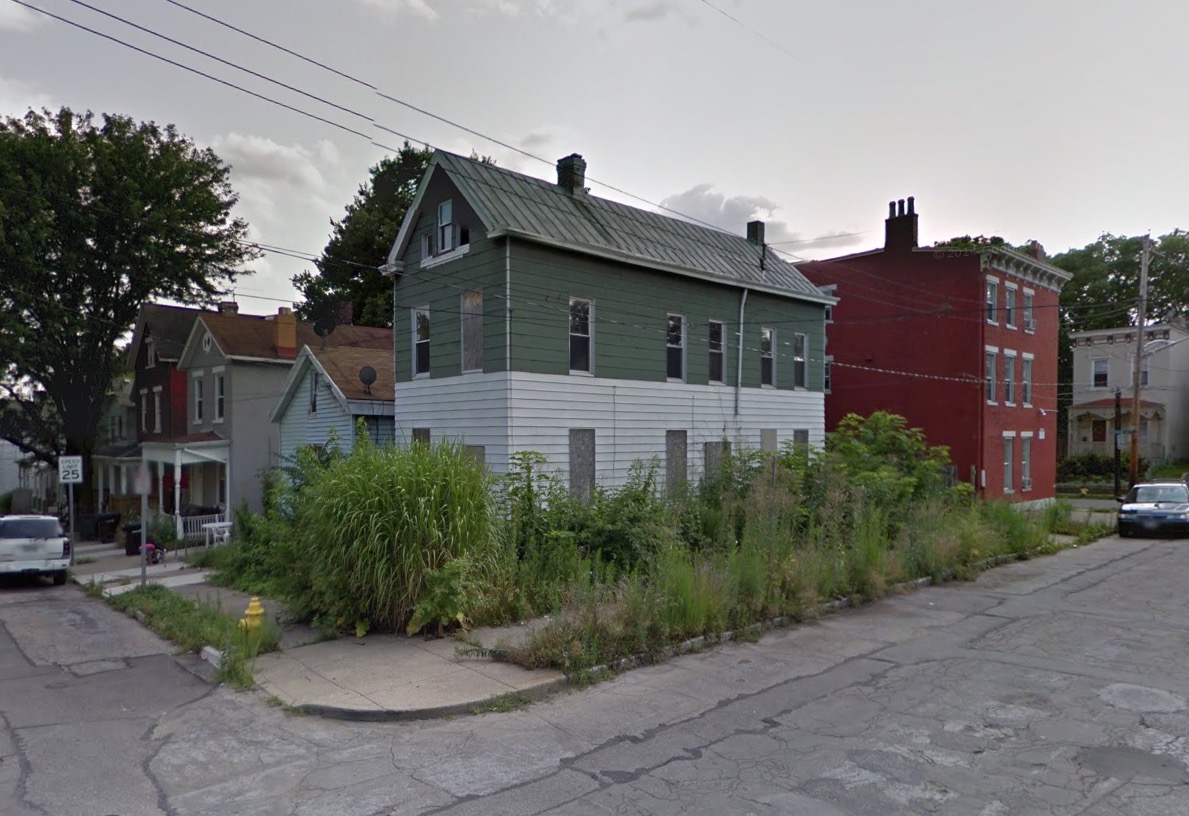
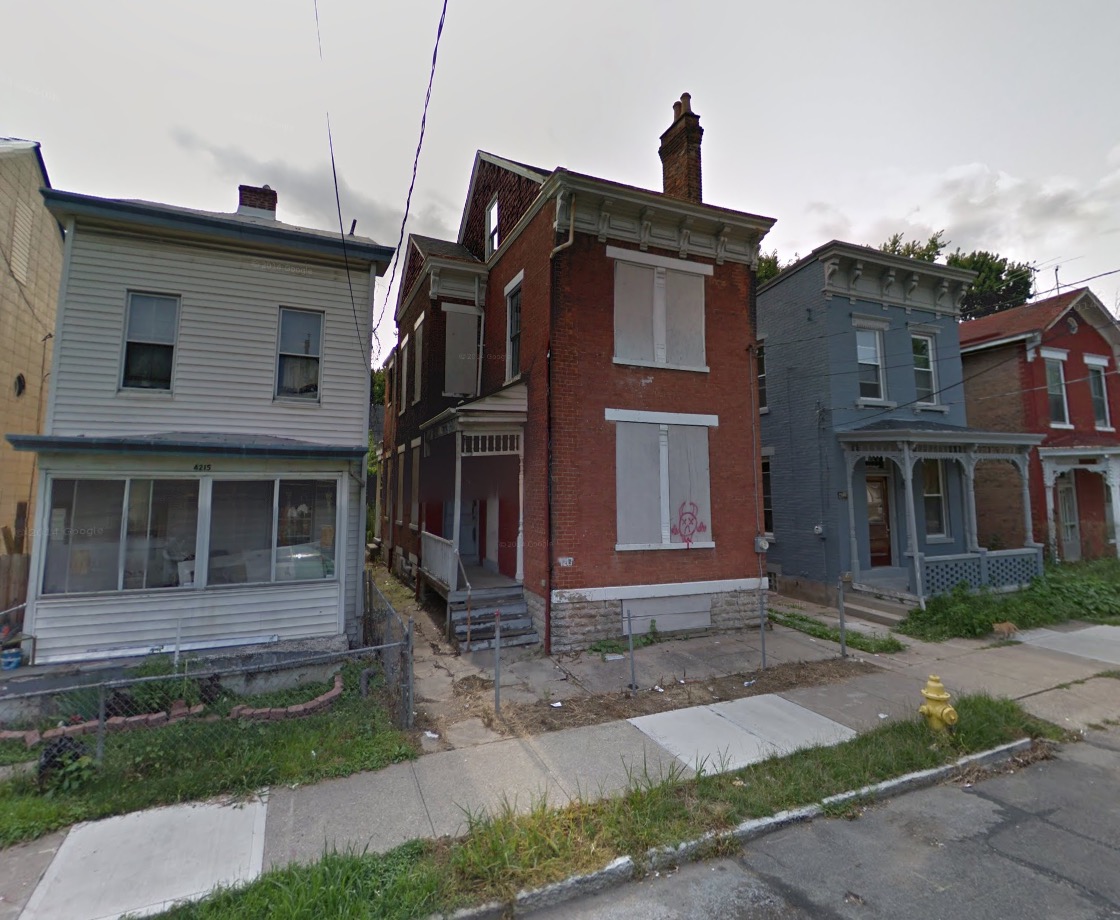
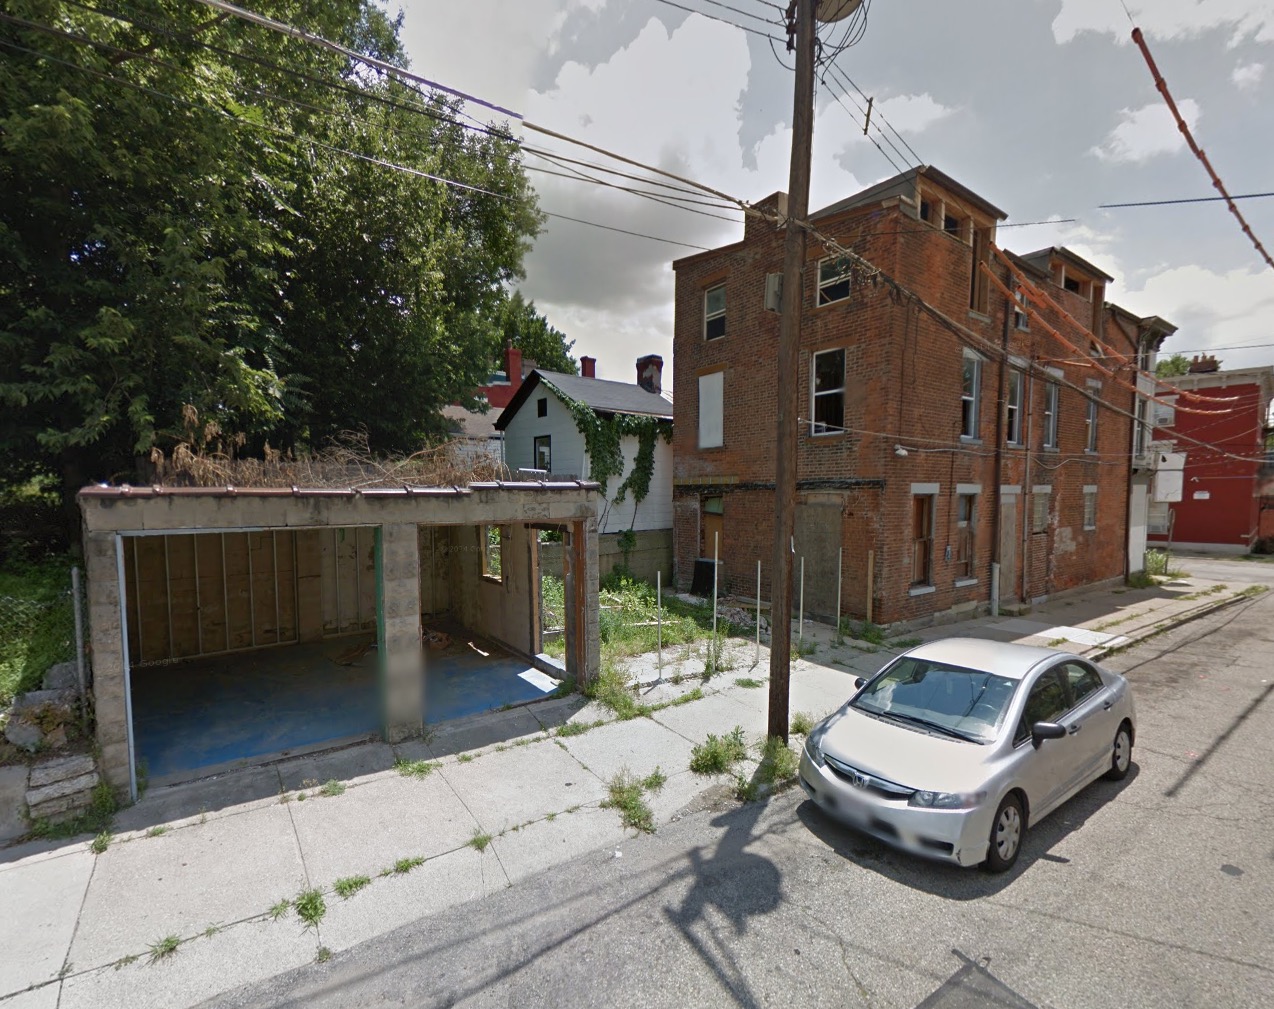
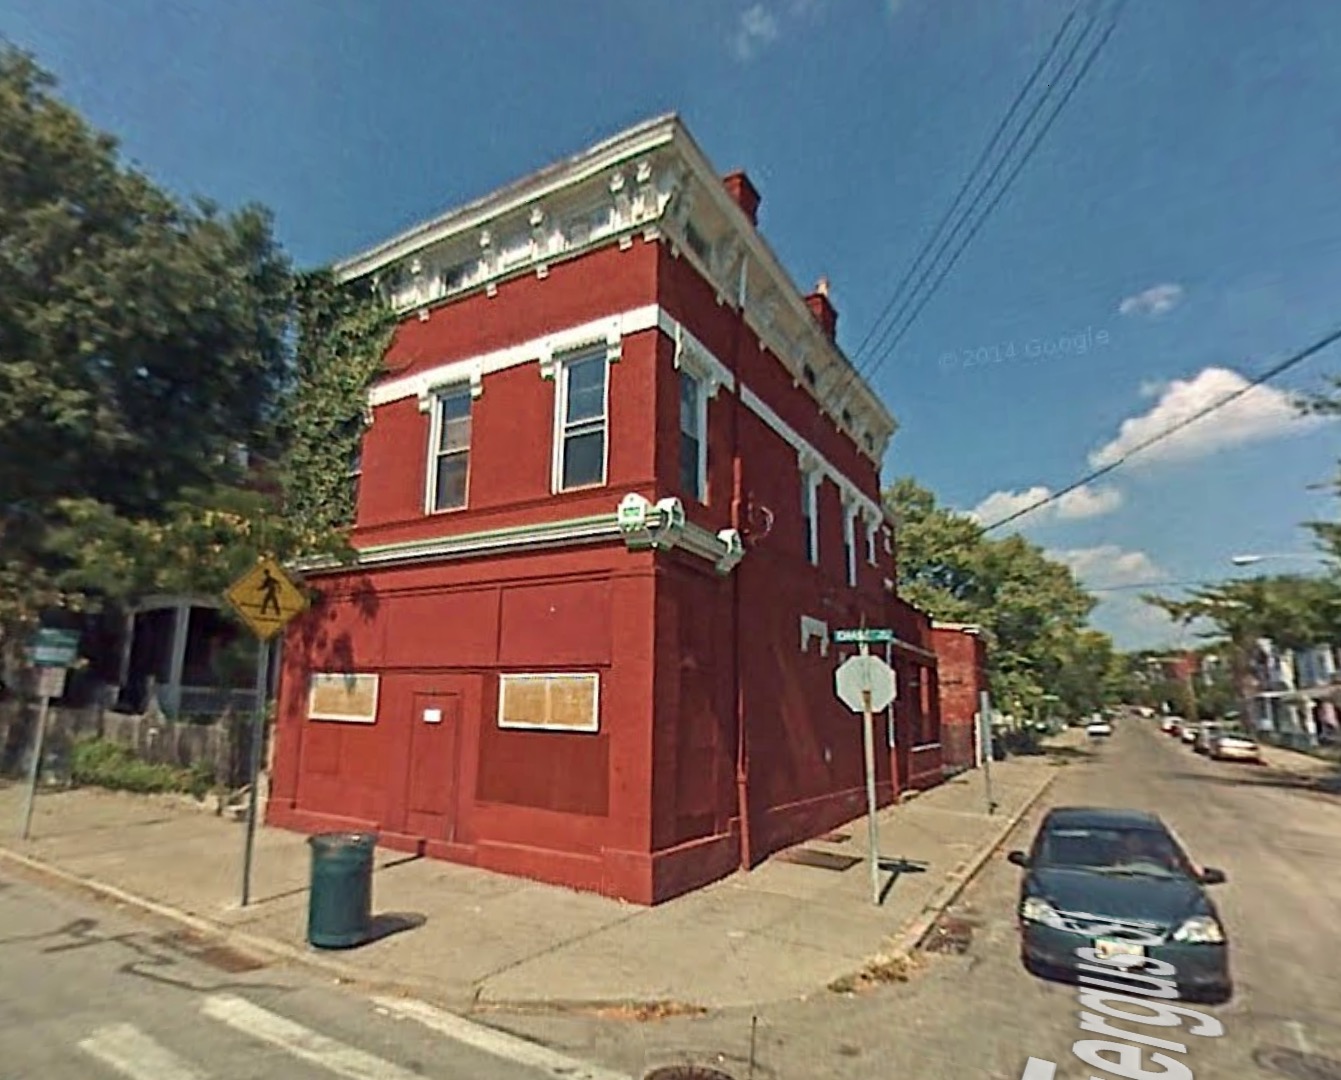
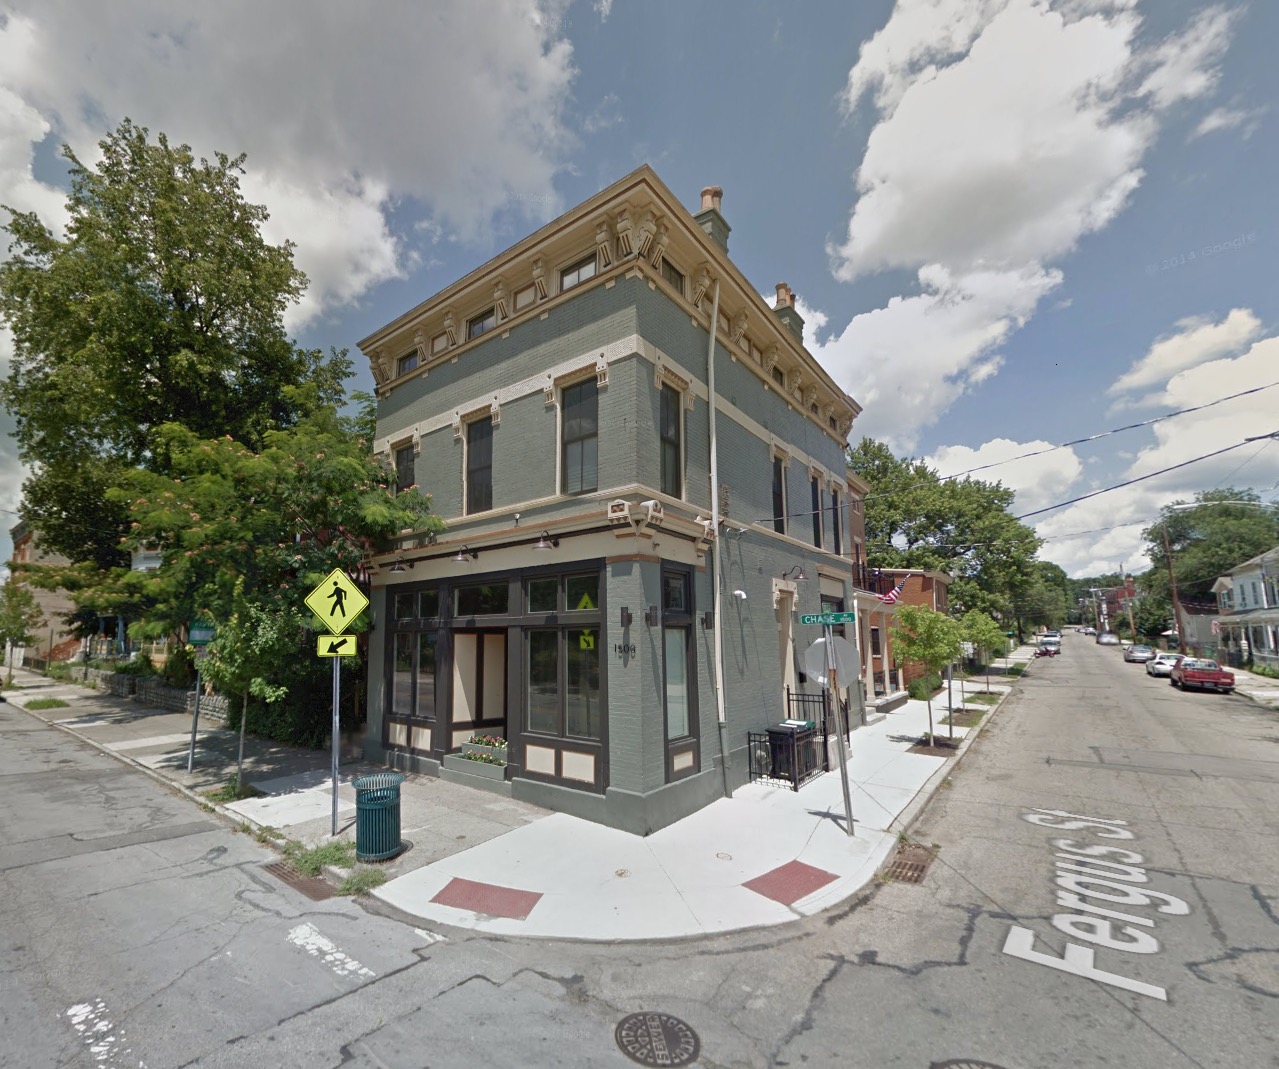
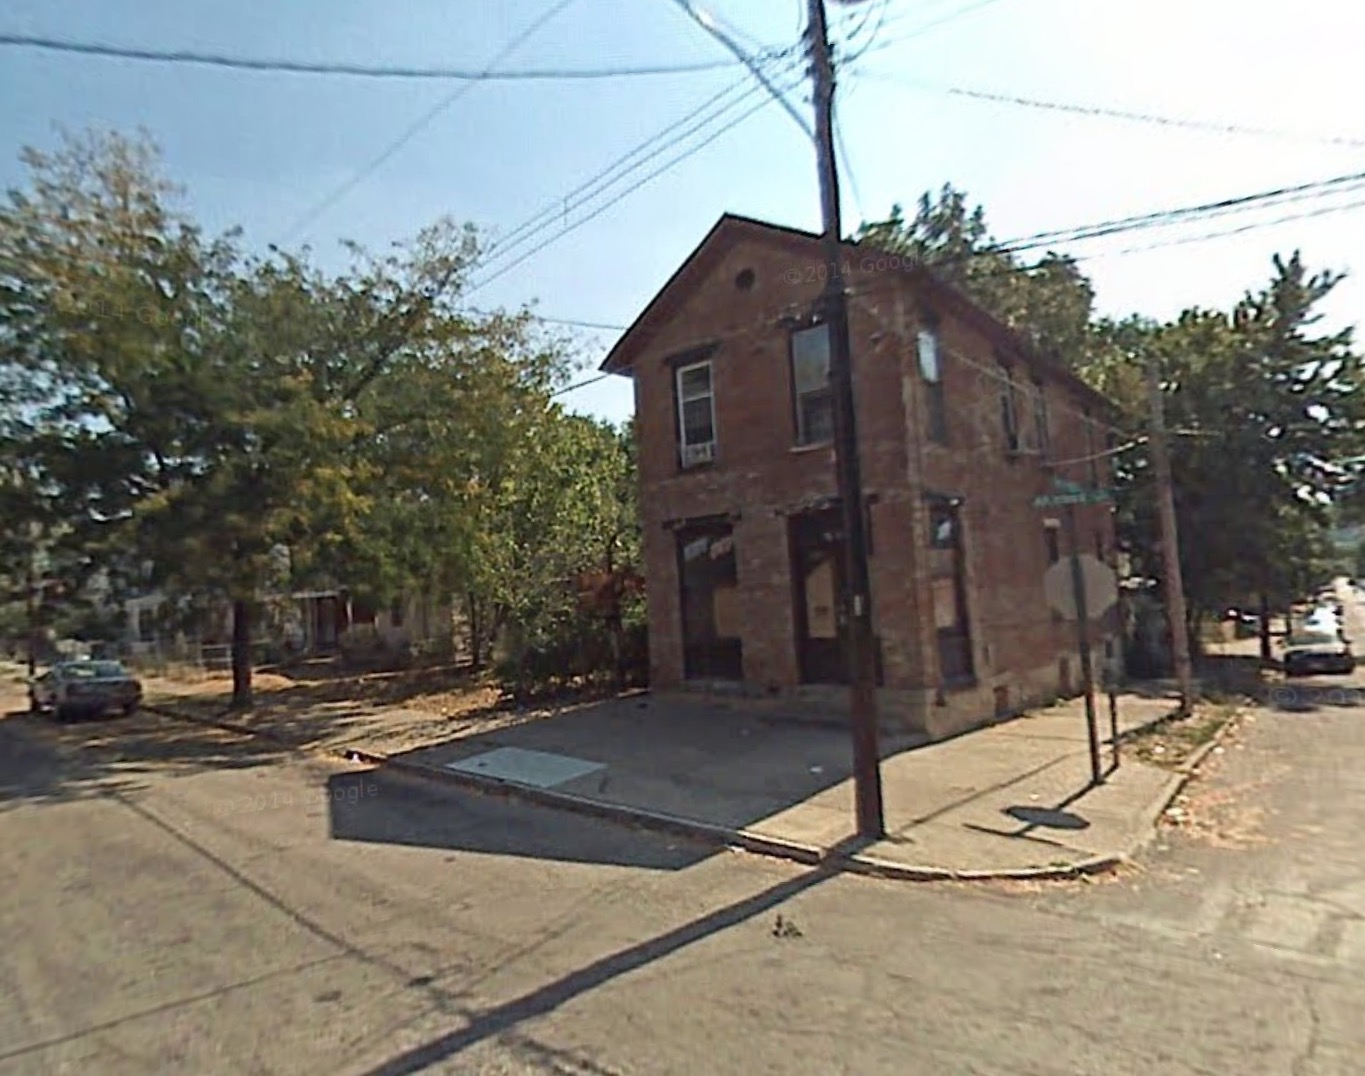
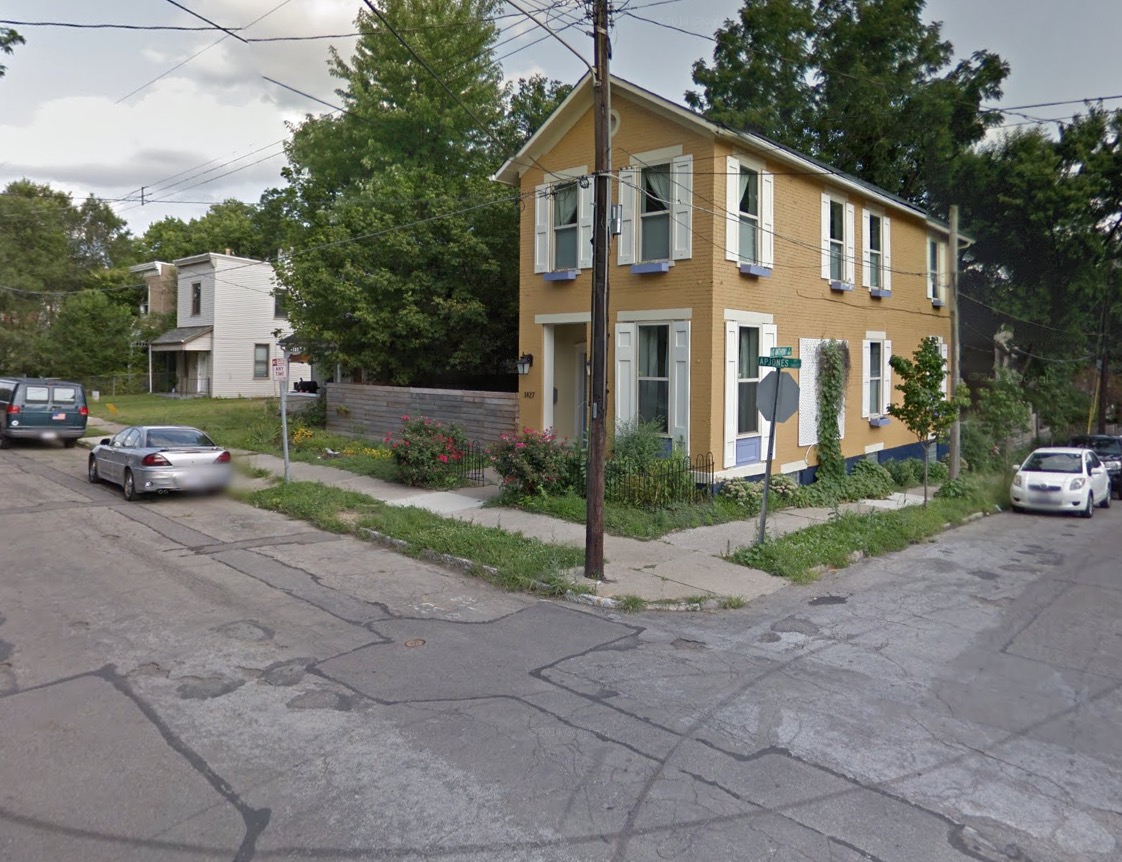
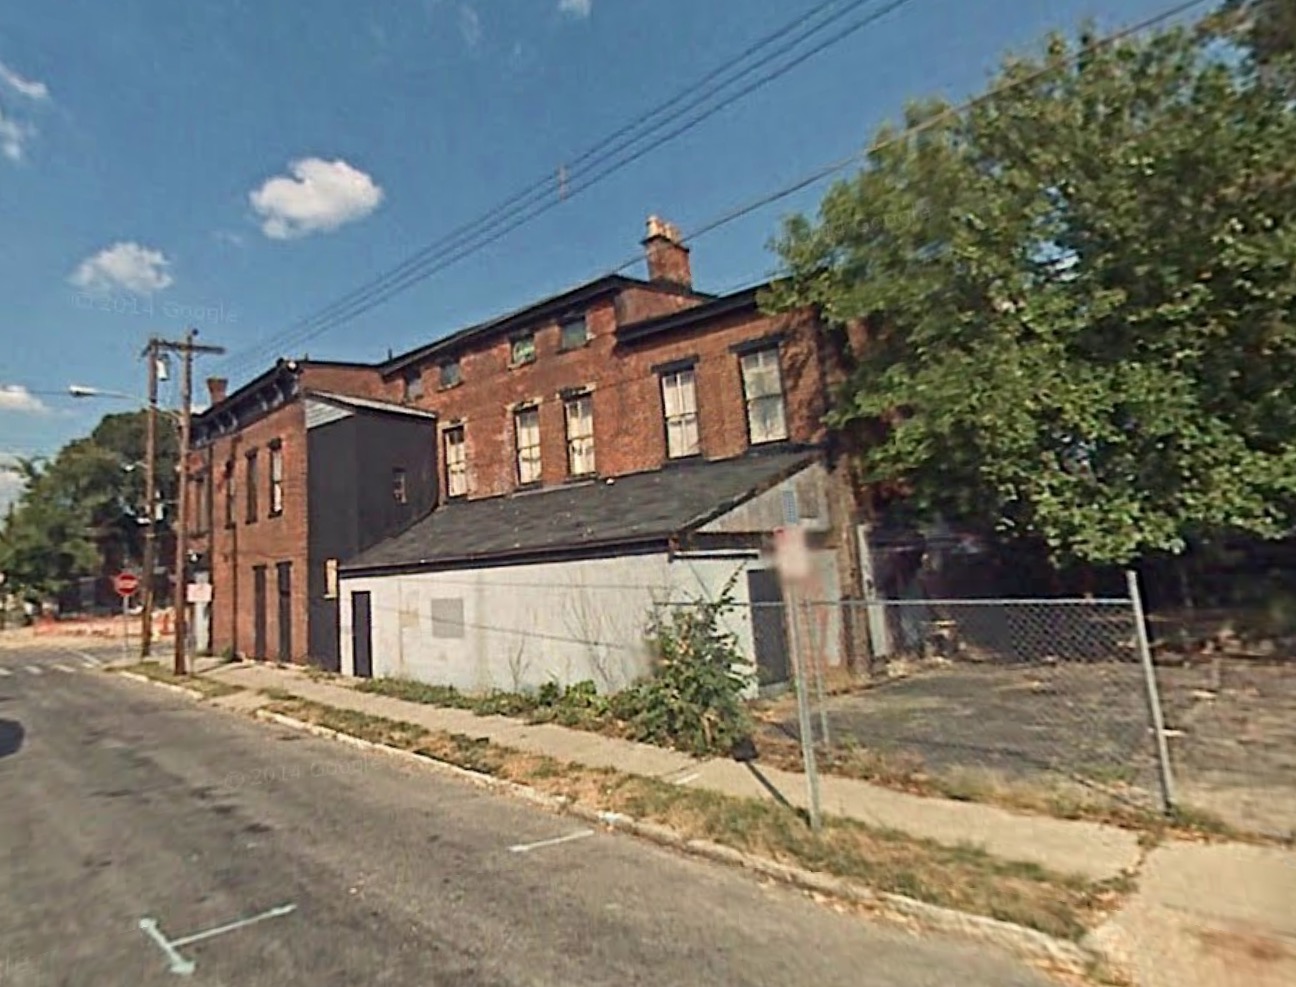
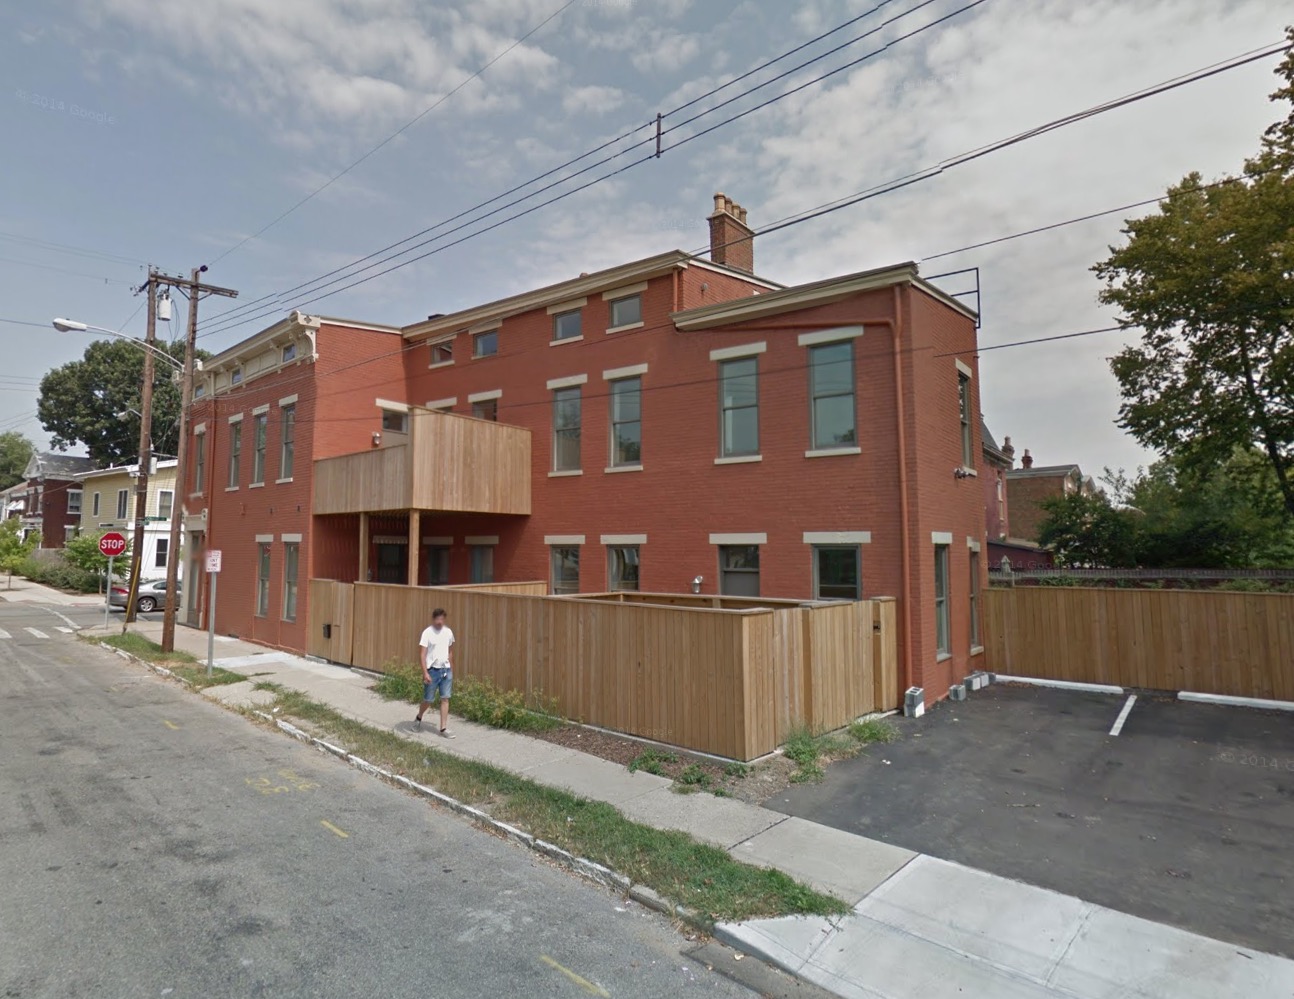
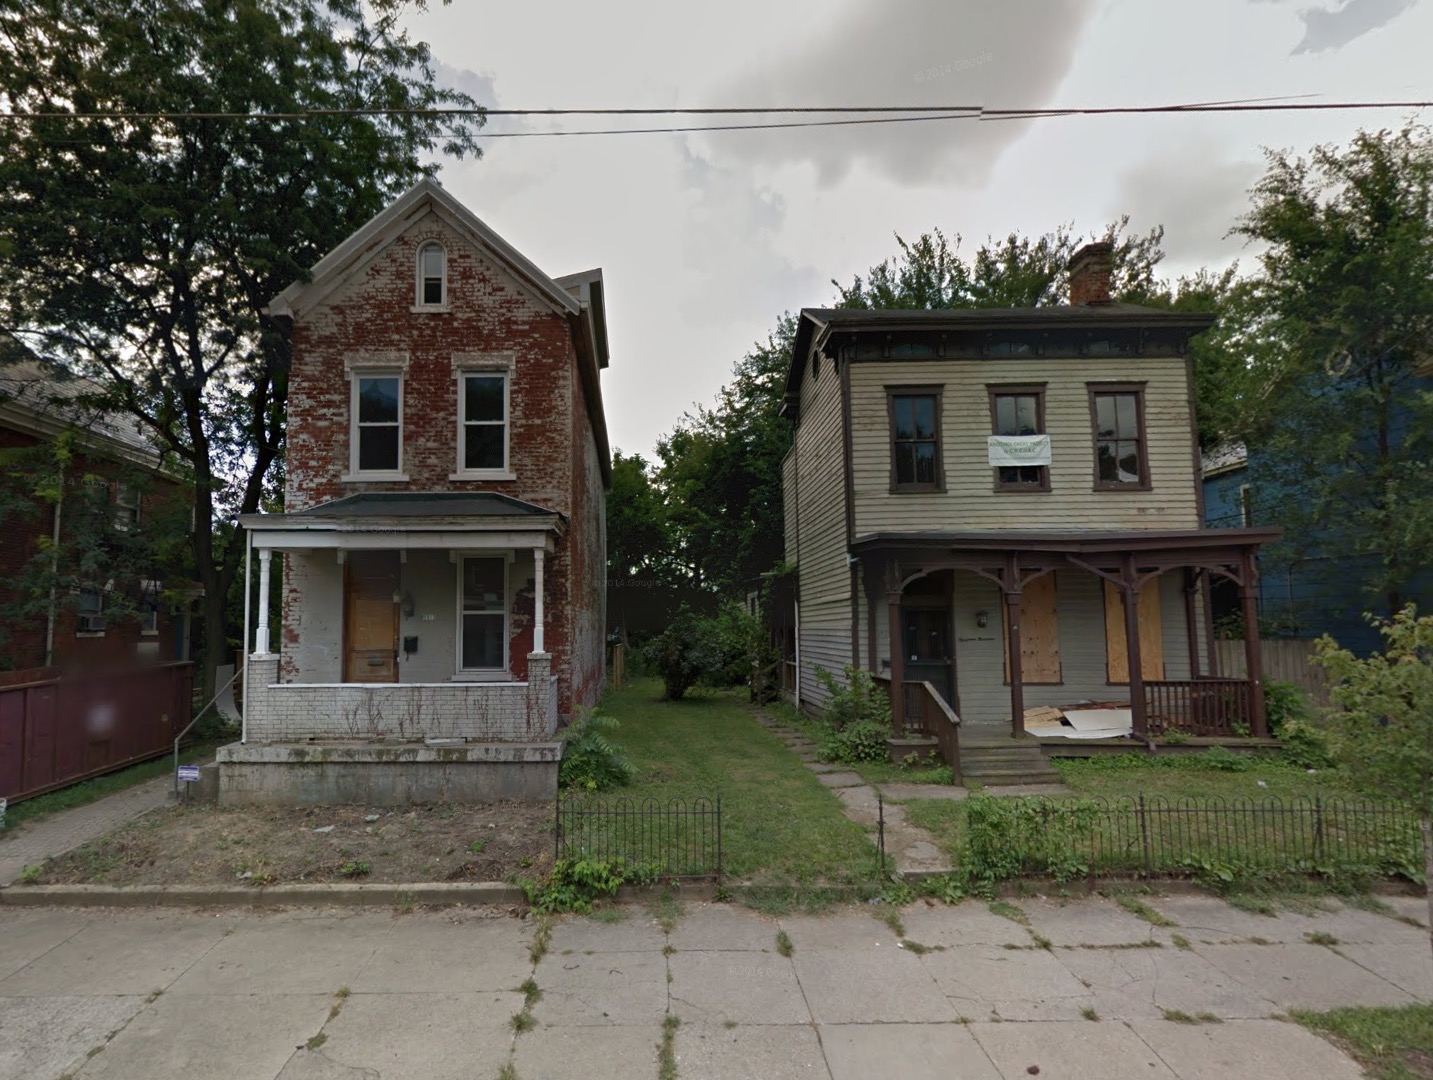
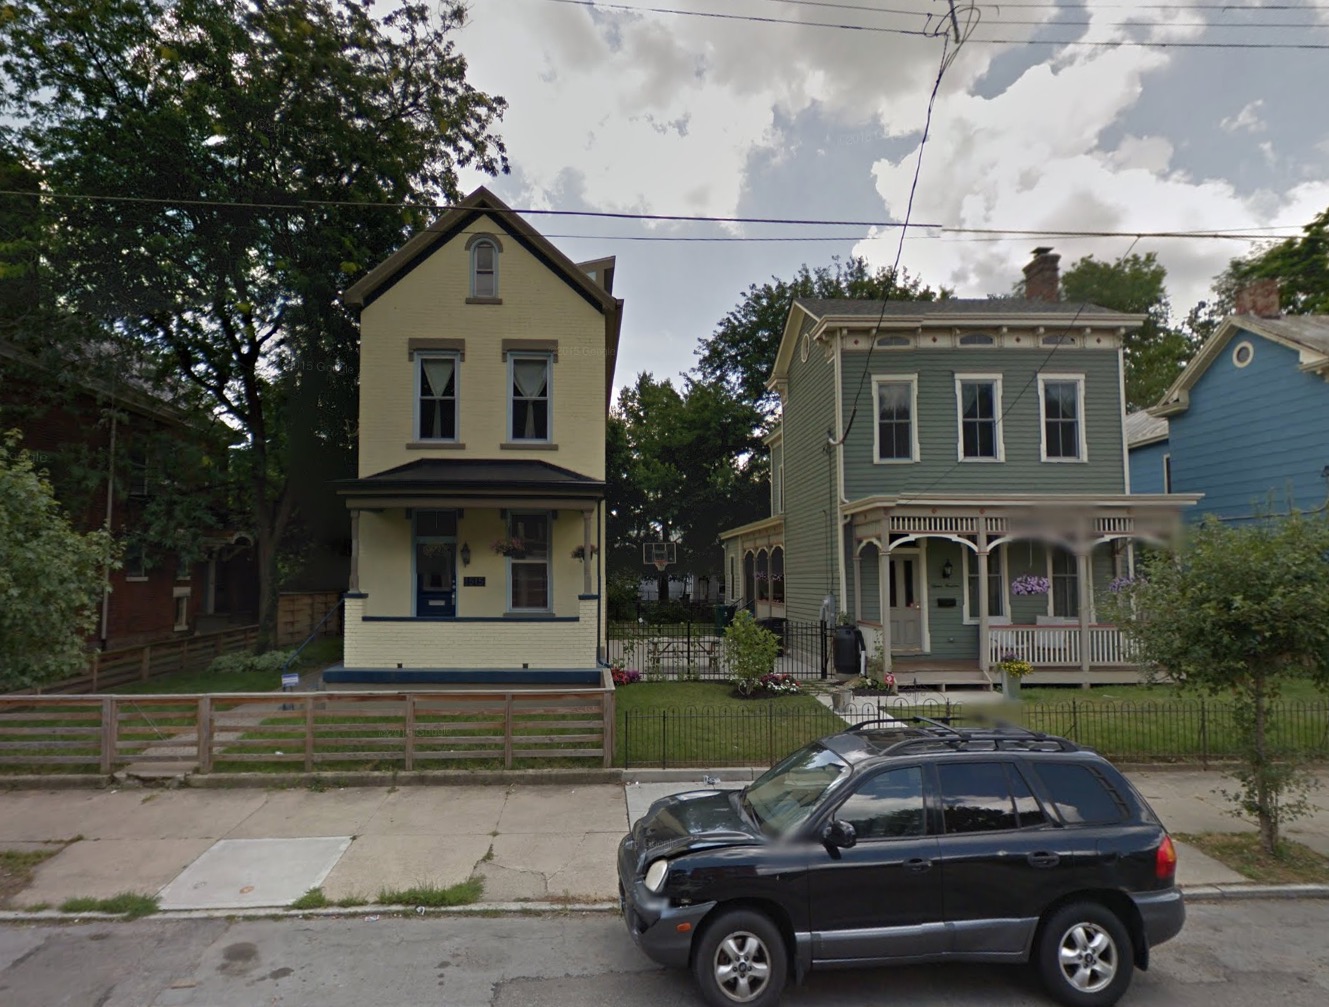
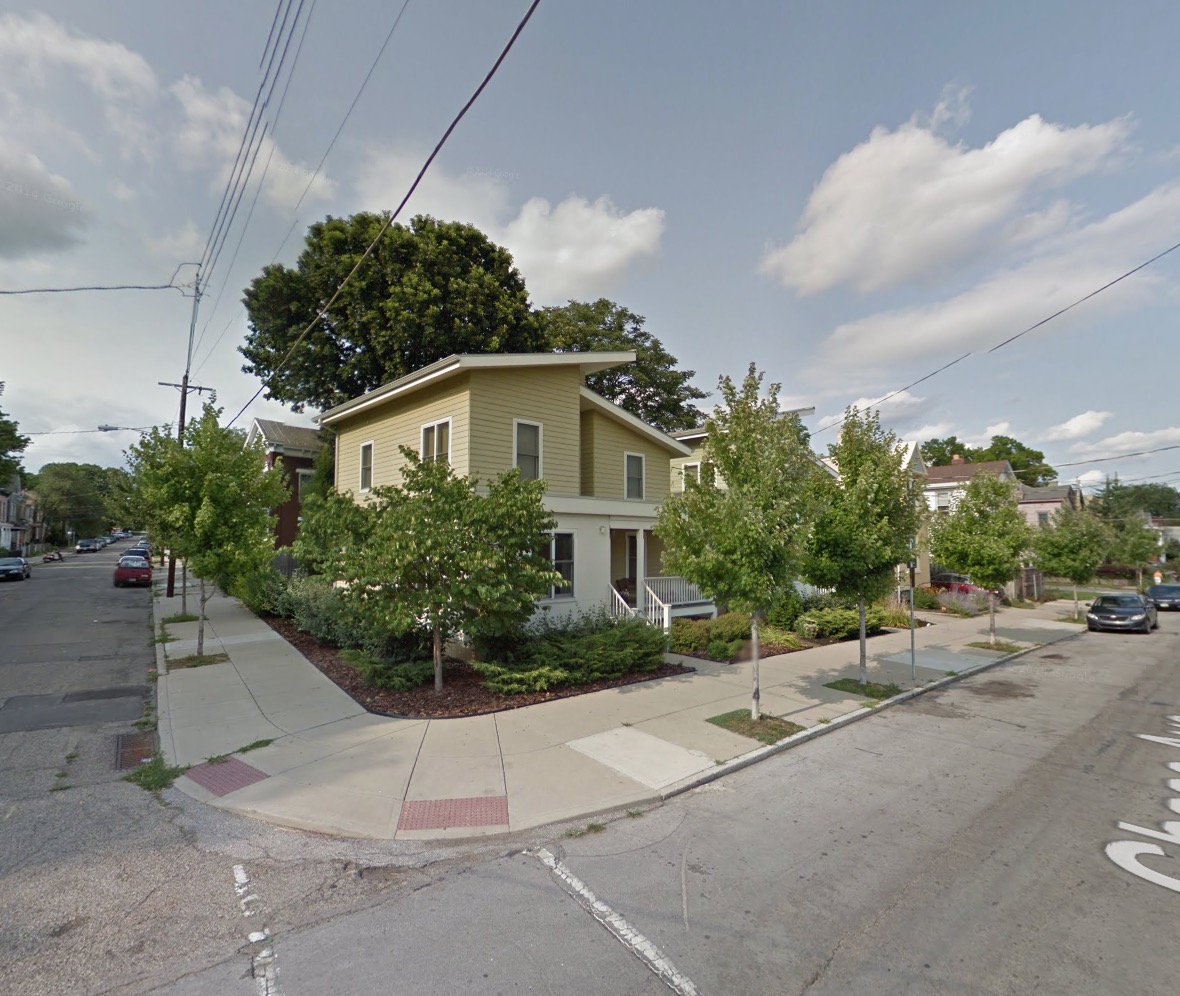
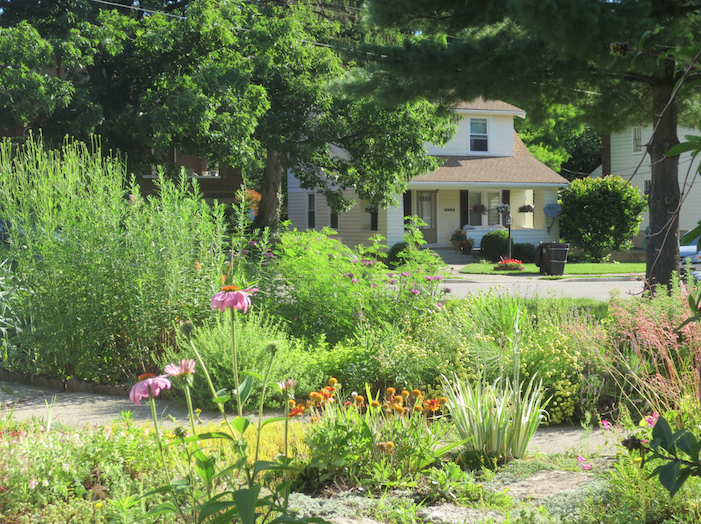
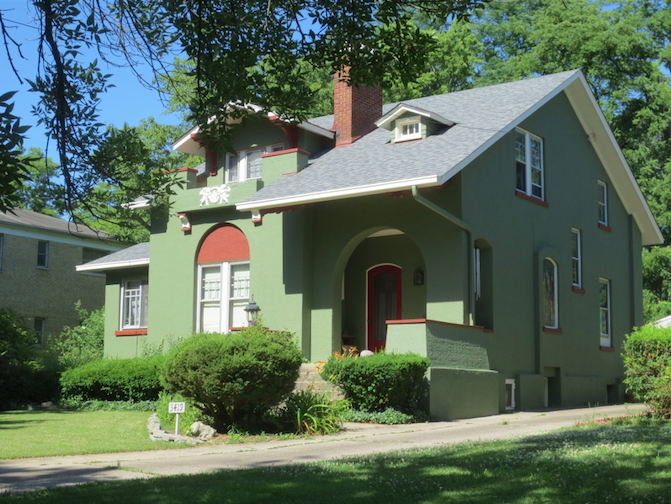
    Here are some before and after photos of buildings in the immediate neighborhood curtesy of Google Street View. Since the Google van has driven by a few times in the last decade it’s possible to see the same buildings from the perspective of different years. People have consistently been buying up cheap run down properties, fixing them up, and incrementally improving the neighborhood. This is no longer a place of permanent decline and disinvestment. The area hit bottom a few years back and it’s already on the way back up. It’s not entirely there yet, but it’s well on its way.

    Screen Shot 2015-06-20 at 1.17.02 PMGoogle

    Screen Shot 2015-06-20 at 1.17.35 PMGoogle

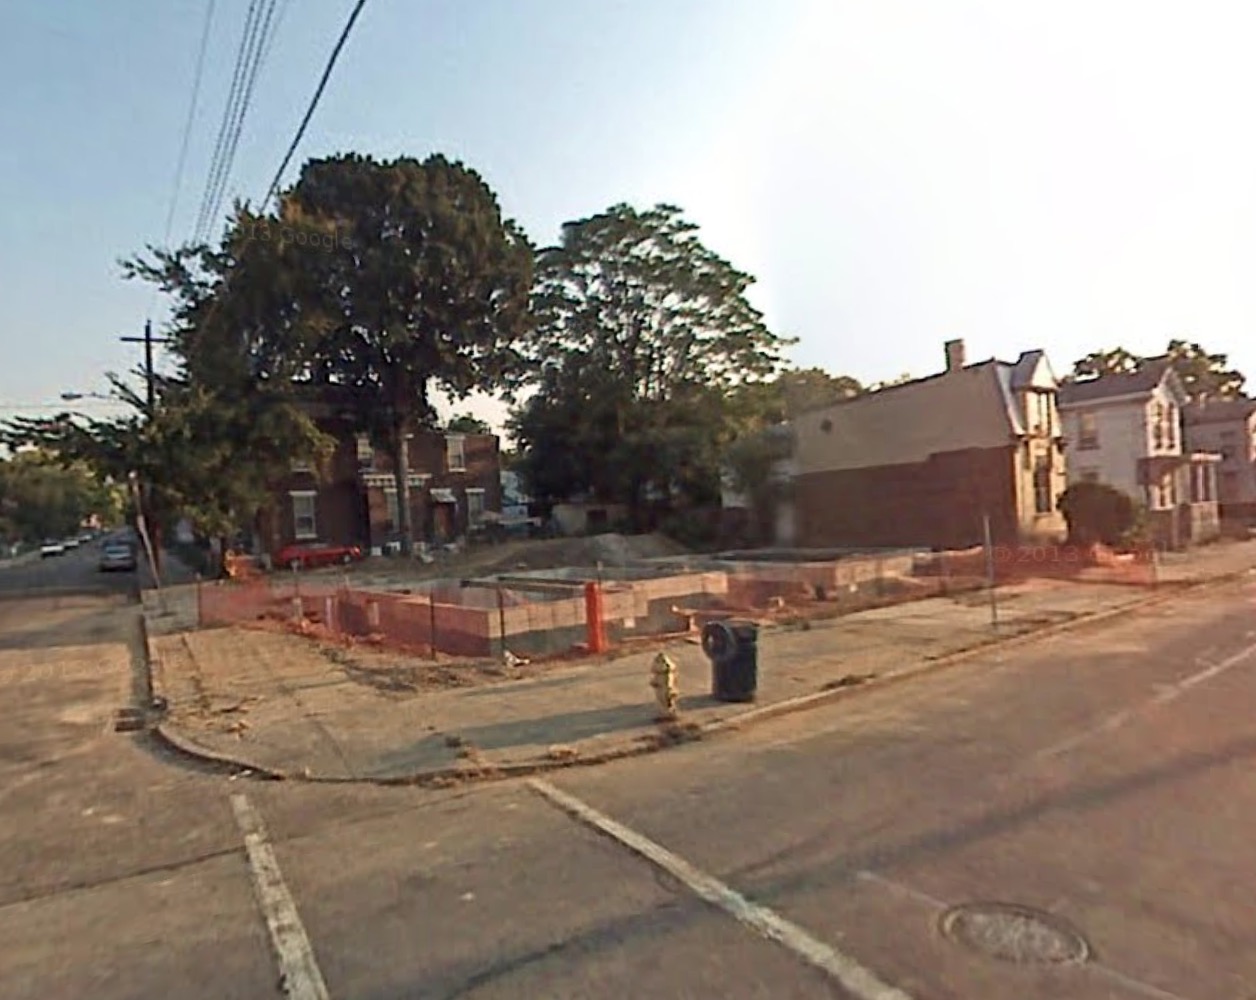
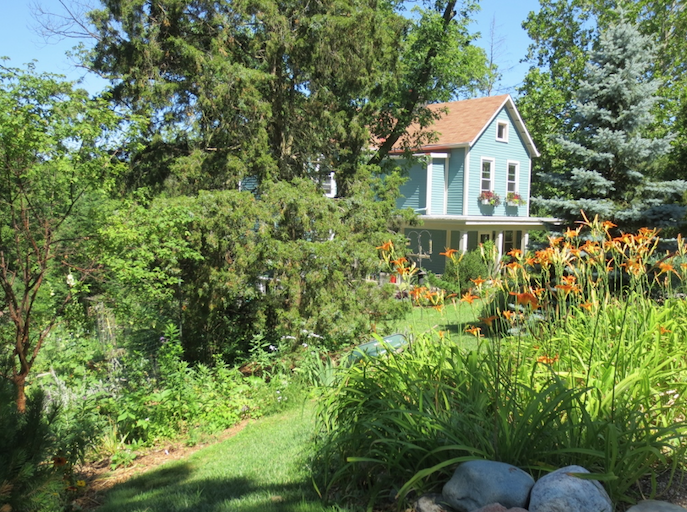
    In addition to recently renovated older buildings, vacant lots are sprouting quality new construction. These two homes are LEED certified for energy efficiency.

    Screen Shot 2015-06-20 at 2.30.02 PMGoogle

    GantryUAV21gantrylife.com / bayerbecker.com

    CornerView copy1_0csoinc.net / bayerbecker.com

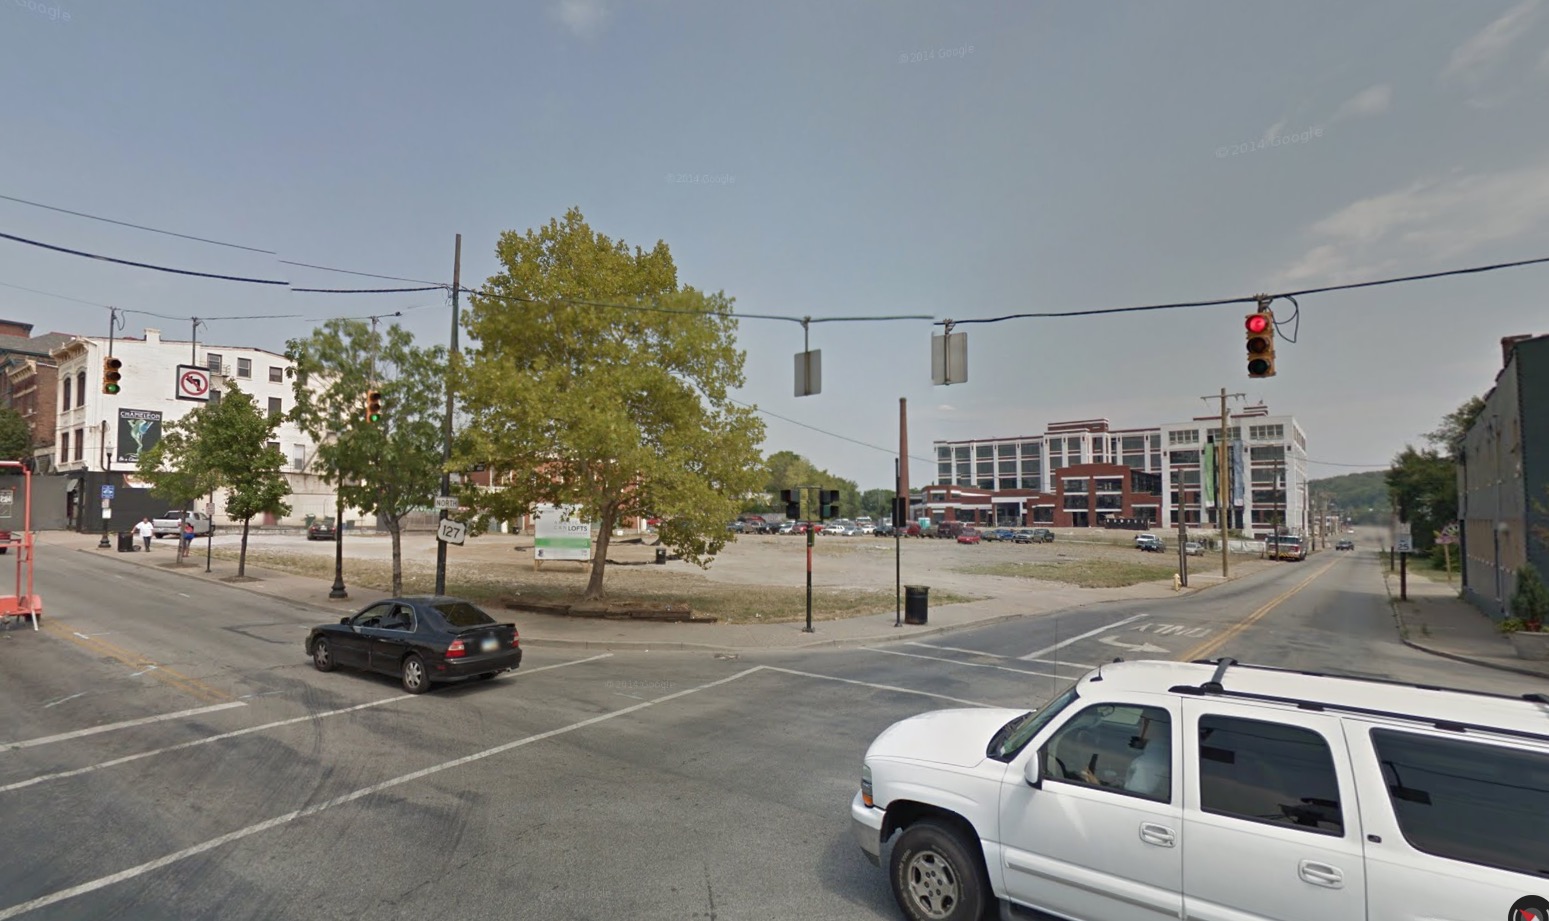
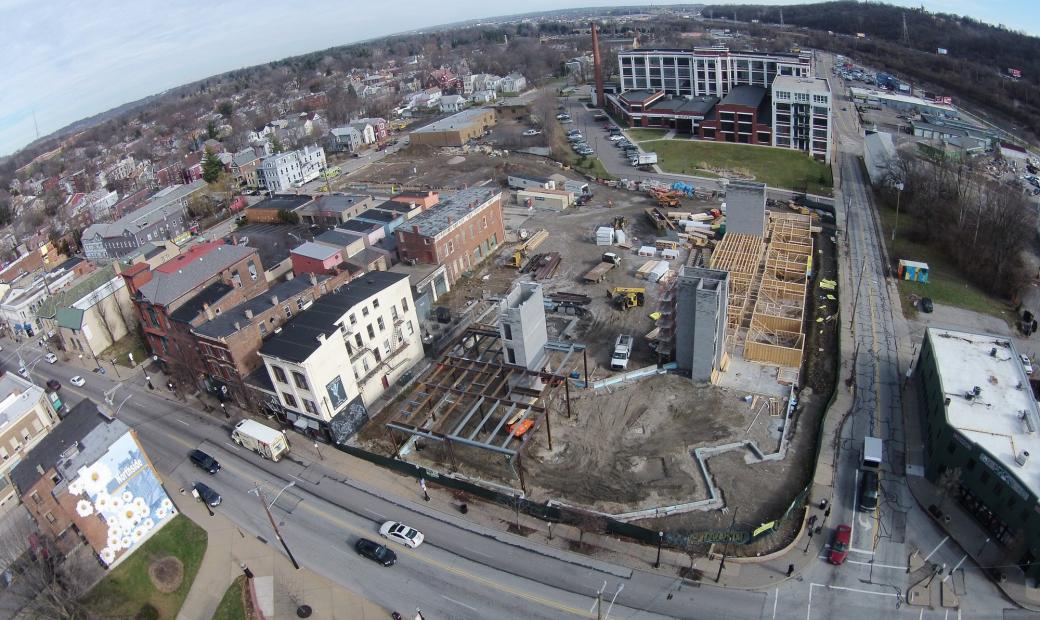
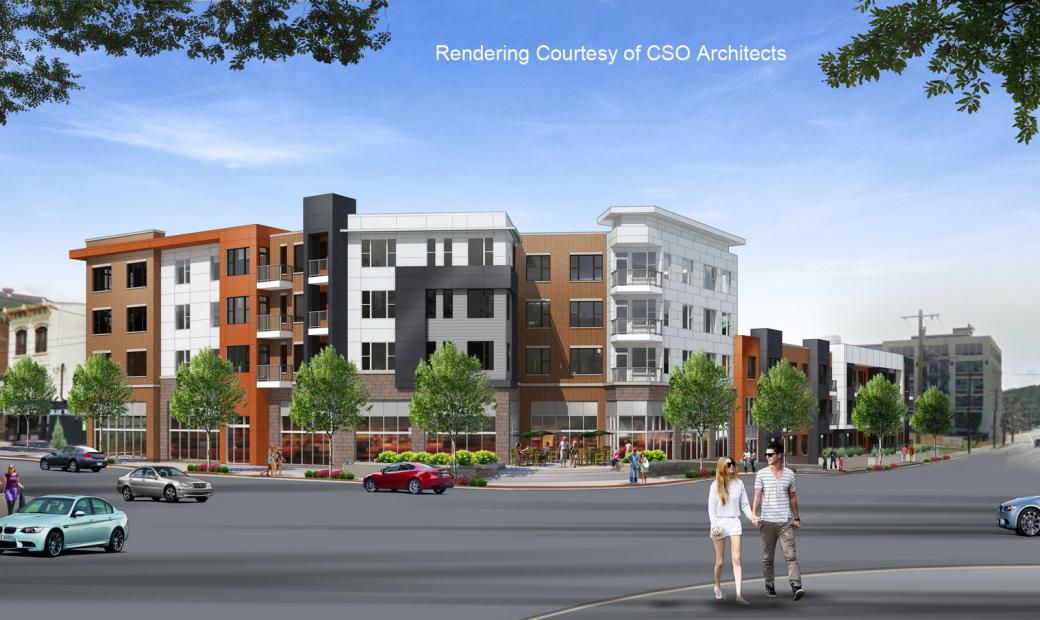
    A few blocks away a larger vacant parcel is currently being redeveloped into a market rate multi-million dollar mixed use building by an out-of-state firm. I’ve noticed that local companies don’t always appreciate their own assets, but plenty of well funded ventures from other metro areas are taking advantage of the opportunities on offer in Cincinnati.

    Screen Shot 2015-06-20 at 4.57.52 PMGoogle

    Screen Shot 2015-06-20 at 4.56.41 PMGoogle

    unnamed-3

    unnamed-1

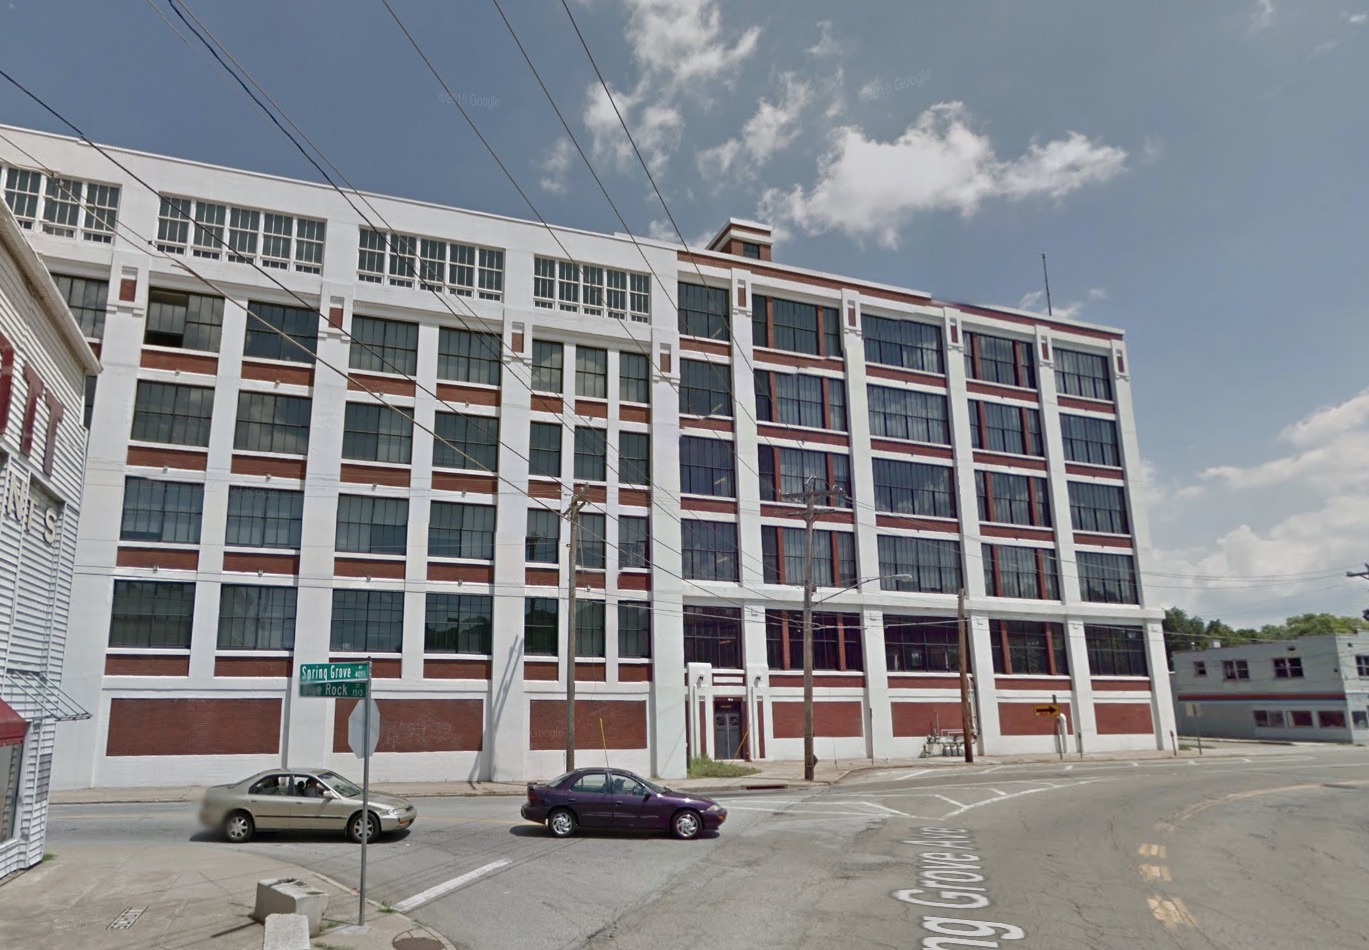
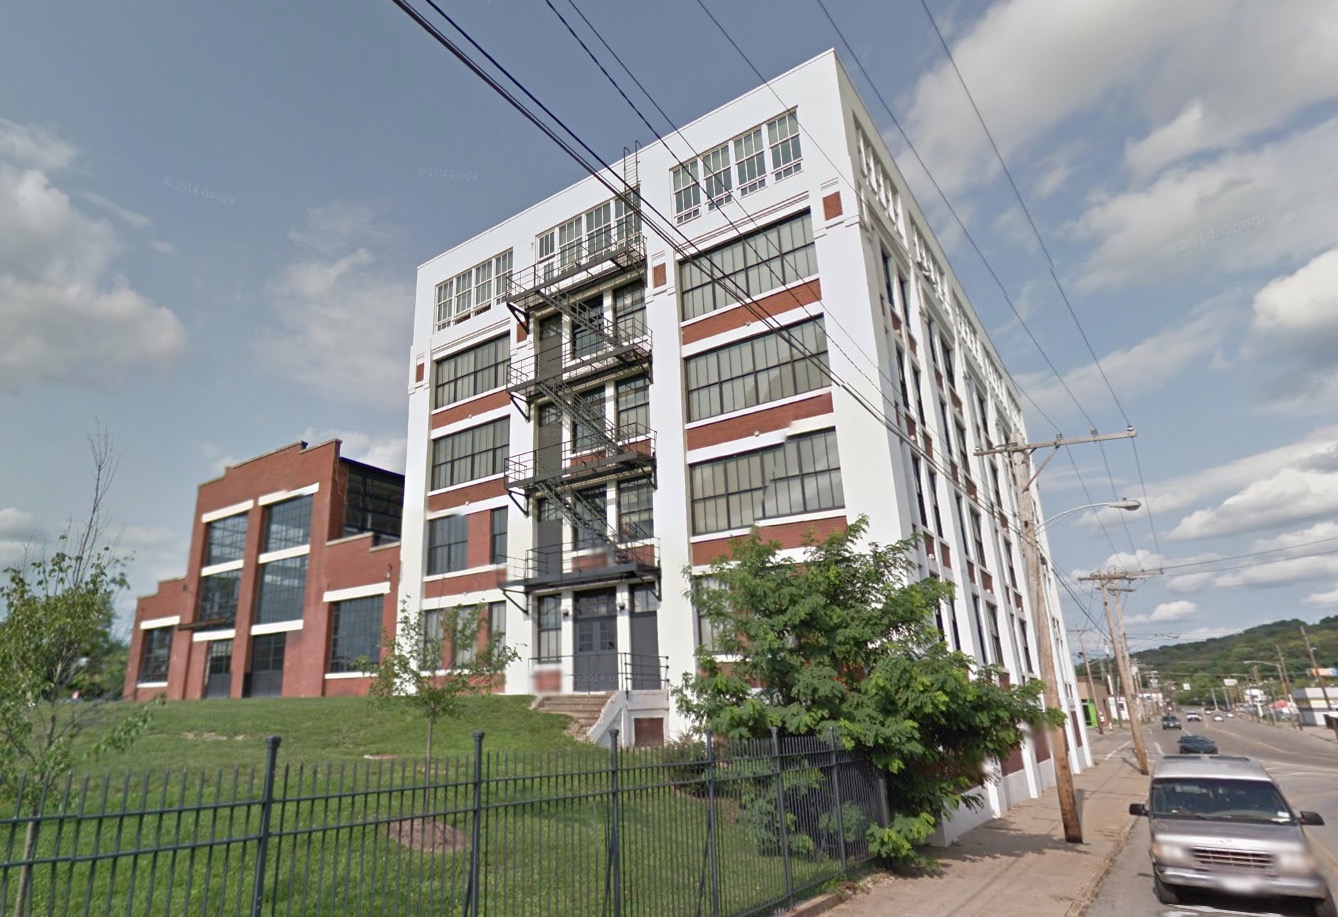
    Right next door is the American Can Lofts building which was completely transformed in 2011 after siting empty since 1978. I arrived in Cincinnati for the first time a few years ago just as this building was having its grand reopened. That takes me to how a guy from San Francisco ended up looking at property in Cincinnati in the first place. Which takes me to why I think Cincinnati is such a great investment.

    Screen Shot 2014-12-05 at 1.11.18 AM

    Screen Shot 2014-12-05 at 1.05.23 AM

    Screen Shot 2014-12-05 at 1.11.59 AM

    I have long time friends-of-the-family in Los Angeles. Their daughter graduated from university, got married, and promptly left California. She and her husband explored the country looking for a place to live that they both liked and could afford. (That ruled out nearly every inch of California.) They lived in Baltimore, Maryland for a while and then Portland, Oregon for a year before moving to Cincinnati. They could afford Baltimore and appreciated its gritty charm. But they really loved Portland – give or take the ridiculously high rent and real estate values. What they wanted was Portland at a Baltimore price.

    And then they moved to Cincinnati. Ahhhhhh. They bought a charming century old four bedroom house in perfectly good condition for $50,000. It was the best thing any young couple could have done, both financially and in terms of their quality of life. If they had stayed in Los Angeles or Portland they would still be renting (with room mates) and just scraping by. In Cincinnati they became comfortably middle class home owners at the tender age of twenty five. Their mortgage is $400 a month. And they’ve had no trouble finding good work or like minded friends. They aren’t the only young people making this kind of move. Which is probably why out-of-state developers are investing in the city.

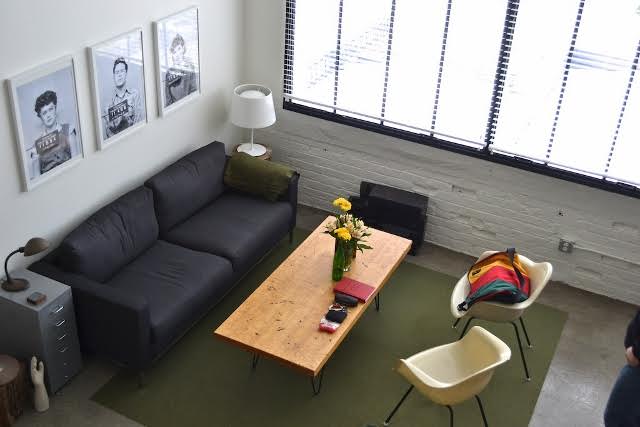
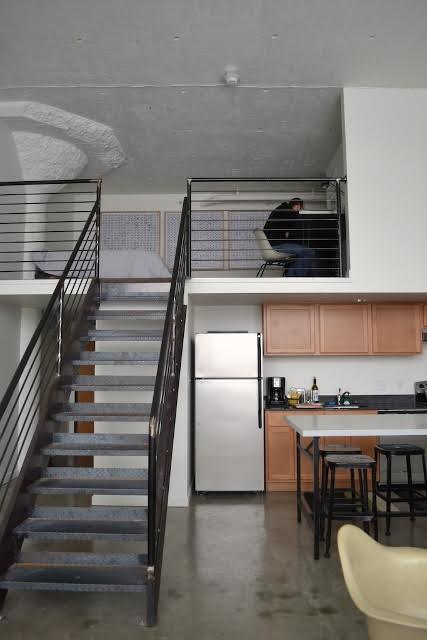
    The odd thing about Cincinnati is that while the existing housing stock is very reasonably priced, good quality space is commanding fairly high rents. Apartments in the America Can building go for $610 for a one bedroom up to $1,480 for a three bedroom – and there’s a waiting lists. My inner capitalist sees a generous spread between affordable property and the potential for solid rent from solvent tenants. If I can provide a high quality building I believe I can find good people to occupy the space at a rent that’s reasonable for them and profitable for me. And I can do it without taking on debt and without being a slumlord. Try that in San Francisco and see how far you get…

    I just hired a young local architect to help with the reconstruction. This is going to be a fun little adventure. And I’m really happy that old guy who was trying to give me advice lives in the distant suburbs. He’d be a terrible neighbor.

    John Sanphillippo lives in San Francisco and blogs about urbanism, adaptation, and resilience at granolashotgun.com. He’s a member of the Congress for New Urbanism, films videos for faircompanies.com, and is a regular contributor to Strongtowns.org. He earns his living by buying, renovating, and renting undervalued properties in places that have good long term prospects. He is a graduate of Rutgers University.

  • Australia’s Recipe for Urban Decay

    Across federal, state, and local levels, Australian urban planning authorities have emphasized the need for policies that seek to limit urban fringe development and create densely-populated urban centers. This process is called ‘urban consolidation’ and has been a goal of Australian authorities for more than three decades. More specifically, urban consolidation is defined by efforts to concentrate housing, jobs, and amenities around “activity centers” such as a traditional downtown, satellite urban centers, and elongated strategic corridors. These high-density areas are to be separated by green belts of undeveloped land and connected by public transport links such as trains and light rail systems.

    Australian planners’ efforts to establish a high-density urban form have been effective, at least from their point of view. From 1981 to 2011, housing stock in Sydney, Melbourne, and Brisbane saw a large shift towards high-density units. A net total of 640,000 new multi-unit dwellings were built during this time, representing an increase of over 115%. This surge forced the proportion of multi-unit housing to increase to nearly one-third of the total housing supply in cities that have historically been dominated by single-family dwellings.1

    As Australia moves toward higher-density cities, what will be the result? Urban planners assert that their policy decisions are thoroughly researched and provide the “best” outcomes, but evidence from Australia’s largest cities tends to refute that claim. Among the numerous issues that arise due to consolidation ideology, perhaps the most disturbing are the severe impacts on housing affordability, poverty, and housing quality.

    Urban consolidation policies, by definition, are aimed at choking the supply of new single-family detached housing by limiting urban fringe growth as a means of minimizing the urban footprint. This is intended to drive more and more of the urban population into compact living situations. Thus, by limiting the supply of single-family detached housing and pushing more households into the market for multi-family housing, urban consolidation causes home prices to rise in both markets. As Figures 1 through 5 show, this is exactly what has happened in cities that adopt consolidation ideology. The Australian Bureau of Statistics reports that “the price of established houses in the capital cities rose by almost half (46%) between 2002-03 and 2008-09, with prices increasing at an average of 6.5% per year.”2 From 2001 to 2011, the number of dwellings in Sydney costing less than AUD $275 in rent per week decreased by 52% while the number of dwellings costing more than $275 in weekly rent surged by 269%; in Melbourne, the number of dwellings that cost at least $650 per week in rent more than tripled. Homeowners in Sydney and Melbourne have also seen tremendous increases in mortgage payments. In the same ten-year period, there was a seven-fold increase in the number of households in Sydney and Melbourne paying more than $4,000 per month in mortgage payments, while the number of households paying less than $1,000 per month was cut in half.3  At a time when wages and income have been stagnant, this means a severe decrease in housing affordability, meaning fewer Australians are able to afford the highly sought-after stability of homeownership.

    Given the profile of buyers and sellers, the market for dense multi-family housing is predominantly driven by investors, landlords, and institutional property owners.4 Thus the large majority of occupants are renters, not owner-occupiers, and there is no reason to infer that this ownership pattern will change.  As Australian cities continue to densify, ownership demand – that is, the market for the purchase and sale of housing units – will be driven less by owner-occupiers and more by investors and landlords, who have historically been the dominant players in multi-unit dwelling markets. This latter group of owners responds to market conditions in a different way than the owner-occupier group, and the shift is likely to have a profound impact on economic and socio-political outcomes in the long-term.

    In housing markets, there are two groups of consumers: investors, who intend to lease the units after buying, and owner-occupiers, who intend to live in the residences themselves. Owner-occupiers purchase homes for personal consumption; their decision about which home to buy is driven by the quality of the housing, access to transportation and employment, amenities in the surrounding area, and the sense of financial stability provided by owning one’s own home. Investors, on the other hand, are quite different. By definition, investors are driven by profit. They are seeking rental income from tenants as well as appreciation in the value of both the property and the underlying land. They evaluate properties based on the potential cash flows from renting and the price they can receive when they sell the property sometime in the future.

    But investors’ motives may become distorted in Australia due to a policy known as ‘negative gearing.’ Negative gearing, in terms of real estate investment, allows any negative cash flow from a single property to be deducted from the investor’s total taxable income.5 This gives investors   an incentive to purchase properties where the mortgage payments exceed rental income, especially if value of the property is appreciating. This pushes up the after-tax returns to investors which inflates housing prices even further. It also provides investors with greater incentive to make speculative purchases, which increases home price volatility and instability.

    What happens when you throw urban consolidation policies into the mix? As urban planners continue to choke the supply of new land, the price of existing land continues to accelerate upward. When investor profits are increasingly driven by speculating on the land value rather than income from the tenants, investors are more inclined to purchase lower-value properties which require less maintenance and fewer capital expenditures yet enjoy the same increases in underlying land value. By this logic, we could expect that low-income housing would increase in value at a faster pace than higher-quality housing as investors bid up the prices, which is exactly what happened in Sydney’s last real estate boom.6 Low-value properties are also more likely to provide investors with the support of negative gearing since they typically provide the lowest rental revenues. But investors, looking primarily at tax advantages, are less likely to improve the properties or even maintain existing structures. Thus, we can see how more and more investors not only have the incentive to compete for low-value housing units, where there is already insufficient supply, but also neglect those units in the long-term. Such market pressures are already noticeable in Sydney and Melbourne, where urban consolidation has been occurring for a longer time, and will certainly arise in Brisbane, in the state of Queensland, as planners establish growth boundaries for its booming population.7

    But it doesn’t stop there. This problem is exacerbated by the nature of Strata title plans, which have come to dominate the market for higher density housing in Australia. Essentially, strata titling comes from legislation passed in the 1960s whereby each apartment unit or flat on a parcel of land can be owned individually, and thus a mortgage could be taken out in order to purchase individual high-density housing units. This is similar to a condominium ownership structure in the United States, but with a few key shortcomings. Although strata titling allows a few individuals living in high-density areas to enjoy homeownership, it primarily benefits investors who now only have to purchase single units instead of entire multi-family buildings. Even worse, strata titling’s lack of consideration for common areas poses a serious issue in the long run for the maintenance of high-rise buildings and their surrounding neighborhoods, especially in areas of lower income. According to Bill Randolph, Director of the City Futures Research Center at the University of New South Wales, “the strata system may come badly unstuck in lower value areas where investor landlords have little incentive to reinvest in their property and home owners do not have the wherewithal to afford major repair costs.”8

    Putting it all together, what can we expect to be the future for Australia? Urban consolidation policies continue to push more Australians out of suburban homes and into cramped apartments, where housing markets are dominated by investor-landlords instead of owner-occupiers. The consolidation policies will squeeze the supply of land and force dwelling prices to rise regardless of rental revenue, promoting speculative behavior among investors. Negative gearing and strata titling programs incentivize these investors to neglect their properties, causing high-density areas (especially low-income neighborhoods) to deteriorate. The end result is slum-like conditions, social tension, and perpetual poverty for the neighborhood’s inhabitants. Even in higher-value neighborhoods, a lack of necessary upkeep will erode housing quality, even as prices continue to inflate. This is the reality of urban consolidation; it takes ownership out of the hands of Australians and puts it in the hands of speculative and neglectful investor-landlords. It is nothing short of a recipe for urban decay.

    Clinton Stiles-Schmidt graduated magna cum laude from Chapman University where he earned a Bachelor of Science in Business Administration (emphasis in Real Estate and Finance) and a Bachelor of Arts in Economics. His experience includes several internships in real estate investment and development as well as studying abroad in both Spain and Australia. Clinton recently joined Cushman & Wakefield as an Analyst in their Corporate Finance & Investment Banking Group.


    Figure 1: Ratio of Housing Debt to Disposable Income in Australia9

    Figure 2: Weekly Rent Payments in Sydney10

    Figure 3: Monthly Mortgage Payments in Sydney11

    Figure 4: Weekly Rent Payments in Melbourne12

    Figure 5: Monthly Mortgage Payments in Melbourne13


    1 "Community Profiles." ABS Census 1986-2011. Australian Bureau of Statistics, 1 Oct. 2014. http://www.abs.gov.au/websitedbs/censushome.nsf/home/communityprofiles.

    2 "Measures of Australia’s Progress, 2010." Australian Bureau of Statistics, 15 Sept. 2010. http://www.abs.gov.au/ausstats/abs@.nsf/Lookup/by%20Subject/1370.0~2010~Chapter~House%20prices%20(5.4.4.1)

    3 "Community Profiles." ABS Census 1986-2011. Australian Bureau of Statistics, 1 Oct. 2014. http://www.abs.gov.au/websitedbs/censushome.nsf/home/communityprofiles.

    4 Randolph, Bill. "Delivering the Compact City in Australia: Current Trends and Future Implications." City Future Research Centre, University of New South Wales, 1 June 2006.

    5 Koulizos, Peter. "How Negative Gearing Works." The Realestate.com.au Blog. Realestate.com.au, 21 Oct. 2013. http://www.realestate.com.au/blog/how-negative-gearing-works/.; "Real Estate." Australian Tax Office. Australian Government, 22 Jan. 2013. https://www.ato.gov.au/General/Capital-gains-tax/In-detail/Real-estate/

    6 Hill, Robert J., Daniel Melser, and Iqbal Syed. "Measuring a Boom and Bust: The Sydney Housing Market 2001–2006." Journal of Housing Economics 18.3 (2009): 193-205. ScienceDirect. Web. http://www.sciencedirect.com/science/article/pii/S1051137709000321

    7 Yu, Xiaojiang. "‘The Great Australian Dream’ Busted on a Brick Wall: Housing Issues in Sydney." Cities 22.6 (2005): 436-45. ScienceDirect. Web. http://www.sciencedirect.com/science/article/pii/S0264275105000879 ; Stimson, Robert J., and Shane P. Taylor. "City Profile: Brisbane." Cities 16.4 (1999): 285-95.ScienceDirect. Web. http://www.sciencedirect.com/science/article/pii/S0264275199000104

    8 Randolph, Bill. "Delivering the Compact City in Australia: Current Trends and Future Implications." Urban Policy and Research 24.4 (2006): 473-90. City Futures, June 2006. Web. https://www.be.unsw.edu.au/sites/default/files/upload/researchpaper6.pdf

    9 "RBA: Statistical Tables." Reserve Bank of Australia, 26 Sept. 2014. http://www.rba.gov.au/statistics/tables/.

    10 "Community Profiles." ABS Census 1986-2011. Australian Bureau of Statistics, 1 Oct. 2014. http://www.abs.gov.au/websitedbs/censushome.nsf/home/communityprofiles.

    11 Ibid.

    12 Ibid.

    13 Ibid.

    Sydney suburb photo by BigStockPhoto.com.

  • Stack and Pack vs. Smear All Over

    I drove out to a distant suburb recently to attend to some business and I passed by a cluster of billboards on the side of the freeway that got me thinking. The general gist of the slogans asserted a conservative anti-government anti-urban rebellion. These are clearly people who don’t want density and public transit imposed on them by pointy headed liberal idiots. I have to admit I have some sympathy for this perspective, although probably not for the same reasons as the billboard people. Their knee jerk reaction makes clear what they don’t want, but offers no alternative response to the underlying difficulties faced by the inevitable urbanization of rural areas.

    Screen Shot 2015-06-06 at 1.45.36 AM

    Screen Shot 2015-06-06 at 1.44.07 AM

    Screen Shot 2015-06-06 at 1.44.23 AM

    Screen Shot 2015-06-06 at 1.43.24 AM

    Screen Shot 2015-06-06 at 1.43.47 AM

    Screen Shot 2015-06-06 at 3.07.22 AM

    Screen Shot 2015-06-06 at 3.05.57 AM

    Screen Shot 2015-06-06 at 3.05.27 AM

    Screen Shot 2015-06-06 at 3.06.59 AM

    Screen Shot 2015-06-06 at 3.06.43 AM

    Here’s the fantasy of how this particular area should remain: bucolic landscapes, family farms, charming old homes, and delicate churches with little graveyards out back. But these are all part of a heritage park. School children are brought here to learn what the place was like in the 1850’s.

    Screen Shot 2015-06-06 at 3.08.52 AM

    Screen Shot 2015-06-06 at 3.11.23 AM

    Screen Shot 2015-06-06 at 3.10.27 AM

    Screen Shot 2015-06-06 at 3.08.27 AM

    Screen Shot 2015-06-06 at 3.08.08 AM

    Screen Shot 2015-06-06 at 3.13.18 AM

    Turn the camera just slightly to the left or the right and the landscape is filled with gas stations, parking lots, drive-thru banks, and freeway traffic. And everywhere there’s new construction. Money (lots and lots of San Francisco Bay Area money) and a whole lot of people are inevitably going to be occupying what is now open space in these distant counties. No political force can stop it. There are two competing models for what that new growth is going to look like and neither is pretty as far as I’m concerned.

    Screen Shot 2014-11-17 at 5.42.47 PM

    Screen Shot 2014-11-17 at 5.43.17 PM

    Screen Shot 2014-11-17 at 5.41.57 PM

    Screen Shot 2014-11-17 at 5.42.34 PM

    First, there’s the compact, dense, transit oriented development favored by regional planners. (This is precisely the kind of thing the billboard people are so pissy about.) Now… I live in a compact, dense, transit oriented neighborhood in San Francisco that I think is amazing. But when I look at what’s being built in the far flung suburbs I find nothing to love about any of it. The scale is overwhelming. Each of these complexes occupies a massive super block. And it’s not just the size per se that I don’t like. It’s the fact that these buildings have all the drawbacks of density without any of the compensating urbanism. Where are the shops on the ground floor? Where’s the corner grocery? Where are the cafes and nightclubs? Where are the intimate little restaurants and pocket parks? Where are the vibrant walkable places? There just aren’t any. These places are as lifeless as any cul-de-sac, minus the space and privacy provided by a tract house with a yard. It’s not a good combination.

    Screen Shot 2015-06-05 at 5.43.30 PM

    Screen Shot 2015-06-05 at 5.41.17 PM

    Screen Shot 2015-06-05 at 5.38.59 PM

    Screen Shot 2015-06-05 at 5.42.04 PM

    Screen Shot 2015-06-06 at 2.54.54 AM

    Screen Shot 2015-06-05 at 5.42.41 PM

    Screen Shot 2015-06-06 at 2.55.35 AM

    Screen Shot 2015-06-06 at 3.13.37 AM

    Here’s the second option. Traditional American values brought to life in shiny new single family homes with three car garages as far as the eye can see. This is the alternative to big bad government and communist apartment blocks. Luxury homes chew up the countryside and load the freeway with an unmanageable amount of traffic. And by the way, these homes each cost $1.4M.

    I compare this political situation with the dilemma the country faced in the early 1980’s when Reagan came to power. Conservatives hated the idea that the government operated halfway houses and insane asylums. They wanted no part of drug treatment programs either. At the same time liberals insisted that it was inhumane to lock people up against their will in underfunded and uncaring institutions where they were likely to be mistreated. So the two opposing elements of society conspired to shut down such institutions. The problem, of course, is that the mentally ill, drug addicted, and penniless segment of American society didn’t just disappear. They now live on our streets and fill our prisons. Both sides got what they wanted, but the problems persist in slightly different forms. So it is with the battles over land use regulation. Happenstance brings us a funky world and we all just muddle through some how.

    John Sanphillippo lives in San Francisco and blogs about urbanism, adaptation, and resilience at granolashotgun.com. He’s a member of the Congress for New Urbanism, films videos for faircompanies.com, and is a regular contributor to Strongtowns.org. He earns his living by buying, renovating, and renting undervalued properties in places that have good long term prospects. He is a graduate of Rutgers University.

  • The California Dream has Moved Away

    Southern California faces a serious middle income housing affordability crisis. I refer to middle income housing, because this nation has become so successful in democratizing property ownership that the overwhelming majority of middle income households own their own homes in most of the country.

    Recently I had the privilege of participating in a forum on this subject sponsored by the Urban Land Institute, Los Angeles Housing Chapter in Century City. The forum also included a presentation from USC Professor Dowell Myers and was chaired by Ehud Mouchly, who chairs the Housing Chapter. This article is adapted from my presentation.

    I am a native Angeleno, having been born near Temple and Alvarado, less than two miles from City Hall. I was appointed to three terms on the Los Angeles County Transportation Commission (LACTC) by Mayor Tom Bradley, where I played a pivotal role in the establishment of the Los Angeles rail system. LACTC and SCRTD were the two predecessors to the current Los Angeles County Metropolitan Transportation Authority (MTA).

    In addition, for 11 years, Hugh Pavletich of Christchurch, New Zealand and I have published the Demographia International Housing Affordability Survey. The latest edition was released in January and included median multiple data for 86 major metropolitan areas and nearly 300 smaller metropolitan areas in nine nations. Finally, I publish the most comprehensive annual review of world urbanization, providing population, land area and density for world urban areas with over 500,000 population (See World’s 1,000 Largest Cities: World Urban Areas 2015 Edition).

    All of this makes housing in Southern California and urban development particularly interesting to me.

    The Imperative: A Rising Standard of Living and Less Poverty

    The title of the forum was "The Changing Demographics of Southern California and Their Impact on Housing," however I think that the reverse is more significant — the impact housing is likely to have on Southern California.

    My perspective is neither ideological nor tied to any political party. It is a fundamentally pragmatic view that domestic policy should principally seek to better people’s lives, by facilitating a rising standard of living and reducing poverty. These objectives were also referenced in the G20 nations communiqué in Brisbane and adopted a announcing a dedication to improving standards of living and eradicating poverty.

    The issue is particularly ripe in California, where public policies relating to housing are having virtually the opposite effect. Housing costs have already increased poverty and reduced the discretionary income of middle-income households.

    This is not an issue of suburbs versus the urban core. I could not be more pleased by the long overdue resurgence of downtown areas as residential locations, something made possible by the huge crime reductions that began with Mayor Rudy Giuliani’s policies in New York City and similar efforts in cities like Los Angeles. It is important to recognize that a vibrant core no more needs dying suburbs then vibrant suburbs need a dying core. Both urban cores and suburbs can prosper, creating a stronger urban area.

    The Housing Crisis

    Southern California’s biggest crisis relates to housing. Housing is important to the standard of living and alleviating poverty. It is the largest element of household budgets. When housing more expensive, it leaves households with less discretionary income to purchase other goods and services. This will, other things being equal, reduce economic output from levels that would be otherwise attained.

    This has been developing for more than four decades as house price to income ratios (such as the median multiple, the median house price divided by the median household income) have doubled and tripled above historical levels and well above those of other metropolitan areas. Attention is often focused on lower income affordable housing, a problem virtually everywhere, but most parts of the country do not suffer so severe a middle-income housing affordability problem. Low-income housing affordability is important and one of the best ways to minimize it is to ensure that there is middle-income housing affordability.

    A bit of historical perspective is appropriate. For centuries nations had little or no property-owning middle class. Huge progress has been made in the last century and particularly since World War II. Following the war, housing development innovation, combined with transportation advances, led to the development of owned middle income housing in the suburbs. It started with Levittown on Long Island and spread across the nation. The most fabled Southern California example is Lakewood (see D. J. Waldie’s Holy Land: A Suburban Memoir on this). The result was a massive increase in home ownership, rising from percentages from the low 40s to 65% in the final decades of the 20th century.

    Similar progress was made in other countries, especially in Canada, Australia and New Zealand, where middle-income households purchased homes with sufficient space. In each of these nations, the median multiples were around or below 3.0 as late as 1995.

    All of this represented progress toward what the late and renown British urbanist Peter Hall called the "ideal of a property owning democracy" (See: The Costs of Smart Growth Revisited: A 40 Year Perspective).

    Sadly, affordability has diminished greatly in many metropolitan areas around the world.  House prices relative to incomes have doubled or tripled in virtually all of the metropolitan areas of Australia and New Zealand, some metropolitan areas in Canada as well as in some key metropolitan areas in the United States, with the worst in California. In each of these places, this house price escalation occurred after implementation of urban containment policies (also called smart growth or growth management), which seriously reduce the amount of land that can be used for new housing.

    The Roots of Urban Containment Policy

    Urban containment has its roots in the British 1947 Town and Country Planning Act. This act created green belts around British cities and is a proximate cause of the present housing shortage and crisis. The general philosophy of the 1947 Act is evident throughout urban planning in the United States and has been implemented in Oregon, part of Washington and California. Urban containment policy was also enacted in Florida. There, house prices had escalated at rates — if not the price levels — to near that of California during the housing bubble. However, legislators took the opportunity to repeal Florida’s urban containment policies when housing prices dropped to historical median multiple levels.

    A recent California Legislative Analyst’s report indicated that much of the problem is California’s strict land-use laws and regulations (See:  How the California Dream Became a Nightmare). A dense mesh of "urban containment" and "smart growth"  regulations have severely limited the land available for new housing, especially on the periphery, where cities grow organically. This destroys the competitive market for land, driving up its cost. This makes house prices escalate in relation to incomes.

    California: 50% More Poverty Than Mississippi

    Today, California house prices are far higher than in the rest of the nation. This is taking a toll on the standard of living and increasing poverty. The Census Bureau’s supplemental poverty measure, which adjusts for housing costs shows California’s poverty rate to be the highest in the nation. It should be of concern that California’s poverty rate is 50% above that of perennial poverty leader Mississippi (Figure).

    Because so much poverty is concentrated among minority ethnic populations, California’s urban containment policy is particularly disadvantaging Hispanics and African-Americans. The Thomas Rivera Institute at USC published a detailed examination of California’s land-use regulations and found that "Far from helping, they are making it particularly difficult for Latino and African American households to own a home."

    The Need for Reform

    The bad news is that things are likely to get much worse. Under the Sustainable Communities Strategies required under Senate Bill 375 (2008), it is likely to become nearly impossible to build traditional suburban single-family housing in California’s metropolitan areas (See: California Declares War on Suburbia). Already, median multiples in San Francisco, San Jose, Los Angeles and San Diego are approaching the highs reached at the peak of the housing bubble. House prices are likely to continue rising relative to incomes, other things being equal.

    Allowing Supply to Meet Demand

    It is often asserted that diminishing land supply in California reflects not so much regulation, but physical limits. The state is sometimes seen as ‘built out’. Yet, in fact, there is plenty of land available for development. Despite its reputation for urban sprawl, the Los Angeles urban area is the most densely populated in the United States. It covers a bit more than one half the land area of the New York urban area. Like any urban area, the greenfield land that is available for development is on the periphery, which  includes areas like the northern Antelope Valley, the Victor Valley, and Southwestern California (Temecula to Hemet) and in some closer areas. Each of these areas is closer to the urban core than some parts of the New York commuter shed.

    These areas could easily accommodate the additional population expected in the area by 2060, including the single family housing generally preferred among middle-income households. Households are not likely to raise children on high rise balconies.

    Even so, the urban footprint would continue to be much smaller than that of New York. If sufficient land were opened to development, the city would expand geographically, but people would also have better access to middle class standards of living, and there would likely be a lot less poverty. The obvious choice would be to let the city expand, while improving real incomes and reducing poverty.

    The California Dream is Now in Denver?

    During the discussion period after my talk, perhaps the most prescient comment was made by an unidentified audience member said that the California dream is now in Denver. California’s unjustifiably and artificially high housing prices are the cause. Between 1993 and 2010, there was net out-migration from California to 42 of the 50 states and the District of Columbia. Immigration to Los Angeles and Orange from abroad has also declined, as immigrants too look for more affordable alternatives. People seeking sun, glamour or a good time will continue to flourish in southern California, but it seems likely that more families, and middle class households, will continue to ebb out, seeking somewhere else the dream that was once so closely identified with Southern California.

    Wendell Cox is principal of Demographia, an international public policy and demographics firm. He is co-author of the "Demographia International Housing Affordability Survey" and author of "Demographia World Urban Areas" and "War on the Dream: How Anti-Sprawl Policy Threatens the Quality of Life." He was appointed to three terms on the Los Angeles County Transportation Commission, where he served with the leading city and county leadership as the only non-elected member. He served as a visiting professor at the Conservatoire National des Arts et Metiers, a national university in Paris. Wendell Cox is Chair, Housing Affordability and Municipal Policy for the Frontier Centre for Public Policy (Canada), is a Senior Fellow of the Center for Opportunity Urbanism and is a member of the Board of Advisors of the Center for Demographics and Policy at Chapman University.

    Photo: Central Los Angeles and the San Fernando Valley (by author)

  • Australian Treasurer Given Primer on Housing Economics

    Wodonga (Victoria) mother of two Mel Wilson has made headlines across Australia with an open letter to Federal Treasurer Joe Hockey on housing affordability. In commenting on Australia’s housing affordability crisis, the Treasurer has told a press conference "The starting point for a first home buyer is to get a good job that pays good money."

    Australia has a severe housing affordability problem. As the Demographia International Housing Affordability Survey showed in January, Sydney median house prices had reached 9.8 times median household incomes of by the third quarter of 2014. In the intervening months house prices have escalated so much that some say the median price will soon pass $1 million.

    It was not that long ago that house prices were far more reasonable in Australia. Nationally, in the early 1990s, house prices averaged around three times incomes. Since that time, house prices have more than doubled relative to incomes. This is placed a considerable burden on purchasing households, especially first home buyers.

    Ms. Wilson incredulously took Treasurer Hockey through the economics of buying a first house in Sydney. She reminded him that it would take all of the average wage earner’s take home pay for four years to save the down-payment on the median house, now priced at A$915,000 (approximately US$700,000.  The entire letter is published below.

    In a later statement, the Treasurer, to his credit, indicated the need for strong lobbying of the states to make more land available to increase supply. The problem in Sydney and Australia is not unique. Similar house cost crises have developed from London to Toronto and San Francisco, where governments have severely limited the land that can be used for new residences, with the wholly predictable result that prices escalate out of control.

    Ms. Wilson, and other concerned (or baffled, as Ms. Wilson puts it) Australians should hope that Treasurer Hockey’s "strong lobbying" is successful. The economic reality is that until there is liberalization of the land use restrictions responsible for much of the housing cost escalation, there will be no relief, other things being equal. Indeed, house prices are likely to just keep going skyward. This requires a mid-course correction toward policies that place improving the standards of living and reducing poverty at a higher priority than urban design.

    Letter from Ms. Mel Wilson to Treasurer Joe Hockey:

    Dear Joe,

    I just wanted to touch base with you regarding your comment that young people are able to enter the property market if they just “get a good job that pays good money.”

    I just wanted to ask you how one might go about this?

    Are you going to be reviewing all the current Awards that are in place to ensure that most jobs pay “good money”?

    Are you going to be creating hundreds of thousands of new jobs that, under your Awards, pay over $100,000 per year?

    Apologies if I have missed this fantastic news, but as someone working in 2 senior HR roles, I believe I would have known about this so that I could pass the message on to some very tired, over qualified employees who currently fall under various Federal and State awards and are being paid between $18 to $25 per hour.

    Are you aware of what the average Australian wage is?

    Are you aware of what the average Australian mortgage in Sydney is?

    Are you aware of the first-home buying process?

    Just in case these facts and figures aren’t available to you, I thought you might be interested.
    The average weekly wage according to the Australian Bureau of Statistics on 1st January 2015 was $1,128.70, or $58,692.40 before tax. This means a take home amount of about $904.00 per week.
    The median house price in Sydney, according to the Domain Group Housing Price Report, as of March 2015, was $914,056.

    Not sure if you know how first home buying works at the moment, but you normally need a deposit of about 20%. This is to pay for the Stamp Duty (which is a State Tax you must pay every time you buy a property), and also to assist in the approval process so that you don’t need to pay Lenders Mortgage Insurance.

    So in this instance, the first home buyer would need about $182,811.00 saved to purchase a house that is the average price in Sydney.

    So to go out and get one of these “good jobs that pay good money” I assume these young people you speak of would need to go to university first.

    On average, it takes about 3 -4 years to get a degree, so if a young person goes to University straight out of school, they can expect to finish their course and be ready for the workforce at about 21, with a HECS-HELP debt of over $20,000. To make this a bit easier for you to understand, let’s say there is a young person named Joe Junior who has done just this.

    If Joe Junior is extremely lucky, and is up there with the best of the graduates from that course and that year, he will get a job straight out of University paying usually under the average wage.
    However, lets just be extremely generous here and say that Joe Junior got a job and was on the national weekly take home wage of $904 per week.

    Joe Junior needs to only save every single dollar worked for about 4 years to save his $182,811 deposit for their first home. Thank you, Mr Hockey, for throwing in that $7,000 first home owner grant too – that meant Joe Junior could get into his first home 8 weeks earlier!

    Just a quick side note, this example does not take into consideration the rising house prices, or Joe Junior’s HECS-HELP debt that he obtained from getting his degree to get one of your so-called “good jobs”.

    Joe Junior is now 25 (not so junior anymore), has been living at home with his parents this entire time and has not been able to spend a single dollar on any bills, board or holidays or public transportation. He also can’t afford a car or petrol for a car but then again “poor people don’t drive cars”. Oh wait, Joe Junior isn’t a poor person – he has a “good job that pays good money.”

    Luckily Joe Junior’s parents have been happy to drive their little Joe Junior to and from work every day and provide free housing, clothing, medical expenses and also provide the food for his breakfast, lunch and dinner each day.

    So finally Joe Junior has saved his $182,811 deposit (of which only about half will go towards his mortgage due to the stamp duty cost), and can now purchase his first home, with a mortgage of about $822,650.00.

    According to the Commonwealth Bank’s online mortgage estimator, the repayments for a mortgage of this amount are $1,073.00 per week over 30 years.

    So hopefully Joe Junior’s average weekly wage of $904.00 has gone up enough to cover the cost of the mortgage.

    Joe Junior has been applying for these “good jobs hat pay good money" that you speak of (I assume by "good money" you mean more than the average wage as you have just seen it is not even enough to cover the cost of the average house prices’ mortgage in Sydney), but hasn’t had any luck as yet. He needed to stay in the same job post university to demonstrate to the bank job stability so that he could purchase his first home. So he only has a degree, and experience in the one job, one industry, and there are just not that many jobs out there paying “good money.”

    Joe Junior now also can’t wash his clothes, eat food, or get to and from work as he no longer lives with his parents, so getting one of these “good jobs” is even more difficult.

    So Joe Senior, are you really aware of all the facts and figures when you says things like buying your first home is “readily affordable” to young people?

    Just slightly confused as to what you were thinking when you said these words at the media conference in Sydney.

    Looking forward to another one of your politically correct, direct and well thought out responses.

    Regards,
    Another baffled Australian

  • Land Use Regulations and “Social Engineering”

    All forms of land use regulation are explicitly “social engineering”. Full stop. Let’s acknowledge that reality as we move forward. The question is never whether we’ll be engaging in manipulating society through land use regulations, but how and why.

     Screen Shot 2015-03-30 at 1.59.06 AM


    The typical pejorative reference to “social engineering” includes things like government built subsidized low income housing or rent control imposed on private property. There are large numbers of people who find this sort of thing distasteful. I understand the objections, particularly since so much public housing has been so bad and rent control distorts the rental market. Then again, lots of for-profit housing is really bad and all sorts of other things distort rental markets.

    Screen Shot 2015-04-26 at 3.22.22 AM
    Screen Shot 2015-04-26 at 3.20.47 AM

    How about a municipality that dictates all new construction must be single family detached homes with a minimum 2,800 square feet on a lot that’s at least a quarter acre? What exactly is the logic behind that kind of land use control? Well… a particular town might want to “socially engineer” a middle class demographic in and a lower class demographic out. If only large expensive homes are available then the “wrong” kinds of people can’t live there. And their “undesirable” children can’t attend the local schools, etc.

    It’s also possible to “socially engineer” a private community so that it only includes people of a certain age… say, 55 and over. Municipal governments love retirement communities because they pay property tax, but don’t burden the town’s budget with school aged children. And most of the social services for retirement age folks are paid for by federal and state programs rather than local government. This sort of thing certainly distorts the local property market as well. So let’s be honest and say that some people like certain kinds of “social engineering” but not others.

    Screen Shot 2015-04-26 at 2.23.01 AM screen-shot-2014-10-08-at-11-12-33-am

    Screen Shot 2015-04-26 at 3.39.35 PM

    Voters in some areas value the rural agricultural quality of the landscape and don’t want to see the place paved over with new subdivisions, gas stations, and strip malls. Land use regulations are put in place with restrictions like zoning that requires new homes to be built on no less than forty acres. In addition, there are procedures that restrict new construction based on water availability, flood hazards, soil percolation, and so on. These policies work together to keep most of the land unavailable for development. These policies do in fact preserve the beauty of the open landscape, but they also restrict the supply of buildings and drive up the cost of property in the area. “Social engineering.”

    Screen Shot 2015-03-28 at 4.28.34 PM

    Screen Shot 2015-03-28 at 6.14.03 PM

    Screen Shot 2015-03-28 at 8.22.21 PM

    Screen Shot 2015-03-28 at 4.26.34 PM

    Screen Shot 2015-03-28 at 4.25.28 PM

    Other areas have pro growth policies that encourage development. Each new shopping mall, housing tract, and car dealership represents tax revenue and progress. There are a host of professional organizations that relentlessly lobby for new growth in order to promote full employment, affordable middle class homes, and a continuation of the suburban lifestyle. As property taxes rise the cost of having land sit idle becomes prohibitive just as potential profits rise. Owners are pressured into selling or developing whether they necessarily want to or not. Individual buildings sell well and bring many immediate benefits, but the long term consequences often destroy the landscape and reduce the quality of life. “Social engineering.”

    Screen Shot 2015-04-28 at 2.52.11 AM

    Screen Shot 2015-04-28 at 2.54.35 AM

    Screen Shot 2015-04-14 at 6.50.45 PM

    Screen Shot 2015-04-15 at 12.12.45 AM

    These photos show a form of development that is illegal almost everywhere in North America. The buildings all touch. That’s illegal. Some buildings have both commercial and residential uses. That’s illegal. All of these buildings have little or no parking. That’s illegal. Even at just three or four stories there’s still far too much density. That’s illegal. There’s a long list of handicap accessibility inadequacies in these buildings. That’s illegal. The streets between these buildings are much too narrow. That’s illegal. And yet these are highly desirable places to live and command premium prices on the open market in large part because they are so rare. So much so, in fact, that voters introduced rent control and other measures to help keep at least some working class people in the neighborhood. “Social engineering.”

    “Social engineering.” Use the term if you wish. But apply it evenly across the physical and political landscape.

    John Sanphillippo lives in San Francisco and blogs about urbanism, adaptation, and resilience at granolashotgun.com. He’s a member of the Congress for New Urbanism, films videos for faircompanies.com, and is a regular contributor to Strongtowns.org. He earns his living by buying, renovating, and renting undervalued properties in places that have good long term prospects. He is a graduate of Rutgers University

  • Driving Farther to Qualify in Portland

    Portland has been among the world leaders in urban containment policy. And, as would be predicted by basic economics, Portland has also suffered from serious housing cost escalation, as its median multiple (median house price divided by median household income) has risen from a normal 3.0 in 1995 to 4.8 in 2014.

    One of the all too predictable effects of urban containment policy is at least some households will drive even farther to "qualify" for mortgages than before. Single-family detached houses have been the national preference in housing in the United States (and a number of other nations) for decades. Significant "leakage" can occur as people skip over the urban growth boundaries, inside of which housing has become unaffordable. For example, after the 2010 census, San Joaquin County, with its seat of Stockton, was added to the San Francisco Bay combined statistical area (CSA). Combined statistical areas are combinations of metropolitan areas have a somewhat weaker economic connection, as defined by commuting patterns than within metropolitan areas (Note 1).

    As in the San Francisco Bay Area, more Portlanders are now commuting from outside the metropolitan area in large enough numbers that four additional, metropolitan areas are now included in the Portland CSA.

    Driving to Qualify from Corvallis and Albany

    Perhaps most notable addition is Corvallis, seat of Benton County and home of Oregon State University. Corvallis is rather exurban to Portland, even though it is now officially in Portland’s commuting belt. At least 15 percent of resident workers in Benton County travel to one of the central counties of the Portland metropolitan area (Clackamas, Multnomah and Washington in Oregon and Clark in Washington) or vice versa. This is no 30 minute commute. Corvallis is 85 miles from downtown Portland. It is 65 miles from the nearest potential Portland MSA employment in southern Clackamas County. Further, the Corvallis metropolitan area is not adjacent to the Portland metropolitan area. To get to the Portland metropolitan area by the most direct route, a Benton County commuter passes through two other metropolitan areas Albany and Salem.

    This would be a very long commute, even by comparison to the nation’s largest metropolitan regions. Take New York, for example. The New York CSA extends from outside of New Haven, Connecticut, to beyond Allentown, Pennsylvania, to beyond Toms River, New Jersey and includes all of Long Island. Yet some of the farthest reaches of New York are no closer to Manhattan than Corvallis to Portland. These include Bethlehem, Pennsylvania, New Haven, Connecticut, and Port Jervis, New York. Philadelphia, beyond the New York CSA, is only slightly farther away (90 miles).

    Or, consider Los Angeles, which its undeserved reputation for sprawl. The Los Angeles CSA is the second largest in the nation. Yet, Banning, which sits on the mountain pass leading to Palm Springs is 85 miles from Los Angeles. San Clemente, the southernmost point in the CSA is only 60 miles from downtown. The expansive Portland commuter shed suggests that, in some ways, Portland, already far less dense, is also more sprawling.

    Expansions for Linn, Marion, Polk and Cowlitz Counties

    The Portland CSA added two more metropolitan areas in the Willamette Valley. Albany (Linn County), only about 15 miles closer than Corvallis is one. Salem, the state capital, was also added. Salem includes Marion and Polk counties and is 45 miles from Portland. To the north, Longview, Washington (Cowlitz County) was also added. By comparison with Corvallis, Longview seems close, at less than 50 miles from Portland.

    The Portland CSA now stretches 175 miles from the southern Linn County border to the northern Cowlitz County border. There it has collided with the southerly expanding Seattle CSA, which now includes Lewis County (Centralia-Chehalis), 85 miles from downtown Seattle.

    However, this does not imply 175 miles of continuous urbanization. Like all metropolitan areas, combined statistical areas, including Portland, have far more rural land than urban land.

    Dispersing in the Metropolitan Area

    Perhaps the greatest irony is that an “urban containment” policy designed to prevent sprawl could well be accelerating it. Higher prices, in part due to this policy, have forced more people to look ever further for housing that is affordable.

    Approximately 98 percent of Portland’s population growth between 2000 and 2011 occurred in the suburbs (Note). There was a small, but significant percentage growth around the central business district, but its addition of fewer than 7,000 residents paled by comparison to the more than 325,000 added to the suburbs and exurbs. The balance of the urban core, (the inner ring) grew by little more than 100, which is glacial for an urban sector with more than 200,000 residents (less than 0.1 percent).

    None of this should be surprising. The attractive inner city developments, especially the Pearl District, do not provide for the economic needs or wants of most people, as the population trend data indicates. Few households are drawn to buy less than one-half the space they want at nearly three times the price per square foot they would pay in outer suburbs like Forest Grove, Wilsonville or Hazel Dell.

    Job Dispersion

    Fortunately for both the suburbanites and an exurbanites, Portland’s job market also dispersed between 2000 and 2011, meaning that a smaller percentage of commuting was to downtown or the balance of the urban core (Figure 3). That makes it easier to drive to qualify. It turns out that while planners plan, people usually make choices that suit their basic needs rather than those of a particular urban ideology.

    Note 1: Metropolitan areas are defined by commuting patterns. Oversimplifying, metropolitan areas are organized around central counties that contain all or part of large urban areas ("built-up" urban areas). All such counties are included in the metropolitan area as well as any counties that have a strong commuting interchange with the central counties. For example, in the case of Portland, the central counties are Multnomah, Washington and Clackamas in Oregon and Clark in Washington. Columbia and Yamhill in Oregon are outlying counties as well as Skamania in Washington. Combined statistical areas are created from combinations of metropolitan areas that meet a weaker commuting interchange threshold. A complete description of the commuting thresholds that apply to metropolitan areas and combined statistical areas is found here.

    Note 2: Based on the City Sector Model (Figure 4), which classifies small areas (ZIP codes, more formally, ZIP Code Tabulation Areas, or ZCTAs) in metropolitan area in the nation based upon their behavioral functions as urban cores, suburbs or exurbs. The criteria used are generally employment and population densities and the extent of transit, versus car use. The purpose of the urban core sectors is to replicate, to the best extent possible, the urban form as it existed before World War II, when urban densities were much higher and when a far larger percentage of urban travel was on transit. The suburban and exurban sectors replicate automobile oriented suburbanization that began in the 1920s and escalated strongly following World War II. The data from 2000 is from the 2000 census. The 2011 data is from the 2009-2013 American Community Survey (mid-year 2011).

    Photo: Benton County Courthouse, Corvallis (in the Portland commuter shed) by Gregkeene (Own work) [CC BY 3.0 us or CC BY-SA 3.0], via Wikimedia Commons

    Wendell Cox is principal of Demographia, an international public policy and demographics firm. He is co-author of the "Demographia International Housing Affordability Survey" and author of "Demographia World Urban Areas" and "War on the Dream: How Anti-Sprawl Policy Threatens the Quality of Life." He was appointed to three terms on the Los Angeles County Transportation Commission, where he served with the leading city and county leadership as the only non-elected member. He served as a visiting professor at the Conservatoire National des Arts et Metiers, a national university in Paris. Wendell Cox is Chair, Housing Affordability and Municipal Policy for the Frontier Centre for Public Policy (Canada), is a Senior Fellow of the Center for Opportunity Urbanism and is a member of the Board of Advisors of the Center for Demographics and Policy at Chapman University.

  • Silicon Valley: Jelly in the Jam

    My last post was about how Silicon Valley is evolving into an urban form that’s not quite leafy and open enough to be a suburb anymore, but not really vibrant and compact enough to be a proper city either. “Too thin to be jelly. Too thick to be jam.” The story got an unusually large number of visits. I received some well informed comments that touched on the reality that Silicon Valley is a big place and I shouldn’t generalize. Palo Alto is very different from Fremont and so on. It’s not all isolated corporate enclaves. Fair enough. So here’s a quick follow up that explores the jelly in the jam.

    Screen Shot 2015-04-16 at 2.29.01 PM
    Google


    Screen Shot 2015-04-15 at 10.26.37 PM Screen Shot 2015-04-15 at 10.25.31 PM Screen Shot 2015-04-15 at 10.30.58 PM Screen Shot 2015-04-15 at 10.27.11 PM Screen Shot 2015-04-15 at 10.25.01 PM

    This is the town of San Carlos twenty five miles south of San Francisco and an equal distance north of San Jose. We all have our biases. I’m partial to the kind of walkable Main Street small town that was common everywhere a century ago. I like a place with mom and pop shops and a mix of modest cottages and grand stately homes a few blocks in each direction. For me that’s the perfect balance of city and suburb. A Main Street provides a broad range of activities while accommodating pedestrians, cyclists, and cars without prejudice. These places can also be well served by public transit – not so much to get around town, but to efficiently connect people to other towns that are also walkable. If these small towns are then surrounded by working farms and a bit of nature all the better. Toss in a nearby city for access to culture and jobs and I’m in heaven. But such places are hard to come by in America these days. Fortunately, Silicon Valley has a string of such places along the historic rail line like little gems imbedded in the post WWII sprawl.

    Screen Shot 2015-04-17 at 4.55.51 AM
    Google Screen Shot 2015-04-17 at 4.57.12 AM
    Google   Screen Shot 2015-04-15 at 10.14.31 PM Screen Shot 2015-04-15 at 10.16.33 PM Screen Shot 2015-04-15 at 10.16.08 PM Screen Shot 2015-04-15 at 10.17.11 PM

    San Carlos sits between two major freeways and right on El Camino Real and the CalTrain line that serves the entire peninsula. It’s possible to navigate most parts of San Carlos as a pedestrian, hop on a train or a bus, or drive to just about everything in the Bay Area. You have a lot of transportation choices that are equally good. What’s more important to me personally is that being a pedestrian or cyclist is actually pleasant in San Carlos. Transit within most of the town itself is entirely unnecessary. There are areas up in the hills with a lot of twisting cul-de-sacs that are more manageable in a car, but there’s at least a continuum of housing options including small apartment buildings next to shops downtown. People can select their own personal sweet spot.

    Screen Shot 2015-04-15 at 10.12.50 PM Screen Shot 2015-04-15 at 10.13.14 PM Screen Shot 2015-04-15 at 10.13.31 PM Screen Shot 2015-04-15 at 10.13.43 PM Screen Shot 2015-04-15 at 10.14.00 PM Screen Shot 2015-04-15 at 10.14.16 PM

    There are relatively “affordable” $950,000 bungalows (this is the Bay Area) while the big fancy homes up on the hill with water views sell for $7,000,000. I understand these numbers seem ridiculous to people in other parts of the country, but San Carlos has immediate access to very well paid jobs so these prices are justified based on local incomes. If you have the money it’s a great place to raise a family with excellent public schools and a safe clean environment. It’s also a pretty fabulous retirement spot if you decide to age in place. And it isn’t terrible to be a young single person in San Carlos either. That little downtown and the train station make all the difference. You’ll find the same basic arrangements in similar older towns along the train line: Burlingame, San Mateo, Menlo Park, Mountain View, and so on.

    Screen Shot 2015-04-18 at 4.09.16 PM Screen Shot 2015-04-18 at 4.08.41 PM Screen Shot 2015-04-18 at 4.08.13 PM Screen Shot 2015-04-18 at 4.09.02 PM

    Here’s another point that’s often overlooked by city planners obsessed with making everything pretty or attracting the right demographic to their town. Every town needs some ugly utilitarian stuff. Even in a place where schmaltzy tract homes sell for a million bucks people still need plumbers, electricians, and low grade warehouses. If a town zones or redevelops these areas out of existence they induce more people to get into their cars and trucks to commute to distant industrial parks in a region where freeway traffic already comes to a complete halt during most business hours. And these suburban warehouse districts are also excellent buffers from the ugliness and noise of freeways and rail lines. No one wants to live pressed up against a diesel train or freeway interchange full of tractor trailers. It’s often a mistake to see these light industrial areas as redevelopment opportunities for dense infill housing.

    Screen Shot 2015-04-17 at 7.03.28 AM
    Google

    Some of the comments I received from my last post mentioned recent projects that brought transit and density to some Silicon Valley suburbs. This is San Bruno, home to tech companies like YouTube. It has all the same advantages of San Carlos: immediate access to good jobs and nearby culture, the same freeways, El Camino Real, a BART rail station, similar single family housing stock, and so on. But the two towns are very different. I would love to live in San Carlos, but I could never live in San Bruno. Here’s why.

    Screen Shot 2015-04-17 at 7.16.22 AM Screen Shot 2015-04-17 at 7.22.27 AM Screen Shot 2015-04-17 at 7.17.37 AM Screen Shot 2015-04-17 at 7.11.50 AM 

    San Bruno was built after cars had come to dominate the landscape. There never was much of a town and everything built over the last sixty or seventy years has been organized around the freeways. A rail station in a shopping mall parking lot that’s cut off by massive twelve lane roads is just miserable for pedestrians and of little use to people in cars. There are plenty of people on foot in San Bruno, but they’re very poorly served in this environment.

    Screen Shot 2015-04-17 at 5.16.41 AM
    GoogleScreen Shot 2015-04-17 at 7.11.21 AM Screen Shot 2015-04-17 at 7.14.03 AM Screen Shot 2015-04-17 at 7.15.51 AM Screen Shot 2015-04-17 at 7.11.09 AM Screen Shot 2015-04-17 at 7.13.45 AM

    Density and transit all by themselves do nothing for a town if the public realm is completely car oriented. These new infill apartment buildings are perfectly respectable and I’m sure they’re very comfortable on the inside. But once you step outdoors you find yourself in the left over space between parking lots and highways. You can physically walk to the supermarket and the dentist and the train station so it checks off a lot of boxes on the “Smart Growth” list, but you feel like a social outcast as you schlep around the edge of speeding vehicles. The scale is out of whack with human needs because the needs of cars always come first. Adding apartments and giant parking garages to a suburban environment also adds that many more cars to the already congested roads. This kind of development bothers people who want a traditional suburb and it falls short for people who want a genuine urban experience. As I walked around this cluster of apartments I thought about how it could have been done better. What if the ground floors had shops in them? What if the sidewalks were wider? What if the roads were more narrow? What if the buildings were organized around outdoor public space instead of having the greenery sprinkled around the edges in useless landscaped berms and highway medians?

    Screen Shot 2015-04-17 at 5.19.18 AM
    Google Screen Shot 2015-04-18 at 12.36.51 PMScreen Shot 2015-04-18 at 12.26.02 PMScreen Shot 2015-04-18 at 12.25.06 PM Screen Shot 2015-04-18 at 12.42.29 PM

    As I made my way from one suburban train station to the next I discovered another infill project that actually made an effort to do many of the things on my list. Wide sidewalks? Check. Meaningful public space? Check. Shops on the ground floor? Check. At least a few narrow side streets? Check. Train station around the corner? Check. This place was significantly better. But… context is important.

    Screen Shot 2015-04-17 at 9.24.59 PM
    Google

    Here’s a Google Earth view of the area in which I colored the roads, surface parking lots, and multi-story parking garages blue. What would you call that building to pavement ratio? It looks like 60/40 to me in favor of pavement. The largest garage is owned by BART and is designed to collect suburban drivers and funnel them into the city by train for the last little stretch of the commute. This kind of train station is a highway patch to relieve traffic congestion in the city. It has nothing at all to do with “transit” or any kind of urbanism. It’s a clumsy and expensive prosthetic limb for cars and highways.

    Screen Shot 2015-04-18 at 12.36.19 PM Screen Shot 2015-04-18 at 12.35.53 PM Screen Shot 2015-04-18 at 12.34.29 PM Screen Shot 2015-04-18 at 12.20.32 PM

    Here’s what it looks like on the ground. This well intentioned mixed use infill project is an island in the middle of the usual suburban sprawl. I’m quite certain that the people who live in the single family homes across the street drive to the Trader Joe’s market even though it’s only a block away. If I had to choose a spot to live this place is marginally better than San Bruno, but still an order of magnitude worse than San Carlos. And I should point out that San Carlos has a downtown of mostly one story buildings surrounded by much smaller apartment buildings than these and a majority of detached single family homes. “Density” has nothing to do with the success or failure of good urbanism.

    Screen Shot 2015-04-18 at 12.37.48 PM Screen Shot 2015-04-18 at 12.41.36 PM Screen Shot 2015-04-18 at 12.33.46 PM Screen Shot 2015-04-18 at 1.50.29 PM Screen Shot 2015-04-18 at 1.51.16 PM

    Here’s the sad part. Even after what must have been an heroic effort on the part of everyone involved in getting this project built it still fails to cultivate enough foot or vehicular traffic to support small shops. The Trader Joe’s and the Starbucks are doing well enough, no doubt feeding off the morning and evening commuter flows from the BART station. And there is a small dry cleaner that’s managing to get by so far. But the rest of the storefronts are empty and have been so from the get go. Too thick to be jam. Too thin to be jelly. I keep wanting suburban retrofits to work, but they rarely do. The typical suburban chassis makes incremental urbanism a hit or miss affair. Mostly miss. The question is… what are the alternatives? Do we just let the cost of the existing single family homes rise until people and businesses pick up and move to Scottsdale or Orlando in search of economic relief? Do we let taxes rise on all the strip malls and gas stations until the necessary funds appear to repave all the twelve lane roads out in front of them? Or is mediocre the best we can expect from half assed infill projects that do the best they can under the circumstances?

    John Sanphillippo lives in San Francisco and blogs about urbanism, adaptation, and resilience at granolashotgun.com. He’s a member of the Congress for New Urbanism, films videos for faircompanies.com, and is a regular contributor to Strongtowns.org. He earns his living by buying, renovating, and renting undervalued properties in places that have good long term prospects. He is a graduate of Rutgers University.

  • Growth and the Suburban Chassis

    I tend to explore what happens to suburbs as they age and begin to decline. But this time I’m going to explore what happens to suburbs that thrive and continue to grow and work their way up the value chain. It isn’t exactly what many people expect. “Be careful what you wish for.”

    A friend moved from San Francisco to San Jose this winter. Now that I’ve been visiting her on a regular basis I have an excuse to poke around. It’s actually pretty fascinating.

     Screen Shot 2015-04-08 at 1.35.48 AM Screen Shot 2015-04-08 at 1.36.12 AM

    A friend moved from San Francisco to San Jose this winter. Now that I’ve been visiting her on a regular basis I have an excuse to poke around. It’s actually pretty fascinating. Her tract home was built in 1947 on land that had previously been orchards. By the 1960’s the area had become home to military and aerospace firms that then spun off civilian electronics companies in little low rise office parks. By the 1980’s the area had officially emerged as Silicon Valley. Oracle, Apple, Facebook, Hewlett-Packard, Microsoft, Google, eBay, Juniper Network, PayPal… these companies stretch out for miles in every direction. It’s an economic development dream for local governments. While there are a dozen separate municipalities (Redwood City, Cupertino, Mountain View, Palo Alto, Santa Clara, Fremont, Los Gatos, and so on) the entire southern end of San Francisco Bay is essentially one giant suburban corporate office park blur.

    Screen Shot 2015-04-11 at 3.49.19 PM Google Screen Shot 2015-04-08 at 1.09.30 AM Screen Shot 2015-04-08 at 1.06.01 AM Screen Shot 2015-04-08 at 1.10.00 AM

    Here are three examples of the kinds of commercial buildings that served earlier waves of businesses in Silicon Valley. They were probably built between the 1970’s and 1990’s. This office park happens to be in the town of Sunnyvale, but nearly identical arrangements can be found all over the Bay Area. In fact, I bet there are buildings just like these in whatever town you live in too whether it’s in Florida, Michigan, or Utah.

    Screen Shot 2015-04-11 at 4.25.53 PM GoogleScreen Shot 2015-04-08 at 1.52.00 AM   Screen Shot 2015-04-08 at 1.09.00 AM

    Here’s what’s happening to these office parks as the economy heats up. The land has become very valuable and it makes good economic sense to build new eight or ten story office blocks on vacant land and surface parking lots. It’s good for the tech companies who want to expand their existing operations. It’s good for the land owners who can cash in on the sale. It’s good for the city since it brings increased tax revenue to the municipal coffers. And it’s good for people looking for high paying jobs, both in the initial construction phase and later office workers and support staff. There are, of course, also problems associated with this kind of redevelopment, which I’ll get to in a minute.

    Screen Shot 2015-04-11 at 6.33.25 PM Google Screen Shot 2015-04-11 at 6.32.52 PM  Screen Shot 2015-04-08 at 1.52.32 AM

    Here’s another construction site directly across the street. The old one story buildings were scraped and are being replaced by parking decks and office blocks. These are all part of the same company that is experiencing rapid expansion and doubling their corporate campus that already has over a million square feet of space. These few buildings alone will ultimately house another eight hundred well paid workers. Part of the long term plan for this site is to include a two hundred room hotel for business travelers associated with the company. Perhaps that new hotel will replace the existing one story motel.

    Screen Shot 2015-04-11 at 5.26.01 PM Google   Screen Shot 2015-04-11 at 8.04.09 PM Screen Shot 2015-04-11 at 8.04.26 PM Screen Shot 2015-04-11 at 7.27.03 PM Screen Shot 2015-04-11 at 7.26.05 PM

    Here’s the bigger picture. Zooming out on Google Earth you can see how multiple older office parks are being absorbed and folded in to much larger more unified corporate complexes. The scale of the construction is too large to capture even with a macro lens on the ground. These tech workers were walking between buildings at lunchtime and it was quite a trek. This kind of land use intensification is actually very similar to how old orchards were converted to residential subdivisions. Land values increased and property was pressed into service for tract homes which were much more lucrative than apricots or prunes. The same process is now unfolding at the next higher economic level with office parks. If I hadn’t taken these photos myself I would swear some of them were computer generated. The buildings have such a generic AutoCAD look about them. And there are dozens of them at this one site alone.

    Screen Shot 2015-04-11 at 7.44.08 PM Google   Screen Shot 2015-04-11 at 8.14.31 PM  Screen Shot 2015-04-08 at 3.40.10 AM Screen Shot 2015-04-13 at 5.58.20 PM 

    Here’s another corporate campus. This one is in Redwood City. Everywhere you look the old one and two story buildings are being razed and replaced with significantly larger buildings. The schmaltzy motels, strip malls, and office parks of previous decades have been upscaled both physically and economically. This was once open water and marshland that was filled, dredged and contoured in the 1960’s, but has since been redeveloped to a higher value use.

    Screen Shot 2015-04-13 at 5.42.01 PM Google Screen Shot 2015-04-13 at 5.43.28 PM Google

    Companies are fond of the “theme park” suburban campus where the environment is akin to an all inclusive resort destination for workers. These are islands – sometime literal islands – in the suburban landscape. From the air these corporate campuses look a lot like Epcot Center at Disney World or a regional shopping mall off the side of a highway.

    Screen Shot 2015-04-14 at 9.24.20 AM Google Screen Shot 2015-04-14 at 9.12.06 AM Google

    Screen Shot 2015-04-14 at 9.22.14 AM Google  Screen Shot 2015-04-14 at 9.13.02 AM Google

    This inward looking mega block form of development is common in suburbia. The images above show a college, an amusement park, and a corporate office park. When you’re inside one of these bubbles it’s actually very pleasant. But getting to and from these locations is pretty much impossible without a car. Even if you live directly across the street walking wouldn’t work all that well. Add in the fact that many of the nearby residential subdivisions are gated communities and that each of these bubbles are separated by highways, walls, and drainage canals… a car becomes essential. That loads the road network with an insane amount of traffic. If the one story buildings incrementally ramp up to eight story buildings you have a very big transportation problem on your hands.

    Screen Shot 2015-04-11 at 9.05.27 PM Google Screen Shot 2015-04-08 at 2.00.16 AM Screen Shot 2015-04-11 at 9.15.54 PM Screen Shot 2015-04-08 at 1.56.54 AM

    Here’s an intersection halfway between my friend’s house and the corporate campus where she works. It’s a typical suburban commercial corridor lined with standard one story buildings of the office park and light industrial variety that were built anytime from the 1960’s to the 1990’s.

    Screen Shot 2015-04-11 at 9.16.34 PM Screen Shot 2015-04-08 at 1.59.10 AM Screen Shot 2015-04-11 at 9.17.10 PM Screen Shot 2015-04-13 at 8.24.15 PM Screen Shot 2015-04-08 at 1.58.53 AM Screen Shot 2015-04-08 at 2.00.03 AM

    Here’s what’s happening all around Silicon Valley. The small old buildings are being replaced with much larger ones. These aren’t exactly skyscrapers, but they’re significantly more substantial than what was there before.

    Screen Shot 2015-04-13 at 7.26.36 PM Google Screen Shot 2015-04-12 at 11.56.58 AM Screen Shot 2015-04-12 at 11.31.13 AM

    The same thing is happening with residential property. The old suburban roads lined with gas stations and Kwickie Marts are giving way to multi-story apartment buildings with underground parking decks. These two photos show two sides of the same street. This spot is immediately adjacent to a 1950’s residential subdivision of single family homes. The apartment building fills a need for workforce housing at a high, but tolerable price. One bedroom apartments in this neighborhood rent for about $2,000 a month. Two bedroom units rent for closer to $3,000. If you want to buy an actual house the bargain basement fixer uppers start at $600,000. There are a lot of people in the area who can afford to carry a mortgage of that size, but the problem is often the down payment. Twenty per cent of $600,000 is $120,000. That’s a hurdle many people struggle with. I’ve seen some very nice double wide trailers for sale in the $320,000 range, but that doesn’t include the land under the trailer which you would still need to rent. So rental apartments and condo complexes are in fact necessary in this area if many workers are to live anywhere near where the jobs are.

    Screen Shot 2015-04-13 at 5.16.11 PM Google

    That brings us to some of the serious problems with an economically successful suburb. Silicon Valley, as the name suggests, is hemmed in by mountains and water. All the flat, easily developed land has already been built on in the standard suburban fashion. Over the decades highways have been built through mountain passes to access new land on the other side of these mountains and many people and businesses have expanded outward to the far edges where possible. But the resulting transportation bottlenecks and commute times are severe. Driving to and from Silicon Valley to the outer outer outer suburbs is like pouring molasses through a funnel. People are willing to pay a lot extra to not have to endure that schlep every day. In theory public transportation could ease the commute for many people, but the dispersed development pattern guaranties that transit will never be efficient or cost effective since most people need to drive from their house to a transit center and then take a shuttle bus to the office at the other end of the train line. Living closer to work is a better option for many people. If you have a million dollars on hand you can buy a nice big home with a front lawn and swimming pool in the back yard. Many people in the area do. The median income in Silicon Valley for people with a bachelor’s degree is $95,000 a year. That’s the median, so half the working population earns more than that. A million dollar house is within reason, particularly if there are two incomes per household to carry the mortgage. If not, living in a condo or apartment complex is the next best option.

    Screen Shot 2015-04-08 at 3.41.17 AM Screen Shot 2015-04-08 at 3.41.49 AM Screen Shot 2015-04-13 at 8.29.38 PMScreen Shot 2015-04-13 at 8.28.45 PMScreen Shot 2015-04-13 at 8.29.00 PM 

    From my perspective these intensifying suburbs are in an adolescent phase of development. They are rapidly losing the qualities that people like about the suburbs: open space, privacy, convenience, quiet, lower cost, ample free parking, and so on. But they aren’t yet delivering the things people like about cities: culture, vibrant street life, walkability, convenient public transportation, night life, and such. I stopped and took photos of large numbers of tech workers walking along the side of the eight lane highways at lunchtime. There isn’t anyplace for these folks to walk to. There’s nothing but parking lots, highway fly-overs, gas stations, landscaped berms, and convenience stores as far as the eye can see. When I ask the workers where they’re going they say they’re just stretching their legs and getting some air. They eat lunch (and very often breakfast and dinner) inside their office compounds in subsidized cafeterias. Perhaps in another thirty years the transformation from suburb to something more vital may be complete. Given the suburban chassis these places inherited I don’t see how the underlaying infrastructure will ever support anything other than a bad compromise.

    Joel Garreau calls places like this Edge City: a place that has a suburban form but at an urban density. Driving private cars is no longer convenient here anymore, but transit will never function well either. Jobs are plentiful, but housing is too expensive. It lacks the privacy and peace of a good suburb, but is deficient in the vibrancy and culture available in a real city. It’s too thick to be jam, but too thin to be jelly. 

    John Sanphillippo lives in San Francisco and blogs about urbanism, adaptation, and resilience at granolashotgun.com. He’s a member of the Congress for New Urbanism, films videos for faircompanies.com, and is a regular contributor to Strongtowns.org. He earns his living by buying, renovating, and renting undervalued properties in places that have good long term prospects. He is a graduate of Rutgers University.

  • The French housing Bubble also has Roots in Excessive Land Use Regulations

    Despite the claim to uniqueness that is quintessentially French, the housing bubble shares the same root as we see in the Anglo-Saxon world. To be sure, some analysts blame it only on low interest rates: they made the households more solvent, and thus drove home prices up. This rise in purchasing power might have been enhanced by some specific subsidies to new rental units. Some also y point to normative constraints on new buildings have added to production costs.

    These facts are undisputed, but a demand-only driven bubble can’t happen in a really free market where price signals provide incentives to supply more units, moderating price escalation, and eventually revert the price curve. After all, there hasn’t been anything like a “car price bubble”. So there has to be a supply side factor constraining the building of new homes. And since building itself doesn’t require scarce skills, the constraint has to come from land. These analysts observe that in middle America booming cities like Texas’ Houston and Dallas, or others in Kansas, Georgia, Oklahoma, and elsewhere didn’t experience such a price bubble despite identical credit conditions, despite in some cases, as in Texas, an even greater surge in demand.

    Numbers

    Let’s take a look at official French statistics.

    Professor Joseph Comby (From Institut d’Urbanisme de Paris) summarizes essential data in an exhaustive article (not available online) published in the very specialized peer reviewed "Revue Foncière" (n°3, January 2015), dedicated to land and housing issues. His graphs can be accessed from data provided by our national institute of statistics (INSEE).

    The first graph shows that home prices surged between 1997 and 2007, and that the prices didn’t really slump then, despite worldwide economic crisis. Average home price rose by a whopping 150% in 11 years, and rose 86% faster than households’ disposable income.


    Fig 1. Home price Index, adjusted from households’ disposable income – Base 1, 1965.
    Source: French Ministry of Sustainable Development (
    doc format)

    In this period, the median multiple in France (Average Home price / Average Household disposable income) rose from a stunningly low 2.25 to 4.21, and these average figures hide numerous regional discrepancies.

    Home prices can be truncated between land costs and building costs, including the home and the infrastructure costs (road access, sewage, water and energy adduction, and so on). Had this price hike uniquely "credit and demand" driven, we should have seen a relatively parallel evolution between land and building components in home prices.

    Our national statistics institute conducts regular wealth inquiries on the total wealth of French households. These studies show that the  share of aggregate land value in  homes value rose from 15% in 1996, to 50% in 2007, and slowly decreased then to 45% in 2013.


    Fig 2. France – Share of land in aggregate real estate value
    Source: J. Comby, computed from
    INSEE Annual wealth surveys

    So, from these data, let’s compute how the prices of land and building components evolved between the 1996 low and 2007 peak, relatively to households revenue. The following table summarizes it all:


     1996

    2007

    Price Increase

    Existing homes, average price – (current prices, €) (INSEE)

    77 100

    192 800

    +150%

    Average disposable income per household (current values, €)

    34 149

    45 800

    • 33%

    Ratio Home price / disposable income

    2.25

    4.21

    +86 %

    Land, % of home value

    15

    50


    Land, average value in existing homes (€)

    11 565
    (15% of 77100)

    96 400
    (50% of 192800)

    + 733 %

    Land price appreciation, adjusted from household disposable income appreciation

    + 520 %

    Building, average value in existing homes (€)


    65 535

    96 400

    + 47 %

    As has been seen in the Anglo-Saxon regulated markets, land appreciation overwhelms construction costs appreciation. Figures show clearly that the 1996-2007 real estate bubble is driven by land prices appreciation.

    As a confirmation pattern, INSEE figures from its annual wealth studies show that the total value of built land plots went from 67% of GDP in 1998 (no figures for 1996) to 308% in 2007. So owning developable land in the end of the 90s provided returns that no other asset class could offer, despite creating absolutely no new added value for society. On the contrary, high home prices have been harmful to modest households, with 6% of people experiencing very bad housing conditions (obsolete and/or overcrowded units), 9% other having tough times financing their housing needs (1).  And according to INSEE, there were 112 000 homeless people in 2012, a 44% increase from 2001 (2).

    Since there is no physical shortage of land in France (most of the country is rather flat, and only 7% of land is developed), this suggests loudly to look at our land use regulations to understand how they fed the monster.

    Our regulation of land belongs to the “prescriptive” family, according to Wendell Cox and Hugh Pavletich classification (3). It means that land is, by default, limited for natural or agricultural usage, and turning it into developable land must endure a long and politically complex zoning process. Worst of all, not only each city is zoned, but every local zoning has to comply, since the new millennium, with “territorial coherence schemes” which tend to cap the maximal amount of land available for development through years. Prescriptive regulations can be opposed to “responsive” ones, which can be seen in central parts of America and Canada. In a responsive regulatory frame, default status of land is let to the free choice of the owner, and only limitations for some collective purpose have to pass through a political process, and open a right   for owners to be compensated for the loss of land value resulting of limitations. As Cox and Pavletich as well as the Brookings institution showed, places with prescriptive regulations experienced a much tougher bubble than responsive ones during the years of wild credit expansion. France is not different and the same phenomenon happened.

    The idea of a bubble driven by strong regulatory constraints put on land meets a lot of resistance among several groups familiar in other countries: Local politicians, who get power from a population prone to NIMBY attitudes, and feeling richer through home value appreciation, are the first of them; most farmers, 70% of whom are renters, have an interest in preserving legal interdiction to turn  plots at the fringe of cities into housing developments; and there are about 40,000 employees in public and private jobs who make a living from elaborating and implementing these regulations. 

    So we can see that in France, like other countries, the role of artificial restriction of land supply for new development can’t be dismissed. The costs and benefits of these regulations should be publicly questioned. Can their advocates still deny that that this price bubble is largely an unintended outcome of regulations. Nor can they acknowledge that this  results in increasing levels of “housing poverty” and drives so much resources from more productive investments. Is this  more desirable than “sprawl containment”, “farmland preservation” and other pretenses which provided justifications for these regulations in first place ?

    Vincent Benard is senior economic analyst for the Turgot Insitute (www.turgot.org), a french classical liberal think tank. His principal interests are housing, land use and infrastructure policies, and the study of the unintended consequences of regulations.  Since 2006, he authored one book and many articles about the French housing crisis. " 

    (FYI: The book : https://www.scribd.com/mobile/doc/80163334 – Free, PDF, in French) 

    ———

    Notes: (1) Figures from the annual report of the “Abbe Pierre” Foundation, dedicated to homelessness and poverty assistance  www.fondation-abbe-pierre.fr/
    (2) Source: “L’express”, November 2014 – http://www.lexpress.fr/actualite/societe/le-nombre-de-sdf-en-france-a-explose-en-dix-ans_1623371.html
    (3) See Annual Housing affordability report, by Cox and Pavletich, www.demographia.com

    Photo by Benh LIEU SONG (Own work) [GFDL or CC BY-SA 4.0-3.0-2.5-2.0-1.0], via Wikimedia Commons