Category: housing

  • Good Enough Urbanism: Faster, Cheaper, Smarter

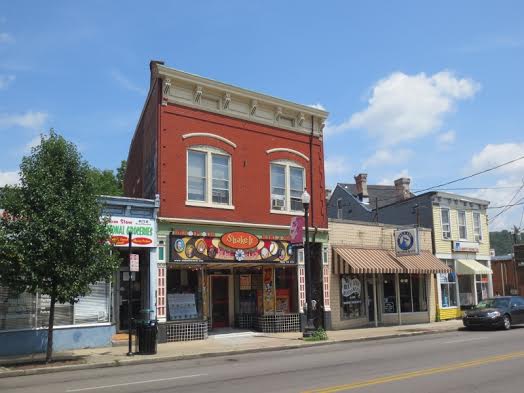
    There’s plenty of blight out there. Inner city blight, failing suburban blight, long lost rural small town blight… empty storefronts, boarded up buildings, dead streets. There’s simply no government program that’s going to bring these places back to life. No Wall Street investment scheme is likely to revive these places. Developers have no economic incentive to do anything with these buildings. Banks are risk averse and will not fund investments here. However, many of these forlorn spots exist within otherwise populated and potentially healthy neighborhoods. They may have been passed over when a nearby highway was extended or bled dry by big box stores and chain restaurants. But they could be pressed into service once again if enough people colonize them in creative ways – assuming the local authorities hold back on the usual mindless code enforcement.

    Screen Shot 2014-12-02 at 2.33.40 AM Screen Shot 2014-12-02 at 2.17.26 AM Screen Shot 2014-12-02 at 2.17.11 AM

    I’ve heard many local economic development people and city planners tell me they can’t force people to do anything they don’t want to do. True enough. But, man can they shut people down in a hurry for a whole lot of ridiculous minutiae for no good reason. So towns need to ask themselves if they want to continue to deteriorate for the sake of adhering to all the accumulated and often archaic rules that may not even make sense anymore, or if they want reinvestment and vitality. Keep in mind, this sort of reinvention may not exactly look like a Gap, a Starbucks, or a Nordstrom, but that doesn’t mean it isn’t employing people and creating an environment that can start turning a neighborhood around.

    unnamed-14 unnamed-12 5 2

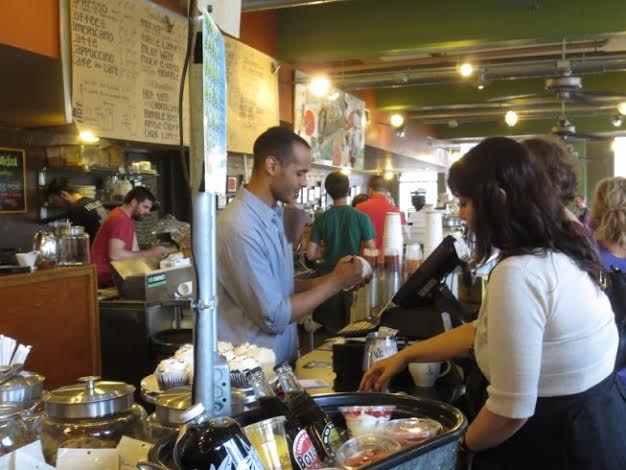
    Wherever I go I seek out examples of people who carve out a little business or useful community space in the midst of an otherwise uninspiring environment. Here are a few examples. Have you ever dreamed of opening up a shop of some kind? Many people do. But then you start to think about the high rent in a good part of town, and the regulations… The need for a handicap accessible public bathroom, a federally inspected commercial kitchen, insurance, a dozen pieces of paper covered in stamps from who-knows-what bureaucracies: permits, licensing fees, certifications, public notifications… Just thinking about the process stops most people cold. And then they find themselves working as an assistant manager at a chain for slightly above minimum wage.

    Screen Shot 2014-12-02 at 2.15.08 AM Screen Shot 2014-12-02 at 2.16.14 AM
    Screen Shot 2014-12-02 at 2.15.35 AM Screen Shot 2014-12-02 at 2.15.24 AM

    These folks just skipped the whole asking-for-permission part and started working on a shoestring budget. They gave the garage a fresh coat of pain, got some inexpensive second hand furniture, flung open the doors, put out a sign, and started selling flowers. If the business fails they haven’t lost much – and at least the garage is finally clean and organized. If the shop is successful they can eventually work their way up to the full ADA, OSHA, and DOT gold standard with minimum parking ratios and energy efficiency compliance. But that can come later. Towns have to choose. Do they want to tolerate this sort of thing or shut it down immediately? It tends to come down to the “property values” folks objecting to the “trashy” nature of such establishments. In the end it’s all a matter of self-selecting populations agreeing on what is acceptable in their neighborhood and what isn’t. Some places will roll with it and others won’t. Fair enough.

    Screen Shot 2014-12-02 at 2.31.03 AM Screen Shot 2014-12-02 at 2.28.41 AM Screen Shot 2014-12-02 at 2.29.41 AM 
    Screen Shot 2014-12-02 at 2.30.12 AM

    Screen Shot 2014-12-02 at 2.28.58 AM Screen Shot 2014-12-02 at 2.29.20 AM Screen Shot 2014-12-02 at 2.28.33 AM Screen Shot 2014-12-02 at 2.28.13 AM Screen Shot 2014-12-02 at 2.28.03 AM Screen Shot 2014-12-02 at 2.29.34 AM

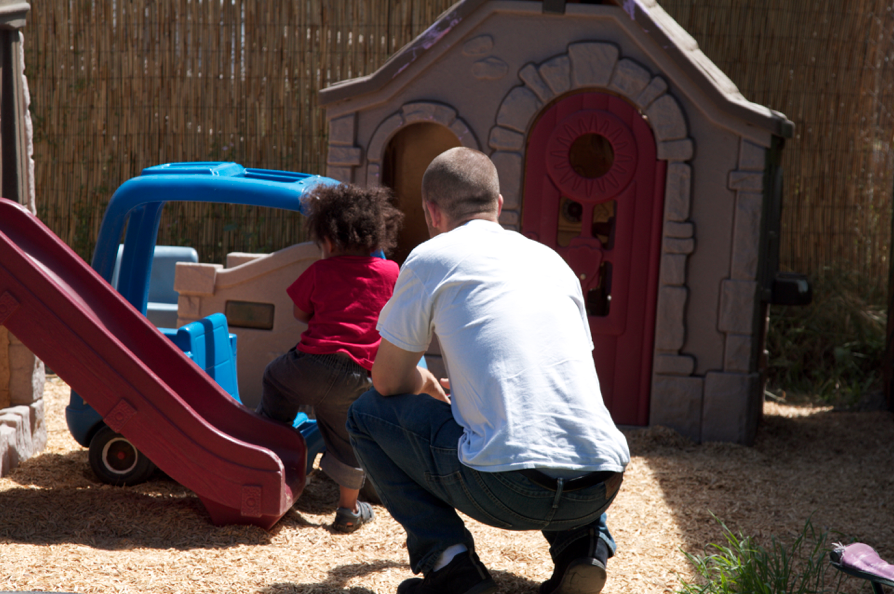
    Here’s a small town coffee shop with a big mostly vacant gravel parking lot that’s been set up as a family gathering place. People can come here, get a sandwich, something to drink, a pastry, and linger with other people from the neighborhood. The shipping containers are both secure storage for the cafe’s supplies, as well as the walls of an outdoor play area for kids. The picnic tables, shade structures, bicycle racks… none of it is expensive. A liability lawyer and insurance adjuster could have a field day with this place. But so far there have been no deaths or mutilations – except for out on the highway in front. But those folks were in cars and had nothing to do with the coffee shop or playground. (I don’t see the county shutting down the highway.)

    Screen Shot 2014-12-07 at 3.03.59 AM Screen Shot 2014-12-07 at 3.03.12 AM Screen Shot 2014-12-07 at 2.59.01 AM Screen Shot 2014-12-07 at 2.59.31 AM Screen Shot 2014-12-07 at 3.00.52 AM

    Screen Shot 2014-12-07 at 3.01.32 AM
     Screen Shot 2014-12-07 at 2.59.11 AM

    Around the corner from my apartment there’s a German Lutheran church that puts on a beer garden in their parking lot at Christmas. There’s a mix of expatriate Germans (in jeans and T-shirts) and local German-Americans (in lederhosen and fedoras) along with the usual San Francisco Hindus, Buddhists, and seriously lapsed Catholics (that would be me), but all are welcome. The beer, bratwurst and kitsch oompah band are all pretty good.

    Screen Shot 2014-12-03 at 7.22.42 PM Screen Shot 2014-12-07 at 3.44.27 AM
     Screen Shot 2014-12-07 at 3.43.32 AM Screen Shot 2014-12-03 at 7.22.28 PM Screen Shot 2014-12-07 at 3.45.10 AM

    This is Alfonso’s Cafe. It’s basically a shed in an old parking lot in a not-so-great suburban location. He set out some patio furniture, potted plants, and a shade structure and he manages to earn a respectable living. No one will ever confuse Alfonso’s place with a Parisian cafe, but it gets the job done and truly makes his neighborhood a better place compared to a dead parking lot. It’s Good Enough Urbanism. If all goes well Alfonso may eventually graduate to something bigger and more substantial. If he had to start with the entire armature of a full scale restaurant he may never have been able to pull together the money to get started. Alfonso’s Cafe is actually an in-between step, one level above a push cart or food truck, but one step down from something bigger and fancier.

    My point is that many of the just-scraping-by locations are ripe for reinvention as incubators for small family owned mom and pop businesses if the local authorities cut folks some slack. Not everything will work, but there isn’t much to lose in trying.

    John Sanphillippo lives in San Francisco and blogs about urbanism, adaptation, and resilience at granolashotgun.com. He’s a member of the Congress for New Urbanism, films videos for faircompanies.com, and is a regular contributor to Strongtowns.org. He earns his living by buying, renovating, and renting undervalued properties in places that have good long term prospects. He is a graduate of Rutgers University.

  • Cities: Better for the Great Suburbanization

    Where Cities Grow: The Suburbs

    The massive exodus of people from rural areas to urban areas over the past 200 years has been called the "great urbanization." For more than two centuries, people have been leaving rural areas to live in cities (urban areas). The principal incentive has been economic. But most of this growth has not taken place close to city centers, but rather on or beyond the urban fringe in the suburbs (and exurbs). Appropriately, The Economist magazine refers to the urbanization trend as the "great suburbanization," in its December 6, 2014 issue (PLACES APART: The world is becoming ever more suburban, and the better for it).

    The preponderance of suburban growth is evident in high income world metropolitan areas. For decades, nearly all growth in nearly all cities has been in the suburbs. Some notable examples are London, Toronto, San Francisco, Portland, Tokyo, Zürich, and Seoul. The dominance of suburban growth is also evident in the major cities of the less developed world, from Sao Paulo and Mexico City, to Cairo, Manila, Jakarta, Beijing, and Kolkata (see the Evolving Urban Form series). The Economist describes the substantial spatial expansion of residences and jobs in Chennai (formerly Madras), a soon-to-be megacity in India.

    Growing Cities Become Less Dense

    The Economist quotes New York University geographer Shlomo Angel, whose groundbreaking work (such as in Planet of Cities) indicates that "almost every city is becoming  less dense." Angel also shows that, contrary to the popular perception of increasing densities, cities become less dense as they add more population. This extends even to the lowest income cities, such as Addis Abeba (Ethiopia), where the population has increased more than 250 percent since the middle 1970s, while the urban population density has declined more than 70 percent. The rapidly growing cities of China exhibit the same tendency, where, according to The Economist: "Mr. Angel finds that population densities tend to drop when Chinese cities knock down cheaply built walk-up apartments and replace them with high towers."

    Suburbs in the United States

    In the United States, The Economist says that more than half of Americans live in suburbs. In fact, this is an understatement, owing to the common error of classifying "principal cities" as urban core, when many are, in fact, suburban. The Office of Management and Budget established the "principal cities" designation to replace the former "central city" versus suburb classification. This was in recognition of the fact that employment patterns in US metropolitan areas had become polycentric, with suburban employment centers, which along with central cities were designated as "principal cities."

    The absurdity of using "principal cities" as a synonym for central cities is illustrated by the broad expanses of post-1950 suburbanization now classified, with genuine core cities like New York or Chicago, as principal cities such like Lakewood, New Jersey (New York metropolitan area), Hoffman Estates (Chicago), Mesa (Phoenix), Arlington (Dallas-Fort Worth), Reston (Washington) and Hillsboro (Portland). In fact more than 85 percent of major metropolitan area (over 1 million population) residents live areas that are functionally suburban or exurban according to our small area analysis ("City Sector Model").

    Urban core growth rates have improved since 2010, which is an encouraging sign. Yet, core city jurisdictions account for less than 30 percent of metropolitan area growth, as Richard Morrill has shown. The Economist points out factors that could prevent this long overdue improvement from being sustained in the future.

    • Schools are "still often dire in the middles of cities," according to The Economist. Any hope of keeping most young families as they raise children seems impossible until core cities take on the politically challenging task of school reform.
    • The Economist also notes the huge government employee pension obligations of some large core cities, suggesting the necessity of cutting services or raising taxes. "Both answers were likely to drive residents to nearby suburbs, making the problem worse. No number of trams, coffee shops or urban hipsters will save cities that slip into this whirlpool." The Economist specifically cites Chicago and New York, but could have added many more examples both in this country and outside.

    Limiting Sprawl and Limiting Opportunity

    The Economist is refreshingly direct in its characterization of attempts to stop urban spatial expansion ("urban sprawl"). "Suburbs rarely cease growing of their own accord. The only reliable way to stop them, it turns out, is to stop them forcefully. But the consequences of doing that are severe."  The Economist: chronicles the experience of London, with its "greenbelt" ("urban growth boundary"): "Because of the green belt London has almost no modern suburban houses and very high property prices."

    The social consequences have been massive. "The freezing of London’s suburbs has probably aided the revival of inner-London neighbourhoods like Brixton. It has also forced many people into undignified homes, widened the wealth gap between property owners and everyone else, and enriched rentiers." Housing is typically the largest share of household expenditures and raising its price reduces discretionary incomes, while increasing poverty. In London, The Economist says that "To provide desperately needed cheap housing, garages and sheds there are being converted into tiny houses," quoting historian John Hickman who calls them “shanty towns”.

    Higher house prices and lower discretionary incomes are not limited to London. Among the 85 major metropolitan areas covered in the 10th Annual Demographia International Housing Affordability Survey, all 24 of those with "severely unaffordable" housing have London-style land-use regulation or similar land use restrictions. These financial reverses are not limited to suburban households, since urban containment policies are associated with substantial house price increases in urban cores as much as in suburbs.

    "Doom Mongering" About the Suburbs

    Oblivious to this revealed preference for residential and often commercial suburban location, many retro – urbanists, including many well placed, have viewed the suburbs with "concern and disdain," according to The Economist. Since the Great Financial Crisis, The Economist notes that this has turned to "doom-mongering."

    The Economist summarily dismisses suburban doom doctrine: "Those who argue that suburbia is dying are wrong on the facts; those who say it is doomed by the superiority of higher-density life make a far from convincing case."

    The Future

    In the editorial leader, The Economist, suggests: A wiser policy would be to plan for huge expansion. Acquire strips of land for roads and railways, and chunks for parks, before the city sprawls into them.

    The Economist adds: This is not the dirigisme (government planning) of the new-town planner—that confident soul who believes he knows where people will want to live and work, and how they will get from one to the other. It is the realism needed to manage the inevitable.

    The Economist continues that the suburbs have worked well in the West and are spreading, concluding that: We should all look forward to the time when Chinese and Indian teenagers write sulky songs about the appalling dullness of suburbia.

    Wendell Cox is principal of Demographia, an international public policy and demographics firm. He is co-author of the "Demographia International Housing Affordability Survey" and author of "Demographia World Urban Areas" and "War on the Dream: How Anti-Sprawl Policy Threatens the Quality of Life." He was appointed to three terms on the Los Angeles County Transportation Commission, where he served with the leading city and county leadership as the only non-elected member. He was appointed to the Amtrak Reform Council to fill the unexpired term of Governor Christine Todd Whitman and has served as a visiting professor at the Conservatoire National des Arts et Metiers, a national university in Paris.

    Photo: Suburban Ho Chi Minh (Saigon), by author

  • Would the Twin Cities Survive New Urbanism?

    In December, the Metropolitan Council of Minneapolis and St. Paul is scheduled to vote on a vision for the region’s housing and transportation future. “Thrive MSP 2040” is the council’s comprehensive development plan for the seven-county Twin Cities metro area for the next 30 years. It’s a regional growth plan that will result not in a cure for the area’s ills, though, but in a virus that will kill its vitality.

    The Minneapolis/ St. Paul area is one of the most livable regions in the nation. That’s not because residents were forced onto transit and into high density housing, as ‘Thrive’ will do. Growth occurred in a natural manner, in an area with great schools, because people here had the freedom to choose the size of yard for their kids, and the ability to embrace the natural openness of the region. The vigorous suburban growth that resulted has helped our vitality, despite past decisions from the Met Council to neutralize it.

    The Metropolitan Council isn’t alone in adopting New Urbanist plans on a wholesale basis. Their approach, and the problems that go with it, are being repeated by many planning boards nationwide. The 350-page ‘Detroit Future City’ plan is a tunnel-vision strategy based on the same New Urbanist thought. With the best of intentions — goals of avoiding pre-fabricated monotony and sprawl, and creating affordable, livable communities — municipalities are actually writing prescriptions that will do just the opposite.

    I speak with the perspective of a locally-based development consultant, and as an observer and resident of the region for 31 years. I’ve witnessed what has actually helped make this area succeed. At my company, we’ve designed hundreds of sustainable neighborhoods that don’t adhere to the New Urbanist principles of high density and only public transit.

    Two decades ago, the Met Council placed its faith in an urban growth boundary, limiting sewer development in the metro area to inoculate itself against “sprawl”. The result was an increase in the very sprawl the council sought to avoid, as development leap-frogged outside the seven-county area to escape the high land prices created by the artificial land limitation.

    The Met Council hired Peter Calthorpe, founder of Congress for the New Urbanism, for several million in tax dollars, to provide a vision for our region’s future growth. The ‘one size fits all’ approach resulted in projects like Clover Ridge in Chaska, Ramsey Town Center, and indirectly, others like St. Michaels ‘Town Center’, none of which delivered the promises that had been made.

    Calthorpe’s attempt to create a ‘sense of place’ failed to sufficiently attract home buyers. For example, the ‘conventionally planned’ sections of Clover Ridge sold well. But, with their sardine-like density, the housing along alleys remained vacant. Because the development did not attract as many homebuyers as anticipated, among other reasons, local shopping and restaurants did not materialize as the Met Council had promised.

    More recently, ‘Smart Growth’ planners of projects such as ‘Excelsior and Grand’ in St. Louis Park failed to acknowledge why retailers were abandoning their spaces. A spokeswoman for Panera Bread cited poor location and lack of convenience for customers. Yet ‘Excelsior and Grand’ is a model New Urbanist plan, complete with the obligatory central ‘traffic circle’ with a ‘sense of place’ sculpture.

    These smart-growth projects are examples of architects preaching a singular growth model that does not work for all people, in all climates. Those who assume that working class residents will appreciate waiting outside in 20 below zero weather at an architecturally designed “sense of place” bus stop, and then coming home to the 14th floor of a high rise, are clueless. And the dense projects being built in this region have the same sort of repetition of design that smart-growth planners criticize in suburbia.

    Today in the Twin Cities, sales of new, single-family homes are rebounding, creating a catalyst for economic stability. Despite this market reality, some developers are still submitting new multifamily housing proposals. That’s due to Met Council density mandates, not because of market demand. The Council’s assumption is that the population will migrate to the urban core for its (expensive) restaurants and its 19th century rail technology, abandoning spacious suburbs and cars. But sales suggest otherwise.

    The Met Council’s ‘Thrive 2040′ vision will undermine the American Dream of obtaining an affordable single-family home in an area where one desires to live, with the freedom of travel (and protection from our harsh winters) that only personal vehicles currently provide. Under the ‘Thrive’ mandates, more workers will need to live in ‘affordable housing’ (mid- or high rises) and take mass transit to their jobs. Yet ‘affordable housing’ remains elusive in ‘Smart Growth’ projects, unless it is heavily subsidized with tax dollars.

    Calthorpe’s Congress for the New Urbanism actually boasts of the gentrification it produces. But when home prices go up, what happens to the living standard for displaced low-income families? The working class, regardless of race, should be outraged by ‘Thrive’.

    Density does not guarantee affordability. We cannot forever throw tax dollars at high-density development solutions in an effort to make them economically feasible. A successful, balanced housing market drives the economy. At their December meeting, let’s hope the Met Council recognizes that the ‘Thrive’ vision is anything but balanced.

    Rick Harrison is President of Rick Harrison Site Design Studio and Neighborhood Innovations, LLC. He is author of Prefurbia: Reinventing The Suburbs From Disdainable To Sustainable and creator of Performance Planning System. His websites are rhsdplanning.com and pps-vr.com.

    Flickr photo by Adelie Freyja Annabel: Edina, a suburb of Minneapolis. “This is the original Caribou Coffee, which opened in 1992 on France Avenue between Sunnyside and 44th Street.”

  • The Evolving Urban Form: Tianjin

    Tianjin is located on Bohai Gulf, approximately 75 miles (120 kilometers) from Beijing. It was the imperial port of China, by virtue of that proximity. Tianjin also served as one of the most important "treaty ports" occupied and/or controlled by western nations and Japan for various years before 1950.

    Tianjin is pivotally located along the East coast corridor between "Dongbei" – the northeast (the provinces of Heilongjiang, Jilin and Liaoning, which are also referred to as Manchuria) and Jinan, Nanjing, Shanghai and points south. Both the most direct expressway route (interstate standard) and high speed rail line from Shanghai to Dongbei cross through Tianjin rather than larger Beijing.

    Tianjin is one of four centrally administered provincial level municipalities, along with Shanghai, Beijing, and Chongqing. While Tianjin has grown strongly in recent years, it has been one of China’s largest cities for decades. According to the United Nations, the 1950 Tianjin urban area was the second largest in China, with 2.5 million residents, trailing only Shanghai which had 4.3 million. Beijing trailed Tianjin by a third, at 1.7 million.

    Population and Growth

    Since 1982, the total population of Tianjin has expanded by nearly 90 percent, from 7.9 million to 14.7 million in 2013 (Exhibit 1).  Population growth has accelerated over that time. Between 2000 and 2010, the population rose 2.7 percent annually, more than double 1.2 percent rate of the 1990s. The rate of increase was even higher between 2010 and 2013, at 4.5 percent.

    Between the 2000 and 2010 censuses, the inner core district (Heping qu), experienced a population loss of 12 percent. But the rest of the municipality increased, accounting for 101 percent of the growth. The balance of the core captured 18 percent of the growth, while the suburban ring attracted 27 percent. By far the greatest growth was in the outer districts, which accounted for a solid majority of the growth (Exhibit 2). This peripheral domination of growth mirrors the experience of other large Chinese cities, such as Shanghai, Beijing, and Chongqing, which have seen their core areas decline in population, with most growth occurring in the outer sectors.

    A New Megacity

    Tianjin is one of the world’s newest megacities (urban area over 10 million population). This has occurred because of the strong post-2010 population growth. In the next Demographia World Urban Areas (early 2015), Tianjin will have an estimated built up urban area population of 10.9 million. With an urban expanse covering 775 square miles (2,007 square kilometers), Tianjin has an urban population density of 14,100 per square mile (5,400 per square kilometer).

    With the urban area expanding geographically, Tianjin fits the international trend of cities, in growing strongly, yet experiencing declining overall urban densities. Chinese urban planners have told me that it has been an intended objective of policy to reduce population densities, to give people more living space. This is despite the preachments of US and European urban planners for whom higher densities often are embraced as an "Article of Faith."

    Tianjin’s Urban Form

    Despite their comparatively high density, Chinese cities are anything but compact. Most are polycentric in urban form, with central districts have widely spaced commercial buildings (the most notable exceptions may be Shanghai, Chongqing, and Dalian, but even these are somewhat polycentric). Tianjin, along with "in situ" urbanization Quanzhou, may be the least compact of the major cities.

    Tianjin has a broad central business district (CBD), populated with tall, commercial buildings and residential structures (Exhibits 3 & 4). As is the case in many Asian cities (such as Bangkok, Guanzhou-Foshan, Xi’an and Beijing, the tall commercial buildings tend to be highly dispersed, rather than close together as is the custom in Canadian and American cities. In between the dispersed tall buildings are lower rise buildings, both commercial and residential.

    Currently the tallest building in the CBD is the Tianjin World Financial Center (Exhibit 5), at 76 stories (1,105 feet or 337 meters). This is somewhat taller than New York’s Chrysler Building, which was the second tallest in Gotham for years. However, another taller building is near completion, the Tianjin R&F Guangdong Tower (Exhibit 6), which is well on the way to its 91 floors (1,535 feet or 468 meters). However,even this building is not as tall as three others under construction in other Tianjin centers.

    A second central business district is developing in the Binhai new area, near the port and 30 miles (50 kilometers) south of the Tianjin CBD. The Rose Rock International Financial Center will reach 100 floors (1,929 feet or 538 meters). This, however, is only the second tallest under construction. The CTF Tower is also under construction and will reach 96 floors (1,740 feet or 530 meters), nearly as tall as the new World Trade Center in New York (1,776 feet or 541 meters).

    Finally, the tallest building in Tianjin, Goldin Finance 117 is under construction approximately 9 miles (15 kilometers) west of the Tianjin CBD in a virtually new business center. This building will exceed the heights of all but three of the completed skyscrapers in the world (Lead Photo).

    Altogether, Tianjin will soon have five buildings of more than 90 floors, a record few if any cities will soon equal.

    Architecture

    Tianjin has more than its share of modern Chinese high rise commercial structures and residential buildings. But, perhaps to a greater extent than any other Chinese city, Tianjin exhibits the architecture of the foreign powers to a greater degree than some other treaty ports (such as Fuzhou, Dalian, and Wuhan). The city of Tianjin has meticulously preserved many of these structures, not only commercial and residential buildings, but also churches.

    The Tianjin CBD has a number of low rise streets with European architecture. Some of the most impressive are across the Hai River from the Tianjin Railway Station. There is also a long pedestrian street beyond with considerable western architecture. Virtually throughout the urban core there are examples of classic western architecture, some as ornate as in central Buenos Aires (Exhibit 7).

    Perhaps the most unique feature is a large area of western residences just to the south of the Tianjin CBD (Exhibits 8 & 9).

    In the Beijing Orbit: An Advantage

    Tianjin is clearly in the orbit of larger Beijing, which has recently announced plans for a 7th ring road and other infrastructure to tie not only the city but adjacent provincial level jurisdictions together (Tianjin and Hebei). With a strong policy interest in limiting Beijing’s population growth, and with plenty of rural land available, Tianjin could receive a substantial share of growth that otherwise would go to Beijing.

    Top photo: Goldin 117 Financial Building under construction at November 6, 2014 (by author).

    Wendell Cox is principal of Demographia, an international public policy and demographics firm. He is co-author of the "Demographia International Housing Affordability Survey" and author of "Demographia World Urban Areas" and "War on the Dream: How Anti-Sprawl Policy Threatens the Quality of Life." He was appointed to three terms on the Los Angeles County Transportation Commission, where he served with the leading city and county leadership as the only non-elected member. He was appointed to the Amtrak Reform Council to fill the unexpired term of Governor Christine Todd Whitman and has served as a visiting professor at the Conservatoire National des Arts et Metiers, a national university in Paris.

  • The Reluctant Suburbanite, Or Why San Francisco Doesn’t Always Work

    This week I’m helping a friend move house after watching her grapple with some unappealing options for the last couple of years. In the end she’s leaving San Francisco and moving to the suburbs forty-seven miles to the south. She absolutely hates the suburbs, but given all the possibilities it really is the right thing to do under the circumstances. Here’s a little background. She attended Berkeley University in the 1990′s as a foreign exchange student and fell in love with the Bay Area. She went back home, worked very hard, jumped through a million bureaucratic hoops, and eventually became a naturalized citizen. She’s lived here in San Francisco for the last fifteen years. Eight years ago she bought an apartment next door and we became good friends.

     Screen Shot 2014-11-05 at 9.30.52 PM

    Screen Shot 2014-11-05 at 10.52.01 PM Screen Shot 2014-11-05 at 10.52.46 PM Screen Shot 2014-11-05 at 11.56.50 PM   Screen Shot 2014-11-06 at 12.01.32 AM Screen Shot 2014-11-05 at 10.56.12 PM Screen Shot 2014-11-05 at 11.57.26 PM Screen Shot 2014-11-05 at 10.48.27 PM

    Over the years she went from being a starving student to having a good paying job in the tech sector. Her work was initially downtown which was an effortless ten minute commute by BART (the local rail system). But a few years back she landed a job with one of the big companies in Silicon Valley. She had absolutely no desire to schlep that far to work so one of the terms of her employment was she would work from home most of the time and appear in person at the office once in a blue moon when absolutely necessary. That arrangement worked really well in the beginning. But then the nature of her position changed, she was promoted, she got a raise, and she found herself at the office more and more often. She bought a car and endured the long miserable commute with bumper to bumper traffic that took two hours each way and left her in a foul mood. She took the so-called “Google” bus (all the tech companies have private shuttle buses but they’re all generically referred to as the “Google” bus) but there were problems with that too. The company bus takes just as long as driving. While she was able to be more productive as a WiFi enabled passenger she was still spending an extra four hours a day schlepping back and forth. This was in addition to some very long hours at the office that sometimes involved spending the night solving complex urgent problems or synchronizing with coworkers in India or Singapore. Her life essentially became her job and her commute with little room for anything else. She wasn’t happy and she wasn’t even able to enjoy the things that she loved about living in San Francisco.

    Screen Shot 2014-11-06 at 3.32.25 AM

    There’s another aspect of the situation here in San Francisco that motivated her to leave. On three separate occasions in the last year she was approached by strangers as she got on or off the company bus. One guy spit on her, another called her a (well, I won’t use the actual word here, but it’s a crude reference to a female body part) and another guy lectured her about how all the newly arrived tech people were destroying the city. She began to feel distinctly unwelcome in her own neighborhood – and by people who may not even have lived here as long as she has. The irony of the situation is that because she plans to eventually return to San Francisco she needs to keep her apartment. She can’t sell it because she may never be able to afford to buy a new place here. But she can’t rent it either because local regulations make it extraordinarily difficult to remove tenants once they get settled in. In effect she wouldn’t be able to move back into her own home without a significant amount of sturm and drang and a big financial and legal battle. She’d love to rent the place for a few years so the rental income would cover her mortgage, but instead she’s leaving her apartment empty and paying both the city and suburban mortgages. It’s the only logical thing to do under the circumstances. The ordinances that are designed to protect renters are working to take units off the market since no sane person wants to be a landlord in the city.

    You might ask why she doesn’t just quit her job. She did consider it. But she does a very specific kind of thing and doesn’t want to give up her position and the challenges that only a particular kind of company can provide. If she wants to continue in her career she’s most likely going to have to work for one of the other big companies in the southern suburbs. The job wasn’t the problem. The commute was. Now I can picture some of you out there rolling your eyes about this woman and her “problems”. Poor baby. But her dilemma is very similar to a lot of people who need to stay in a job for all sorts of reasons. For example, I know teachers and cops who are so over their jobs, but they’ve been plugging away for an eternity and they just need to hang in there for a few more years in order to collect a full pension. I know other people who lost their jobs and are now forced to do work elsewhere in order to make ends meet. People have their reasons and it’s hard to argue when you start poking at the particulars.

    Screen Shot 2014-11-06 at 2.22.17 AM  Screen Shot 2014-11-06 at 2.21.37 AM Screen Shot 2014-11-06 at 2.48.31 AM Screen Shot 2014-11-06 at 2.46.56 AM Screen Shot 2014-11-06 at 2.47.07 AM Screen Shot 2014-11-05 at 9.32.48 PM Screen Shot 2014-11-05 at 9.48.08 PM

    So here’s what her new place is like. The house is a 1947 tract home with a patch of front lawn and a wee little back yard. She’s got two bedrooms and two baths. It’s cute and she and I agree that it’s very comfortable and has everything most people would want or need in a home. And at $645,000 it’s significantly bigger and less expensive than her one bedroom apartment in the city which is estimated at around $850,000. (She didn’t pay anything like that eight years ago, but prices have skyrocketed lately.) The really important thing about this house is its location a mile from her office. She could ride a bicycle to work if she wanted to, although she will almost certainly drive or take the light rail. It’s physically possible to ride a bike, but it isn’t necessarily safe or pleasant given the wide roads and high speed of the cars and trucks whizzing by. In fact, once you step off the front lawn there really isn’t anything in her neighborhood that’s even remotely worth walking to or as pleasant as what she’s leaving behind in San Francisco. The only place to buy milk and eggs was the corner gas station. But here’s where it gets interesting…

    Screen Shot 2014-11-06 at 2.50.13 AM Screen Shot 2014-11-06 at 2.50.59 AM Screen Shot 2014-11-06 at 2.55.41 AM Screen Shot 2014-11-06 at 2.54.48 AM Screen Shot 2014-11-06 at 2.55.15 AM

    I asked her where she’d eat since the only places in evidence were drive-thru fast food joints and low end chain restaurants in strip malls. She explained that her company (like all the companies in Silicon Valley) provides a variety of high quality heavily subsidized restaurants within the corporate campus. In fact she invited me to explore the place and we had lunch together a couple of times. Once I registered, went through security, and entered the complex there was an entire self-contained world to explore. These places employ tens of thousands of people from all over the world. At lunch there was excellent dim sum, samosas, saag paneer, dolmas, kibbeh, long salad bars, boreks, beef steaks and potatoes – all locally sourced, organic, seasonal, and beautifully prepared by professional chefs. Kosher? Sure. Halal? No problem. Vegetarian? Of course. Special menu for Diwali? You bet. It was all very good and ridiculously inexpensive. Breakfast, lunch, dinner, late night healthy snacks… they have it covered. We dined indoors, but most people drifted out to one of the many al fresco areas. As we walked from building to building I noticed well populated lounges for relaxation and socializing, Starbucks, volleyball courts, pool tables. There’s a farmers market in the parking lot. There’s a dry cleaners. A masseuse or manicurist can be summoned if need be. These companies have essentially taken over the functions of a town and provided them internally for their employees. Partly they do these things to keep their workers happy. Partly it keeps people at work longer than they might otherwise be willing to stay. But on a fundamental level these companies must know that their location in soul crushing sprawl is so lifeless and unsatisfying that they need to compensate by recreating all the aspects of a real town inside the landscaped berms of low rise office parks. And what about the people who live in the area but don’t work for one of these companies and don’t have security clearance to enjoy the buffet and foreign cinema night?

    I understand why she’s moving, but I wouldn’t want to live there myself.

    John Sanphillippo lives in San Francisco and blogs about urbanism, adaptation, and resilience at granolashotgun.com. He’s a member of the Congress for New Urbanism, films videos for faircompanies.com, and is a regular contributor to Strongtowns.org. He earns his living by buying, renovating, and renting undervalued properties in places that have good long term prospects. He is a graduate of Rutgers University.

  • Long Island Suburbs: How Planners Should Treat Age Spots

    Long Island is the birthplace of suburbia, from colonial-period Brooklyn to Levittown and beyond, and its economy has survived booms and busts since the 1950s. As stagnant as it may be, if it’s anything, it is resilient. Today, its problems mirror those of many older suburban areas scattered across the country, and, like many other suburbs, its problems cannot be solved by simply shoehorning in more development – and more tax revenue. Are policymakers addressing the true thorns in the region’s side: Affordable housing, cost-of-living, taxes, racism and fear of change? Planners nationwide could learn much from Long Island if they looked closely at its successes and its failures, and how both evolved.

    In the push to expand housing after WWII, Long Island’s potato fields became subdivisions that, with the passage of time, became increasingly monochromatic, as well as increasingly expensive. The planners of yesteryear crafted strategies that set national precedents in farmland and open space preservation, while simultaneously working to manage unprecedented residential and commercial expansion. During these boom years, planners urged municipalities to protect open space, resulting in yet another set of national benchmarks in regard to groundwater protection.

    Yet the recommendations for an overtly aggressive open space acquisition program were pared down and never fully capitalized upon. Few, if any, of other recommendations leapt from the leather-bound pages of the academic planning texts to become fully implemented. Planning had its moment in the sun on Long Island, but it was quickly eclipsed by special interests with money to spend and projects to greenlight. Today,the academic approach of the previous decades is mostly gone, with the Island’s growth being managed by development firms and nonprofit stakeholder groups. Our current long-term strategies lack a detached professionalism that is unhindered by political forces and agenda-driven ideas.

    The solution being currently proposed is a call for more “responsible” growth. The question is, if growth got Long Island into this mess, how can it eventually get us out? Multifamily units are being proposed under the umbrella of responsible growth, as is the placement of additional sewers. With the arrival of sewers, it is said that growth will be allowed to flourish, helping to keep the wealthy Millennials, stop the cries of “brain drain” and subsequent regional death, and generate jobs.

    At last month’s Destination LI conference (#LIREDI hashtag on Twitter), a group of Millennials spoke about the need for sewers as well as the need for additional growth of multifamily-type units. It was nice to see a new generation become interested and invested in Long Island, and even go so far as to say that this next generation will “fight” to stay in the region. But there was little mention of the fact that there has been an overall 89% increase of units from 1989 to present, or that groundwater quality is compromised as a direct link to overdevelopment, or about the region’s sole source aquifer that dictates appropriate density levels.

    What are the realities of building truly affordable housing in suburban Long Island’s aging suburbs? How can costs be pared down so developers are enticed to build without relying on density to generate profit?

    Planners by trade have to be optimistic, but they must also be realistic when assessing a region’s needs and growth strategies. The current approach by developers and stakeholders is fueled by optimism, but studies the issues on a shallow level instead of working to solve our long-established problems.

    The biggest one? In each town and village hall across Long Island, and in our Nassau-Suffolk region, municipalities often grant density in places where it is simply not appropriate. If an area has a comprehensive plan in place, development should follow the usage that was already determined. But, more often than not, local government awards variances that drastically increase density under the guise of “responsible growth”. These variances add up to a high density sprawl that is worse than the traditional sprawl that they were meant to replace in the first place. They fly in the face of the professional planning efforts undertaken on Long Island over the previous decades. We need a return to professionalism if we are going to create legitimate and workable solutions.

    Urban planning is not merely saying that development is “responsible,” it’s assessing our regions needs by quantifying market trends, environmental data and resident feedback. Planning for our future should not be about catering to one age demographic, but rather, about addressing the needs of all Long Islanders over the course of the future decades. Instead of planning sessions focused on urging downtown development to attract jobs, planners should be justifying why development should be placed in a given downtown, or anywhere else.

    Many tout the expansion of transit, but few address the marked lack of population density that’s necessary to drive the demand and fiscal support of such expansions, or discuss the MTA’s frequent capital budget shortfalls. Planning should be crafted from a scientific and methodological approach, not from buzzwords, faulty surveys or ideal conditions that are neatly summed up on a PowerPoint slide.

    Saying we need affordable housing is easy. Execution of the concept on Long Island has been extremely difficult for decades. Yet this uncomfortable reality is not discussed on panels. Our regional problems require us to confront our balkanized districts, dissect the unbalanced economics of our real estate development, and deal with a heritage of racism furthered by exclusionary municipal jurisdictions.

    Sheer density won’t change sixty years of racial division, jumpstart our stagnant economy , or upgrade our infrastructure to 21st century standards. And, despite what county officials and a myriad of developers are saying, more sewers alone will not solve our woes. We need a sewer plan that works in conjunction with a robust open space plan, which in turn works to complement our approaches to economic development.

    In other words, we need true regional planning.

    To execute our plans, we need professionals. In recent years, municipalities have cut planning staff, and outsourced critically important planning functions to politically-connected boards and stakeholder groups. In Suffolk, the County merged a once nationally-acclaimed department of planning with the economic development department. Despite what anyone says to the contrary, crafting strategies for economic development is not planning. It is a piece of the puzzle, but there are important distinctions that have been forgotten in recent years.

    The convenient narratives of ‘brain drain’, downtown revitalization, and smart growth make it easy to stand behind a podium and tout the benefits of pure, unhindered economic development. But the elephant-sized problem in the room remains. Only this time, instead of being in a single-family home, the elephant’s room will be in in a shiny, new multi-family complex.

    Richard Murdocco regularly writes on land use and policy issues. A collection of his published work can be found on www.TheFoggiestIdea.org, and you can follow him on Twitter @TheFoggiestIdea.

    Flickr photo by Sean Marshall, Weber House in Hempstead, Suffolk County, on Long Island. A plaque in front of the house, built 1947, commemorates one of the first homes in Levittown, New York, considered America’s first planned suburb.

  • California’s Southern Discomfort

    We know this was a harsh recession, followed by, at best, a tepid recovery for the vast majority of Americans. But some people and some regions have surged somewhat ahead, while others have stagnated or worse.

    Greater Los Angeles fails to make the grade. In per capita growth of gross domestic product since 2010, according to analyst Aaron Renn, our region ranks a very mediocre 38th out of 52 metro areas, with a measly 1.5 percent, well below the national average of 3.8 percent. It places behind up-and-comers among the Texas cities, Oklahoma City and some tech-oriented clusters – Silicon Valley ranked second, after Houston. These places have growth rates roughly twice those of the Southland.

    When we wanted to drill down to the more local level, and analyze what is happening by county, we needed to go to the Census Bureau, as opposed to the Bureau of Economic Analysis, where we could glean what is happening in our communities. Our analysis is based on those figures, and neither of us hopes the Southern California region continues to stagnate or decline.

    Poverty

    One of the saddest results of the Great Recession and the weak recovery has been the expansion of poverty across the country. The poverty rate among the country’s 52 largest metropolitan areas, according to the most recent census numbers, grew from 14.9 percent in 1999 to 15.8 percent in 2013, a 7 percent rise. At least one-quarter of that rise has taken place since the recovery began.

    Southland politicians, like those in much of California, often decry income inequality and poverty, but they have not been very effective in combatting it. The region has had higher-than-average poverty for well over a decade, and things have not gotten better recently. Since 2009, the Los Angeles region, which includes Orange County, has seen its poverty rate grow by 1.8 percent, 80 percent higher than the national norm. The area ranked 47th out of 52 in terms of increased poverty. Riverside-San Bernardino saw a similar jump, 1.7 percent, in poverty.

    The scale of the poverty problem in the Southland is much greater than many imagine. When we broke down the figures, Los Angeles County remained the area with the highest concentration of poverty. L.A. saw a slight reduction in poverty from 1999-2010, but has moved in the other direction more recently. From 2010-13, poverty in L.A. County rose from 17.5 percent to 18.9 percent, an 8 percent increase. Poverty now afflicts a considerably larger portion of the population of Los Angeles than it did in 1999.

    But if Los Angeles County endures the largest pocket of poverty, there’s not much for the surrounding counties to shout about. San Bernardino and Riverside counties have each seen rapid 20 percent increases in their poverty rates since 1999; in fact, San Bernardino’s 19.1 percent poverty rate is slightly higher than that of Los Angeles County.

    Orange County fares better, but the curse of poverty is spreading even here. Although its 13.5 percent poverty rate lies below the national average, the ranks of the O.C. poor have jumped 30 percent relative to the entire population since 1999. The expansion of poverty as a share of the population has grown by more than 10 percent since 2010.

    Low Income Growth and High Housing Prices: A Bad Combination

    As befits a region with relatively low GDP growth, incomes in Southern California have stagnated. Median household incomes have dropped in every county in the region, including Ventura and Orange, whose residents boast median household incomes above $70,000, well above the $50,000 range found in Los Angeles, San Bernardino and Riverside. Since 2010, the biggest income drops have happened in the Inland Empire, where real incomes have fallen by nearly 7 percent. Los Angeles also has experienced a drop, with real incomes down 3 percent since 2010.

    For the most part, the more-affluent suburban counties have done better, consistent with the two-speed U.S. economy. Orange and Ventura enjoy median household incomes a full $20,000 above those of Los Angeles County and the Inland Empire. This is after the smaller 2.1 percent reduction (2010-13) in Orange County real incomes. Real incomes have recovered, albeit slightly, only in Ventura. The biggest hit has been concentrated in those parts of Southern California – Los Angeles County and the Inland Empire – historically most dependent on blue-collar professions in manufacturing, logistics and construction. These are, for the most part, also the most heavily Latino and African American areas of the region.

    So, why can’t the Southland replicate the economic boom in the San Francisco Bay Area? Simply put, the Los Angeles region is not the Bay Area, or Seattle. The share of Los Angeles’ jobs that are tied to manufacturing and logistics is twice that of the San Francisco area. Our population is far less well-educated, particularly in the Inland Empire and much of Los Angeles County, and is also far more heavily African American and Latinogroups that have fared particularly poorly. Nationwide, Latino poverty rates, notes a recent Pew study, stand at 28 percent, the highest for any ethnic group.

    Alongside the stagnant economy, growing Latino poverty – which is really the key challenge for Southern California – also reflects a high cost of living. This is most profound in terms of housing costs. Overall, the Southland counties – most notably Los Angeles and Orange – suffer among the highest housing cost burdens, relative to income, than virtually anywhere in the country.

    This can be seen by looking at what parts of the country have the highest percentages of people paying more than 50 percent of pretax income for housing. According to the Center for Housing Policy and National Housing Conference, 39 percent of working households in the Los Angeles metropolitan area spend more than half their incomes on housing, a somewhat higher rate than in the pricier San Francisco and New York areas and much higher than the national rate of 24 percent of households spending more than half of income on housing, itself far from tolerable.

    New Policy Imperatives

    Our current mix of state and local policies are neither reviving the regional economy nor reducing poverty. One key reason is that the current political environment – fostered and perpetuated by greens, urban land interests and organized public workers – places little priority on promoting the growth of the tangible economy that tends to employ blue-collar workers. High energy costs, largely due to the state’s Draconian commitment to renewable fuels, are a direct threat to any kind of industrial growth, while highly restrictive housing policies slow any hope of meeting the needs of renters and prospective homeowners.

    Of course, one could point out that the Bay Area, the one large region in California experiencing above-average income growth, labors under the same progressive policy regime. But the Bay Area, particularly San Francisco, is already largely deindustrialized and its population far more attractive to digitally based companies. It boasts a far larger pool of venture capital, and a unique network to support tech.

    A Google or an Apple can easily move its energy-hungry arrays of computer servers to less-expensive states, along with its device manufacturing. The more grass-roots based, small-business-oriented Southland economy is far less able to adapt to regulatory strictures from Sacramento.

    Southern California leaders clearly need to understand that the region is not winning under the current policy environment in the state. Steps to re-energize our basic industries and restart new housing, particularly single-family housing desired by most young families, need to be taken. Other steps, from reforming the schools and rebuilding basic infrastructure to modernizing higher education, also are imperative. At risk is not just a comfortable way of life, but also the legacy of opportunity that has been so critical to this region from its earliest days, a legacy now at extreme risk.

    This piece first appeared at the Orange County Register.

    Joel Kotkin is executive editor of NewGeography.com and Roger Hobbs Distinguished Fellow in Urban Studies at Chapman University, and a member of the editorial board of the Orange County Register. His newest book, The New Class Conflict is now available at Amazon and Telos Press. He is author of The City: A Global History and The Next Hundred Million: America in 2050. His most recent study, The Rise of Postfamilialism, has been widely discussed and distributed internationally. He lives in Los Angeles, CA.

    Wendell Cox is principal of Demographia, an international public policy and demographics firm. He is co-author of the “Demographia International Housing Affordability Survey” and author of “Demographia World Urban Areas” and “War on the Dream: How Anti-Sprawl Policy Threatens the Quality of Life.” He was appointed to three terms on the Los Angeles County Transportation Commission, where he served with the leading city and county leadership as the only non-elected member. He was appointed to the Amtrak Reform Council to fill the unexpired term of Governor Christine Todd Whitman and has served as a visiting professor at the Conservatoire National des Arts et Metiers, a national university in Paris.

  • Aging America: The U.S. Cities Going Gray The Fastest

    For years we have been warned about the looming, profound impacts that the aging of the U.S. population will have on the country. Well, the gray wave has arrived. Since 2000, the senior population has increased 29% compared to overall population growth of 12%. The percentage of Americans in the senior set has risen from 12.4% to 14.1%, and their share of the population is projected to climb to 19.3% by 2030. There are two principal causes for this: the baby boom generation is reaching 65 years old, while the U.S. fertility rate has fallen markedly in recent decades, despite immigration, and now hovers around the replacement rate.

    To find the cities that are going gray the fastest, we looked at the change from 2000 through 2013 in the share of seniors in the populations of the nation’s largest metropolitan areas, the 52 metropolitan statistical areas that have more than a million residents. Some 13.2% of the residents of these 52 MSAs are seniors, a lower proportion than nationwide.

    Before we look at where the biggest changes have occurred, let’s take a look at where the highest overall concentrations of seniors are: no big surprise, in Florida, and in the slow-growing Northeast and Midwest. Among the 52 biggest metropolitan areas, Tampa-St. Petersburg has the highest share of seniors in its population at 18.2%. The retirement mecca of Miami, where 16.7% of its population is over 65, ranks third in the nation, and Jacksonville is 18th, at 13.7%.

    Outside of Florida almost all the retirement capitals are in the Northeast and Midwest. The second most senior region, for example, is Pittsburgh, where 18.0% of the population is over 65. The old Steel City is followed by a host of Rust Belt metro areas: Cleveland, Rochester, Providence, Hartford, St. Louis and Detroit, all of which have a senior set that makes up 14% or more of the overall population.

    Austin, Texas, has the smallest proportion of seniors, at 9.2%, but its senior share is rising — more on Austin later on. Salt Lake City, Houston and Dallas-Fort Worth are also below 10%, while Raleigh has the fifth-lowest proportion of seniors, at 10.2%. Not surprisingly, all of these relatively young cities are experiencing strong domestic in-migration.

    Cities That Are Aging The Most

    The metropolitan areas that have seen the biggest jumps in the senior proportion of their populations, have, for the most part, been the same ones that have drawn strong net domestic in-migration of millennials, families and working adults. The rise in the share of seniors in these cities isn’t because seniors are moving to them in overwhelming numbers — Census data shows they make major moves less than all other age groups. (In 2011-12, seniors moved to another state five times less frequently than those between the ages of 25-34, according to Current Population Survey figures.) Rather, many of those who have reached 65 since 2000 in the cities that top our list moved to them when they were younger, generally in search of economic opportunities or better lives, and have aged there.

    However, when seniors do decide to move, they can have a disproportionate impact on metropolitan economies because of their relative affluence. Over-65 households have a net worth 2.5 times the national average, according to Census Bureau data. Seniors (over 62) were far less damaged in the housing bust than younger households, and their incomes increased more with the tepid economic recovery, according to St. Louis Federal Reserve studies.

    In first place on our list is Atlanta, where the share of seniors in the population rose from 7.7% in 2000 to 10.4% in 2013, the biggest increase in the nation. In raw numbers, the over-65 population of the metro area rose to 572,534, an increase of  73.5% since 2000.

    The percentage of the population in fast-growing Raleigh, N.C., that is over 65 grew from 8.0% to 10.2% in 2013, putting it in second place.

    Austin may have a reputation as a youthful place, but it’s also getting older rapidly. The senior population has surged 91.7% since 2000 to 172,476, amid a general population boom – the share of seniors in the metro area has expanded from 7.2% to 9.2%, placing it third on our list. The metro area may be unprepared for a mounting “silver tsunami” of impoverished elderly, according to the Austin American-Statesman.

    Two of the cities that posted the biggest increases in the share of seniors in their populations also were among the largest overall domestic migration losers, San Jose, Calif., and Los Angeles. Since 2000, 1.7 million more U.S. residents moved away from the two metro areas than to them. Only Hurricane Katrina-ravaged New Orleans lost a larger share of its total population to domestic out-migration than San Jose, which ranks 4th in the increase of its senior population, going from 9.4% to 11.9%. Los Angeles, which trailed only New Orleans, San Jose and New York in the percentage of its population that it lost to domestic migration, went from 9.8% over-65 to 12.1%, the ninth biggest increase among the 52 largest metro areas. The combination of older households moving less and younger households leaving to take advantage of better job opportunities elsewhere may explain this.

    The balance of the top 10 all experienced net domestic migration gains since 2000.

    Meanwhile, the Rust Belt and Florida cities that already were among the oldest didn’t get much older. Tampa-St. Petersburg actually got younger, at least in part due to strong overall in-migration by younger people.

    Are Seniors Headed To Big Cities?

    One favorite meme of urban boosters is the assertion that seniors are heading to the inner city. The preponderance of evidence shows the opposite. Within the 52 largest metropolitan areas, the urban cores, measured at the small area level (zip codes) have lost seniors to the periphery. Between 2000 and 2010, the urban core senior population declined by  1.5 million, dropping from nearly 15% of the total population to 13%.The losses were pervasive, extending to all the 52 biggest MSAs except for San Diego (and there the urban core gain was miniscule, with 97% of the senior growth occurring in the suburbs and exurbs).

    In contrast, suburbs and exurbs together gained over 2.82 million seniors. But the largest increases were farthest from core, in the newer, outer suburbs and exurbs. Together these areas gained 2.4 million seniors. Rather than headed into the core, the prevailing trend has been quite the opposite.

    A similar pattern has been identified in Canada. A recent study of that country’s six largest cities found similar patterns, with older Canadians, if they move, tending to end up the suburban rings.

    Just The Beginning

    Over the next 15 years, cities are likely to age even faster. Those cities that attract the most among relatively few senior domestic migrants and which have seen their over-50 cohorts swelled by previous domestic migration should see the largest increases. At the same time, other cities with modest senior population gains could also age more quickly if more of the rest of the population moves away.

    Seniors in America’s Largest Metropolitan Areas, 2000-2013
    Ranked by change in share of seniors, 2000-2013
    Rank MMSA Seniors Share 2000 Seniors Share 2013 Seniors Share Change 2000-13% Number of Seniors 2013 Change in Total Seniors 2000-13%
    1 Atlanta, GA 7.7% 10.4% 34.0% 572,534 73.5%
    2 Raleigh, NC 8.0% 10.2% 28.6% 124,285 96.0%
    3 Austin, TX 7.2% 9.2% 27.2% 172,476 91.7%
    4 San Jose, CA 9.4% 11.9% 26.7% 229,062 40.1%
    5 Denver, CO 9.0% 11.3% 25.7% 304,698 57.1%
    6 Dallas-Fort Worth, TX 7.9% 9.9% 25.6% 676,537 64.4%
    7 Jacksonville, FL 11.0% 13.7% 24.2% 191,000 54.2%
    8 Houston, TX 7.7% 9.5% 24.0% 601,800 66.9%
    9 Los Angeles, CA 9.8% 12.1% 23.7% 1,584,236 31.4%
    10 Portland, OR-WA 10.4% 12.8% 23.5% 296,365 48.3%
    11 Minneapolis-St. Paul, MN-WI 9.7% 11.9% 23.1% 412,713 40.4%
    12 Washington, DC-VA-MD-WV 9.0% 11.0% 23.0% 656,678 51.3%
    13 Virginia Beach-Norfolk, VA-NC 10.3% 12.7% 22.7% 215,992 32.6%
    14 Grand Rapids, MI 10.5% 12.7% 20.5% 128,805 31.6%
    15 Las Vegas, NV 10.7% 12.8% 20.4% 260,156 77.5%
    16 Rochester, NY 12.9% 15.5% 20.0% 167,497 22.3%
    17 Detroit, MI 12.0% 14.3% 19.7% 616,033 15.5%
    18 Sacramento, CA 11.3% 13.5% 19.1% 298,327 46.8%
    19 Seattle, WA 10.1% 11.9% 17.9% 431,378 39.8%
    20 Richmond, VA 11.4% 13.3% 17.1% 166,173 38.2%
    21 San Francisco-Oakland, CA 11.7% 13.7% 16.8% 617,996 27.9%
    22 New Orleans. LA 11.4% 13.2% 16.4% 164,372 8.0%
    23 Memphis, TN-MS-AR 10.0% 11.7% 16.3% 156,792 28.7%
    24 Salt Lake City, UT 8.0% 9.3% 15.6% 105,993 40.3%
    25 Columbus, OH 10.1% 11.7% 15.5% 230,044 35.6%
    26 Charlotte, NC-SC 10.5% 12.0% 15.2% 281,202 56.7%
    27 Phoenix, AZ 11.9% 13.7% 15.1% 604,442 55.8%
    28 Nashville, TN 10.3% 11.8% 14.9% 208,133 46.3%
    29 Chicago, IL-IN-WI 10.9% 12.4% 14.3% 1,184,871 19.8%
    30 Baltimore, MD 12.0% 13.7% 14.1% 379,722 23.8%
    31 Cincinnati, OH-KY-IN 11.7% 13.3% 13.4% 283,518 21.5%
    32 Kansas City, MO-KS 11.5% 13.0% 12.8% 266,749 27.9%
    33 Louisville, KY-IN 12.4% 14.0% 12.4% 176,229 26.6%
    34 Cleveland, OH 14.5% 16.2% 11.8% 335,054 7.5%
    35 Boston, MA-NH 12.6% 14.1% 11.6% 658,710 19.0%
    36 St. Louis,, MO-IL 13.0% 14.4% 11.1% 404,297 16.3%
    37 San Diego, CA 11.1% 12.3% 10.8% 396,543 26.4%
    38 Hartford, CT 13.9% 15.4% 10.5% 187,183 16.9%
    39 New York, NY-NJ-PA 12.6% 13.9% 10.4% 2,768,694 16.3%
    40 Birmingham, AL 12.8% 14.1% 10.1% 160,686 19.3%
    41 San Antonio, TX 10.8% 11.9% 10.1% 270,480 46.5%
    42 Riverside-San Bernardino, CA 10.5% 11.5% 9.8% 502,846 47.8%
    43 Oklahoma City, OK 11.4% 12.5% 9.7% 164,481 32.2%
    44 Indianapolis. IN 11.0% 12.0% 9.5% 234,973 29.0%
    45 Orlando, FL 12.4% 13.4% 8.5% 304,660 49.7%
    46 Milwaukee,WI 12.6% 13.5% 7.4% 211,527 12.3%
    47 Providence, RI-MA 14.4% 15.4% 7.0% 247,689 8.4%
    48 Philadelphia, PA-NJ-DE-MD 13.4% 14.2% 6.5% 858,313 13.0%
    49 Buffalo, NY 15.9% 16.5% 3.7% 186,693 0.5%
    50 Miami, FL 16.4% 16.7% 1.8% 975,529 18.5%
    51 Pittsburgh, PA 17.7% 18.0% 1.6% 425,102 -1.3%
    52 Tampa-St. Petersburg, FL 19.2% 18.4% -4.3% 527,861 14.6%
    52 Major Metropolitan Areas 11.4% 12.9% 13.2% 22,588,129 29.2%
    Outside MMSAs 13.6% 15.7% 14.8% 22,115,945 26.4%
    United States 12.4% 14.1% 13.8% 44,704,074 27.8%

    This piece first appeared at the Orange County Register.

    Joel Kotkin is executive editor of NewGeography.com and Roger Hobbs Distinguished Fellow in Urban Studies at Chapman University, and a member of the editorial board of the Orange County Register. His newest book, The New Class Conflict is now available at Amazon and Telos Press. He is author of The City: A Global History and The Next Hundred Million: America in 2050. His most recent study, The Rise of Postfamilialism, has been widely discussed and distributed internationally. He lives in Los Angeles, CA.

    Wendell Cox is principal of Demographia, an international public policy and demographics firm. He is co-author of the “Demographia International Housing Affordability Survey” and author of “Demographia World Urban Areas” and “War on the Dream: How Anti-Sprawl Policy Threatens the Quality of Life.” He was appointed to three terms on the Los Angeles County Transportation Commission, where he served with the leading city and county leadership as the only non-elected member. He was appointed to the Amtrak Reform Council to fill the unexpired term of Governor Christine Todd Whitman and has served as a visiting professor at the Conservatoire National des Arts et Metiers, a national university in Paris.

    “Senior Citizens Crossing” photo by Flickr user auntjojo.

  • Affordable Cities are the New Sweet Spots

    I’ve lived in San Francisco long enough (I’m getting old) that I’ve seen several waves of bright young people arrive, burn out, then move away. For some they were looking for adventure, found it, and then carried on with normal life elsewhere. But for most it was simply a matter of the numbers not adding up. Working a dead end low wage job while sharing a two bedroom apartment with seven room mates is only romantic for so long. I’m fairly inquisitive so I’ve kept up with many of these folks to see how they manage after they leave. I travel a lot and pop in to visit on occasion. The big surprise is that they aren’t moving to the suburbs the way previous generations did when they were done with their youthful excursions in the city.

    Cincy 23  Cincy 3  Cincy 7

    Cincy 2  Cincy 24
    Cincy 25
    Cincy 1

    Instead, they’re seeking out smaller less expensive cities with the same basic characteristics as the pricey places that squeezed them out. I’m very fond of one young couple in particular who spent time in Los Angeles, Baltimore, and Portland before finally settling down and buying a house in Cincinnati. Why Cincinnati? It’s a great town at a fantastic price. They bought a charming four bedroom century old home in an historic neighborhood a couple of miles from downtown for $50,000. Their mortgage is $300 a month. Okay, with tax and insurance it’s more like $500. And it wasn’t a fixer-upper in a slum. It’s a genuinely lovely place with amazing neighbors.

    Cincy 6
    Cincy 5
    Cincy 51 -1
    Cincy 8

    Who needs New Urbanism or Smart Growth when so many amazing old neighborhoods are just sitting out there in under-appreciated and radically undervalued cities all across North America? The Rust Belt has long since hit bottom and has already adjusted to every indignity that the Twentieth Century could throw at it: deindustrialization, race riots, white flight to the suburbs, population shifts to the Sun Belt… Now that the unpleasantness has run its course what’s left are magnificent towns ripe for reinvention. Personally I believe many of the boom towns of the last fifty or sixty years have peaked and are about to enter the kinds of steep decline we currently associate with Detroit – except the dried up stucco and Sheetrock ruins of Phoenix and Las Vegas won’t age as well as the handsome brick buildings of the Midwest.

    Cincy 33
    3 Cincy 34
    4

    Don’t get me wrong. Cincinnati isn’t San Francisco. It isn’t Brooklyn either, although they do have an elegant bridge by the same engineer. If you want to be a Master of the Universe in international finance, or the next super genius computer whiz, or a millionaire movie star you probably need to be in a bigger place. But most of us just want ordinary comfortable rewarding lives surrounded by good people. The big question is pretty simple. Do you want that life to involve a $500,000 mortgage on a bungalow in a coastal city, or a $50,000 place in the Midwest. Will you earn less money in Ohio? Probably. But since your overhead is one tenth the California or New York price you really don’t need the big salary or the stress that comes with it. It’s like moving to the suburbs except you get to live in a great vibrant city instead of a crappy tract house on a cul-de-sac an hour from civilization.

    Cincy 46

    John Sanphillippo lives in San Francisco and blogs about urbanism, adaptation, and resilience at granolashotgun.com. He’s a member of the Congress for New Urbanism, films videos for faircompanies.com, and is a regular contributor to Strongtowns.org. He earns his living by buying, renovating, and renting undervalued properties in places that have good long term prospects. He is a graduate of Rutgers University.

  • Housing Affordability in China

    Finally, there is credible housing affordability data from China. For years, analysts have produced "back of the envelope" anecdotal calculations that have been often as inconsistent as they have been wrong. The Economist has compiled an index of housing affordability in 40 cities, which uses an "average multiple" (average house price divided by average household income) (China Index of Housing Affordability). This is in contrast to the "median multiple," which is the median house price divided by the median household income (used in the Demographia International Housing Affordability Survey and other affordability indexes). The Demographia Survey rates affordability in 9 geographies, including Hong Kong (a special administrative region of China). The average multiple for a metropolitan market is generally similar to the median multiple.

    The Economist Data and Methodology

    The Economist develops its ratio from central government data on house sales and incomes in individual cities. Like the Demographia Survey, The Economist provides estimates for housing affordability from the perspective of the average urban household, as opposed to the "ex-pat" or "luxury" markets that are typically reported by real estate commentators. The Economist also estimates its price to income ratio using an average house size of 100 square meters (approximately 1,075 square feet). This is larger than the average new house size in the United Kingdom, but smaller than those in the United States, Australia, Canada and New Zealand.

    With an overall average multiple of 8.8, China’s housing is less affordable (Figure 1) than all of the nine geographies rated in the Demographia Survey, except for Hong Kong (14.9). Even so, China’s housing affordability has improved from a national average multiple of 11.7 in April of 2010.

    Affordability by City

    It appears that if The Economist had included Hong Kong in its China ranking, it would have been ranked the most unaffordable in the country. Hong Kong houses are much smaller than the Chinese average, at 45 square meters (480 square feet). This would have given Hong Kong, with an unadjusted multiple of 14.9, a house size adjusted multiple of more than 30.

    For years, there have been press reports of astronomic price to income multiples in China. The Economist data indicates that in some cities (Shenzhen, Beijing, Hanghzou and Wenzhou) this has indeed been true. But incomes have risen faster than house prices in recent years, and average multiples above 20 are, for now, a thing of the past.

    Shenzhen, the "instant" megacity next to Hong Kong, is ranked as the least affordable with an average multiple of 19.6. The Economist indicates that this may be the result of demand from Hong Kong residents. Shenzhen had reached an average multiple of nearly 25 in 2010. An even higher average multiple was recorded in Beijing, which reached 27 in 2010. Beijing house prices have fallen substantially, however, dropping to 16.6 in 2014, the second most unaffordable in China.

    China’s other megacities (over 10 million population) have lower average multiples than Shenzhen and Beijing. Shanghai has an average multiple of 12.8 and Guangzhou has an average multiple of 11.4. Tianjin, approximately 100 miles (140 kilometers) from Beijing and China’s newest megacity has an average multiple of 11.2.

    China’s most affordable city is Hohhot, capital of Inner Mongolia (Nei Mongol), with an average multiple of 4.9. Generally, interior cities had better housing affordability than those along the east coast. For example, Changsha (capital of Hunan) has an average multiple of 5.9, Kunming 6.6, while the two leading cities of China’s Red Basin, Chongqing and Chengdu, were somewhat higher (7.1 and 7.4).

    Comparison to Other Demographia Cities

    Yet the multiples for many Chinese cities are no worse than highly unaffordable cities in Australia, New Zealand, Canada, the United States, and the United Kingdom.

    Outside Hong Kong, the other most expensive cities in the Demographia Survey would rank in the second 10 of Chinese cities. Vancouver, with a median multiple of 10.3, is more expensive than all but 12 of the 40 cities rated in China. San Francisco, with a median multiple of 9.3, would rank 15th. Sydney, with a median multiple of 9.0, would rank in a 16th tie with Dalian. San Jose, at 8.7, would rank in a 19th place tie for unaffordability with Wuhan and Ningbo.

    A sampling of cities from China and the Demographia Survey is illustrated in Figure 2.

    Toward an Affordable China

    One of rapidly urbanizing China’s biggest challenges is to improve housing affordability. This is an imperative, with easing of the hukou internal resident permit system and the one-child policy. United Nations projections indicate that China’s urban areas will add another third to their population in the next 25 years, an increase of more than 250 million. China is better housed today than perhaps at any time in its history. But it needs to be still better housed, as internal migrants become permanent urban residents and as rural citizens move to the cities for better lives.

    Wendell Cox is principal of Demographia, an international public policy and demographics firm. He is co-author of the “Demographia International Housing Affordability Survey” and author of “Demographia World Urban Areas” and “War on the Dream: How Anti-Sprawl Policy Threatens the Quality of Life.” He was appointed to three terms on the Los Angeles County Transportation Commission, where he served with the leading city and county leadership as the only non-elected member. He was appointed to the Amtrak Reform Council to fill the unexpired term of Governor Christine Todd Whitman and has served as a visiting professor at the Conservatoire National des Arts et Metiers, a national university in Paris.

    Photo: Jinan