Category: housing

  • Hong Kong’s Decentralizing Commuting Patterns

    Hong Kong is a city of superlatives. Hong Kong has at least twice the population density of any other urban area in the more developed world, at 67,000 per square mile or 25,900 per square kilometer. The Hong Kong skyline is rated the world’s best by both emporis.com (a building database) and diserio.com, which use substantially different criteria. This is an honor that could not have been bestowed on any city outside New York for most of the 20th century.

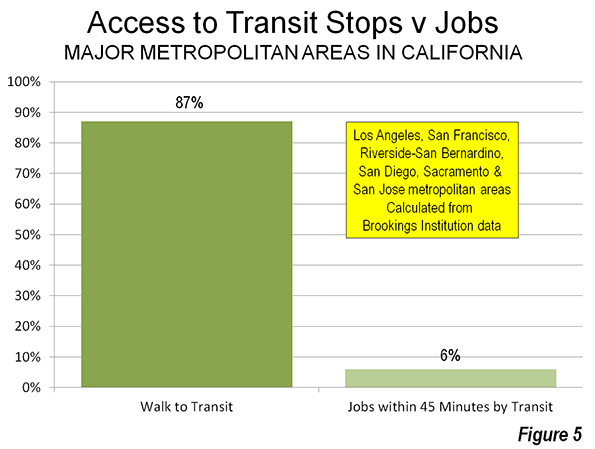
    No world city is better suited to mass transit than Hong Kong. Hong Kong may also be the best served — it has the transit usage levels to prove it. According to Hong Kong 2011 census data, 87 percent of combined transit and car work trip travel in Hong Kong is by transit, though this is a small decline from the 90 percent of 2001. This is the highest transit market share of any high-income world metropolitan area.

    Change in Work Access Patterns

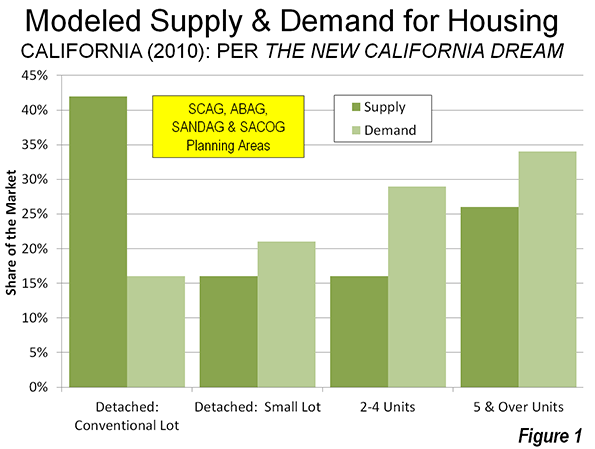
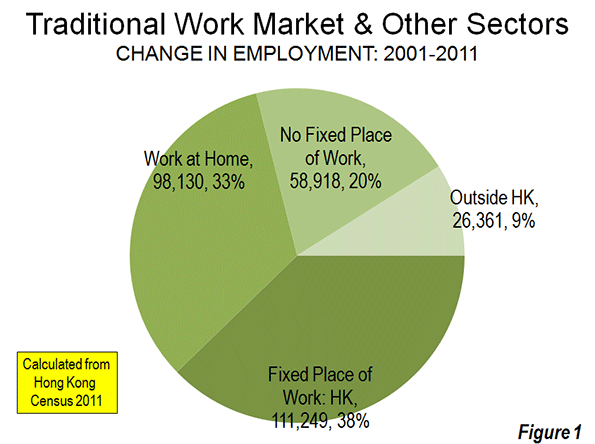
    Between 2001 and 2011 Hong Kong’s employment increased nine percent. Most of these new workers (38 percent), however, did not travel to fixed work locations in Hong Kong. Reflecting continuing decentralization and the impact of information technology, 62 percent of the new workers (1) worked at home, (2) had no fixed place of work or (3) worked outside Hong Kong, especially in Macau and the province of Guangdong, principally in Shenzhen (Figure 1). The 2001 and 2011 census data is summarized in the table below.

    HONG KONG WORK ACCESS: METHODS: 2001 AND 2011
    2001 2011 Change % Change Share: 2001 Share: 2011
    MASS TRANSIT   2,091,552  2,226,818    135,266 6.5% 70.4% 70.1%
    Bus & Coach  1,400,770  1,188,897  (211,873) -15.1% 47.2% 37.4%
       Large Bus   1,118,388     938,467   (179,921) -16.1% 37.7% 29.5%
       Minibus (Public Light)      226,646     217,219      (9,427) -4.2% 7.6% 6.8%
       Residential Coach       55,736       33,211    (22,525) -40.4% 1.9% 1.0%
    Rail     690,782  1,037,921   347,139 50.3% 23.3% 32.7%
       Metro (Original MTR)      495,128     697,475    202,347 40.9% 16.7% 21.9%
       Suburban Rail (Original KCR)      195,654     297,416    101,762 52.0% 6.6% 9.4%
       Light Rail              –         43,030     43,030 NA 0.0% 1.4%
    CAR & TAXI      232,978     333,192    100,214 43.0% 7.8% 10.5%
    WALK      335,859     266,574    (69,285) -20.6% 11.3% 8.4%
    OTHER      123,455       68,509    (54,946) -44.5% 4.2% 2.2%
    TRAVEL TO HK FIXED PLACE OF WORK   2,783,844  2,895,093    111,249 4.0% 93.8% 91.1%
    WORK AT HOME      185,367     283,497     98,130 52.9% 6.2% 8.9%
    FIXED PLACE OF WORK   2,969,211  3,178,590    209,379 7.1% 100.0% 100.0%
    NO FIXED WORK PLACE      188,998     247,916     58,918 31.2%
    WORK IN HONG KONG   3,158,209  3,426,506    268,297 8.5%
    WORK OUTSIDE HONG KONG       94,497     120,858     26,361 27.9%
    WORKING RESIDENTS   3,252,706  3,547,364    294,658 9.1%
    EXHIBIT
    Travel to Work in Hong Kong   2,783,844  2,895,093    111,249 37.8%
    Home, No Fixed Place, Outside HK      468,862     652,271    183,409 62.2%
    TOTAL   3,252,706  3,547,364    294,658 100.0%
    Source: Hong Kong Census, 2001 & 2011
    No Fixed Place of Work: Access method not determined


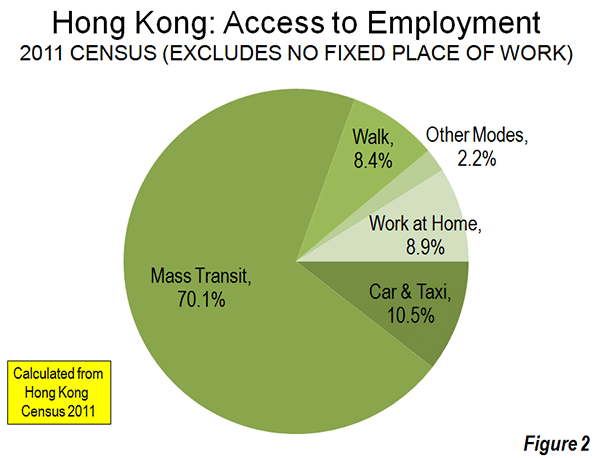
    The Shift from Bus to Rail: Transit’s overall share of work trip access was 70.1 percent in 2011 (all methods). This is a slight decline from the 70.4 percent in 2001. Over the last decade, Hong Kong has substantially expanded its urban rail system, including major improvements such as a new tunnel under Hong Kong Harbor and the new West rail line (former Kowloon Canton Railway) to Yuen Long and Tuen Mun. I wrote a supporting commentary in the Apple Daily (Hong Kong’s largest newspaper) supporting the rail expansion program in 2000.

    The results are apparent in the ridership data. The rail work access market share rose nearly 10 points to 32.7 percent. At the same time, the bus market share dropped nearly 10 points to 37.4 percent. Overall, in a modestly growing labor market, transit added 135,000 new one away work trips.

    Car Commuting Up: Cars and taxis experienced a much larger percentage gain, largely as a result of starting from a much smaller base. The car and taxi work trip access market share rose from 7.8 percent to 10.5 percent. Overall, approximately 100,000 more people commuted one way by car to work in 2011 than in 2001. The median incomes of car and taxi commuters are the highest, at more than twice that of rail and bus users.

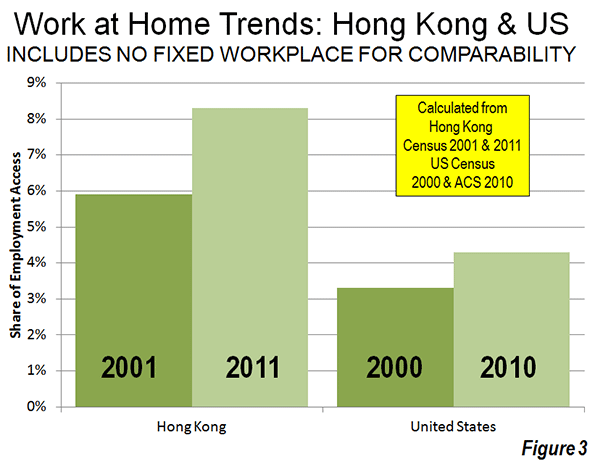
    More Working at Home:Hong Kong’s working at home grew the most of any category, rising 53 percent from 185,000 to 283,000 daily. As a result, working at home now accounts for 8.9 percent of work access, compared to 6.2 percent in 2001. Hong Kong’s reliance on working at home was greater than that of the United States in the early 2000s. Over the last decade Hong Kong’s 53 percent increase in working at home was well above the 41 percent increase in the United States. In Hong Kong, 33 percent of new employment was home-based work between 2001 and 2011. This is greater than in the US, where 20 percent of new jobs involved working at home as the usual mode of access between 2000 and 2010.

    The Decline of Walking: Given Hong Kong’s intensely high densities, it may come as a surprise that there was a huge loss in walking to work. Nearly 70,000 fewer people walked to work in 2011 than in 2001, as the walking market share dropped 21 percent. In 2011, commuters who walked (and those who used light rail) had the lowest incomes. In 2001, more people walked to work than either travelled by car or work at home. By 2011, fewer people walked to work than travel by car or work at home.

    There was also a nearly 55,000 loss in work access by other modes (such as ferries, motorized 2-wheelers and cycling).

    Finally, Hong Kong separately categorizes workers without a fixed place of employment and does not obtain information on how they access work. This category experienced an increase of nearly 60,000 from 2001 to 2011.

    The Decentralization of Hong Kong’s Labor Markets

    The distribution of employment changed little over the 10 years, with Hong Kong Island and Kowloon sectors retaining two-thirds of the jobs. These two areas also have more than one-half of the population.  Even so, the Hong Kong labor market followed the global pattern of decentralization.   More people traveled outside their home areas in 2011 than in 2001. Among resident workers living on Hong Kong Island and in Kowloon, there was an 18 percent increase in working outside these home sectors. Further, the increase in people with no fixed place of work reflects greater mobility and labor force decentralization.

    Jobs-Housing Balance? Not Much

    The high density of jobs and population, its short trip distances, its extraordinary transit system and its high transit market share would seem to make Hong Kong a poster city for the jobs – housing balance ("self containment") that urban planners seem so intent to seek. The data indicates no such thing.

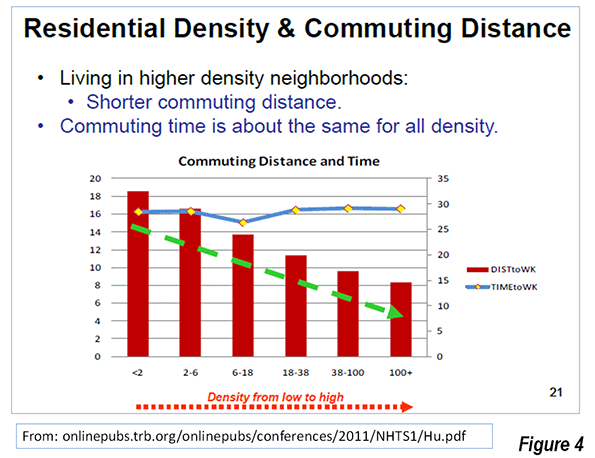
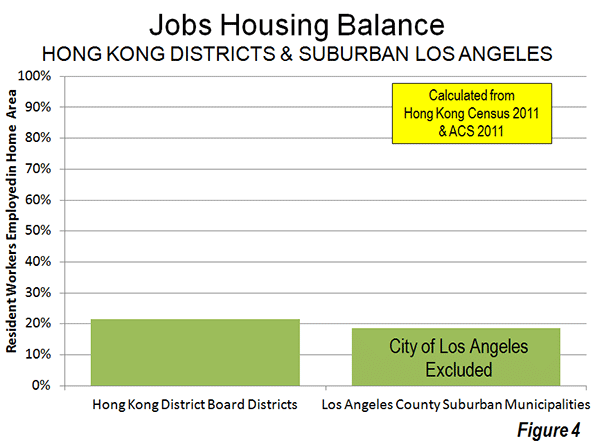
    Hong Kong’s 18 districts illustrate a comparatively low rate of self containment. Only 21.4 percent of working residents are employed in their home districts, including those who work at home. This is only slightly higher than in highly decentralized suburban Los Angeles County, where 18.5 percent of resident workers are employed in their home municipalities. With far lower population and employment densities and a 50 percent smaller geographical size, the suburban municipalities of Los Angeles County (city of Los Angeles excluded, see Note below) nearly equal the local-area jobs-housing balance of the Hong Kong districts (Figure 4).

    This tendency to work away from home districts contributes to Hong Kong’s extraordinarily long average commute times. In 2002, the average work trip was 46 minutes, longer than any high-income world metropolitan area except Tokyo. By comparison, Dallas-Fort Worth, with a similar population and a population density less than 1/20th that of Hong Kong, has an average work trip travel time of 26 minutes. Los Angeles, with its world-class traffic congestion has a work trip travel time of 27 minutes, principally because its automobile dominant commuting is much faster than Hong Kong’s world class, rail based transit system.

    These data, both in Hong Kong and Los Angeles, show that, within a metropolitan area (labor market),  people will tend to seek the employment that best meets their needs, just as employers will hire the people best suited to theirs. Within a labor market, this can be anywhere, subject to the preferences of people and employers, not of planners. This is the basis of former World Bank principal planner Alain Bertaud’s caution that a city’s economic efficiency requires … avoiding any spatial fragmentation of labor markets.

    The Mistake of Trying to Emulate the Unique

    It is a mistake to think that urban planning can emulate Hong Kong. Besides its superlatives, Hong Kong did not become so dense as a result of urban planning or the unfettered preferences of people (market forces). Hong Kong’s uniqueness is the result of unique geo-political influences. This history forced an unprecedented accommodation of millions in a small space, especially in the third quarter of the 20th century when it stood as a capitalist island in the midst of a Communist sea.

    Hong Kong is unique and will be for a long time.

    Note: The city Los Angeles has a very high jobs-housing balance (61 percent). However, this is largely due to its huge geographic size (more than 40 times the average suburban jurisdiction).

    Wendell Cox is a Visiting Professor, Conservatoire National des Arts et Metiers, Paris and the author of “War on the Dream: How Anti-Sprawl Policy Threatens the Quality of Life.”

    —-

    Photo: West Rail Line, Tin Shui Wai Station bus interchange, Yuen Long (by author)

  • Our Dysfunctional Housing Market

    This is the story of how elites prospered while killing the singular trend that built America, and all that you proles got in return was a dysfunctional housing market. In a reversal of more than 100 years of American history, the unique force that built the United States and the wealth of its inhabitants – geographic convergence – has been stopped. Based on labor mobility and the income convergence it engendered, geographic convergence was our great equalizer, our economy’s ace in the hole: even in the worst of times people could always move from where they were to somewhere else to improve their prospects. Well, they can’t anymore, and the reason is housing.

    Who killed geographic and income convergence? Well, we wealthy, older, property-rich elites in desirable zip codes did. Call us the new landed gentry if you like. I would like to say we’re really, really, sorry but I don’t see us doing anything to correct it. It wasn’t on purpose; it was an inadvertent, unintended consequence of well-intentioned laws and regulations concerning land use, zoning, building codes, permits, property taxes and the like. We didn’t undertake those restrictions on building and development specifically to exclude you people (wait – did I really just say “you people?”). Why heck, we’re concerned as all get-out about rising inequality and income disparity, just not in our own neighborhoods, okay? And besides, residential segregation is voluntary, isn’t it? Didn’t you read Bill Bishop’s “The Big Sort”? We all naturally prefer to cluster with the like-minded and socioeconomically similar, don’t we?

    We used to have a housing market that consisted of buyers, sellers, and the supply of homes for sale. Today, the housing market is artificial and even fraudulent — it’s anything but a free market in which inventory is allowed to clear. Millions have defaulted, and millions more are in the pipeline to do so. Because of this massive shadow inventory of underwater and foreclosed homes that is only slowly being leaked out to market, there are millions of people who can’t sell the houses where they live, millions who can’t buy houses where they want to live, and millions who may never get a foot on the housing ladder at all.

    The government response — bless ’em, they do represent us — is to do everything possible to keep housing prices inflated. Interest rates are kept absurdly low (if you can qualify, and we do!), and the federal government now guarantees 90% of all mortgage loans (defaults and delinquencies are staggering, but so what?). Inventory is being constrained by banks which have not only been bailed out, but given the ability to rewrite accounting rules, for example, suspending mark-to-market and taking years to move on non-performing loans. Some of your neighbors haven’t made a mortgage payment in years but have yet to receive a notice of default. The result? In some markets, housing mania has returned. Flippers and non-resident investors are flooding in and crowding out people who actually want to buy homes in which to live. We’re inflating the bubble again. Thank you so much — don’t mind the feudalism!

    All of this allows us to continue to buy expensive homes with low down payments and monthly payments (relative to income, of course, and ours is larger than yours), max out the tax deduction on the back-end, and escape capital gains taxes on the first $500,000 of profit on the sale of a home. Sweet. I guess they’re trying to goose consumption, but with your flat household incomes, it doesn’t seem to be working.

    How We Got Here – In a recent working paper two Harvard economists, Peter Ganong and Daniel Shoag, explain how geographic and income convergence started to slow in the 1960s, when rich people in rich places started constraining land use through regulation. This limited the housing supply in those places, which forced prices up, and started to squeeze out those with lower incomes.

    Housing prices have always been more expensive in high-income places, but the difference now is unbridgeable. The result is that people can’t get on the upward mobility ladder, thus increasing the inequality that these same elites bemoan. But they don’t see or understand the connection between this income divergence and their own regulations and restrictions.

    What to Do? – I recently had the opportunity to contribute to a symposium hosted by CORE (National Community Renaissance), one of the largest nonprofit affordable housing development corporations in the United States. As a catalyst we used an article by Joel Kotkin and Steve PonTell, CORE’s President and CEO, “Is the Dream Dead? Housing’s Next Challenge.” The authors note that homeownership is at a 15-year low, despite the fact that owning a home is now cheaper than renting in most of the top 100 metro areas, but that lower housing prices have not done much to improve the conditions for lower-income people. Indeed, as people who would normally own housing become renters, price pressure has actually worsened for renters.

    Housing has traditionally been the main way Americans accumulated assets, created wealth, raised families, became part of communities, and contributed to social stability. But housing is only one factor squeezing lower and middle income Americans. The real culprit has been stagnant and even declining incomes. The authors conclude, as I read it, that if you want to champion those less well-off, the way to do it is with solutions that are less government-centric: not to give them housing and income, but to take away the barriers to housing, allow the construction of new, market-friendly housing, and boost wealth creation through economic development.

    What If Housing Declines For A Generation? – A strong case can be made that the fundamental supports of the housing market – demographics, employment, creditworthiness and income – will not recover for a generation, and that housing has lost its status as the foundation of middle class wealth, not for a generation, but for the long term.

    Charles Hugh Smith has written that rising rates of home-ownership require five conditions: favorable demographics, rising household formation rates, a large cohort of creditworthy potential buyers, an economy that generates rising incomes to support home-ownership, and an unshakable belief that owning a house is a favorable and secure investment that will rise in value in the decades ahead.

    If the first four conditions have eroded, then the belief in the permanence of a rising housing market will also erode. And they all have in fact eroded:

    • Today’s demographics are not favorable to housing on a number of fronts.
    • Household formation is in a long-term decline.
    • Labor’s share of the national income has plummeted to historic lows, and
      income has declined, especially for young workers.

    • Part-time jobs and temp jobs do not generate enough stable income to support a mortgage. It’s easy to qualify people for a mortgage. The hard part is making sure that they will have enough income and faith to service the mortgage for the next 30 years.

    Arnold King of George Mason University has argued that home ownership subsidies have imposed costs on the economy and society that are large and clear, while the benefits of such subsidies are, at best, small and vague. His conclusion: Who needs home ownership?

    I’m more worried about Smith’s conclusion, which is an idea that few are willing to entertain: the possibility that housing is no longer the foundation of middle class wealth, and that its decline is structural, not cyclical. What if he’s right?

    Dr. Roger Selbert is a trend analyst, researcher, writer and speaker. Growth Strategies is his newsletter on economic, social and demographic trends. Roger is economic analyst, North American representative and Principal for the US Consumer Demand Index, a monthly survey of American households’ buying intentions.

    Flickr photo by Sean Dreilinger: For Sale signs posted in Lake Oswego, Oregon

  • Millennials Ready to Play Key Role in Housing Market Recovery

    Recent data from a survey commissioned by Better Homes and Garden Real Estate (BHGRE) suggests a pent up desire among 18-35 year olds to own a home of their own that could easily fuel a real estate boom for at least the rest of this decade. 

    In contrast to predictions from some futurists that the Millennial generation, born 1982-2003, will be content to be lifelong renters, BHGRE’s survey found home ownership still ranked as young Americans’ most important definition of personal success.  Overall, three-fourths of those surveyed named home ownership as an indicator of having succeeded financially, more than seven times the number who named other major expenditures such as taking extravagant vacations, buying an expensive car, or owning designer clothing. Even among those living in the Northeast or in cities, seventy percent identified home ownership as the best indicator of having made it financially. This is fully in line with earlier studies by Pew Research that found home ownership was among the top three priorities in life for members of the Millennial generation.

    Unlike comments often made about this generation by some of their elders, most Millennials didn’t express sentiments suggesting that they feel entitled to be simply handed this badge of success.  Seventy percent of those in BHGRE’s survey said they needed to possess the skills to own a home; only thirty percent said they “deserved it.” Respondents also made it clear they were prepared to sacrifice to achieve their dream of home ownership.  About sixty percent were willing to eat out less and/or only spend on necessities to save the money needed to buy a home. These sentiments were most strongly expressed by those who had grown up in a home  owned by their parents.  In addition, forty percent were willing to take a second job. And, almost a quarter  of the generation accused of  “failing  to launch”  were prepared to live with their parents for a couple of years to save the money they would need to own a piece of the American Dream.  

    The collapse of the housing market that triggered the Great Recession also has made Millennials sophisticated, knowledgeable consumers when making decisions about how and when to purchase a home.  Rather than thinking they should buy a home as soon as they get married or qualify for a mortgage, seventy percent of BHGRE’s respondents said the time to buy a house is when a person can “afford it and maintain their lifestyle.” 

    Millennials are careful consumers, as befits a group shaped by the most lengthy economic downturn in decades. Sixty-one percent suggested they would want to have a secure job before buying a house and more than half said people should wait until they had saved enough for the down payment before making such a purchase.  When asked to indicate the factors they would research in determining whether to buy a home, financial considerations were cited by a majority of the respondents.

    They understand the power of money. Interest rates, home prices and how those two factors impacted their ability to secure a mortgage, all ranked much higher in importance than the type of neighborhood a house was in, school district ratings or foreclosure rates.  With the median sales price of both new and existing homes up almost five percent this year, Millennials are likely to jump into the market soon before it becomes too expensive for them to do so.      

    These findings suggest the current policies of the Federal Reserve and its Chairman, Ben Bernanke to keep interest rates low in order to stimulate this key part of the U.S. economy are right on target. If home builders and sellers can tailor their offerings to these technologically sophisticated, family-oriented potential buyers, Millennials could well play an important role in reinvigorating the nation’s housing market, further spurring the nation’s recovery from the Great Recession.

    Morley Winograd and Michael D. Hais are co-authors of the newly published Millennial Momentum: How a New Generation is Remaking America and Millennial Makeover: MySpace, YouTube, and the Future of American Politics and fellows of NDN and the New Policy Institute.

    Homes image by BigStock.

  • Single Family Houses Sales Up, Builders Register Confidence

    A continuing increase in new single-family house sales has fueled the substantial increase in the NAHB/Wells Fargo Housing Market Index (HMI) to 46 in November. This indicates that nearly one half of surveyed home builders are positive about future sales of single family houses. This is a strong increase from the HMI of 41 in October. The HMI had reached its low point in the midst of the housing bus in January 2009 at 8 and is now higher than at any point in more than six years.

    NAHB reported that national single-family house sales in September were nearly 30% above the September 2011 rate, though remained approximately one-half the 2007 rate.

    The National Association of Realtors also reported that single family houses continued to dominate existing house sales, garnering approximately 88% of sales in October.

    The strengthening of the single-family housing market Is to be expected as the economy improves. These developments are further indication that the claimed change in housing preferences from single-family to multifamily is not occurring. In a related development, the latest available data indicates a preference in California for single-family housing on conventional sized lots, which is described in A Housing Preference Sea Change: Not in California.

  • A Housing Preference Sea Change? Not in California

    For some time, many in the urban planning community have been proclaiming a “sea-change” in household preferences away from suburban housing in the United States.

    Perhaps no one is more identified with the "sea-change" thesis than Arthur C. Nelson, Presidential Professor, City & Metropolitan Planning, University of Utah. Professor Nelson has provided detailed modeled market estimates for California in a paper published by the Urban Land Institute, entitled The New California Dream: How Demographic and Economic Trends May Shape the Housing Market: A Land Use Scenario for 2020 and 2035 (He had made generally similar points in a Journal of the American Planning Association article in 2006).

    Professor Nelson says that the supply of detached housing on what he defines as conventional sized lots (more than 1/8 acre) is far greater than the demand in California (Note 1). He further finds that the demand of detached housing on smaller lots is far greater than the supply. Professor Nelson’s conclusions are principally modeled from stated preference surveys, which can mislead if people act differently when they make choices in the real world.

    The Modeled Demand Estimates

    Nelson models the demand for housing types in California’s largest four planning regions (Southern California Association of Governments for the Los Angeles area, and the Bay Area Association of Governments for the San Francisco-San Jose area, the San Diego Association of Governments and the Sacramento Area Council of Governments). He estimates 2010 both supply and demand. His demand estimates rely strongly on data from three early 2000s stated preference surveys conducted by the Public Policy Institute of California (PPIC).

    • Nelson’s data indicates a strong preference for multi-family housing, which he places at 62% of demand in 2010, compared to the 2000 supply of 42%. Thus, the demand for multi-family housing is suggested to be one half above the supply.
    • The most stunning conclusion, however, is an over-supply of detached housing on conventional lots that Nelson estimates. Compared to a 2000 supply of 42% of the market, Nelson estimates the demand to be only 16%. This would indicate the supply of such housing to be more than 2.5 times the demand as is indicated in Figure 1.

    Nelson’s findings on conventional lot detached housing have obtained the most attention. He surmises that virtually all of the demand over the next 25 years can be met by the existing stock of conventional lot detached housing. This is music to the ears of many urban planners, who have for decades demonized  the suburbanization that has been preferred by the overwhelming majority of Californians (and Americans, and people elsewhere in the world where they can afford them).

    Actual Demand: Revealed Preferences: 2000-2008

    To perform a similar analysis, we used revealed preference data: the actual change in housing by type from the 2000 Census data to the latest American Community Survey (ACS) 2006-2010 data at the census tract level (Note 2).  

    In contrast to Professor Nelson’s estimates, the demand data indicates a strong continuing preference among Californians for detached housing on conventional lots. From 2000 to 2008 (the middle year for the 2006-2010 data), 51 percent of the new occupied housing in the four planning areas is estimated to have been detached on conventional lots (Figure 2). This is more than three times the 16% demand estimate in Professor Nelson’s data. In fact, the actual demand was higher than the 2000 supply (42%), indicating that the demand for detached houses on conventional lots has increased.

    If there is a sea change, it would appear to be in multi-family housing. In contrast with the 62% share for multi-family dwellings modeled by Nelson, the actual demand indicated in the census tract data was two-thirds less, at 19% (Figure 3), well below the supply of 43 percent in 2000. This suggests a tanking of demand for multi-family housing, even as builders, in California and elsewhere, put more product on the market.

    Why Accounts for the Difference

    Various factors appear likely to contribute to the difference between the modeled demand and the actual demand.

    Smaller Lots and Higher Density Do Not Mean Shorter Commutes: The PPIC survey questions implied a connection between larger lots (lower density) and longer commutes. This is the broadly shared perception, but in reality houses on smaller lots (necessarily in higher density neighborhoods) do not mean shorter commutes. This is illustrated in a chart by Southern California Association of Governments (SCAG) researchers on page 62 of The New California Dream. In the original SCAG document, the authors note that "commuting time is about the same for all density" (Figure 4).  This is not surprising, since higher densities are associated with more intense traffic congestion and with greater transit use, both of which lengthen commutes (Note 3).

    The "higher density means shorter commute" myth is rooted in the obsolete mono-centric conception of the city. Almost all US urban areas have become poly-centric with job locations highly-dispersed, as jobs have followed people to the suburbs. Gordon and Lee (Note 4) have shown that work trip travel times in the United States are shorter to dispersed employment locations than to central business districts or secondary business centers (such as "Edge Cities").  

    Invalid Perceptions of Transit Mobility: Professor Nelson also stresses stated preference responses showing that many people would prefer to live near transit service. All things being equal, who wouldn’t?

    But all things are not equal. Living near transit does not mean practical transit access to most of the urban area. In most cases, only a car can provide that. Transit systems are necessarily focused on downtown areas (central business districts), which contain, on average, only 8% of employment in the four planning regions. , Travel to other destinations is usually inconvenient, because of time-consuming transfers, or   not available at all.

    A Brookings Institution report indicated that 87 percent of people in California’s major metropolitan areas (Los Angeles, San Francisco, Riverside-San Bernardino, San Diego and Sacramento) live within walking distance of transit. Yet, the average employee can reach only 6% of the jobs in their respective metropolitan area in 45 minutes (Figure 5). By contrast, the average work trip travel time ranges from 25 minutes to under 30 minutes in the four planning regions .

    Households thinking about a move to higher density could have been, upon more serious examination, deterred by transit’s severe mobility limitations. 

    Data Insufficiently Robust for the Modeling: There is also the potential that the PPIC surveys, with their general questions, were not of sufficient robustness to support Professor Nelson’s assertions. For example, PPIC did not define the size of small lots.

    Planning and Reality

    If households were so eager to move from detached houses on conventional lots to smaller lots, 2000 to 2008 would have been the ideal time. The mortgage industry was literally falling over itself to fund home purchases. Urban core wannabes could have flooded the market pursuing their smaller lot "stated preferences." The actual, revealed preference data says they did not, which is also indicated by the continuing strength of suburban growth relative to central city growth (Note 5).

    Thus, the modeled demand estimates in The New California Dream appear to be at substantial odds with the actual demand.This is much more than an academic issue. The conclusions of The New California Dream have achieved the status of sacred text in the canon of urban planning and are mouthed unquestioningly by organizations like the Urban Land Institute.

    Worse, demand estimates from The New California Dream are being relied upon in regional transportation plans being developed by California’s metropolitan planning organizations (MPOs). This is particularly risky because these same MPOs have been granted greater power over housing under California’s Senate Bill 375, goaded on by a sue-happy state Attorney General’s office. The attempt by MPOs to impose their housing plans and regulations on consumers could well backfire, for investors in condominium and multifamily housing.  This would not be a first time that   developers followed urban planning illusions like lemmings over a cliff, to which huge losses in the last decade attest. The more destructive effects, however, are likely to be paid by households and the economies of California’s metropolitan areas.

    ———

    Note 1: More than 70% of the detached housing stock was on conventional lots in 2000.

    Note 2: There is no census tract data on detached house lot size. We scaled the detached housing data from the 2000 census to match Professor Nelson’s distribution of detached housing supply by lot size, using population density. Nelson’s method and ours were sufficiently similar that the results should have been roughly comparable. As the text indicates, they were not.

    Note 3: In each of the three PPIC surveys, respondents are asked to choose between housing alternatives that are high in the questions to commute "lengths." From the description and survey instruments in the PPIC reports, there is no indication that respondents were given any idea what commute "length" means. There are two way to judge commute "length." One is distance or miles, while the other is time. Based upon the PPIC survey instrument, it cannot be known which definition was perceived by the respondents.

    Even so, it seems more likely that the term "commute length" was perceived by respondents in time rather than in distance by respondents. Each day, people have only so many hours and minutes available. However, distance is not so constrained, depending upon the speed of the commute. Further, the extensive research on commuting often refers to "travel budgets," which are expressed in time, not distance.

    Note 4: Reference: Gordon, P. and B. Lee (2012), "Spatial Structure and Travel: Trends in Commuting and Non-Commuting Travels in US Metropolitan Areas," draft chapter for the International Handbook on Transport and Development edited by Robin Hickman, David Bonilla, Moshe Givoni and David Banister.

    Note 5: The most recent year (2010-2011), for which the Census Bureau had issued invalid municipal population estimates, indicated a continued the trend toward suburban rather than urban core growth, as has been shown by Trulia Chief Economist Jed Kolko (see: Even After the Housing Bust, Americans Still Love the Suburbs).

    =======

    Photograph: Suburban San Diego

    Wendell Cox is a Visiting Professor, Conservatoire National des Arts et Metiers, Paris and the author of “War on the Dream: How Anti-Sprawl Policy Threatens the Quality of Life.”

  • What Stifles Good Housing Development?

    We can’t afford outmoded attitudes in housing development anymore – not as businesses, not as citizens, and certainly not as development professionals. As development consultants, we’re often asked to provide detailed input on project design and the marketing of developments throughout the United States and Canada. We usually work with a local team of engineering consultants that provides construction drawings and serves as an intermediary for the project with local governments. We have concluded that the choice of selecting the engineering consultant is one of the pivotal issues for the success of a development. The developer has to be the one to hold the engineers accountable. Otherwise, all design will continue to be done to minimum standards instead of excellence.

    Problems with the consulting engineer generally fall into two broad groups: complacency and undisclosed conflicts of interest. To illustrate, we’ll look at two recent examples from projects owned by clients of Rick Harrison Site Design Studio.

    The first involves a small proposed neighborhood in Texas. The initial design was drafted before either the site boundaries or floodplain were accurately surveyed, and yielded a total of 35 lots of 0.6 acres or more. Rick prepared an initial revision of the original design, resulting in a more aesthetically pleasing and efficient neighborhood, while maintaining the 0.6 acre minimum lot size. Accurate boundary lines, contours and floodplain were eventually furnished to create a precision plat for submittal. The developer requested that Rick update the revised design, and indicated that he was willing to sacrifice one of the lots in order to allow a more spacious entrance.

    While preparing the precision plat Rick realized that he didn’t know why the lots were at least 0.6 acres instead of the more common 0.5 acres on lots without city sewer. In two rounds of questioning, the consulting engineer indicated that the minimum lot size was 0.6 acres, or 26,000 ft². The area of 6/10th of an acre is actually 26,136 ft², so Rick questioned the engineer again. This time, the engineer explained that the minimum lot size was actually 0.5 acres, but his firm had developed a “rule of thumb” that 26,000 ft² was the 0.5 acre lot net of easement areas. However, in the specific case of this development the only easement required was a 12’-wide utility easement along the front lot line. The extra 0.1 acres per lot was a “fudge factor,” developed over time to compensate for the well-known difficulty in computing precise lot sizing using existing CAD software.

    The “land surface based” technology Rick used to create the revised design requires no additional time to obtain precision areas, so he was able to easily design each lot to meet the actual 21,780 ft² (half acre) minimum exclusive of the 12’ easement. The new design eliminated the fudge factor, and yielded 37 lots, including the more open entrance area (three more than expected). Furthermore, reductions were made to the length of street..

    “Fudge factors” are rules of thumb intended to make the engineer’s work easier, and to provide enough margin in the plans to account for omissions or miscalculations. The problem with fudge factors is that they adversely impact the profitability of their clients’ projects. The chart below demonstrates the differences:


    Initial Plan

    Revised Plan

    Difference

    Lot size

    0.6 acres (minimum)

    0.5 acres

    At least 4,356 ft.² per lot

    Number of lots

    34

    37

    3

    Lot value

    $75,000

    $75,000


    Gross sales

    $2,550,000

    $2,775,000

    $225,000

    Pavement area

    89,479 ft²

    81,509 ft²

    7,970 ft²

    Estimated cost

    $447,400

    $407,550

    $39,850

    Eliminating an imprecise fudge factor would yield a $225,000 increase in gross sales. Since the only increase in costs were per lot consulting fees, almost all of the gross revenue would drop straight to the bottom line. In addition, the community would benefit from a more attractive neighborhood with substantially less street pavement maintained in perpetuity, and a higher property tax base. If the developer was unwilling to sacrifice profits, the cost of each lot would have had to increase by $6,600 to the consumer.

    The second example concerns another proposed residential development, this one in North Dakota, in a city prone to severe flooding. As most people know, paved areas do not absorb rainfall, so it would seem logical that the more pavement area in a new development here, the bigger the potential for runoff, which leads to more flooding. In addition, the wider the streets, the more surface area the city has to snowplow and maintain. All these issues – the snowplowing, the road maintenance and the increased water runoff – are burdens to current and future taxpayers, with no discernible benefits to offset the burden. So imagine Rick’s surprise when the consulting engineer refused to even submit a plan for 50-foot-wide rights-of-way with 28-foot-wide street sections, instead of the 66-foot-wide rights-of-way with 37-foot-wide street sections, as specified by existing city regulations.

    To understand the issue, look at the origin of the standard street width requirement. Centuries ago, roads were unpaved, and were built with wide ditches to handle drainage alongside them. The 66 foot length reflected a land surveyor’s chain, developed in the year 1620 by a British clergyman interested in developing a system that would use easily available tools to survey land in the British countryside. His system caught on, and was brought to the New World by British immigrants and used for hundreds of years. Perhaps as recently as 100 years ago it made sense to use a single surveyors’ chain as the width of community streets, and so many towns did so. Today, most cities have eliminated drainage ditches in modern subdivisions, replacing them with storm sewers and more efficient design. These changes have allowed narrower street and pavement widths, with positive cost and environmental impacts.

    So — the minimum street right-of-way in this modern North Dakota city is the result of a decision to make roads 66 feet wide, due to the fact that 400 years ago an English clergyman connected a hundred links that were 6 1/2 inch long to make a convenient, 66 foot long “chain”. To our knowledge, there is no other reason.

    Given that surrounding cities have adopted modern standards, and that the logic behind narrower streets is solid, Rick could have presented a compelling case. But the engineer refused to even make the proposal. Why not propose a common sense solution? Complacency? Perhaps. The desire to comply with every regulation to avoid conflict? More likely. Are the engineers fees based upon the percentage of construction cost, with wider streets guaranteeing higher fees? Also likely.

    Unsustainable? Absolutely.

    In the first example, outmoded rules of thumb related to inadequate CAD technology would have cost Rick’s client at least $250,000, and would have burdened the local county government with a significantly diminished potential property tax base. In the second example, the engineer’s lack of concern for the long-term benefit of his client (with whom he has a contractual or fiduciary relationship), and to the public (to whom he has a professional responsibility), has burdened the community with exaggerated flooding problems and approximately 33% more pavement to be snow plowed and maintained for as long as the community exists.

    We can’t keep fudging to hide poor practices. If we are ever to achieve a more sustainable world and create better communities and housing products, we simply cannot accept mediocre design, technology and attitude.

    Rick Harrison is President of Rick Harrison Site Design Studio and Neighborhood Innovations, LLC. He is author of Prefurbia: Reinventing The Suburbs From Disdainable To Sustainable and creator of Performance Planning System. His websites are rhsdplanning.com and pps-vr.com. Skip Preble, MAI, CCIM is a real estate analyst and land development consultant specializing in market analysis, feasibility studies, project value optimization and market value opinions. He can be reached through his website, landanlytics.com.

    Flickr Photo by Billy Hunt: “This is from my photo essay observing the course of development in Charlottesville, Virginia“.

  • The Evolving Urban Form: Addis Abeba

    Addis Abeba is the capital of Ethiopia and calls itself the "diplomatic capital" of Africa, by virtue of the fact that the African Union is located here. Yet Ethiopia is still one of the most rural nations in both Africa and the world. Ethiopia also appears to be among the most tolerant. Various forms of Christianity claim account for approximately 65 percent of the population, with the Ethiopian Orthodox Church (Coptic) holding the dominant share. At the same time there is a sizable Muslim minority, at more than 30 percent of the population. Ethiopia has been spared the interfaith violence that has occurred in some other countries where there are large religious minorities.

    Growing Urban Area

    Addis Abeba is among the fastest growing urban areas in the world. Since 1970, the population has increased by nearly three times (Figure 1). However, the spatial expansion of the urban area has been much greater. The earliest available Google Earth satellite photos (1973) indicate that the urban land area (continuous urban development) has expanded over 12 times. Thus, the urban spatial expansion has been at least four times that of the population over the since the early 1970s (Figures 2 and 3).

    Since 1973, the urban population density of Addis Abeba has declined almost three quarters, from approximately 75,000 per square mile or 29,000 per square kilometer to 20,000 per square mile or 8,000 per square kilometer. Addis Abeba represents yet another example of the counter-intuitive reality of growing urban areas simultaneously becoming less dense, because population growth occurs the generally less  dense periphery in an organic city. It is not unusual for urban analysts to (wrongly) assume the opposite.

    One of the results of the spatial expansion is a significantly better lifestyle for residents of Addis Abeba, consistent with the view of Professor Shlomo Angel, who decries attempts to constrain cities within artificial boundaries (compact city policies) because they can deny people both a adequate housing and a decent standard of living.

    The Economy

    Ethiopia is one of the poorest nations on earth, with a 2010 gross domestic product-purchasing power parity (GDP-PPP) per capita of just above $1,000. This places it 170th out of 183 geographical areas according to the International Monetary Fund. By comparison, the GDP-PPP of the United States was $47,000 and Singapore $57,000.

    Ethiopia’s low income reflects  Ethiopia’s relativey low rate of urbanization. With 17 percent of the population in rural areas (outside urban areas), urbanization is concentrated in Addis Abeba (3.1 million), which is the only urban area in the nation with more than 300,000 population. Ethiopia can expect to experience a strong rate of urbanization in the decades to come, as people flock to the cities to seek better standards of living. By 2030, the total number of urban residents is projected by the United Nations to rise to 28.4 million from 13.9 million in 2010.

    Urbanization has its problems, but also economic advantages. The GDP-PPP in Addis Abeba, according to a Price-Waterhouse-Coopers estimate, is up to six times higher than that of the rest of the nation. Assuming that this ratio held to 2010, The GDP-PPP per capita of Addis Abeba would be $6,000 or more.

    Moreover, Price-Waterhouse-Coopers predicted that Addis Abeba would experience the 5th greatest economic growth to 2025, out of 151 urban areas. This would result in growth greater than that of Shanghai and Beijing. The four predicted to grow faster are the two large Viet Nam urban areas (Hanoi and Ho Chi Minh) and two in China (Guangzhou in the Pearl River Delta and Changchun in Manchuria).

    The Urban Core

    As would be expected in a developing world urban area, there is a large urban core with mixture of government and private buildings, literally surrounded by lower income, principally informal housing. With this predominant informal housing, the population density of the urban core is by far the highest in Addis Abeba (See Photo: Informal Housing in the Urban Core: Parliament and Holy Trinity Dome in the Distance).


    Photo: Informal Housing in the Urban Core: Parliament and Holy Trinity Dome in Distance

    Major government offices and cultural facilities are in this area, such as the Parliament, the prime minister’s residence, museums, the residence of the primate of the Ethiopian Orthodox Church (Coptic), the most important cathedral, Holy Trinity, in which former Ethiopian leader Haile Selassie  is buried, as well as the Catholic Cathedral and the largest Mosques.

    The New Addis Abeba

    There’s been a huge expansion of the periphery around Addis Abeba. Extensive tours around the urban area provide evidence of relative prosperity. It appears that Addis Abeba is rebuilding itself around its urban core. There is major construction in three directions from the urban core.

    The greatest activity is in the Bole District, which includes Bole International Airport, to the south of the urban core. There is a substantial amount of new commercial high-rise construction within a few kilometers to the north of the airport, along two major arterials and in between (Photo: Bole Corridor Development). There are also a large number of large, private condominium buildings. The Bole Corridor represents an edge city, in the sense defined by Joel Garreau in his seminal book Edge Cities  two decades ago. This is also the location of the largest Ethiopian Orthodox Church (see top photo) in the country.


    Photo: Bole Corridor Development

    An eastern corridor stretches for 6 miles/10 kilometers from what is locally called the "Chinese Road," a ring road built largely with the support of the Chinese government. There are many new commercial buildings, government buildings, public and private condominiums, and at the edges, large new detached houses (See photo: Detached Housing in the Eastern Corridor).


    Photo: Detached Housing in the Eastern Corridor

    To the west, principally, the southwest, is a new residential neighborhood composed principally of condominiums, generally up to five floors (Photo: Southwest Residential Area).


    Photo: Southwest Residential Area

    China in Africa

    Chinese financial assistance is not limited to the ring road. Much of the funding for the impressive new African Union headquarters (photo) was provided by the Chinese government. Further, a new light rail line will be largely financed by China. At the same time, the massive construction evident in the newer, outlying districts of Addis Abeba resemble (at least in a modest way) the urban development that has occurred in China over the past few decades.


    Photo: African Union Headquarters

    Conclusion

    The economic progress evident in Addis Abeba is encouraging. The government policies  are allowing the city to expand naturally as it grows, which facilitates  better lives for its citizens. It can only be hoped that the day will come that people in developing world urban areas, such as Addis Abeba, will enjoy the high standards of living that have been achieved in the developed world.

    Photo: Holy of Holies, Bole Mehani Alem Church (Ethiopian Orthodox Churches all have a replica of the “Ark of the Covenant,” behind a screen, which is referred to as the “holy of holies”). According to the Ethiopian Coptic tradition, the Ark of the Covenant, which tradition indicates, contained the tablets on which the Ten Commandments were written. The Ark was maintained in the holy of holies in the Jewish temple. The Ethiopian tradition holds that the Ark was taken to Ethiopia and is now kept at a chapel at a church in Axum, which is 600 miles/1,000 kilometers north of Addis Abeba.

    Wendell Cox is a Visiting Professor, Conservatoire National des Arts et Metiers, Paris and the author of “War on the Dream: How Anti-Sprawl Policy Threatens the Quality of Life.”

  • Postwar Prefabs: Britain’s Factory-Made Palaces

    After the financial crisis of 2008, much of Great Britain’s construction industry capacity was wiped out. Now, in 2012, there is much fear that the “traditional” construction industry is too weak to rapidly increase the rate of housing production, even if the administrative planning system wanted it to. Which it doesn’t. Yet there is also no suggestion by Local Authorities or the national government that the present lack of construction capacity could be addressed by the manufacture of housing by new businesses in other industrial sectors — the creation of factory made homes — as was done post-World War II.

    Between 1944 and 1949 the British Government organised the production and installation of two bedroom prefabricated bungalows as emergency housing. The Prefabs were a popular success, but have never been repeated.

    As the Second World War was concluding, Clement Attlee, the Labour Party’s Deputy Prime Minister in Winston Churchill’s wartime coalition Government, told the House of Commons,
    ‘The Government have reviewed the potential building capacity of the country, and have come to the conclusion that it will not be possible, for some years, to build enough permanent houses to meet the urgent demands for separate homes. We shall therefore need, in addition, emergency factory-made houses.’

    A budget of £150,000,000 was sanctioned in the Housing (Temporary Accommodation) Act, 1944, and increased to £220,000,000 by 1947. By the time the financial account was closed in 1957 a total of 156,623 prefabricated bungalows of a few types were built on Local Authority Land for £207,309,000. They were all rented out by 1949, popular as suburban “prefabs”.

    Many of of the Prefabs were manufactured by the aircraft industry using aluminium as the production of war-planes wound down. Others were constructed with steel and timber. The aluminium bungalows were road-delivered as sectional buildings. All the Prefabs were built round a central core of a kitchen, toilet and bathroom. The fitted kitchen had a fridge and cooker, running hot water, and a wash (laundry) boiler There was built-in storage, electric lighting, and sockets. For many residents the Prefabs offered a huge advance in their quality of life.

    They were supposed to last 10 to 15 years, but many were so popular that their residents successfully campaigned to save them from demolition. They proved as permanent as any other housing.

    A few of the Prefabs still exist today, but they are gradually being cleared by Local Authorities keen to arrange the redevelopment of the often well-located land that can now be occupied with far denser housing, mostly for a lucrative sale. In today’s model, space inside and outside the home are both sacrificed. Buyers hope that expensive mortage payments might result in equity in an inflating housing market, where rents have also become unaffordable.

    Of course, new housing is needed, but it begs the question of who can afford it. Not the residents of the homes that are being demolished, that is certain. The Prefabs were built during a time when the aim was to keep rents low, while producing spacious homes with gardens for working class people.

    The best example of this Prefab demolition is to be seen at the Excalibur Estate in Catford, South East London, which is Britain’s largest and last surviving post-war prefab estate. It consists of 186 homes built by Italian and German prisoners of war in 1945 and ’46 to house returning servicemen and their families. For many years, a long and bitter battle between the residents and Lewisham Council has continued. The Council plans to develop the site with up to 400 new homes. Some residents continue to fight against the plan. Six Prefabs are listed by English Heritage and saved from demolition; 180 are to be pulled down in phases within the next few years, starting this month.

    Photographer Elisabeth Blanchet has long studied the way these surviving “Palaces for the People” have been lived in by residents. She was struck by the way the Prefabs did not look like British brick, semi-detatched or terraced houses, but more like American homes, with a garden and more space and privacy. “Prefab estates around the country were designed with a sense of community,” says Blanchet, “… sometimes around a green and connected by footpaths, giving them the feel of holiday villages.”

    Speaking of the way the Excalibur Estate has been lived in over the many decades after it was supposed to be demolished, she says, “Apart from slight modifications, the Catford Estate remains virtually unchanged. Some residents have added new doors and windows, painted walls… Some have even given their home mock-Tudor makeovers, or added fake beams to the outside. The sense of community, a rare thing in today’s society, is in danger… I met wonderful people, mainly in their 60s, 70s, 80s and even 90s.” One resident, Eddy, who had been living there since 1946 told Blanchet, “I wouldn’t swap the place for Buckingham Palace, even if it included the Queen!”

    Over more than a decade Blanchet collaborated with Greg Stevenson on a book, Palaces for the People, that includes her unique archive of photographs and interviews with residents. She is now recording stories from people who once lived in the Prefabs, and planning a documentary film, all aiming to answer a simple question: Why do people love these homes so much?

    It is almost impossible to imagine any British Government initiating such an ambitious and popular manufacturing effort today. Even while the rate of “traditional” house building is at an historic low, there appears little willingness by the planning system to increase construction industry capacity. No one is arguing for it in Parliament, but Prefabs 2014-2019 would be great for the public, and a boost to the construction and manufacturing industries.

    Photos by Elisabeth Blanchet

    Ian Abley is a Project Manager for audacity, an experienced site Architect, and is co-author of Why Is Construction So Backward?, as well as co-editor of Manmade Modular Megastructures. He is planning 250 new British towns. Elisabeth Blanchet’s current project, “The Prefabs Tour of the UK”, will show how the homes produced in an emergency turned out to be enduring and well liked. You can get involved here.

  • The Rise of the Great Plains: Regional Opportunity in the 21st Century

    This is the introduction to a new report on the future of the American Great Plains released today by Texas Tech University (TTU). The report was authored by Joel Kotkin; Delore Zimmerman, Mark Schill, and Matthew Leiphon of Praxis Strategy Group; and Kevin Mulligan of TTU. Visit TTU’s page to download the full report, read the online version, or to check out the interactive online atlas of the region containing economic, demographic, and geographic data.

    For much of the past century, the vast expanse known as the Great Plains has been largely written off as a bit player on the American stage. As the nation has urbanized, and turned increasingly into a service and technology-based economy, the semi-arid area between the Mississippi Valley and the Rockies has been described as little more than a mistaken misadventure best left undone.

    Much of the media portray the Great Plains as a desiccated, lost world of emptying towns, meth labs, and Native Americans about to reclaim a place best left to the forces of nature. “Much of North Dakota has a ghostly feel to it," wrote Tim Egan in the New York Times in 2006. This picture of the region has been a consistent theme in media coverage for much of the past few decades.

    In a call for a reversal of national policy that had for two centuries promoted growth, two New Jersey academics, Frank J. Popper and Deborah Popper, proposed that Washington accelerate the depopulation of the Plains and create “the ultimate national park.” They suggested the government return the land and communities to a “buffalo commons,” claiming that development of The Plains constitutes, “the largest, longest-running agricultural and environmental miscalculation in American history.” They predicted the region will “become almost totally depopulated.”

    Our research shows that the Great Plains, far from dying, is in the midst of a historic recovery. While the area we have studied encompasses portions of thirteen states, our focus here is on ten core locations: North Dakota, South Dakota, Nebraska, Kansas, Oklahoma, Texas, New Mexico, Colorado, Wyoming, and Montana.

    Rather than decline, over the past decade the area has surpassed the national norms in everything from population increase to income and job growth. After generations of net out-migration, the entire region now enjoys a net in-migration from other states, as well as increased immigration from around the world. Remarkably, for an area long suffering from aging, the bulk of this new migration consists largely of younger families and their offspring.

    No less striking has been a rapid improvement in the region’s economy. Paced by strong growth in agriculture, manufacturing and energy — as well as a growing tech sector — the Great Plains now boasts the lowest unemployment rate of any region. North Dakota, South Dakota and Nebraska are the only states with a jobless rate of around 4 percent; Kansas, Montana, Oklahoma and Texas all have unemployment rates below the national average.

    A map of areas with the most rapid job growth over the past decade and through the Great Recession would show a swath of prosperity extending across the high plains of Texas to the Canada/North Dakota border. Rises in wage income during the past ten years follow a similar pattern. The Plains now boasts some of the healthiest economies in terms of job growth and unemployment on the North American continent.

    Of course, this tide of prosperity has not lifted all boats. Large areas have been left behind — rural small towns, deserted mining settlements, Native American reservations — and continue to suffer widespread poverty, low wages and, in many cases, demographic decline.

    In addition, the region faces formidable environmental and infrastructural challenges. Most prominent is the continuing issue of adequate water supplies, particularly in the southern plains. The large-scale increase in both farming and fossil fuel production, particularly the use of hydraulic fracking, could, if not approached carefully, exacerbate this situation in the not so distant future.

    Inadequate infrastructure, particularly air connections, still leaves much of the area distressingly cut off from the larger urban economy. The area’s industrial economy and rich resources are subject to a lack of sufficient road, rail and port connections to markets around the world. Yet despite these challenges, we believe that three critical factors will propel the region’s future.

    First, with its vast resources, the Great Plains is in an excellent position to take advantage of worldwide increases in demand for food, fiber and fuel. This growth is driven primarily by markets overseas, particularly in the developing countries of east and south Asia, and Latin America.

    As these countries have added hundreds of millions of middle class consumers, the price and value of commodities has continued to rise and seem likely to remain strong, with some short-term market corrections, over time.

    Second, the rapid evolution and adoption of new technologies has enhanced the development of resources, notably oil and gas previously considered impractical to tap. At the same time, the internet and advanced communications have reduced many of the traditional barriers — economic, cultural and social — that have cut off rural regions from the rest of country and the world.

    Third, and perhaps most important, are demographic changes. The late Soichiro Honda once noted that “more important than gold or diamonds are people.” The reversal of outmigration in the region suggests that it is once again becoming attractive to people with ambition and talent. This is particularly true of the region’s leading cities — Omaha, Oklahoma City, Tulsa, Kansas City, Sioux Falls, Greeley, Wichita, Lubbock, and Dallas-Fort Worth — many of which now enjoy positive net migration not only from their own hinterlands, but from leading metropolitan areas such as Los Angeles, the San Francisco Bay Area, New York and Chicago. Of the 40 metropolitan areas in the region, 32 show positive average net domestic migration since 2008.

    Together these factors — resources, information technology and changing demographics — augur well for the future of the Great Plains. Once forlorn and seemingly soon-to-be abandoned, the Great Plains enters the 21st century with a prairie wind at its back.

    Visit TTU’s page to download the full report, read the online version, or to check out the interactive online atlas of the region containing economic, demographic, and geographic data.

    Praxis Strategy Group is an economic research, analysis, and strategic planning firm. Joel Kotkin is executive editor of NewGeography.com and author of The Next Hundred Million: America in 2050. Kevin Mulligan is Associate Professor of Geography at Texas Tech University and Director of TTU’s Center for Geospatial Technology.

  • The Land Premium That’s Punishing Property

    High land prices have all but killed the Australian housing industry.

    Lower housing starts has led to lower GST revenues (house construction attracts full GST) and lower stamp duty receipts are crippling state budgets and cruelling the chances of low and middle income earners to get a start in the housing market.

    What has caused this slump in housing starts? Land prices.

    Raw land for new housing developments should be close to its agricultural value – in other words, around $10,000 per hectare. But land released for residential development fetches up to $1 million per hectare – 100 times the agricultural price.

    Government land management agencies and private land developers may well argue a lot of land has been released for residential development, but clearly it is not enough.

    Only when urban growth boundaries are removed will we know a piece of land’s true value. It will then be a trade-off between price and distance. People may be prepared to travel another 10 or 15 minutes by car (10 to 20km) to get a cheaper block.

    To highlight the “‘X’ years supply of land available” argument, I heard a state bureaucrat say recently that the government had released enough land for 15 years supply. I raised my hand and asked “15 years supply – at what price?” He didn’t know what I meant. I said “at $200,000 a block it may well take 15 years to sell. So why don’t you double the price and then you’ll have 30 years supply?”

    These points highlight the fact that, as with most central planning, housing planning is based on a fundamental flaw – that price does not matter. But as we know, price does matter. Imagine the demand for housing if land was $100,000 per block cheaper. Think LCD, LED and plasma TVs over the past five years.

    Australia does not have, and never has had, a housing affordability problem, it has a land affordability problem. The cost of building a new house has hardly moved in 20 years. Land prices however have skyrocketed. By restricting the amount of land available on the urban fringes of our cities, state governments have sent the price of entry-level housing through the roof.

    The reasons state governments give for these restrictions all centre on urban planning. They have persisted with their policies of urban densification (squeezing more and more people into existing suburbs), an idea that has failed all over the world.

    Whether it’s traffic congestion, air pollution, the destruction of bio-diversity or the unsustainable pressure on electricity, water, sewage or stormwater infrastructure, urban densification has been a disaster. The evidence is overwhelming; urban densification is not good for the environment, it does not save water, it does not lead to a reduction in motor vehicle use, it does not result in nicer neighbourhoods, it does not stem the loss of agricultural land, it does not save on infrastructure costs for government and, worst of all, it puts home ownership out of the reach of those on low and middle incomes.

    State governments use urban planning laws to restrict the amount of fringe land available and then drip feed it through their land management agencies to a land- starved housing industry at inflated prices. Hmmm. After a change of state government a few years ago, a former cabinet minister was asked why her government didn’t release more land to kick-start the housing industry. She replied: “We needed the money.” So much for urban planning.

    And of course land developers with massive land banks on their books urge state governments to maintain the scarcity to maintain the ‘value’ of the developers’ inventory. Developers would be better off if they supported the removal of urban growth boundaries and allowed more broadacre land to come onto the market which they could buy at greatly reduced prices. With land prices significantly lower than they are today it wouldn’t take long for the industry to recover. Until land prices fall, there will be no recovery.

    The Australian housing industry is building 40,000 fewer homes a year than it should be. That’s more than $10 billion worth of work a year the industry is missing out on. That’s a lot of bricks, concrete, timber, tiles, steel and, of course, labour.

    Governments and industry associations have known for years this was coming but just played footsies with each other – read US economist George Stigler’s book Regulatory Capture to understand how and why this happens.

    Australia’s economy has been seriously distorted due to a massive overinvestment in household debt. We have a housing industry on its knees. Getting all this back into alignment with reality will take time but it is a realignment that is necessary.

    We cannot continue to deny the next generation a home of their own merely to satisfy the indulgences of urban planners and state government treasury officials.

    This piece originally appeared in Business Spectator.

    Bob Day AO is managing director of national homebuilder Home Australia.

    Brighton Beach bathing box photo by Bigstock.