Category: housing

  • The Export Business in California (People and Jobs)

    California Senate President Pro-Tem Darrell Steinberg countered my Wall Street Journal commentary California Declares War on Suburbia in a letter to the editor (A Bold Plan for Sustainable California Communities) that could be interpreted as suggesting that all is well in the Golden State. The letter suggests that business are not being driven away to other states and that the state is "good at producing high-wage jobs," while pointing to the state’s 10 percent growth over the last decade. Senate President Steinberg further notes that the urban planning law he authored (Senate Bill 375) is leading greater housing choices and greater access to transit.

    This may be a description of the California past, but not present.

    Exporting People

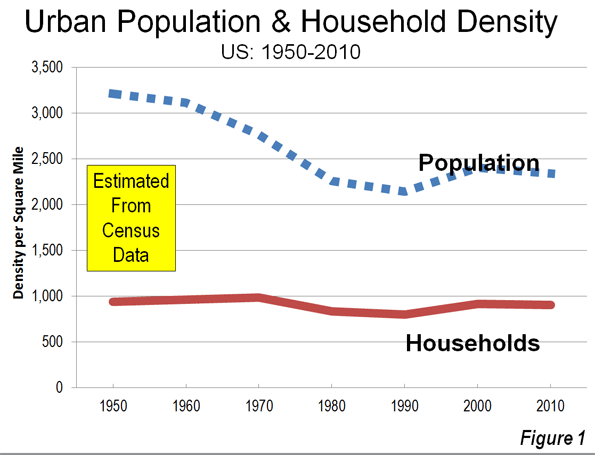
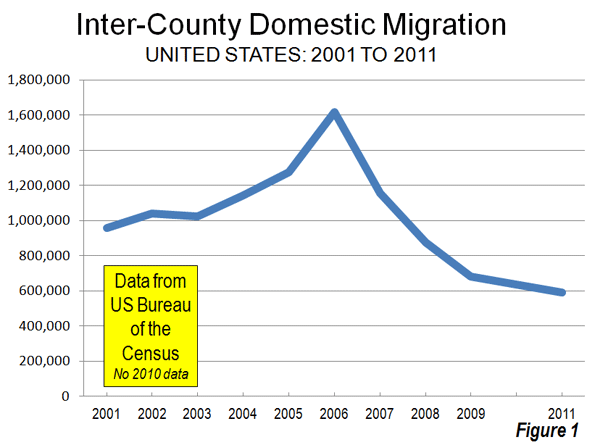
    Yes, California continues to grow. California is growing only because there are more births than deaths and the state had a net large influx of international immigration over the past decade. At the same time, the state has been hemorrhaging residents (Figure 1).

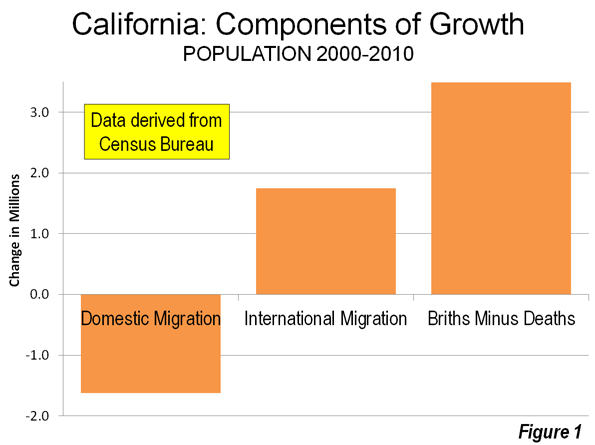
    Californians are leaving. Between 2000 and 2009 (Note), a net 1.5 million Californians left for other states. Only New York lost more of its residents (1.6 million). California’s loss was greater than the population of its second largest municipality, San Diego. More Californians moved away than lived in 12 states at the beginning of the decade. Among the net 6.3 million interstate domestic migrants in the nation, nearly one-quarter fled California for somewhere else.

    The bulk of the exodus was from the premier coastal metropolitan areas. Since World War II, Los Angeles, San Francisco, San Diego and San Jose have been among the fastest growing metropolitan areas in the United States and the high-income world. Over the last decade, this growth has slowed substantially, as residents have moved to places that, all things being considered, have become their preferences.

    More than a net 1.35 million residents left the Los Angeles metropolitan area, or approximately 11 percent of the 2000 population. The San Jose metropolitan area lost 240,000 residents, nearly 14 percent of its 2000 population. These two metropolitan areas ranked among the bottom two of the 51largest metropolitan areas (over 1,000,000 population) in the percentage of lost domestic migrants during the period. The San Francisco metropolitan area lost 340,000 residents, more than 8 percent of its 2000 population and ranked 47th worst in domestic migration (New York placed worse than San Francisco but better than Los Angeles). Each of these three metropolitan areas lost domestic migrants at a rate faster than that of Rust Belt basket cases Detroit, Cleveland and Buffalo.

    San Diego lost the fewest of the large coastal metropolitan areas (125,000). Even this was double the rate of Rust Belt Pittsburgh.

    Exporting Jobs

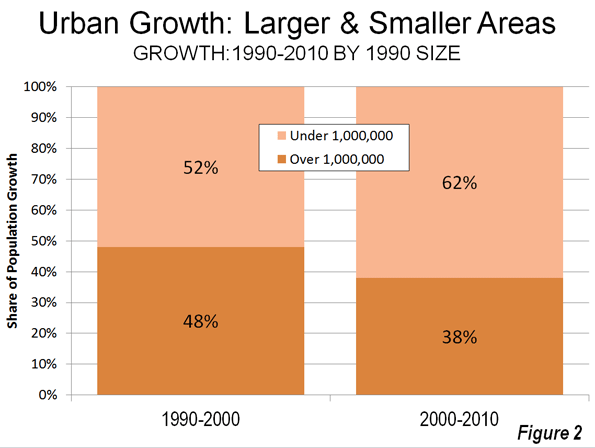
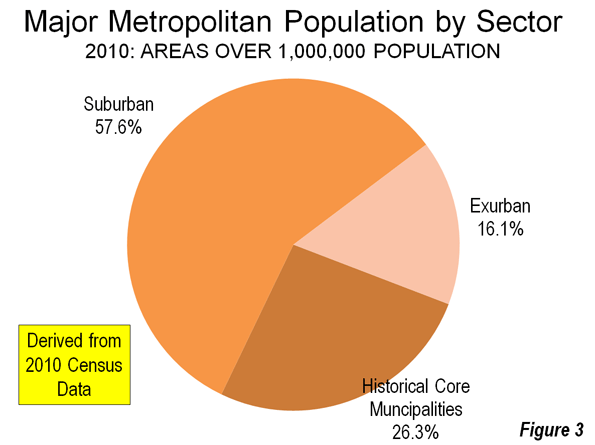
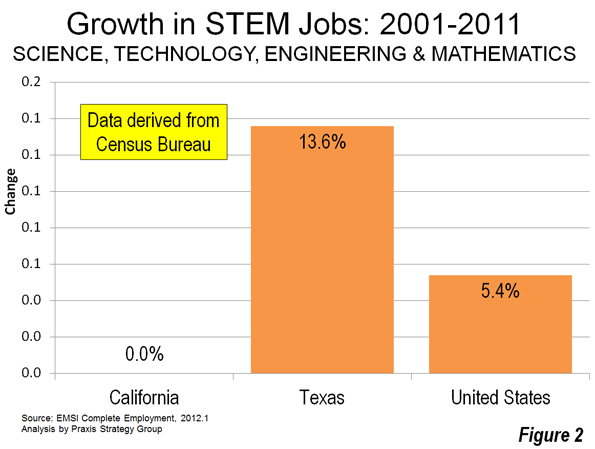
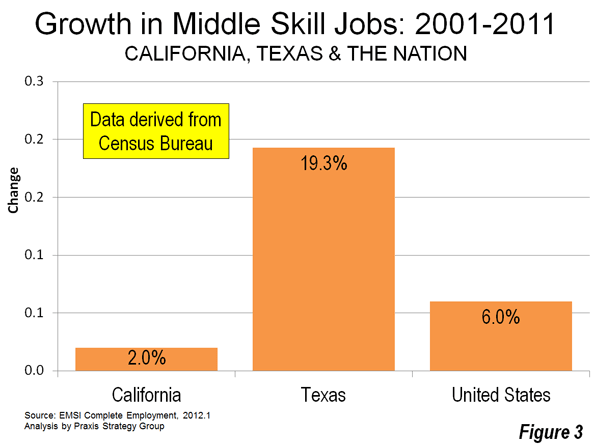
    California is no longer an incubator of high-wage jobs. The state lost 370,000 jobs paying 25 percent or more of the average wage between 2000 and 2008. This compares to a 770,000 increase in the previous 8 years. California is trailing Texas badly and the nation overall in creating criticial STEM jobs and middle skills jobs (Figures 2 & 3) Only two states have higher unemployment rates than California (Nevada and Rhode Island) . California has the second highest underemployment rate (20.8 percent), which includes the number of unemployed, plus those who have given up looking for work ("discouraged" workers) and those who are working only part time because they cannot find full time work. Only Nevada, with its economy that is overly-dependent on California, has a higher underemployment rate.


    Business relocation coach Joseph Vranich conducts an annual census of companies moving jobs out of California and found a quickening pace in 2012. Often these are the very kinds of companies capable of creating the high-wage jobs that used to be California’s forte. Vranich says that the actual number may be five times as high, which is not surprising, not least because there is no reliable compilation of off-shoring of jobs to places like Bangalore, Manila or Cordoba (Argentina).

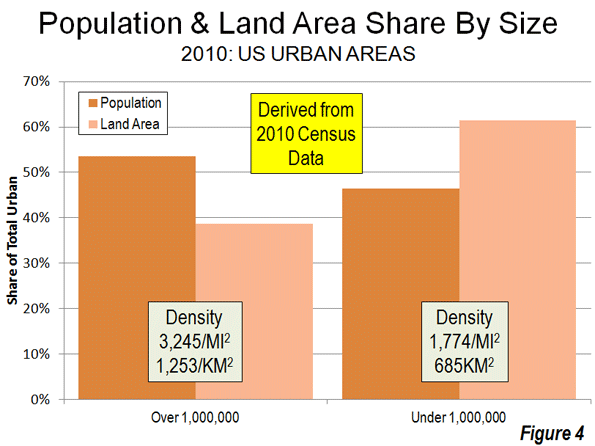
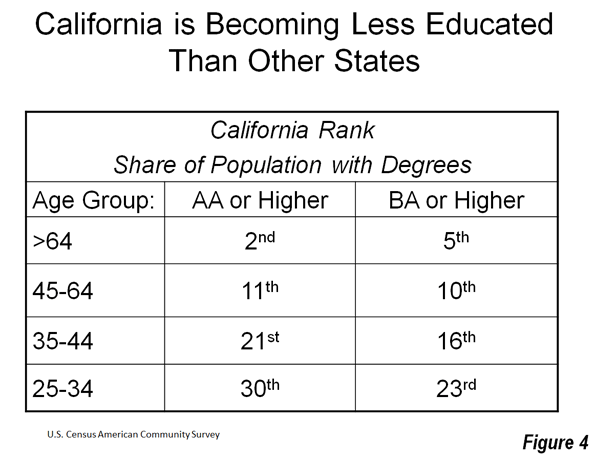
    To make matters worse, California is becoming less educated. California’s share of younger people with college degrees is now about in the middle of the states, while older, now retiring Californians are among the most educated in the nation (Figure 4).

    Denying Housing Choice

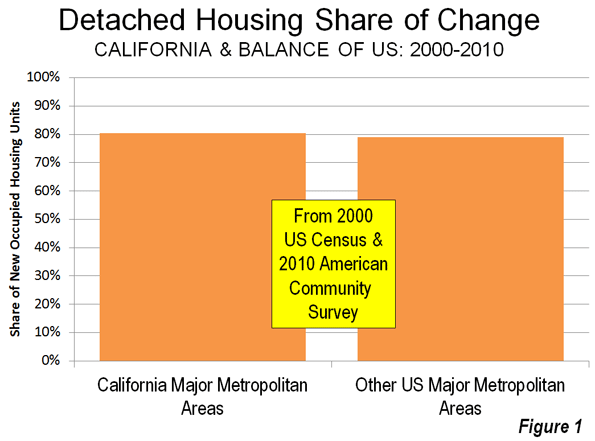
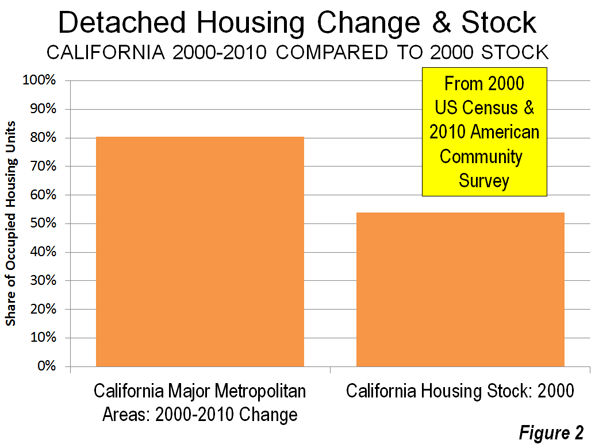
    It is fantasy to believe, as Steinberg claims, that there are enough single family (detached) houses in the state to meet the demand for years to come. More than 80 percent of the new households in the state chose detached housing over the last decade. People’s actual choices define the market, not the theories or preferences of planners often contemptuous of the dominant suburban lifestyle.

    In contrast, however, the regional plans adopted or under consideration in the Bay Area, Los Angeles and San Diego would require nearly all new housing be multi-family, at five to 10 times normal California densities (20 or more units to the acre are being called for). New detached housing on the urban fringe would be virtually outlawed by these plans. And, when Sacramento does not find the regional plans dense enough, state officials (such as the last two state Attorneys General) are quick to sue. If the "enough detached housing" fantasy held any water, state officials and planners would not be seeking its legal prohibition. To call outlawing the revealed choice of the 80 percent (detached housing) would justify the equivalent of a Nobel Prize in Doublespeak.

    At the same time by limiting the amount of land on which the state preferred high density housing must be built, land and house prices can be expected to rise even further from their already elevated levels (already largely the result of California’s pre-SB 375 regulatory restrictions).

    Transit Rhetoric and Reality

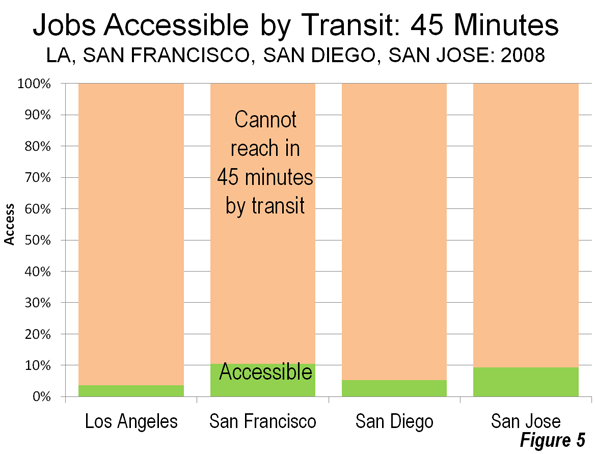
    Transit is important in some markets. About one-half of commuters to downtown San Francisco use transit. The assumptions of SB 375 might make sense if all of California looked like downtown San Francisco. It doesn’t, nor does even most of the San Francisco metropolitan area. Only about 15 percent of employment is downtown, while the 85 percent (and nearly all jobs in the rest of the state) simply cannot be reached by transit in a time that competes with the car. Even in the wealthy San Jose area (Silicon Valley), with its light rail lines and commuter rail line, having a transit stop nearby provides 45 minute transit access to less than 10 percent of jobs in the metropolitan area.

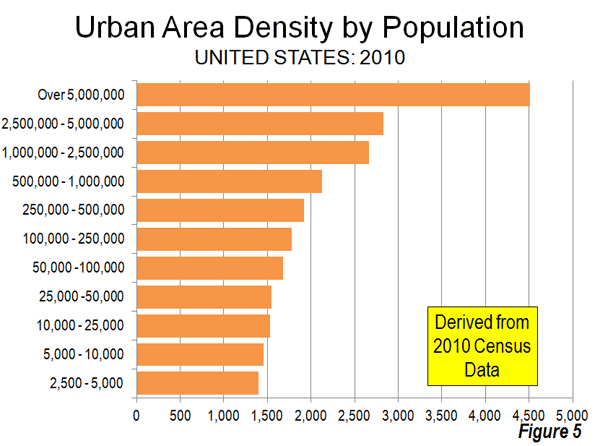
    A recent Brookings Institution report showed that the average commuter in the four large coastal metropolitan areas can reach only 6.5 percent of the jobs in a 45 minute transit commute. This is despite the fact that more than 90 percent of residents can walk to transit stops. Even when transit is close, you can’t get there from here in most cases in any practical sense (Figure 5).

    SB 375 did little to change this. For example, San Diego plans to spend more than 50 percent of its transportation money on transit over the next 40 years. This is 25 times transit’s share of travel (which is less than 2 percent). Yet, planners forecast that all of this spending will still leave 7 out of 8 work and higher education trips inaccessible by transit in 30 minutes in 2050. Already 60 to 80 percent of work trips in California are completed by car in 45 minutes and the average travel time is about 25 minutes.

    For years, planners have embraced the ideal of balancing jobs and housing, so that people would live near where they work, while minimizing travel distances. This philosophy strongly drives the new SB 375 regional plans. What these plans miss is that people choose where to work from the great array of opportunities available throughout the metropolitan area. These varied employment opportunities that are the very reason that large metropolitan areas exist, according to former World Bank principal planner Alain Bertaud.

    People change jobs far more frequently than before and multiple earners in households are likely to work far apart. Similar intentions led to the development up to four decades ago of centers like Tensta in Stockholm, which ended up as concentrated low income areas (Photo). It California, such a concentration would do little to improve transit ridership, even low-income citizens are four to 10 times as likely use cars to get to work than to use transit.


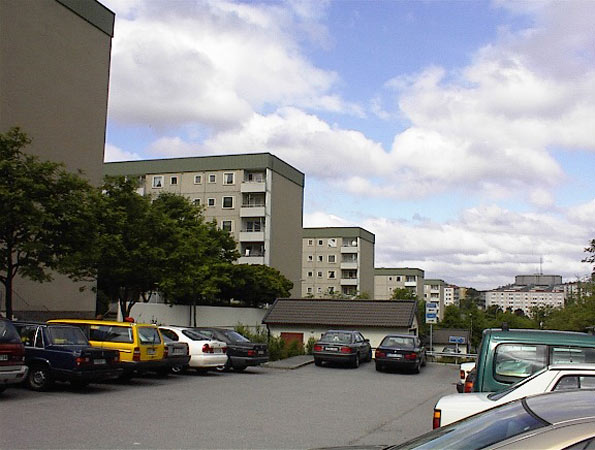
    Tensta Transit Oriented Development: Stockholm

    All of this means more traffic congestion and more intense local air pollution, because higher population densities are associated with greater traffic congestion. Residents of the new denser housing would face negative health effects because there is more intense air pollution, especially along congested traffic corridors.

    Self-Inflicted Wounds

    Worst of all, California’s radical housing and transportation strategies are unnecessary. The unbalanced and one-dimensional pursuit of an idealized sustainability damages both quality of life and the economy. This is exacerbated by other issues, especially the state’s dysfunctional economic and tax policies. It is no wonder California is exporting so many people and jobs. California’s urban planning regime under SB 375 is poised to make it worse.

    Wendell Cox is a Visiting Professor, Conservatoire National des Arts et Metiers, Paris and the author of “War on the Dream: How Anti-Sprawl Policy Threatens the Quality of Life”.

    Net Domestic Migration: 2000-2009
    Rank Metropolitan Area Net Domestic Migration Compared to 2000 Population
    1 Raleigh, NC         194,361 24.2%
    2 Las Vegas, NV         311,463 22.4%
    3 Charlotte, NC-SC         248,379 18.5%
    4 Austin, TX         234,239 18.5%
    5 Phoenix, AZ         543,409 16.6%
    6 Riverside-San Bernardino, CA         469,093 14.3%
    7 Orlando, FL         225,259 13.6%
    8 Jacksonville, FL         126,766 11.3%
    9 Tampa-St. Petersburg, FL         260,333 10.8%
    10 San Antonio, TX         177,447 10.3%
    11 Atlanta, GA         428,620 10.0%
    12 Nashville, TN         123,199 9.4%
    13 Sacramento, CA         141,117 7.8%
    14 Richmond, VA           75,886 6.9%
    15 Portland, OR-WA         121,957 6.3%
    16 Dallas-Fort Worth, TX         317,062 6.1%
    17 Houston, TX         243,567 5.1%
    18 Indianapolis. IN           72,517 4.7%
    19 Oklahoma City, OK           41,082 3.7%
    20 Denver, CO           66,269 3.0%
    21 Louisville, KY-IN           34,381 3.0%
    22 Birmingham, AL           26,934 2.6%
    23 Columbus, OH           34,204 2.1%
    24 Kansas City, MO-KS           31,747 1.7%
    25 Seattle, WA           40,741 1.3%
    26 Minneapolis-St. Paul, MN-WI          (19,731) -0.7%
    27 Memphis, TN-MS-AR            (8,583) -0.7%
    28 Hartford, CT            (9,349) -0.8%
    29 Cincinnati, OH-KY-IN          (17,648) -0.9%
    30 Virginia Beach-Norfolk, VA-NC          (20,005) -1.3%
    31 Baltimore, MD          (36,407) -1.4%
    32 St. Louis, MO-IL          (43,750) -1.6%
    33 Philadelphia, PA-NJ-DE-MD        (115,890) -2.0%
    34 Pittsburgh, PA          (52,028) -2.1%
    35 Washington, DC-VA-MD-WV        (107,305) -2.2%
    36 Providence, RI-MA          (49,168) -3.1%
    37 Salt Lake City, UT          (34,428) -3.5%
    38 Rochester, NY          (40,219) -3.9%
    39 San Diego, CA        (126,860) -4.5%
    40 Buffalo, NY          (55,162) -4.7%
    41 Milwaukee,WI          (74,453) -5.0%
    42 Boston, MA-NH        (235,915) -5.4%
    43 Miami, FL        (287,135) -5.7%
    44 Chicago, IL-IN-WI        (561,670) -6.2%
    45 Cleveland, OH        (136,943) -6.4%
    46 Detroit,  MI        (366,790) -8.2%
    47 San Francisco-Oakland, CA        (347,375) -8.4%
    48 New York, NY-NJ-PA     (1,962,055) -10.7%
    49 Los Angeles, CA     (1,365,120) -11.0%
    50 San Jose, CA        (240,012) -13.8%
    51 New Orleans, LA        (301,731) -22.9%
    Data from US Census Bureau


    —–

    Note:  2000 to 2010 data not available

    Lead photo: Largely illegal to build housing under California Senate Bill 375 planning

  • Homebuilding Recovery: How CAD Stifles Solutions

    The Recovery Blueprint is a multipart series on homebuilding. Part II addresses how a reliance on CAD software and a lack of collaboration stifle sustainable land development solutions.

    The front cover of Engineering News-Record on March 12th, 2012 was about a technology survey conducted a few weeks earlier. Of 18 issues surveyed, the need for better software was mentioned most frequently. Under the heading “Software Shortfall – Better, Simpler, Cheaper”, the editors noted that ‘dissatisfaction with current products cuts across all responses,’ and labeled the area, ‘Needs Improvement’.

    Better Software: Until a few decades ago the development of the world was represented by a hand drawn plan. Computer Aided Drafting (CAD) did not exist. There was an intimacy between the design of buildings and the land development task at hand. Since the introduction of CAD, the typical American city has seen few technology changes in the ways that housing is designed. There is virtually no advancement in the design of land development that can be associated with this new era of software-enabled design. If anything, it could be argued that CAD technology resulted in worse design of the cities in which we dwell.

    During a recent lunch with a prominent architect, he explained to me how easy it is to do multifamily design. Simply create one interior unit and one end unit, and then repeat with minor modifications for the first floor units. There was no mention on how to increase the views, or of perceived space (versus actual space), or of efficiencies that could help make everyday living better for the residents. Only that CAD made things so much faster and ‘easier’ for the architect.

    Several software solutions companies boast in their literature about how the development of hundreds of lots can be generated in a minute. The attitude that technology is a tool for speed, instead of for quality, feeds complacency and dumbs down design to series of ‘typicals’ or ‘blocks’ that can be instantly duplicated.

    CAD was intended as a drafting tool to serve hundreds of purposes within a multi-billion dollar software industry. To serve all industrial usages, CAD has become a ‘jack of all trades but master of none’. This is most apparent in land-based design, which requires calculations based upon coordinate geometry. CAD requires a separate data structure to perform these calculations. As an industry core technology, CAD compromises and limits land development design. To do land based calculations for environmental and economic reporting requires precision spatial analysis, and CAD technology fails to deliver. If CAD were a spatial platform there would be no need for a separate GIS technology (another industry problem) for analytical data.

    CAD Saturation: The hand drafting tools used just a few decades ago simply do not exist today. In a saturated market, CAD companies must generate fees through updates, support and training. If these systems were easy (see above complaints) and quick to learn the support and training income would plummet. Thus, intentional complexity assures CAD an income stream for companies at the expense of limiting progress and stifling design advancements.

    Pre-packaged software results in pre-packaged solutions. For example, imagine that an engineer schooled in the use of a particular software is given the task of designing a storm sewer on a 100-acre subdivision. To design and create the required drawings and reports for the multi-million dollar storm sewer system using add-on software to CAD, it might take only a day or so. A more natural alternative using surface flow is likely a viable option, potentially reducing infrastructure expense by tens of thousands, and in some cases millions, of dollars. However, there is no ‘button press’ for surface flow. If consulting fees are based upon a percentage of construction costs the situation becomes worse.

    Many Architects intelligently use technology that is not possible through CAD. Some of these more intelligent software solutions have even been acquired by leading CAD companies. GIS (Geographic Information System) technology is generally based upon polygons, that is, a series of straight lines forming a shape. Typically, it’s useless for precision engineering and surveying irregular, real-world sites.

    Technology Inhibited Collaboration: Architects, engineers, surveyors and planners — the group of consultants that are given responsibility to design and produce plans for our world’s growth — have been, historically, un-collaborative. Technology has done little to change this and foster collaboration.

    Only a few decades ago, it was a given that hand drawn sketches would need to be calculated for construction. Today, a planner using CAD could ‘sketch’ thousands of inaccurate lines and arcs that look like a finished plan, but would be useless for engineering and surveying. Data transferred to the CAD system of an engineer or surveyor does not magically become accurate, and therefore usable. The way CAD has been utilized destroys collaboration instead of building it.

    This isn’t the fault of CAD technology, which actually can create precise drawings. The blame falls on those that teach its use. One way to build collaboration would be for schools in engineering, architecture, planning, and surveying to work on common projects, teaching the needs of each other in a way that reduces time and workload, allowing more time for better decision making.
    Unsustainable Sustainability: It’s human nature to find comfort at a certain stage of equilibrium. What does this mean? We relent to the flow of everyday life. In the case of land development issues, methods and technology that go with the flow lead to an unsustainable path.

    Those involved in the development industry, whether working for private or for public entities, know our growth is not sustainable. Instead of seeking better methods, we have reduced planning to either mindlessly automating design, or to creating stricter design models that promise progress by providing a better architectural façade.

    Instead of being more efficient and reducing the physical elements required for development, we have added solutions that often increase installation and maintenance costs. An example is permeable paving, which is a wonderful idea: pavement that allows rainwater to pass into the ground, instead of running off the pavement’s end and flooding the surrounding area. The problem is not the pavement, but the fact that the under layer supporting the paving must also be permeable. To do this is often prohibitively expensive. If it’s not done properly, it traps water that can freeze (in colder climates) and then expand, and may not hold up to the weight of heavy loads.

    Despite the promise of permeable pavement, design innovations that can reduce the volume of street surface by 30% or more without reducing functionality make more sense. Eliminating an excessive amount of street surface is an efficient solution that costs less to install and maintain than permeable pavement.

    Funding Sources For Innovation: Would it be possible for someone to discover a way to create an affordable base for permeable pavement? Probably. There are hundreds of millions of dollars available from private foundations and government grants for solutions leading to sustainable growth. However, foundation grants fund only 501c non-profits. Should future solutions to development be tied only to non-profit or politically connected entities, or to private firms which may be more capable of innovation?

    There is no technology that can create a better design; we can only create better designers. Instead of educating CAD users on how to automate design, we need to create a generation of designers who use technology to create wonderful neighborhoods instead of quick subdivision plans.

    The consultant needs to concentrate on the best solution, not just the solution that is a mere button press away. Today, there is no excuse for creating designs that are not precise. Architects, engineers, planners, and surveyors need to learn to fulfill each other’s basic needs. This would go a long way towards creating a new era of collaborative design.

    Rick Harrison is President of Rick Harrison Site Design Studio and Neighborhood Innovations, LLC. He is author of Prefurbia: Reinventing The Suburbs From Disdainable To Sustainable and creator of Performance Planning System. His websites are rhsdplanning.com and pps-vr.com.

    Flickr Photo: Designing tools by evrenozbilen.

  • Attack on the Suburbs: California Senate Republican Caucus Report

    Differing views on the future of California urban areas are the subject of a California Senate Republican Caucus report (Briefing Report: Attack On The Suburbs: SB 375 And Its Effects On The Housing Market).

    The report details differing views on the future of California urban areas as described by University of Utah Professor Arthur C. Nelson in a report for the Urban Land Institute with those of newgeography.com authors Joel Kotkin and Wendell Cox in recent editions of The Wall Street Journal.

    Nelson’s view is largely that the market for detached housing in California is in decline. Senate Bill 375’s planning mandates are being interpreted to virtually ban further construction of detached housing in the state’s metropolitan areas.

    However, if Nelson’s analysis were right, there would be no need for legislative intervention since people would not buy detached housing. In fact, however, the demand for detached housing remains strong. Between 2000 and 2010, detached housing accounted for 80 percent of new housing additions in California’s major metropolitan areas.

    Critics of Senate Bill 375 market interventions that would seek to steer the market toward hyper density housing (20 to 40 and more housing units to the acre) would increase traffic congestion, increase the intensity of air pollution and make California and encumber an already laggard economy.

    The report concludes: "Clearly, before the California Legislature decides to take over the community planning duties of local governments and engage in social experimentation with the housing market, it should perhaps look at both sides of the argument to see if the experiment will be successful." 

  • Staying the Same: Urbanization in America

    The recent release of the 2010 US census data on urban areas (Note 1) shows that Americans continue to prefer their lower density lifestyles, with both suburbs and exurbs (Note 2) growing more rapidly than the historic core municipalities.  This may appear to be at odds with the recent Census Bureau 2011 metropolitan area population estimates, which were widely mischaracterized as indicating exurban (and suburban) losses and historical core municipality gains. In fact, core counties lost domestic migrants, while suburban and exurban counties gained domestic migrants. The better performance of the core counties was caused by higher rates of international migration, more births in relation to deaths and an economic malaise that has people staying in (counties are the lowest level at which migration data is reported). Nonetheless, the improving environment of core cities in recent decades has been heartening.

    The urban area data permits analysis of metropolitan area population growth by sector at nearly the smallest census geography (census blocks, which are smaller than census tracts). Overall, the new data indicates that an average urban population density stands at 2,343 per square mile (904 per square kilometer). This is little different from urban density in 1980 and nearly 10 percent above the lowest urban density of 2,141 per square mile (827) recorded in the 1990 census. Thus, in recent decades, formerly falling US urban densities have stabilized .

    Urban density in 2010, however, remains approximately 27 percent below that of 1950, as many core municipalities lost population while suburban and suburban populations expanded. This resulted in the substantial expansion of urban land area reflecting the preference for low-density lifestyles among Americans and most people in other high-income areas of the world.   Between the 1960s and 2000, nearly all of the growth in the major metropolitan regions of Western Europe and Canada has taken place in suburban areas, as these nations’ urban areas have dispersed in a manner similar to that of the United States. The trend continued through 2011 in Canada and domestic migration data in Western Europe shows a continuing movement of people from the historical cores to the suburbs and exurbs.

    This dispersion, pejoratively called "urban sprawl" has been routinely linked with everything from obesity and global warming to "bowling alone." In fact, while population densities have fallen, households densities have remained steady, barely droppping at all. Average household size has fallen dramatically, as fewer children have been born and divorce rates have soared. New households have been formed at more than 1.5 times the rate of population growth. The result is that a 27 percent decline in urban density since 1950 translated into a much more modest 4 percent decline in household density. A more genuine target for anti-suburban crusaders would be household sprawl rather than urban sprawl (Figure 1).

    Smaller Urban Areas Growing Faster

    Even as urban densities have reached a floor, Americans still continue to move to areas of lower density and smaller populations. For example, the urban areas of more than 1 million population in 1990 attracted 48 percent of the nation’s urban growth between 1990 and 2000. Between 2000 and 2010, these areas attracted a smaller 38 percent of urban growth (Figure 2).

    The Exurbs: A Two-Way Exodus

    For much of the last decade (and even before), the media has been heralding an epochal “return” to core cities. This idea is fundamentally misleading since most suburbanites actually came not from core cities but smaller towns and rural areas. The census results have made it clear that the urban focus of population growth was largely anecdotal, although  small inner city areas of some core cities (such as small sections of  St. Louis, Chicago, Dallas, Seattle, San Diego and Portland)  have experienced uncharacteristic growth. But overall, most growth continued to be in the suburbs and exurbs.  Measured at the census block level, exurbs are constantly at risk of being converted into suburbs as they become a part of the continuously developed area. Even so, as of 2010, exurban areas accounted for 16.1 percent of the population in the 51 major metropolitan areas. The historical core municipalities accounted for 26.3 percent of the population, while suburban areas housed 57.6 percent of the population (Figure 3).

    It should be considered, however, that in many urban areas — such as Houston, Los Angeles, Phoenix, Portland, Seattle and Orlando — many historic city neighborhoods were developed as and remain suburban in their form, being dominated detached homes and automobiles. It is unlikely that exurban areas (measured at the census block level) will exceed the historical core cities in population, since they are at constant risk of being merged with suburbs (as the urban area expands).

    Smaller Urban Areas: Where the Sprawl Is

    The principal urban areas of the major metropolitan areas are nearly twice as dense as the rest of America’s urban areas. These urban areas have 53 percent of the urban population, but occupy only 39 percent of the urban land area. By contrast, the smaller urban areas have 47 percent of the urban population, while occupying 61 percent of the urban land area (Figure 4). It seems odd  that the fury of urban planners is directed at the larger, more dense urban areas rather than the smaller, much less dense urban areas, that sprawl to a far greater degree (Figure 5).

    Most and Least Dense Major Urban Areas

    Among the major metropolitan areas, the most dense urban area is Los Angeles, at a density of 6,999 per square mile (2,702 per square kilometer). This is a 32 percent denser than fourth ranked New York whose  hyper-dense core is offset by its low density suburbs. In fact, San Jose, which is virtually all suburban in its urban form and was a small urban area in 1950 (link to 1950-2010 data), ranks third and also is more dense than the New York urban area. Second ranked San Francisco is also more dense than New York (Figure 6). New Orleans ranked 10th most dense, however experienced a reduction in density of more approximately 30 percent due to the devastation of Hurricanes Katrina

    It may be surprising that Portland, with by far the most radical densification policies in the nation, does not even rank among the 10 most dense urban areas. Portland ranked 13th, behind urban areas like Las Vegas, Salt Lake City, San Diego, Sacramento, Denver and exclusively suburban Riverside-San Bernardino (and even the much smaller urban areas of Fresno, Bakersfield, Turlock and Los Banos in California’s San Joaquin Valley). However Portland did densify, reaching one-half the density of Los Angeles.  Portland will catch Los Angeles in density by 2120 at the current rate.   

    The least dense urban area is Birmingham, with a population density of 1,414 per square mile (546 per square kilometer). Atlanta, the least dense urban area of more than 3 million population in the world right is the third least dense at 1,707 per square mile (659 per square kilometer). The second least dense urban area, Charlotte, had a density of 1,685 per square mile (651 per square kilometer), while increasing its land area over the decade at twice the rate of Atlanta (Figure 7).

    Staying the Same

    Urbanization in the United States over the last decade can be characterized by the old French proverb that "the more things change the more they stay the same."

    As in Europe and elsewhere (see the Evolving Urban Form series), when they move, Americans go to less dense areas such as to suburban and exurban areas within the larger metropolitan areas as well as smaller, lower density urban regions. The extent to which they move, however, will depend more upon economic improvement than the lure of core areas that, in reality, continue to lose younger people in their thirties while continuing not attracting their boomer parents as they get older.

    Wendell Cox is a Visiting Professor, Conservatoire National des Arts et Metiers, Paris and the author of “War on the Dream: How Anti-Sprawl Policy Threatens the Quality of Life

    —-

    Note 1: Urban Areas and Metropolitan Areas: An urban area is the area of continuous development and as Sir Peter Hall put it, is thus the "physical" urban form. The urban area is a similar, but fundamentally different concept than a metropolitan area and analysts routinely confuse the terms. The United States Census Bureau calls urban areas over 50,000 population "urbanized areas." The metropolitan area is larger, and includes one or more urban areas as well as economically connected rural areas. . The metropolitan area is the "functional" urban form. There is no rural territory within urban areas, but there can be substantial rural territory in a metropolitan area (For example, the US defines metropolitan areas by counties. This can lead to artificially large metropolitan areas. For example, the Riverside San Bernardino metropolitan area, in the West where counties tend to be larger, covers 27,300 square miles (a land area larger than Ireland). The Cleveland metropolitan area, with a principal urban area similar in population to Riverside-San Bernardino, covers only 2,000 square miles, because it is located in Ohio, where counties are smaller. At the same, the far lower population density of the Riverside-San Bernardino metropolitan area is despite the fact that the urban area is approximately 50 percent more dense than the Cleveland urban area

    Note 2: Historical Core Municipalities, Suburbs and Exurbs: For the purposes of this article, an area outside a historical core municipality is considered a suburb if it is in the urban area and an exurb if it is in the corresponding metropolitan area, but outside the principal urban area. Urban areas are delineated at a small census geographical area (the census block), which makes more precise analysis possible than is available at the county level, the lowest level at which domestic migration data is available.

    Note 3: Principal Urban Areas: The principal urban area is the urban area within a metropolitan area that has the largest population. For example, in the Riverside-San Bernardino metropolitan area, the Riverside-San Bernardino urban area is the principal urban area. Other urban areas, such as Murrietta, Hemet and Indio (Palm Springs) would be secondary urban areas.

    —-

    Photograph: Exurban St. Louis (photo by author)

  • Homebuilding: Recovery & Red Tape

    The Recovery Blueprint is a multipart series of articles that offers suggestions on how to recover from the homebuilding recession.

    Since the recession began, there haven’t been any significant changes in how regulations could be improved to energize the housing market and foster innovation. Three areas where big regulation changes are needed? Environmental subsidies, density requirements, and zoning laws.

    Environmental Incentives: Repeating the mistakes of the Carter era, federal and state governments have thrown vast sums of tax money at ‘green’ solutions likely to fail. A massive amount of our nation’s total energy use seeps out of inefficient housing, draining families of income at a time when they can least afford it. The subsidization of inefficient construction that incorporates energy saving alternatives is as flawed today as it was 25 years ago. Federal and state credits allow funding for improvements such as insulation, solar panels, wind generation, geothermal systems, and the like. These tax credits have to be balanced against taxes paid by families who are barely surviving this recession, if they are still in their homes making mortgage payments.

    Who benefits? Not the mortgage companies that repossess energy inefficient homes. Not the families in traditional homes burdened with high energy costs. Only those wealthy enough to need tax breaks can benefit. But a household at the income level where it makes financial sense to upgrade an existing home can easily afford the upgrade without burdening the already overtaxed public.

    In a low income, possibly downtrodden neighborhood, upgrading a home for energy efficiency results in an expense (even after tax breaks) not likely to be recovered at the sale of the home. It would make more sense to use the same amount of funds to replace older, inefficient homes with new construction. New construction essentially replaces homes with the least efficient HVAC (heating/ventilation/ air conditioning) and insulation with new ones that operate the most efficient systems. But new construction gets almost no tax benefits; only geothermal or solar systems on new construction are subsidized. Does that make sense?

    Density Targets: Making funds available to cities on the condition that certain higher densities are met is not a solution, either. What I hear most often is that we need to provide high-density housing and public transportation so that poor people can get to their jobs, assuming, of course, that all people of low income work downtown.

    Are multi-billion dollar light rail projects and heavily subsidized low-income high-rise towers justified by such rhetoric? A low-income family on the 6th floor of a high-density building will not have the same quality of living or the pride-of-place that a home with a yard would provide. Travel dependent on a train or bus schedule does not offer the independence of owning a vehicle and travelling on one’s own schedule. Travel by foot or bike makes perfect sense for some of those who live in San Diego, but in the rest of the world those alternatives are viable only for the few nice weather days.

    When the recession began, urban architects and planners celebrated the death of the suburbs and the coming advent of an urban rebirth. While the suburbs were certainly hard hit, urban areas did not receive the expected mass migration.

    There is a myth that sprawl was the result of large lots and low density in the suburbs. Over the past 20 years, the firm I founded has planned over 730 developments in 46 States and 15 countries. I would estimate the average density of our suburban developments at between four and five units per useable acre. Today’s suburban development must preserve wetlands, steep slopes, wooded areas, and most often contain a minimum percentage of the site in open space. None of those requirements were in place when our core cities were built. One simply gridded streets through swamps (the previous term for wetlands) and bulldozed slopes and woodlands. Had our existing core cities been built under today’s regulations, they would likely sprawl 30% or more beyond the areas they currently occupy.

    Density targets that must be hit in order to receive government financial assistance not only doesn’t increase the quality of lower income life, it doesn’t result in more sustainable and affordable cities. Instead, most funding has resulted in displacing low-income neighborhoods with gentrified, wealthy development. Many of these projects were initial financial failures. The next developer — the one who picked up the project at bargain prices — realized the profit. Successful, affordable urban redevelopment remains elusive.

    Ordinances & Codes: The designer of any development, suburban or urban, will squeeze every inch out of the site to stay within the most minimal dimensions allowed by local ordinances. This effort to maximize the client’s profits can only result in monotonous, cookie-cutter development.

    Many city planning boards have been manipulated into believing the illusion that a ‘forms based’ or ‘smart-code’ approach is a solution. These new regulations simply increase the number of minimum standards, and restrict innovative solutions. What a ‘forms based’ or ‘smart’ code does accomplish is to significantly increase the consulting income of the firm that promotes this alternative.

    Many engineers and architects base their fees on a percentage of the final construction costs. A consultant who charges on a percentage of infrastructure costs has an incentive to introduce excessive sewer pipes, retaining walls, or other non-needed construction. A fee structure based upon increased profit derived on the least efficient design is a huge roadblock to developing sustainable cities.

    Innovations in land development and in methods of design now allow a reduction of both environmental and economic impact from 15% to over 50%, compared to conventional or New Urban planning methods. While these new methods take more time and effort to design, the reward is more attractive, affordable, and functional neighborhoods.

    What’s the blueprint for better planning? For starters, two ideas: government aid should be based on a ‘plan’ showing how the resulting development will enhance the living standards, and not be tied only to density levels. And agencies should reward contracts to the consultant with the best solution. This means creating a financial mechanism to increase – not decrease — profitability for sustainable planning and engineering solutions that require the least amount of construction costs.

    Photo by Stripey Anne: “I am an NHS Bureaucrat…These, dear friends, are the tools of my trade: red tape, pen, ink…”

    Rick Harrison is President of Rick Harrison Site Design Studio and Neighborhood Innovations, LLC. He is author of Prefurbia: Reinventing The Suburbs From Disdainable To Sustainable and creator of Performance Planning System. His websites are rhsdplanning.com and pps-vr.com.

  • California Declares War on Suburbia II: The Cost of Radical Densification

    My April 9 Cross Country column commentary in The Wall Street Journal (California Declares War on Suburbia) outlined California’s determination to virtually outlaw new detached housing. The goal is clear:    force most new residents into multi-family buildings at 20 and 30 or more to the acre. California’s overly harsh land use regulations had already driven housing affordability from fairly typical levels to twice and even three times higher than that of much of the nation. California’s more recent tightening of the land use restrictions (under Assembly Bill 32 and Senate Bill 375) has been justified as necessary for reducing greenhouse gas (GHG) emissions.

    It is All Unnecessary: The reality, however, is that all of this is unnecessary and that sufficient GHG emission reductions can be achieved without interfering with how people live their lives. As a report by the McKinsey Company and The Conference Board put it, there would need to be "no downsizing of vehicles, homes or commercial space," while "traveling the same mileage." Nor, as McKinsey and the Conference Board found, would there be a need for a "shift to denser urban housing." All of this has been lost on California’s crusade against the lifestyle most Californians households prefer.

    Pro and Con: As is to be expected, there are opinions on both sides of the issue. PJTV used California Declares War on Suburbia as the basis for a satirical video, Another Pleasant Valley Sunday, Without Cars or Houses? Is California Banning Suburbia?

    California’s Increasing Demand for Detached Housing? A letter to the editor in The Wall Street Journal suggested that there are more than enough single-family homes to accommodate future detached housing demand in California for the next 25 years. That’s irrelevant, because California has no intention of allowing any such demand to be met.

    The data indicates continuing robust demand. In California’s major metropolitan areas, detached houses accounted for 80 percent of the additions to the occupied housing stock between 2000 and 2010, which slightly exceeds the national trend favoring detached housing (Figure 1). If anything, the shift in demand was the opposite predicted by planners, since only 54 percent of growth in occupied housing in the same metropolitan areas was detached in 2000 (Figure 2).


    Watch What they Do, Not What they Say: It does no good to point to stated preference surveys indicating people preferring higher density living. Recently, Ed Braddy noted in newgeography.com (Smart Growth and the New Newspeak) that a widely cited National Association of Realtors had been "spun" to show that people preferred higher density living, from a question on an "unrealistic scenario," and ignoring an overwhelming preference for detached housing – roughly eighty percent – in other questions in the same survey. People’s preferences are not determined by what they say they will do, but rather by what they do.

    Off-Point Criticism: There was also "off-point" criticism, which can be more abundant than criticisms that are "on-point." Perhaps the most curious was by Brookings Institution Metropolitan Policy Program Senior Researcher Jonathan Rothwell (writing in The New Republic) in a piece entitled "Low-Density Suburbs are Are Not Free-Market Capitalism." I was rather taken aback by this, since none of these three words ("free," "market" or "capitalism") appeared in California Declares War on Suburbia. I was even more surprised at the claim that I defend "anti-density zoning and other forms of large lot protectionism." Not so.

    Indeed, I agree with Rothwell on the problems with large lot zoning. However, it is a stretch to suggest, as he does, that the prevalence of detached housing results from large lot zoning. This is particularly true in places like Southern California where lots have historically been small and whose overall density is far higher than that of greater New York, Boston, Seattle and double that of the planning mecca of Portland.

    Rothwell’s own Brookings Institution has compiled perhaps the best inventory of metropolitan land use restrictions, which indicates that the major metropolitan areas of the West have little in large lot zoning. Yet detached housing is about as prevalent in the West as in the rest of the nation (60.4 percent in the West compared to 61.9 percent in the rest of the nation, according to the 2010 American Community Survey). Further, there has been little or no large lot zoning in Canada and Australia, where detached housing is detached, nor in Western Europe and Japan (yes, Japan, see the Note below).  

    On-Point: Urban Growth Boundaries Do Increase House Prices: However, to his credit, Rothwell points out the connection between urban growth boundaries and higher house prices. This is a view not shared by most in the urban planning community, who remain in denial of the economic evidence (or more accurately, the economic principle) that constraining supply leads to higher prices. This can lead to disastrous consequences, as California’s devastating role in triggering the Great Recession indicates.

    The Purpose of Urban Areas: From 1900 to 2010, the urban population increased from 40 percent to 80 percent of the US population. Approximately 95 percent of the population growth over 100 years was in urban areas. People did not move to urban areas the cities for "togetherness" or to become better citizens. Nor did people move out of an insatiable desire for better urban design or planning. The driving force was economic: the desire for higher incomes and better lives. A former World Bank principal urban planner, Alain Bertaud stated the economic justification directly: "large labor markets are the only raison d’être of large cities."

    And for the vast majority of Americans in metropolitan areas, including those in California, those better lives mean living in suburbs and detached houses. All the myth-making in the world won’t change that reality, even if it pushes people out of the Golden State to other, more accommodating pastures.

    The performance of urban areas is appropriately evaluated by results, such as economic outcomes, without regard to inputs, such as the extent to which an area conforms to the latest conventional wisdom in urban planning.

    • Land use policies should not lead to higher housing costs relative to incomes, as they already have in California, Australia, Vancouver, Toronto and elsewhere. If they do, residents are less well served.
    • Transport policies should not be allowed to intensify traffic congestion by disproportionately funding alternatives (such as transit and bicycles) that have little or no potential to improve mobility as seems the likely outcome of radical densification. If they do, residents will be less well served.

    This gets to the very heart of the debate. The “smart growth on steroids” policies now being implemented in California are likely to lead to urban areas with less efficient personal and job mobility, where economic and employment growth is likely to be less than would otherwise be expected. The issue is not urban sprawl. The issue is rather sustaining the middle-income quality of life, which is now endangered by public policy in California, and for no good reason.

    Wendell Cox is a Visiting Professor, Conservatoire National des Arts et Metiers, Paris and the author of “War on the Dream: How Anti-Sprawl Policy Threatens the Quality of Life

    —-

    Note: Despite its reputation for high density living, Japan’s suburbs have many millions of detached houses. In 2010, 47 percent of the occupied housing in Japan’s major metropolitan areas was detached (Tokyo, Osaka-Kobe-Kyoto, Nagoya, Sapporo, Sendai, Hiroshima, Kitakyushu-Fukuoka, Shizuoka and Hamamatsu).

    Photo: An endangered species: Detached houses in Ventura County (Photo by author)

  • Millennial Generation Safe at Home

    Each emerging American generation of adolescents and young adults tends to have a distinctive relationship with its parents. For the Baby Boomers of the 1960s and 1970s, that relationship was often conflicted, even adversarial. For Generation X in the 1980s and 1990s it was frequently distant and disrespectful. By contrast, the interactions with their parents of most of today’s Millennial Generation (born 1982-2003) are close, loving, and friendly. That’s a very good thing because, to a far greater extent than for the previous two or three generations, Millennials in their twenties live with their parents, and even grandparents, in multigenerational households.  To the surprise of many members of older generations, most Millennials—and their parents—believe the experience is beneficial and even enjoyable. It may even help America in the years ahead.

    A Pew survey conducted last December indicated that nearly two-thirds (63%) of young adults 25-34 knew someone who had recently moved back in with their parents.   Almost three in ten (29%) said that they were currently living with their parents. That is nearly three times the percentage of those of that age who lived with their parents in 1980 (11%). Multigenerational households, once seen as a lagging trend, have been growing as a share of households since 1980, rising from 12 to 16 percent over the past three decades.

    More recently, the powerful and disproportionately large impact of the Great Recession on young Americans appears to have further accelerated this trend toward multigenerational households. According to Pew, in 2011, the unemployment rate for 18-24 year olds (16.3%) and 25-29 year olds (10.3%) was well above that of those 35-64 (7%).

    But the growth in multigenerational households represents more than simply the result of economic stress. It also reflects how Millennials were raised and the value both they and their parents place on family life.  According to Pew, the large majority of young adults who now live with their parents are both satisfied with this arrangement (78%) and optimistic about their future (77%). In fact, more than a third (34%) of them actually believe that living with their parents at this stage of life has been good for their relationship with their parents, about twice the number who say it has been bad (18%). From the parents’ perspective, those who say an adult child of theirs has moved back home recently are just as satisfied with their family life and housing situation as are those parents whose adult children have not returned home. In this regard, these upbeat parents resemble Cliff and Clair Huxtable, the original TV role models for the proper rearing of Millennials on “The Bill Cosby Show,” who outwardly complained, but inwardly seemed pleased, every time one of their children (and sometimes grandchildren) “boomeranged” back to the family’s home.

    Furthermore, both the adult Millennials who are living with their parents as well as their parents seem to be benefitting from this arrangement. This contradicts the notion, popular among Boomers, that living with parents after one becomes an adult represents some sort of personal failure or lack of initiative. Nearly three-fourths (72%) of the adult children say that living with their parents has had a positive impact on their own personal finances. Young adults who live with their parents also contribute to the household in a variety of ways. Nearly all (96%) say they do chores around the house. Three-quarters contribute to paying household expenses such as groceries or utility bills. More than a third (35%) pay rent to their parents. Given all this, it is not surprising that multigenerational households have become increasingly common with so little complaint from any of the generations involved.

    However, many pundits have expressed a concern about what this trend means for America in the decades ahead. For example, in a recent New York Times article Todd and Victoria Buchholz wrote disparagingly of the “go-nowhere generation” that refuses to take risks, bestir itself from the insulation of home and “go on the road” to seek a better future. Along the way, the Buchholzes praise the Greatest Generation [which] “signed up to ship out to fight Nazis in Germany or the Japanese imperial forces in the Pacific,”  almost seeming to imply that the GI’s fought the battles of Normandy and Iwo Jima  simply to demonstrate their rugged individualism by leaving the parental home.

    History tells a different story. Like Millennials, the GI Generation (born 1901-1924) was of a type labeled “civic” by those who study generational change. Like the Millennial Generation, the GI Generation was raised in a protected manner by its parents and even tended to stay with their parents well into adulthood; multi-generational households according to Pew, after all, were far more common—nearly one in four in 1940—than today. This led to complaints about the generation that later became known as the Greatest Generation which sound strikingly like what is said about Millennials today. According to William Strauss and Neil Howe, the creators of generational theory, early in World War II, Army psychiatrists even fretted about “how badly Army recruits had been over-mothered in the years before the war.”

    Perhaps as a result of this protected upbringing, the GI Generation also was a “stay-at-home” cohort when its members were young adults. A Pew analysis of US Census data from 1940 indicates that when this generation were all 25-34 year olds about 28% of them lived in multigenerational households, a number almost identical to that of Millennials today. As a result, members of the GI Generation married and had children later than previous or subsequent generations, just as Millennials are doing today. However, once the pressures of depression and war were behind them, the GI Generation more than caught up. It parented the Baby Boom Generation, the largest in American history before Millennials came along. Aided by favorable governmental policies such as the GI Bill and the Federal Housing Administration, it grew the American economy to unprecedented heights, and expanded the American middle class, homeownership, and enjoyed en masse the chance to escape crowded cities for more bucolic suburbs.   

    There is every reason to expect achievements from America’s newest civic generation, just as we have seen from previous cohorts of this kind. As was the case with their GI Generation great-grandparents before them, almost all negative social indicators—youthful crime, substance abuse, and out of wedlock teen pregnancy—have fallen to some of the lowest levels in modern history. Meanwhile, positive indicators, such as school test scores and educational achievement, have risen to the highest levels in decades. No less than other generations, Millennials value being good parents, home ownership, having a successful marriage, and helping others in need.  Perhaps the alarmists are wrong. Maybe being “safe at home” especially during times of adversity, is a good thing for young adults, their parents, and the nation.

    Morley Winograd and Michael D. Hais are co-authors of the newly published Millennial Momentum: How a New Generation is Remaking America and Millennial Makeover: MySpace, YouTube, and the Future of American Politics and are fellows of NDN and the New Policy Institute.

    Mother and son photo by Bigstockphoto.com.

  • Alternative Growth Paths for Sydney: A New Report and its Implications

    Population growth in Australia is double the world average and the New South Wales Department of Planning has projected that the population of the Sydney region will increase by 57,000 people annually. How will these extra people be housed?  The NSW Government follows the usual doctrines based on higher population densities. Its planning policy, known as The Metropolitan Strategy, works on locating some 70% of new dwellings within existing urban communities (in-fill) and 30% in new greenfield sites. 

    This policy is implemented by orders issued by the New South Wales Minister of Planning and imposed by ministerial fiat which are neither tabled nor debated in parliament.

    To achieve this 70/30 strategy the Department of Planning in effect has placed a restrictive growth boundary around Sydney to force higher-densities into existing residential areas. Greenfield land release has been reduced from an historic 10,000 lots per year to less than 2,000. This has caused a severe land shortage. 

    These policies are undemocratic and widely resented. What is more, the government has not justified them in terms of public good.  Indeed they might find that hard to do. For example, Australian studies show that greenhouse gas emissions per person are higher in high-density living, congestion is worse, human health is compromised, the costs of electricity, gas and water services increase, heritage conservation areas valued by the community are often lost and irreplaceable urban patchwork of greenery and wildlife within the city is decimated.

    The CIE Report

    The previous Labor Government commissioned a report on possible planning alternatives for Sydney. This report, by the Centre for International Economics (CIE) titled The Benefits and Costs of Alternative Growth Paths for Sydney: Economic, Social and Environmental Impacts was delivered back in December 2010. It has only now been released by the current government. 

    The report discusses three different scenarios for Sydney.  These portray alternatives of 90%, 70% and 50% of new housing to be built in existing urban areas (in-fill) – and correspondingly 10%, 30% and 50% in greenfield sites.

    The report compares the costs of the 90/10 and 50/50 scenarios with those of the current Metropolitan Strategy 70/30 ratio over a twenty-five-year period. It finds the cost differences between them are comparatively trivial. When compared to the Metropolitan Strategy 70/30 policy, the annual non-discounted cost saving per new dwelling for the 90/10 scenario is only A$151.  For the 50/50 scenario the additional annual cost per new dwelling is found to be A$950.

    This report contains two significant flaws. The first is an implicit assumption that the price of land will be the same for all three scenarios. It also fails to properly consider additional cost factors.

    Price of Land

    Each scenario examined changes the amount of new land that would be released for development. When compared with the current baseline 70/30 strategy, the 90/10 scenario would require even greater restrictions on the release of new housing land and hence an even greater land shortage. By contrast, the 50/50 scenario would allow for a more generous release of new land and hence more land available for construction.  The immutable laws of supply and demand ensure that the degree of land restriction would significantly affect the cost of housing in each scenario, completely swamping the relatively minor cost differences due to other factors.

    Incredibly, the report appears to fail to take the effect of relative scarcity on costs into consideration. It simply assumes that the price of land will remain the same for each scenario.

    This is significant because the report includes in its calculations factors that are highly dependent on the cost of land. If the report’s findings are to be credible, the variation of these factors caused by land price variation in each scenario examined should also be taken into account.  When land is scarce high-density developers can make greater profits as they have less competition from low-priced houses and landholders can get higher prices for their land than would be the case otherwise. 

    Other Costs

    The report alleges that electricity consumption is greater in houses than it is in apartments. This is incorrect. Studies show that consumption per capita is greater in apartments. It appears that the data the report relies on does not take into account the consumption of electricity common to the whole apartment block such as lifts and lighting common areas such as foyers and car spaces. 

    The report also does not take into account costs to existing residents arising from forcing high-density into communities originally designed for low-density. These include:

    • The impact on a single-residential property that has high-rise built next to it. This can involve theft of amenity: new in-fill residents look over gardens of existing residents while the latter have to look onto unsightly structures, and suffer lack of privacy and overshadowing.
    • Congestion. Existing residents have to suffer from increasingly congested streets and shortage of street parking.
    • Shortage of recreational facilities. As more vacant land is built upon in a community originally designed for low-density, it becomes difficult to secure new open areas to service the needs of the additional population at a reasonable standard.
    • Reduction in housing choice, particularly for families.  Most infill development consists of apartments which are not suitable for bringing up young children.  Indeed the majority of those currently living in apartments do not do so by choice. A survey indicates multi-story apartments are not even acceptable to most people wishing to downsize, if they have other choices such as smaller single residential houses or villas.
    • Reduction in biodiversity. When gardens and open space are replaced with unit blocks this has a severe effect on urban plant and animal life.
    • Heritage items valued by the community such as traditional period architect designed housing are often lost.
    • Atmospheric pollution.  There is a local effect on residents of atmospheric pollution in high-density areas.  This is due to higher traffic densities and to less volume of air being available for the dilution and dispersion of pollutants.

    If these considerations had been quantified into the report’s calculations, they would have changed its overall findings.

    Conclusions

    As is not unusual in reports by density advocates throughout the English-speaking world, the report’s findings are marred by the fact that significant factors are omitted.  If costs and benefits were fully accounted for, including the costs and benefits borne by existing residents, an already weak case for emphasising densification over fringe development would vanish.

    As we have seen, even with the flawed accounting used in the report, the magnitude of the cost differences that it finds between its three scenarios is trivial. These tiny differences make the unpopular Metropolitan Strategy 70/30 policy hard to justify, and any intensification of this strategy to 90/10 impossible to justify.   Cost differences of either A$151 or A$950 are small compared to the price that people have to pay for a house (the median price in Sydney is A$650,000). These insignificant figures need to be considered in the light of providing people with the opportunity of living in the housing style of their choice.

    If costs and benefits were to be fully accounted for, including those borne by existing residents, the case for a policy of enforced densification cannot be supported.   When asked voters want less rather than more densification.

    High land prices due to restrictive land-releases are already making housing unaffordable for the next generation.  Unwanted high-rise development represents theft from the community, reducing the amenity of existing residents and transfers that value to property developers without recompense. This theft is aided and abetted by the policies of the State Government. Moreover, it continues to result in well-publicised favours being granted to developers with connections to government.

    The Metropolitan Strategy needs to be replaced. A good start would be for the New South Wales government to adopt the suggested 50/50 strategy as the first step towards reform.  The provision of more choice will allow people to demonstrate whether they prefer to live in high-density or in lower cost, more spacious housing with a garden in the suburbs.

    (Dr) Tony Recsei has a background in chemistry and is an environmental consultant. Since retiring he has taken an interest in community affairs and is president of the Save Our Suburbs community group which opposes over-development forced onto communities by the New South Wales State Government.

    Sydney suburb photo by BigStockPhoto.com.

  • Still Moving to the Suburbs and Exurbs: The 2011 Census Estimates

    The new 2011 Census Bureau county and metropolitan area population estimates indicate that Americans are staying put. Over the past year, 590,000 people moved between the nation’s counties. This domestic migration (people moving within the nation) compares to an annual rate of 1,080,000 between the 2000 and 2009. Inter-county domestic migration peaked in 2006 at nearly 1,620,000 and has been falling since that time (Figure 1). The continuing low rate of domestic migration has been reinforced by the economic malaise that has kept job and income growth well below levels that would be expected in a more genuine recovery.

    Yet the nation has continued to grow. With less domestic migration, natural growth (births minus deaths) and considerable, but slower international migration, growth over the past year has been more in proportion to total population. The movement between counties within major metropolitan areas has become less of a factor. Predictably, there the usual doom and gloom reports  about suburbs and exurbs and how poorly they are doing compared to before, and how people are returning to the cities (Note 1). As usual, the data shows no such thing, as people continue to move from core counties in greater numbers than others move in (See Note 2 on county classifications).

    Domestic Migration: Despite the higher gasoline prices and the illusions of a press that is often anti-suburban, both the suburbs and the exurbs continued to attract people from elsewhere in the nation. The core counties, which contain the core cities, continued to lose domestic migrants to other parts of the country, principally to the suburbs and the exurbs of the large metropolitan areas.

    Over the past year, the core counties of major metropolitan areas lost 67,000 domestic migrants (people move between a metropolitan area and somewhere else in the nation). Suburban counties gained approximately 72,000 domestic migrants, while exurban counties gained 49,000 domestic migrants (Figure 2). Because of their lower population base, exurban counties had the highest relative rate of net domestic migration, at 0.34% of their 2010 population. This is more than three times the rate of the suburban counties (0.11%) and far higher than the minus 0.09% of the core counties (Figure 3). Thus, the overall slower rate of growth among exurban counties was due to a lower natural growth rate and less international migration, not the result of any losses to the core. The same is true, to a lesser extent, of the suburban counties.


    Overall, the major metropolitan areas gained 48,500 domestic migrants between 2010 and 2011. By contrast, between 2000 and 2009, the major metropolitan areas lost, on average, nearly 200,000 domestic migrants to the rest of the nation each year. The huge domestic out migration in the last decade has been associated with the housing bubble. Less affordable housing markets lost 3.2 million domestic migrants between 2000 and 2009. More affordable markets gained 1.7 million domestic migrants. This was not enough to negate the losses in the higher cost markets, and major metropolitan markets lost 1.5 million domestic migrants overall.

    Natural Growth: As the grim economic times induced people to stay put, core counties grew marginally faster than suburban and exurban counties principally because of higher natural growth rates, which is the net of births minus deaths. More than 70% of the higher population in core counties was from natural growth. Natural growth was less of a factor in the suburban counties, at 60%. In the exurban counties, natural growth accounted for only 47% of the population growth (Table 1). The higher core county natural growth rates are especially evident where there are large foreign born populations, due to their generally higher birth rates (such as Los Angeles, Dallas-Fort Worth, Houston, Austin and Riverside-San Bernardino, as well as Raleigh and Salt Lake City).

    International Migration: The other component of growth was international migration, which contributed 38% of the growth in core counties and 29% of the growth in suburban counties. International migration was much less important in the exurban counties, contributing only 15% of the growth (Table 1)

    Table 1
    Major Metropolitan Areas
    Components of Population Change: 2010-2011: Summary by Sector
     Net Domestic Migration   Net International Migration   Natural Increase (Births Minus Deaths) 
    Core Counties -8.5% 37.6% 70.8%
    Suburban Counties 11.2% 29.0% 59.8%
    Exurban Counties 37.9% 14.5% 47.4%
    Multi-County Major Metropolitan Areas 3.5% 32.1% 64.3%
    Single County Major Metropolitan Areas -10.9% 34.5% 76.7%
    Major Metropolitan Areas with More Than 1 County 3.0% 32.2% 64.7%
    Single County Major Metropolitan Areas: San Diego and Las Vegas


    The Gainers: The fastest growing major metropolitan areas were dominated by the four largest Texas metropolitan areas. Austin (3.2%), Dallas-Fort Worth (2.0%), Houston (1.9%) and San Antonio (1.9%) were all among the five fastest growing. Raleigh placed second, with a one-year growth rate of 2.3%. The top five numeric gainers in domestic migration were in all in Texas or Florida — Dallas-Fort Worth (39,000), Miami (36,000), Austin (31,000), Tampa-St. Petersburg (27,000) and Houston (21,000). The much improved housing affordability in Florida seems likely to be a factor in the recovery of Miami and Tampa-St. Petersburg. Further, Houston became the second Texas metropolitan area to exceed Philadelphia in population, following Dallas-Fort Worth in the last decade. Texas thus becomes the first state to place two metropolitan areas in the five largest in the nation (Table 2).

    Table 2
    Major Metropolitan Areas: Population
    Population: 2010-2011
    Metropolitan Area 2010 2011 Change % Change
    New York, NY-NJ-PA        18,919,649        19,015,900                  96,251 0.51%
    Los Angeles, CA        12,844,371        12,944,801                100,430 0.78%
    Chicago, IL-IN-WI          9,472,584          9,504,753                  32,169 0.34%
    Dallas-Fort Worth, TX          6,400,511          6,526,548                126,037 1.97%
    Houston. TX          5,976,470          6,086,538                110,068 1.84%
    Philadelphia, PA-NJ-DE-MD          5,971,589          5,992,414                  20,825 0.35%
    Washington, DC-VA-MD-WV          5,609,150          5,703,948                  94,798 1.69%
    Miami, FL          5,578,080          5,670,125                  92,045 1.65%
    Atlanta, GA          5,286,296          5,359,205                  72,909 1.38%
    Boston, MA-NH          4,559,372          4,591,112                  31,740 0.70%
    San Francisco-Oakland, CA          4,343,381          4,391,037                  47,656 1.10%
    Riverside-San Bernardino, CA          4,245,005          4,304,997                  59,992 1.41%
    Detroit. MI          4,290,722          4,285,832                   (4,890) -0.11%
    Phoenix, AZ          4,209,070          4,263,236                  54,166 1.29%
    Seattle, WA          3,447,886          3,500,026                  52,140 1.51%
    Minneapolis-St. Paul, MN-WI          3,285,913          3,318,486                  32,573 0.99%
    San Diego, CA          3,105,115          3,140,069                  34,954 1.13%
    Tampa-St. Petersburg, FL          2,788,151          2,824,724                  36,573 1.31%
    St. Louis, MO-IL          2,814,722          2,817,355                     2,633 0.09%
    Baltimore, MD          2,714,546          2,729,110                  14,564 0.54%
    Denver, CO          2,554,569          2,599,504                  44,935 1.76%
    Pittsburgh, PA          2,357,951          2,359,746                     1,795 0.08%
    Portland, OR-WA          2,232,896          2,262,605                  29,709 1.33%
    San Antonio, TX          2,153,891          2,194,927                  41,036 1.91%
    Sacramento, CA          2,154,583          2,176,235                  21,652 1.00%
    Orlando, FL          2,139,615          2,171,360                  31,745 1.48%
    Cincinnati, OH-KY-IN          2,132,415          2,138,038                     5,623 0.26%
    Cleveland, OH          2,075,540          2,068,283                   (7,257) -0.35%
    Kansas City,  MO-KS          2,039,766          2,052,676                  12,910 0.63%
    Las Vegas, NV          1,953,927          1,969,975                  16,048 0.82%
    San Jose, CA          1,841,787          1,865,450                  23,663 1.28%
    Columbus, OH          1,840,584          1,858,464                  17,880 0.97%
    Charlotte, NC-SC          1,763,969          1,795,472                  31,503 1.79%
    Austin, TX          1,728,247          1,783,519                  55,272 3.20%
    Indianapolis, IN          1,760,826          1,778,568                  17,742 1.01%
    Virginia Beach (Norfolk), VA-NC          1,674,502          1,679,894                     5,392 0.32%
    Nashville, TN          1,594,885          1,617,142                  22,257 1.40%
    Providence, RI-MA          1,601,065          1,600,224                      (841) -0.05%
    Milwaukee, WI          1,556,953          1,562,216                     5,263 0.34%
    Jacksonville, FL          1,348,702          1,360,251                  11,549 0.86%
    Memphis, TN-MS-AR          1,318,089          1,325,605                     7,516 0.57%
    Louisville, KY-IN          1,285,891          1,294,849                     8,958 0.70%
    Oklahoma City, OK          1,258,111          1,278,053                  19,942 1.59%
    Richmond, VA          1,260,396          1,269,380                     8,984 0.71%
    Hartford, CT          1,212,491          1,213,255                        764 0.06%
    New Orleans, LA          1,173,572          1,191,089                  17,517 1.49%
    Raleigh, NC          1,137,297          1,163,515                  26,218 2.31%
    Salt Lake City, UT          1,128,269          1,145,905                  17,636 1.56%
    Buffalo, NY          1,135,293          1,134,039                   (1,254) -0.11%
    Birmingham, AL          1,129,068          1,132,264                     3,196 0.28%
    Rochester, NY          1,054,723          1,055,278                        555 0.05%
    Total      167,462,456      169,067,997             1,605,541 0.96%
    Data derived from US Bureau of the Census
    Major Metropolitan Areas: Over 1,000,000 Population


    The Losers: Four metropolitan areas, Detroit, Cleveland, Providence and Buffalo suffered small population losses. Pittsburgh had a small gain, but was alone in having an excess of deaths over births. New York again led the nation in its net domestic migration loss, at 99,000. Chicago lost 54,000 and Los Angeles lost 51,000 residents to other areas of the country between 2010 and 2011, while Detroit lost 24,000. Domestic migration data is available for New York City because it is composed of five counties. New York City lost 57,000 domestic migrants (Table 3).

    Table 3
    Major Metropolitan Areas
    Components of Population Change: 2010-2011
     Net Domestic Migration   Net International Migration   Natural Increase (Births Minus Deaths)  Total Components of Change (Note)
    New York, NY-NJ-PA              (98,975)                83,322                112,336               96,683
    Los Angeles, CA              (50,549)                54,725                  96,150             100,326
    Chicago, IL-IN-WI              (53,908)                24,422                  61,483               31,997
    Dallas-Fort Worth, TX                39,021                23,291                  63,504             125,816
    Houston. TX                21,580                24,105                  64,363             110,048
    Philadelphia, PA-NJ-DE-MD              (13,133)                11,413                  22,769               21,049
    Washington, DC-VA-MD-WV                21,517                24,872                  48,235               94,624
    Miami, FL                36,191                35,215                  20,440               91,846
    Atlanta, GA                12,419                17,370                  42,908               72,697
    Boston, MA-NH                 (1,627)                15,494                  18,143               32,010
    San Francisco-Oakland, CA                  5,880                17,996                  23,939               47,815
    Riverside-San Bernardino, CA                15,131                  9,065                  35,826               60,022
    Detroit. MI              (24,170)                  7,468                  11,734                (4,968)
    Phoenix, AZ                  5,585                15,866                  32,847               54,298
    Seattle, WA                17,598                12,228                  22,280               52,106
    Minneapolis-St. Paul, MN-WI                      536                  7,832                  24,296               32,664
    San Diego, CA                      816                  9,591                  24,703               35,110
    Tampa-St. Petersburg, FL                27,157                  6,857                     2,318               36,332
    St. Louis, MO-IL              (10,260)                  2,671                  10,256                 2,667
    Baltimore, MD                 (1,341)                  5,004                  10,941               14,604
    Denver, CO                19,565                  5,204                  19,997               44,766
    Pittsburgh, PA                  3,740                  1,426                   (3,260)                 1,906
    Portland, OR-WA                11,388                  4,806                  13,511               29,705
    San Antonio, TX                19,515                  3,841                  17,486               40,842
    Sacramento, CA                  2,856                  6,173                  12,659               21,688
    Orlando, FL                10,394                  9,767                  11,557               31,718
    Cincinnati, OH-KY-IN                 (7,149)                  2,152                  10,624                 5,627
    Cleveland, OH              (12,521)                  1,896                     3,344                (7,281)
    Kansas City,  MO-KS                 (2,820)                  3,009                  12,705               12,894
    Las Vegas, NV                 (6,353)                  8,007                  14,395               16,049
    San Jose, CA                 (2,704)                11,072                  15,376               23,744
    Columbus, OH                  2,219                  3,329                  12,390               17,938
    Charlotte, NC-SC                13,778                  4,581                  13,038               31,397
    Austin, TX                30,669                  6,134                  18,085               54,888
    Indianapolis, IN                  1,940                  2,953                  12,827               17,720
    Virginia Beach (Norfolk), VA-NC                 (7,086)                  2,382                  10,044                 5,340
    Nashville, TN                  9,323                  3,015                     9,867               22,205
    Providence, RI-MA                 (6,254)                  2,487                     2,940                   (827)
    Milwaukee, WI                 (4,862)                  1,796                     8,384                 5,318
    Jacksonville, FL                  2,911                  1,935                     6,691               11,537
    Memphis, TN-MS-AR                 (2,933)                  1,841                     8,615                 7,523
    Louisville, KY-IN                  1,886                  1,711                     5,400                 8,997
    Oklahoma City, OK                  8,746                  2,228                     8,904               19,878
    Richmond, VA                  1,546                  1,965                     5,519                 9,030
    Hartford, CT                 (4,749)                  3,066                     2,493                     810
    New Orleans, LA                10,153                  1,563                     5,630               17,346
    Raleigh, NC                13,262                  3,228                     9,608               26,098
    Salt Lake City, UT                      915                  3,090                  13,674               17,679
    Buffalo, NY                 (2,558)                  1,185                        176                (1,197)
    Birmingham, AL                 (2,452)                  1,245                     4,421                 3,214
    Rochester, NY                 (3,320)                  1,235                     2,650                     565
    Total                48,513              517,129             1,039,221         1,604,863
    3.0% 32.2% 64.8% 100.0%
    Data derived from US Bureau of the Census
    Major Metropolitan Areas: Over 1,000,000 Population
    Excludes San Diego and Las Vegas, which have only a single county


    Captive v. Discretionary Markets? One year’s data does not make a trend, especially in unusual times. Until the nation returns to normal economic growth, many young who would otherwise move are staying put, as well as young families that would be looking for larger houses. The driving factor in the more modest domestic migration trends observed today could well be necessity rather than desire.

    Wendell Cox is a Visiting Professor, Conservatoire National des Arts et Metiers, Paris and the author of “War on the Dream: How Anti-Sprawl Policy Threatens the Quality of Life

    —-

    Note 1: It is a misconception that suburbs and exurbs have grown principally because people have moved from cities. In fact, most suburban and exurban growth has been from smaller towns and rural areas. See Cities and Suburbs: The Unexpected Truth. Components of change data (domestic migration, international migration and natural growth) is available only at the county level. Thus, city or municipality data is only available where a municipality and a county are combined.

    Note 2: The core county contains all or most of the largest historical core municipality (see Suburbanized Core Cities) in the metropolitan area, except in New York, where all five counties that comprise the city of New York are classified as core counties. The suburban counties are those designated by the Bureau of the Census as central counties, but exclude the core counties. The exurban counties are as classified by the Bureau of the Census.

    Note 3: The largest historical core municipalities comprise slightly more than 55 percent of the core county population (both figures combined).

    Photo: Chicago (West Wacker Drive) By Author

  • Smart Growth: The Maryland Example

    This is Part Two of a two-part series.

    Evidence that people just don’t like Smart Growth is revealed in findings from organizations set up to promote Smart Growth. In 2009, the Washington Post reported, “Scholars at the National Center for Smart Growth Research and Education found that over a decade, smart growth has not made a dent in Maryland’s war on sprawl.”

    Citing the “most comprehensive review to date” from the same Center, the Baltimore Sun in 2011 argued that Maryland had made “little progress with Smart Growth” despite adopting laws and policies hailed across the country as models for growth management.

    One of the innovative policies was the establishment of Priority Funding Areas (PFAs) where development was to be directed and incentivized with money for cash-strapped jurisdictions. Yet the representative bodies closest to the people continued to permit development outside the PFAs.

    Assessing the failure of incentives to concentrate development, the Center concluded: “As the Maryland experience suggests, without statutory requirements, tools that matter to the state are not always those that matter to local governments.”

    The anti-democratic outlook among Smart Growthers was evident in a comment by Gerrit Knapp, the director of the National Center for Smart Growth Research and Education, who said, “What makes incentives so politically attractive is that governments and individuals can choose to ignore them if they wish. Unfortunately, in Maryland over the last decade, that’s exactly what many have been doing.”

    This “unfortunate” behavior by free people is consistent with the conclusion of Robert Bruegmann, author of Sprawl: A Compact History, who found that low density development was “the preferred settlement pattern everywhere in the world where there is a certain measure of affluence and where citizens have some choice in how they live.”

    Deconstructing Density

    Under the new PlanMaryland, Priority Funding Areas essentially become urban growth boundaries. People still can choose to live outside PFAs, but new housing can be built at no greater than one unit per 20 acres, making such dwellings unaffordable to all but the extremely rich. Ninety percent of new development must be inside the PFAs at a minimum density of 3.5 units per acre.

    The impact of increased densities is hard to gauge when presented in this manner, but 3.5 units per acre converts to 2,240 units per square mile. Maryland averages 2.62 people per dwelling unit, so the minimum population density for almost all new development will be on a scale of 5,846 people per square mile, a density higher than Portland or San Francisco, and just shy of Copenhagen, Denmark.

    Furthermore, reviewing previous drafts of PlanMaryland leads one to believe that this minimum density will be the exception to the rule of even higher densities. The earliest draft available for public comment, April 2011, was unapologetic about the need for significantly higher densities, saying this “threshold for new development – a relatively low density of 3.5 units per acre – is not accommodating growth in PFAs as needed to minimize continued impacts on our rural and resource lands and industries.”

    A later draft, September 2011, established ranges for “medium density” (3.5 to 10 units per acre) and “high density” (10+ units per acre) and repeatedly showed a preference for the high density classification, which converts to a scale of at least 16,704 people per square mile.

    For example, on page 18 is the complaint that incentive-based planning “hindered high-density urban development,” and page 35 says there would be dramatic per capita savings “if 25 percent of the low-density development projected to be built from 2000 to 2025 was shifted to high-density development.”

    But a strange thing happened on the road to the final draft: high density was euphemized. The sixteen-page Executive Summary does not once mention density. “Low density” makes numerous appearances in the final draft in the context of wasteful land use patterns, and “high density” appears just once.

    Instead, PlanMaryland relies on the phrase “compact development”. A comparison table, laughably labeled “Low Density versus Compact Development,” steers clear of medium or high density labels even though, when converted to population per square mile, the “compact” living arrangement would be more than seven times Maryland’s current density.

    To discern the density thresholds that Maryland planners have in mind, consider, PlanMaryland claims that “Compact development leads people to drive 20 to 40 percent less, at minimal or reduced cost, while reaping fiscal and health benefits.”

    This appears to be lifted from the influential 2007 Growing Cooler report, sponsored by the National Center for Smart Growth Research and Education, Smart Growth America, and other advocacy organizations. The authors call on “all housing growth” to be built at an average density of 13 units per acre (21,798 people per square mile), in order to increase the overall metropolitan density to 9 units per acre (15,091 people per square mile) by the year 2025. There’s not a lot of room for detached single family homes in this scenario.

    PlanMaryland’s Best Practices section highlights White Flint in North Bethesda for redeveloping “an auto-dominated suburban strip into an environment where people walk to work, shops and transit.” This project puts 1,400 apartments on 32 acres, for a density of 44 units per acre.

    Hyattsville’s Arts District is recognized because “this mixed-use community features row homes, condominiums, live-work units, shops and a new community center,” but there is no room for detached, single family homes among the 500 dwellings crowded onto 25 acres, or 20 units per acre. Also featured is Carroll Creek Park that has 300 residential units, all multi-family, mixed among commercial and office space along a linear 1.3-mile strip.

    As a “Traditional Neighborhood Development,” Kentlands is closer to the norm, and features some single family housing among its mix of shops, apartments, and condos, but the 1,655 residential units on 352 acres is still 35 percent higher than the “minimum” densities mentioned in PlanMaryland, and thirteen times the state’s current density level.

    These places are architecturally striking and aesthetically attractive, but they are unaffordable to most of the state’s population. Furthermore, the dearth of detached single family housing, the predominance of multi-family dwellings mixed with (not nearby) other uses, and dramatically higher densities are not at all what an overwhelming majority of people want in Maryland or anywhere else.

    The emergence of Smart Growth in Maryland is indicative of the movement in general: For successful implementation, it would be necessary to replace incentives with mandates, and continue to rely on euphemistic language to avoid a candid discussion of density.

    In October, I spoke — along with Wendell Cox and a few others — at a technical forum on PlanMaryland, addressing many areas of concern including density. Signed into law by Governor Martin O’Malley in December 2011, PlanMaryland weakens the authority of local governments, eviscerates property rights, and expresses hope for declining interest in the single family home.

    Defenders will argue that most people support Smart Growth; after all, O’Malley and others like him were popularly elected. Yet these politicians never campaign on the specifics of Smart Growth, such as how many people per square mile they believe is necessary, or what kinds of restrictions they will impose on single family housing in the suburbs, or the impacts on affordability.

    The September draft of PlanMaryland said, “PlanMaryland, we believe, is what the public says it wants and deserves in government.” Tellingly, this statement is missing from the final report. That’s because what planners want and what people prefer are starkly different.

    Photo: New residential smart growth, from the state of Maryland’s, “Smart, Green, and Growing” site.

    Ed Braddy is the executive director of the American Dream Coalition, a non-profit organization promoting freedom, mobility and affordable homeownership. Mr. Braddy often speaks on growth management related issues and their impact on local communities or at ed@americandreamcoalition.org