Category: housing

  • Smart Growth and The New Newspeak

    It’s a given in our representative system that policies adopted into law should have popular support. However, there is a distinction to be made between adopting a policy consistent with what a majority of people want, and pushing a policy while making dubious claims that it harnesses “the will of the people.”
    The former is a valid exercise in democracy; the latter is a logical fallacy. Smart Growth advocates are among the most effective practitioners of Argumentum ad Populum, urging everyone to get on the bandwagon of higher densities, compact mixed-uses, and transit orientation because all the “cool cities” are doing it.

    Smart Growth advocates also claim this is what people prefer, even if it is not how they currently live. The two core features of Smart Growth land use — high densities and multi-family dwellings — are simply not preferred by most Americans in most places, despite the trendy push for Livability, New Urbanism, Resilient Cities, Smart Codes, Traditional Neighborhood Design, Transit Oriented Developments or any other euphemistic, clever name currently in fashion.

    Survey Says!

    In the internal data of the 2011 Community Preference Survey commissioned by the National Association of Realtors, no specific question was asked about density, but 52 percent of respondents said, if given a choice, they would prefer to live in traditional suburbs, small towns or the rural countryside. Another 28 percent chose a suburban setting that allowed for some mixed uses (Question 5). Taken together, this shows an overwhelming preference for low densities. Only 8 percent of the respondents favored a central city environment.

    As for vibrant urbanism, only 7 percent were “very interested” in living in a place “at the center of it all.” Most people wanted to live “away from it all” (Question 17). An astonishing 87 percent said “privacy from neighbors” was important to them in deciding where to live. One can reasonably infer that a majority of this majority would favor low density places with separated uses rather than crowded, noisy mixed use locations that blur the line between public and private.

    When presented with a range of housing choices, 80 percent preferred the “single-family detached house” (Question 6). Only eight percent chose an apartment or condominium. Furthermore, 61 percent preferred a place where “houses are built far apart on larger lots and you have to drive to get to schools, stores, and restaurants” over 37 percent who wanted a place where “houses are built close together on small lots and it is easy to walk to schools, stores and restaurants” (Question 8).

    So — absent the loaded terms and buzzwords that are central to Smart Growth — a large majority of randomly selected people from across the country showed a strong preference for the land use pattern derisively referred to as “sprawl.”

    Yet the press release from the National Association of Realtors proclaimed that “Americans prefer smart growth communities.” This is because on Question 13, respondents were given a description of two communities:

    Community A, a subdivision of only single family homes with nothing around them. Not even sidewalks!

    Community B: lots of amenities all “within a few blocks” of home. Of course, the description neglected to mention the population density and degree of residential stacking required to put all those dwellings in such close proximity to walkable retail. This was a significant omission, since the first housing option offered in Community B was “single family, detached,” on “various sized lots.”

    Community B received 56 percent support.

    So, with just one response to an unrealistic scenario, out of twenty answers that included many aversions to Smart Growth, the myth that people prefer Smart Growth was spread. The National League of Cities released a Municipal Action Guide to thousands of elected and appointed officials declaring the preference for Smart Growth, and the online network Planetizen, among others, uncritically helped spread the news.

    Missing from the triumphalism was this important caveat in the 98-page analysis of the results by the consultants who conducted the survey:

    “Ideally, most Americans would like to live in walkable communities where shops, restaurants, and local businesses are within an easy stroll from their homes and their jobs are a short commute away; as long as those communities can also provide privacy from neighbors and detached, single-family homes. If this ideal is not possible, most prioritize shorter commutes and single-family homes above other considerations.”

    In addition to spinning the results of preference surveys, Smart Growthers also ignore them. Maryland is a case study in how to disregard what people want while claiming the opposite. In drafting a statewide growth management plan that anticipated “increased demand for housing, an aging population, and diverse communities,” Maryland officials ignored a robust 55+ Housing Preference Survey from Montgomery County that specifically addressed this concern.

    The survey showed that most seniors planned to remain in their present homes upon retirement. Only 30 percent planned to move, and, of that group, only a small percentage would consider an apartment or condominium. This should have mattered to Maryland officials trying to gauge housing preferences for their senior population. Instead, the architects of PlanMaryland looked elsewhere to find studies that reinforced their assumptions.

    The Great Conflation

    There is an abundance of examples like these, and the key to understanding how they influence decision-makers lies in the conflation of specific amenities with the overarching concept of Smart Growth. For example, Todd Litman’s Where We Want to Be, published by the Victoria Transport Policy Institute, claims that “preference for smart growth is increasing due to demographic, economic and market trends such as aging population, rising future fuel prices, increasing traffic congestion, and increasing health and environmental concerns.”

    Does this mean most seniors – such as those in Maryland – want to live in high density, mixed use, transit-oriented apartments even when they say they don’t? Hardly. Litman concedes that “most Americans prefer single-family homes,” but finds “a growing portion want neighborhood amenities associated with Smart Growth including accessibility, walkability, nearby services, and improved public transport.”

    Those amenities are things like sidewalks, which evidently are now a Smart Growth invention, and shops that are close to (but not mixed into) residential areas. Litman’s clever construction – e.g., sidewalks equal walkability equal Smart Growth policy – is convincing to officials who mistakenly conclude that their constituents must want Smart Growth when, in fact, they do not.

    This has been Part One of a Two-Part Series on Smart Growth by Ed Braddy.

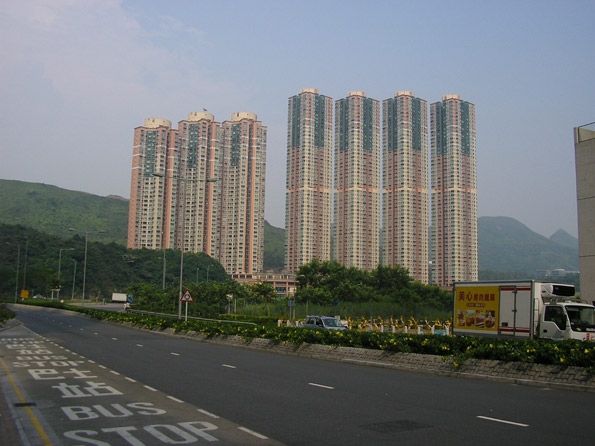
    Photo by W. Cox: Rail station in Evry, a suburb of Paris

    Ed Braddy is the executive director of the American Dream Coalition, a non-profit organization promoting freedom, mobility and affordable homeownership. Mr. Braddy often speaks on growth management related issues and their impact on local communities. He can be reached at ed@americandreamcoalition.org.

  • The Evolving Urban Form: Ho Chi Minh City (Saigon)

    Vietnam may be the next China. With a nominally communist government, Vietnam has liberalized its markets and is prospering from an increased reliance on exports. Vietnam’s gross domestic product per capita is still only about $3000, but has been among the faster growing economies over the past 10 years. Vietnam is well positioned to capture any growth that might be diverted from China’s east coast urban areas as labor costs there rise and concerns increase about the influence of that country’s powerful state-owned corporations.

    Political power in Vietnam may lie in Hanoi, but the economic heart of Vietnam is Ho Chi Minh City, the former Saigon. Ho Chi Minh City is the core of Viet Nam’s largest urban area, which is headed toward a population of 9 million, including exurban areas beyond the municipal boundaries.

    For planning purposes, the area has been divided into five subregions. The urban development trends in the Ho Chi Minh City area are similar to those of high income world urban areas. The core is experiencing little or no population growth, while peripheral areas are growing much more strongly (Photo: Core and Saigon River).


    Core and Saigon River

    Suburbanizing Ho Chi Minh City: Historical data for the districts of Ho Chi Minh City are difficult to obtain. However, the last five years provide a representative view of urban development trends, especially when combined with population projections through 2025 as reported in transportation planning documentation from the Ho Chi Minh City master plan.

    The inner core area has a population of approximately 1.4 million, with little growth expected, and is expected to decline in population by 2025. At the same time, the inner core is particularly dense, with more than 100,000 residents per square mile or 40,000 residents per square kilometer. This is approximately 1.5 times as dense as Manhattan or the ville de Paris. By 2025, the inner core will decline further to a population of 1.3 million. One unusual distinguishing characteristic of the core is very thin buildings, the result of taxation based upon building width (Photo: Tax induced thin buildings)


    Tax induced thin buildings

    Growth is stronger, but still limited in the outer core area (adjacent to the core, but differentiated because of its lower density). Over the past five years, the outer core grew from approximately 2.2 million to 2.5 million, which is strong growth in most high income world urban areas but not as notable for a rapidly growing urban area in the developing world. This growth is expected to moderate even further by 2025, when the population is expected to reach only 2.6 million. The population density in the outer core area is 60,000 per square mile or 23,000 per square kilometer.

    In contrast, almost all  the growth is expected outside the core, with both less formal development and very attractive housing (Photo: New suburban housing).


    New suburban housing

    The urban fringe areas, or the second ring of development beyond the inner core grew from 1.5 million in 2004 to 2.0 million in 2009, a 31% growth rate. By 2025, the urban fringe is projected in transportation planning documentation to grow to 3.0 million. The population density of the urban fringe is 14,500 per square mile or 5,500 per square kilometer, nearly as dense as the city (municipality) of San Francisco.

    The suburban areas within the municipality of Ho Chi Minh City grew from 1.0 million in 2004 to 1.3 million in 2009, again approximately a 30% growth rate. By 2025, the suburban areas are expected to experience the greatest growth, adding 1.6 million population, rising to 2.9 million residents.

    Comparable data for the exurban areas outside the Ho Chi Minh City municipality are not as readily available. However, it is projected that from 2007 to 2025 the population in these areas will rise from 2.6 million to 4.1 million.

    Overall, the municipality grew from 6.1 million population in 2004 7.2 million in 2009, for an 18% growth rate. Including the municipality and the exurbs, it is expected that there will be an increase from 9.1 million population in 2007 to 13.9 million in 2025. At least 95% of this growth is expected to be outside two core areas (Figure 1).

    Employment growth is also projected to be dominated by areas outside the two core areas. Between 2007 and 2025, it is expected that 80% of the new employment will be in peripheral areas.

    Building a Metro: Ho Chi Minh City may have the highest personal transportation market share outside North America. The personal vehicle (motorcycle and car) share of travel is 92%, leaving just 8% for transit (one estimate indicates an even lower 5%). Most of this travel by motorcycle, which sometimes carry three or more people.  As Ho Chi Minh City becomes more prosperous, the share of travel by automobile will likely increase. Automobile ownership is rising at 20 percent annually, more than twice the rate for motorcycle ownership.

    The government would like to change this pattern and has embarked on building a Metro in hopes of increasing transit’s market share to between 40% and 50% by 2025. This huge capital investment will be largely limited to feed and serve the core areas that will account for virtually none of the population increase and little of the new employment.

    There is no precedent for an increase in transit usage remotely of the magnitude that is sought in Ho Chi Minh City. In fact, consultants for the Asian Development Bank were so concerned that they provided an alternative projection for the system, indicating a 2025 transit market share of 22%, instead of the official goal of 40% to 50%. The consultants indicated:

    As noted earlier, the above demand models were adjusted to reflect the Government “policy” objective of achieving 40-50% PT mode share by 2025. This will entail a massive shift in travel behaviour and introduction of some very strong transport and policy initiatives. Clearly there is a risk that this may not happen as quickly or to the extent targeted. Therefore forecasts were developed for a “trend” scenario – still based on major PT transport improvements and strong policy initiatives, but with parameter values based on the consultants’ experience of what has been achieved in other cities.

    However, virtually tripling transit’s market share to 22% seems little less doubtful than increasing it to 40% to 50%. The consultant provided no examples to indicate that such an increase had "been achieved in other cities."

    Personal Mobility in Ho Chi Minh City: One of the challenges for a pedestrians in Ho Chi Minh City – like Hanoi – is dodging the swarm of motorcycles in crossing streets. Even with the Metro, more and more will buy motorcycles and cars. Traffic congestion is likely to worsen. This is principally because, even in congested urban areas, door to door travel tends to be more rapid by personal modes than by transit.

    Fortunately, the authorities are allowing the urbanization to expand, which will limit the growth of traffic congestion. They would do well to follow the advice of urban planners like Shlomo Angel (of New York University and Princeton University), who recommends building a grid of arterials streets to accommodate the growth on lower cost peripheral lands.   Strategies such as these provide Ho Chi Minh City the potential to suburbanize gracefully, maintain its high level of personal mobility and contribute substantially to its continued economic progress.

    Wendell Cox is a Visiting Professor, Conservatoire National des Arts et Metiers, Paris and the author of “War on the Dream: How Anti-Sprawl Policy Threatens the Quality of Life

    Top photo: Typical transport in Ho Chi Minh City

    All photos by author

  • Owen McShane: 1941-2012

    Newgeography.com lost a one of its first columnists, a regular contributor and good friend with the passing of Owen McShane.

    Owen McShane (Robert Ivan Owen McShane) was born in 1941 and died on March 6, 2012. His long and successful career in public policy was built on a strong academic foundation. He graduated from the University of Auckland, earning degrees in architecture and urban planning.  He continued on to be awarded a masters degree in city and regional planning at the University of California, Berkeley. There he studied under fabled Aaron Widavsky, chairman of the Political Science Department. His master’s thesis dealt with a US federal program intended to reduce unemployment and promote business development in central cities.

    He joined the new City Development Division of Auckland City Council after graduating from the University of Auckland. After returning from America, Owen held positions in both the public sector and government. He was a columnist for the National Business Review  and has been published in many magazines and newspapers.

    In recent years, Owen directed the Centre for Resource Management Studies in New Zealand. The Centre seeks to promote "a heightened awareness and understanding" of the environment and is committed to the "the promotion of scientifically robust, research-based and rational decision-making processes at all levels in matters concerning the environment." Owen was also a regular participant and presenter at the annual American Dream Coalition conferences.

    Owen developed an understanding of economics, which assisted him in avoiding the disconnected romanticism that sometimes characterizes architecture and urban planning. Combining economics with architecture and urban planning made his contributions more effective by adding the crucial human element.

    From Owen’s perspective, rational urban policy was not determined by remote or theoretical visions of the city that he was trained to plan. The success of a city was rather judged by the standard of living experienced by its residents. For example, his How Can Cities with Unaffordable Housing be Ranked Among the Most Livable Cities in the World? (newgeography.com, June 9, 2009) may have been the first to point out that popular indexes of the quality of life in international urban areas routinely ranked the most unaffordable at the top. This kind of analysis led Owen to postulate that " genuine sustainable development" had to work from middle class people and families too" in The Disappearance of the Next Middle Class (newgeography.com, August 24, 2010).  

    Owen McShane was an untiring advocate of ordinary people, championing individual aspirations in a world that has increasingly been captured by bureaucratic theories that take little or no account of their preferences or their economic advancement.

    Owen will be greatly missed both in New Zealand and far from its shores.


    Photo: Courtesy of the Heartland Institute

  • Time for Real Solutions to Vancouver’s Housing Affordability Crisis

    Vancouver is in desperate need of new solutions to ease its worsening housing affordability crisis. The 8th annual Demographia housing affordability survey released by the Frontier Centre found that Vancouver has the second least affordable housing market next to Hong Kong. On average, and assuming zero interest, a house in Vancouver would cost the median family more than ten years income. Three years is the threshold after which a market is considered unaffordable.

    Mayor Robertson recently announced the launch of a new task force to tackle the housing affordability crisis. The only way to tackle this problem is to focus on getting more housing units on to the market.

    Much of the debate around housing affordability descends into discussions about manipulating housing prices by freezing out market mechanisms. Rent control used to be a popular remedy, until cities realized that the side effects of the cure were worse than the disease. Two common methods of attempting to tackle housing today are social housing and inclusionary zoning. Social housing has been responsible for creating some of the most crime ridden neighbourhoods in the Western world. There is a reason "the projects" have such a bad name. Yet politicians of all stripes tend to promise more "affordable housing" as they call it, knowing that it will at best benefit a narrow group of people who qualify. Inclusionary zoning—requiring developers to build a specific number of below market rate units in new developments—has been one of the methods that municipal governments have attempted to compensate for this shortcoming. It also misses the point. It fails to bring broad price levels down, since it increases prices substantially for market rate units in the same development. One study from San Jose State University economists found that inclusionary zoning increases the price of market of new homes by $22,000-$44,000 in the median city. That is simply how developers pass off the cost of losing money on affordable units.

    The policies mentioned above ignore the fundamental issue: houses are priced by supply and demand. In a desirable city like Vancouver, prices are bound to be higher than in Omaha, Nebraska, or Saskatoon. But the dramatic price escalation that started in the 90s isn’t beyond the city’s control. There are many ways to get more supply on the market. One of the commendable policies undertaken by the city has been the introduction of laneway houses. These are small units that are hived off from existing houses. They are essentially small secondary suites that back in to laneways. But it won’t be anywhere near enough on its own. Vancouver needs to develop more land. The land is there, but it is off limits to development because of the agricultural land reserve (ALR). That needs to change.

    The ALR serves two purposes. The first is to preserve agricultural land. The benefit from it is contingent on whether the benefits from local agriculture outweigh the costs of taking land off of the market. From a nutritional and an economic perspective that simply isn’t the case. Flash frozen foods are often more nutritious than "fresh" local food, and intensive farming is more economical and sustainable than small scale farming. We would not be able to accommodate anywhere near our current population without industrial agriculture. This justification simply fails.

    The second justification for the ALR is to prevent urban sprawl. In a sense this works, since there is no sprawl development in the ALR. On the other hand, this approach is conducive to "leap frog" development which takes place beyond the growth boundary. It happens anywhere that a growth boundary exists. People commute further for cheaper housing. This is as true in the smart growth Mecca of Portland as it is in Toronto or Ottawa. From an economic perspective, there are reasons to worry about sprawl. People who move out into cheaper housing on the urban fringe typically pay less property taxes, and often cost municipalities more per capita. But the ALR hasn’t solved this problem. Metro Vancouver outside of the city proper accounted for 87% of the metropolitan area’s growth between 2006-2001. Simply put, the ALR simply hasn’t prevented sprawl.

    In order to balance the concerns of housing affordability and urban sprawl, the city of Vancouver should strike a compromise: open portions of the ALR, but only to high density development. This may not be the optimum solution for families that would prefer to purchase single dwelling homes, but a significant influx of new units would be a countervailing force against runaway home prices. This would also put downwards pressure on housing in the rest of Greater Vancouver. Though opening up broad swaths of the ALR may be the ideal, this seems like a reasonable compromise.

    This type of solution would rile people on both sides of the political spectrum, but it would be a dramatic improvement over the status quo. High home prices can only be solved from the supply side. The choice between maintaining the ALR as constituted or opening up portions should be obvious. Infill development can only go so far towards solving Vancouver’s housing crisis.

    Steve Lafleur is a Policy Analyst with the Frontier Centre for Public Policy.

    Downtown Vancouver photo by runningclouds

  • The Evolving Urban Form: Hong Kong

    Hong Kong has experienced its slowest decadal growth in at least 70 years, according to the results of the recently released 2011 census. Between 2001 and 2011, Hong Kong added only 5.4 percent to its population, a decline of more than two-thirds from its 1991-2001 rate. Hong Kong’s slowest growth rate since 1921-1931 was between 1981 and 1991, when 13.8 percent was added to its population. In previous decades growth had been much greater (Figure 1).

    Further, despite Hong Kong’s much larger population base today, the numeric growth from 2001 to 2011 was also the smallest since the 1921-1931 decade. Hong Kong added 363,000 residents for a total of 7,072,000 in 2011. The increase is barely one-third of the 1,034,000 residents added between 1991 and 2001. Much of Hong Kong’s population growth in the last 60 years had been driven by its better standard of living relative to mainland China. It seems likely that the growing prosperity of the past decade on the mainland has made Hong Kong less attractive for migrants.

    High Income World’s Most Dense Urban Area: Hong Kong continues to be the densest major urban area in the high-income world. The present density is estimated at 67,000 per square mile (26,000 per square kilometer). At least one small area of Hong Kong has a population density exceeding 1 million per square mile (400,000 per square kilometer), though the much more dense Kowloon Walled City (estimated at up to 5,000,000 per square mile or 2,000,000 per square kilometer) was demolished in the 1990s. Even so, there are now detached housing developments, as Hong Kongers who can afford it choose these much more expensive accommodations, as Witold Rybczynski relates in a recent commentary (detached housing photo).

    Detached Housing

    Subdivisions of Hong Kong: The Hong Kong Special Administrative Region (HKSAR) is a unified government, with no local jurisdictions (such as cities or towns).  However, there are four broad regions and within each there are districts, are designated for statistical purposes.

    Hong Kong’s growth — like that of most major metropolitan areas — has been shifting to the periphery for decades (Table 1). Between 1981 and 2011, all of the population growth was in the New Territories, the new (greenfield and high density) suburban areas beyond the Hong Kong Island-Kowloon core. While all of Hong Kong was adding 2.1 million residents in total between 1981 and 2011, the New Territories added 2.4 million (Table 2). This suburban dominance continued in the last census period, with 96 percent of growth in the New Territories. Before that, the bulk of the growth was in the outer areas of Kowloon, which were then the suburbs (Figure 2).

    Table 1
    Hong Kong Population by District: 1911-2011
    Year Total Hong Kong Kowloon New Territories Marine
    1911 456,700 244,300 69,400 81,200 61,800
    1921 625,200 347,400 123,400 83,200 71,200
    1931 840,500 409,200 263,000 98,200 70,100
    1941 1,600,000 Estimate: No complete census
    1951 2,013,000 Estimate: Census cancelled
    1961 3,129,600 1,004,900 1,578,000 409,900 136,800
    1971 3,936,600 996,200 2,194,800 665,700 79,900
    1981 4,986,600 1,183,600 2,449,100 1,304,100 49,700
    1991 5,674,100 1,251,000 2,030,700 2,374,800 17,600
    2001 6,708,400 1,335,500 2,024,000 3,343,000 5,900
    2011 7,071,600 1,270,900 2,108,400 3,691,100 1,200
    Sources:
    Government of Hong Kong
    www.cicred.org/Eng/Publications/pdf/c-c21.pdf
    Table 2
    Hong Kong Population by District: 1991-2011
    Region & District Population: 1991 Population: 2001 Population: 2011 % 2001-2011 Land Area KM2 Land Area MI2 Density KM2 Density MI2
    HONG KONG 5,674,114 6,708,389 7,071,576 5.4% 1,098 424 6,440 16,680
    HONG KONG ISLAND 1,250,993 1,335,469 1,270,876 -4.8% 80 31 15,827 40,991
      Central and Western 253,383 261,884 251,519 -4.0% 13 5 20,089 52,031
      Wan Chai 180,309 167,146 152,608 -8.7% 10 4 15,230 39,447
      Eastern 560,200 616,199 588,094 -4.6% 19 7 31,265 80,976
      Southern 257,101 290,240 278,655 -4.0% 39 15 7,154 18,529
    KOWLOON 2,030,683 2,023,979 2,108,419 4.2% 47 18 45,138 116,909
      Yau Tsim Mong 282,060 282,020 307,878 9.2% 7 3 44,946 116,409
      Sham Shui Po 380,615 353,550 380,855 7.7% 9 4 40,175 104,052
      Kowloon City 402,934 381,352 377,351 -1.0% 10 4 37,849 98,028
      Wong Tai Sin 386,572 444,630 420,183 -5.5% 9 4 44,891 116,268
      Kwun Tong 578,502 562,427 622,152 10.6% 11 4 56,303 145,826
    NEW TERRITORIES 2,374,818 3,343,046 3,691,093 10.4% 971 375 3,801 9,845
      Kwai Tsing 440,807 477,092 511,167 7.1% 22 8 23,427 60,675
      Tsuen Wan 271,576 275,527 304,637 10.6% 61 23 5,019 12,999
      Tuen Mun 380,683 488,831 487,546 -0.3% 84 33 5,773 14,953
      Yuen Long 229,724 449,070 578,529 28.8% 138 53 4,179 10,824
      North 165,666 298,657 304,134 1.8% 137 53 2,215 5,737
      Tai Po 202,117 310,879 296,853 -4.5% 147 57 2,014 5,215
      Sha Tin 506,368 628,634 630,273 0.3% 69 27 9,074 23,501
      Sai Kung 130,418 327,689 436,627 33.2% 136 53 3,201 8,291
      Islands 47,459 86,667 141,327 63.1% 175 68 807 2,091
    MARINE 17,620 5,895 1,188 -79.8% 0 0 0 0
    Data from Government of Hong Kong Special Administrative Region


    The Core: Hong Kong Island: Hong Kong Island, home to one of the world’s most dense central business districts (Central, Western and Wan Chai districts) lost 4.8 percent of its population. All five of the districts on Hong Kong Island lost population, with Wan Chi (of "The World of Suzy Wong" movie fame) suffering the greatest loss, at 8.7 percent).

    The Core: Kowloon: Across Hong Kong harbor (see Star Ferry photograph, top), Kowloon, also a part of the core, gained 4.2 percent, adding nearly 75,000 residents (photo). Even so, Kowloon’s population remains more than 10 percent below its 1981 population. Three of Kowloon’s  five districts gained population, including Yau Sim Mong and Sham Shui Po, which along with the north shore districts of Hong Kong Island are the most intensely developed in the HKSAR.

    Suburban: The New Territories: The New Territories added 10.4 percent to their population (348,000), with seven of the nine districts gaining. The largest gain (63 percent) was in the Islands district, which includes Hong Kong International Airport. Sia Kung, also grew strongly, at 33 percent (see photo). Sia Kung, like nearly built-out Sha-Tin, is conveniently located just over a narrow mountain range from Kowloon and contains considerable amounts of greenfield land for development.

    Kowloon

    Sia Kung

    Yuen Long, home of the new Shenzhen Bridge had the third highest growth rate, at 29 percent. The Islands, Sia Kung and Yuen Long all have all experienced much improved access from extensions to the Mass Transit Railway (MTR) and the former Kowloon-Canton Railway (KCR), which have now merged into the MTR.

    Transportation in Hong Kong: Hong Kong is the most transit dependent major metropolitan area in the high-income world. Mass transit carries 72 percent of motorized trips. Even with the high residential and employment density, the average work trip is approximately five miles each way. Moreover, despite having one of the most effective mass transit systems in the world and extraordinarily high densities, the average one-way work trip travel time is 46 minutes, 18 minutes longer than Los Angeles or Houston. With the highest transit market share in the world and an automobile market share only 1/70th that of Houston, Hong Kong’s density still  produces among the highest levels of traffic congestion in the world — 1.5 times the traffic density of Los Angeles and three times that of Houston (photo).

    Hong Kong Traffic Congestion

    Economic Growth: Hong Kong has experienced strong economic growth for  the last three decades. In 1981, Hong Kong’s gross domestic product (GDP) per capita was one-third below that of the United Kingdom, its then colonial master. Even by this time, Chinese leader Deng Xiao Ping had been so impressed by Hong Kong’s market based economic advance, that he had designated adjacent Shenzhen as a special economic zone. That area has since grown from a fishing village to a population exceeding 10 million, according to the 2010 census. In the intervening years, the Pearl River Delta has emerged as the most populous extent of urbanization in the world, stretching from Hong Kong, through Shenzhen, Dongguan, Guangzhou, Jiangmen, Zhongshan and Zhuhai to Macao. However, because of border controls and the low level of commuting, these remain separate metropolitan areas and  urban areas.

    Hong Kong’s economic growth continued strongly in the middle 1990s, when its GDP per capita exceeded that of the United Kingdom. Hong Kong fell behind in the late 1990s Asian economic crisis, but soon recovered. By 2010, Hong Kong’s GDP per capita had risen to 27 percent above that of the United Kingdom.

    Hong Kong’s economic performance relative to the United States may be even more impressive. In 1980, Hong Kong’s GDP per capital trailed that of the United States by 45 percent. As of 2010, Hong Kong trailed the US by only three percent and according to International Monetary Fund data should pass the United States early in the present decade. Between 2000 and 2010, Hong Kong’s per capita GDP (PPP-2010$) rose more than one-third — only South Korea and Singapore did better among high-income areas, according to International Monetary Fund data. China’s percentage growth rate was  nearly five times Hong Kong’s but in actual dollars Hong Kong’s GDP per capita rose at triple China’s rate. However, should China’s economy slow down, as some analysts suggest, it could be difficult for Hong Kong to sustain this strong growth rate (Figure 3).

    The People’s Republic of China has maintained Hong Kong’s free market economic system, helping assure strong growth. It seems unlikely that either Deng Xiao Ping or Margaret Thatcher imagined that such economic progress would be made when they signed the historic agreement to restore Hong Kong to China in 1984. Nor is it likely they imagined China’s meteoric rise.

    Unique Hong Kong: Hong Kong is the living model of compact development and transit dependence toward which urban planning wisdom strives. However, Hong Kong itself is the outlier of outliers. Hong Kong’s population density — double that of any other high-income world urban area of similar size or larger — would never have approached this level if it had not been separated from China itself by colonization and then the historical complexities of the post-World War II period. Even in its prosperity, the growing urban areas of mainland China are being built at densities averaging no more than one-quarter that of Hong Kong. Hong Kong may be more an accident of history than an exemplar.

    Wendell Cox is a Visiting Professor, Conservatoire National des Arts et Metiers, Paris and the author of “War on the Dream: How Anti-Sprawl Policy Threatens the Quality of Life

    —-

    Photo: Star Ferry, operating between Hong Kong Island (Central) and Kowloon (Yau Tsim Mong). All photos by author.

    Hong Kong district map by Wikipedia user Moddlyg.

  • Don’t Bet Against The (Single-Family) House

    Nothing more characterizes the current conventional wisdom than the demise of the single-family house. From pundits like Richard Florida to Wall Street investors, the thinking is that the future of America will be characterized increasingly by renters huddling together in small apartments, living the lifestyle of the hip and cool — just like they do in New York, San Francisco and other enlightened places.

    Many advising the housing industry now envisage a “radically different and high-rise” future, even though the volume of new multi-unit construction permits remains less than half the level of 2006. Yet with new permits at historically low levels as well for single-family houses, real estate investors, like the lemmings they so often resemble, are traipsing into the multi-family market with sometimes reckless abandon.

    Today the argument about the future of housing reminds me of the immortal line from Groucho Marx:Who are you going to believe, me or your lyin’ eyes? Start with the strong preference of the vast majority of Americans to live in detached houses rather than crowd into apartments. “Many things — government policies, tax structures, financing methods, home-ownership patterns, and availability of land — account for how people choose to live, but the most important factor is culture,” notes urban historian Witold Rybczynski.

    Homeownership and the single-family house, Rybczynski notes, rests on many fairly mundane things — desire for privacy, need to accommodate children and increasingly the needs of aging parents and underemployed adult children. Such considerations rarely enter the consciousness of urban planning professors, “smart growth” advocates and architectural aesthetes swooning over a high-density rental future.

    Just look at the numbers. Over the last decade— even as urban density has been embraced breathlessly by a largely uncritical media — close to 80% of all new households, according to the American Community Survey, chose to settle in single-family houses.

    Now, of course, we are told, it’s different. Yet over the past decade, vacancy rates rose the most in multi-unit housing, with an increase of 61%, rising from 10.7% in 2000 to 17.1% in 2010. The vacancy rate in detached housing also rose but at a slower rate, from 7.3% in 2000 to 10.7% in 2010, an increase of 48%. Attached housing  – such as townhouses –  posted the slightest increase in vacancies, from 8.4% in 2000 to 11.0% in 2010, an increase of 32%.

    The attractiveness of rental apartments may soon be peaking just in time for late investors to take a nice haircut. Rising rents, a byproduct of speculative buying of apartments, already are making mortgage payments a more affordable option in such key markets as Atlanta, Chicago, Miami, Phoenix and Las Vegas.

    Urbanist pundits often insist the rush to rental apartments will be sustained by demographic trends. One tired cliché suggest that empty nesters are chafing to leave their suburban homes to move into urban apartments. Yet, notes longtime senior housing consultant Joe Verdoon, both market analysis and the Census tells us the opposite: most older folks are either staying put, or, if they relocate, are moving further out from the urban core.

    The two other major drivers of demographic change — the millennial generation and immigrants — also seem to prefer suburban, single-family houses. Immigrants have been heading to the suburbs for a generation, so much so that the most diverse neighborhoods in the country now tend to be not in the urban core but the periphery. This is particularly true in Sunbelt cities, where immigrant enclaves tend to be in suburban areas away from the core.

    Millennials, the generation born between 1983 and 2003, are often described by urban boosters as unwilling to live in their parent’s suburban “McMansions.” Yet according to a survey by Frank Magid and Associates, a large plurality define their “ideal place to live” when they get older to be in the suburbs, even more than their boomer parents.

    Ninety-five million millennials will be entering the housing market in the next decade, and they will do much to shape the contours of the future housing market. Right now many millennials lack the wherewithal to either buy a house or pay the rent. But that doesn’t mean they will be anxious to stay tenants in small places as they gain some income, marry, start a family and simply begin to yearn for a somewhat more private, less harried life.

    In the meantime, many across the demographic spectrum are moving not away from but back to the house. One driver here is the shifting nature of households, which, for the first time in a century are actually getting larger. This is reflected in part by the growth of multi-generational households.

    This is widely believed to be a temporary blip caused by the recession, which clearly is contributing to the trend. But the move toward multigenerational housing has been going on for almost three decades. After having fallen from 24 percent in 1940 to barely 12 percent in 1980, the percentage topped over 16 percent before the 2008 recession took hold. In 2009, according to Pew Research Center, a record 51.4 million Americans live in this kind of household.

    Instead of fading into irrelevance, the single-family house seems to be accommodating more people than before. It is becoming, if you will, the modern equivalent of the farm homestead for the extended family, particularly in expensive markets such as California. This may be one of the reasons why suburbs — where more than half of owner-occupied homes are locatedactually increased their share of growth in almost all American metropolitan areas through the last decade.

    Some companies, such as Pulte Homes and Lennar, are betting that the multi-generational home — not the rental apartment — may well be the next big thing in housing. These firms report that demand for this kind of product is particularly strong among immigrants and their children.

    Lennar  has already developed models — complete with separate entrances and kitchens for kids or grandparents — in Phoenix, Bakersfield, the Inland Empire area east of Los Angeles and San Diego, and is planning to extend the concept to other markets. “This kind of housing solves a lot of problems,” suggests Jeff Roos, Lennar’s regional president for the western U.S. “People are looking at ways to pool their resources, provide independent living for seniors and keeping the family together.”

    But much of the growth for multigenerational homes will come from an already aging base of over 130 million existing homes. An increasing number of these appear to being expanded to accommodate additional family members as well as home offices. Home improvement companies like Lowe’s and Home Depot already report a surge of sales servicing this market.

    A top Home Depot manager in California traced the rising sales in part to the decision of people to invest their money in an asset that at least they and their family members can live in. “We are having a great year ,” said the executive, who didn’t have permission to speak for attribution. “ I think people have decided that they cannot move so let’s fix up what we have.”

    These trends suggest that the widely predicted demise of the American single family home may be widely overstated. Instead, particularly as the economy improves, we may be witnessing its resurgence, albeit in a somewhat different form. Rather than listen to the pundits, perhaps it would be better to follow what’s before your eyes. Don’t give up the house.

    This piece originally appeared in Forbes.com.

    Joel Kotkin is executive editor of NewGeography.com and is a distinguished presidential fellow in urban futures at Chapman University, and contributing editor to the City Journal in New York. He is author of The City: A Global History. His newest book is The Next Hundred Million: America in 2050, released in February, 2010.

    Photo by Bigstockphoto.com.

  • Housing Affordability: St. Louis’ Competitive Advantage

    Things are looking better in St. Louis. For decades, St. Louis has been one of the slowest-growing metropolitan areas of the United States. Its historical core city has lost more than 60 percent of its population since 1950, a greater loss than any other major core municipality in the modern era.  Nonetheless, the metropolitan area, including the city, added nearly 50 percent to its population from 1950. The fate of St. Louis has been similar to that of Rust Belt metropolitan areas in the Midwest and East, as the nation has moved steadily West and South since World War II (Note).

    Expensive Housing and Driving People Away: During the past decade, high house prices have driven residents away from areas with better amenities, especially California’s coastal metropolitan areas and metropolitan New York. Between 2000 and 2009, Los Angeles exported 1.4 million domestic migrants, the San Francisco Bay Area 600,000 (San Francisco and San Jose) and San Diego 125,000. New York lost nearly 2,000,000. St. Louis did much better, losing less than 45,000 domestic migrants. On a per capita basis, St. Louis also performed better, losing 1.6 domestic residents per capita to migration, compared to 4.5 in San Diego, 10 in the San Francisco Bay Area and 11 in New York.   This may not sound like an accomplishment, but the St. Louis area has probably not outperformed California in terms of migration since it entered the Union in 1850.

    The big change between the 2000s and previous decades lies in housing price. It is in this period that America became effectively two nations in housing affordability. The major metropolitan areas that experienced that largest housing bubble lost 3.2 million domestic migrants, while those with lesser or no bubble gained 1.5 million. Demonstrating the preference of people for more dispersed surroundings, even more (1.7 million) moved to smaller metropolitan areas. Housing affordability has emerged as a principal competitive factor among metropolitan areas.

    Superior Housing Affordability: This is where St. Louis excels. As of the third quarter of 2011, the median house price was 2.6 times the median household income in St. Louis, according to the 8th Annual Demographia International Housing Affordability Survey, which covered seven nations (the United States, United Kingdom, Canada, Australia, Ireland, New Zealand and Hong Kong, in China). Dividing the median house price by the median household income gives St. Louis an affordability rating (Median Multiple) of 2.6. By comparison the Median Multiple was 4.2 in Portland (60 percent more expensive ), 4.5 in Seattle (75 percent more),  6.1 in San Diego (135 percent more) and 6.9 in San Jose (175 percent more. While other metropolitan areas were reeling from house price increases that still have not returned to normal, St. Louis (and other metropolitan areas, like Dallas-Fort Worth, Houston and Indianapolis) have continued to experience affordable and far more steady house prices (Figure 1).

    Lowest Cost of Living: Affordable house prices are associated with a lower cost of living. St. Louis does very well here. According to the latest data from the US Bureau of Economic Analysis regional price parity program, the cost of living in St. Louis is the lowest among major metropolitan areas (those with more than 1,000,000 population). In St. Louis, the cost of living is:

    • 29 percent less than in New York.
    • 31 percent less than in San Jose.
    • 23 percent less than in San Diego.
    • 19 percent less than in Seattle.
    • 12 percent less than in Portland.

    Things Could Get Better for St. Louis: Moreover, the gap could become larger, especially as governments in California try to outlaw new detached housing, under Senate Bill 375. None of this is good for young households or less affluent households who will have to leave to find housing that meets their desires. Many will need to leave to fulfill their dreams.

    Inevitably, the higher housing costs associated with these policies (called by various names, such as "livability," "smart growth" and "growth management") fall hardest on lower income households (often minorities), who have less to spend, are forced to move away or cannot afford to move in. The consequences were articulated by California’s Hispanic oriented Tomas Rivera Policy Institute (Figure 2):

    While there is little agreement on the magnitude of the effect of growth controls on home prices, an increase is always the result.

    The Secret: Just what did the St. Louis leadership do to improve its competitiveness so much? Nothing. They just stayed out of the way. Unlike their counterparts where house prices exploded, St. Louis officials did not prohibit people from living where they wanted on the urban fringe and they did not force new houses to be built on postage stamp lots. Nor did they adopt land use regulations that drive up the price of land (Figure 3) and, in consequence housing), just as an OPEC embargo would raise the price of gasoline. When the easy money came and lenders were begging households with insufficient resources to take mortgages, the planning embargoes drove up house prices and invited undue participation by speculators who know the difference between a competitive and a rigged market.

    There are positive signs as a result of this affordability advantage. St. Louis has been attracting more young residents. Recent data indicates that St. Louis ranked 15th in high tech job growth out of the 51 metropolitan areas with more than 1,000,000 over the past decade. It would be expected that St. Louis would trail fast growing Seattle, Raleigh and Charlotte and perennial tax consumer Washington. However, St. Louis can be placed better than perennial leaders San Jose, Boston, Portland, Austin and New York. Budding local efforts are aimed at encouraging entrepreneurship, even as California and New York search for new ways to say "no."

    Succeeding by Being St. Louis: The improving prospects of St. Louis are not the result of a taxpayer financed marketing campaign or a payoff from the usual "let’s copy Portland" strategies (or even Cleveland, as one analyst put it a couple of decades ago). St. Louis cannot compete with the weather in the Bay Area, does not have San Diego’s beaches, the mountains near Denver nor the natural beauty surrounding Seattle. But it does have an affordable life style.

    St. Louis can succeed only by being St. Louis. It is a metropolitan area with a great past, and many fine civic institutions, including great parks, sports teams and a world class orchestra. This long laggard Midwestern metropolitan area may face its best competitive prospects since Chicago passed it in population in 1870. Local and state leaders need to stay away from the policies that would dilute St. Louis’ principal competitive advantage, a low cost of living, due to a housing market left to operate without destructive distortion.

    Wendell Cox is a Visiting Professor, Conservatoire National des Arts et Metiers, Paris and the author of “War on the Dream: How Anti-Sprawl Policy Threatens the Quality of Life

    —-

    Photo: Cathedral Basilica of St. Louis (by author)

    Note: This is adapted from a policy study by the author for the Show Me Institute: Housing Affordability The St. Louis Competitive Advantage

  • The Evolving Urban Form: Moscow’s Auto-Oriented Expansion

    Moscow is bursting at the seams. The core city covers more than 420 square miles (1,090 kilometers), and has a population of approximately 11.5 million people. With 27,300 residents per square mile (10,500 per square kilometer), Moscow is one percent more dense than the city of New York, though Moscow covers 30 percent more land. The 23 ward area of Tokyo (see Note) is at least a third more dense, though Moscow’s land area is at least half again as large as Tokyo.

    All three core areas rely significantly on transit. Muscovites use the Metro at about the same rate as New Yorkers use the subway, taking about 200 trips each year. Tokyo citizens use their two Metro systems at nearly 1.5 times the rate used in Moscow.

    But there are important differences. Moscow officials indicate that approximately two-thirds of Moscow’s employment is in the central area. This is a much higher figure than in the world’s two largest central business districts — Tokyo’s Yamanote Loop and Manhattan — each with quarter or less of their metropolitan employment. Both New York City and Tokyo’s 23 wards have extensive freeway lengths in their cores, which help to make their traffic congestion more tolerable.

    Moscow’s arterial street pattern was clearly designed with the assumption that the dominant travel pattern would be into the core. Major streets either radiate from the core, or form circles or partial circles at varying distances from it. In New York City and Tokyo’s  23 wards there are radial arterials, but,the major streets generally form a grid, which is more conducive to the cross-town traffic and the more random trip patterns that have emerged in the automobile age.

    Moscow has become much, more reliant on cars,  following the examples of metropolitan areas across Europe. The old outer circular road, which encloses nearly all of the central municipality, was long ago upgraded to the MKAD, a 10 lane freeway as long as Washington’s I-495 Capital Beltway (65 miles or 110 kilometers). The MKAD has become a primary commercial corridor, with large shopping centers and three nearby IKEAs.

    It is not surprising, therefore, that traffic congestion and air pollution became serious problems in Moscow. The road system that had been adequate when only the rich had cars was no longer sufficient. The "cookie-cutter" apartment blocks, which had served Iron Curtain poverty, had become obsolete. The continued densification of an already very dense core city led to an inevitable intensification of intensification of traffic congestion and air pollution.

    Transit-oriented Moscow was not working, nor could "walkability" make much difference. In such a large urban area, it is inevitable that average travel distances, especially to work, will be long. Geographically large employment markets are the very foundation of major metropolitan areas. If too many jobs are concentrated in one area, then the traffic becomes unbearable, as many become able to afford cars and use them. Traffic congestion was poised to make Moscow dysfunctional.

    Expanding Moscow

    The leadership of both the Russian Federation and the city of Moscow chose an unusual path, in light of currently fashionable urban planning dogma. Rather than making promises they could not keep about how higher densities or more transit could make the unworkable city more livable, they chose the practical, though in urban planning circles, the "politically incorrect" solution:  deconcentrating the city and its traffic.

    Last year, Russian President Dmitry Medvedev proposed that Moscow be expanded to a land area 2.3 times as large. Local officials and parliament were quickly brought on board. The expanded land area is nearly double that of New York’s suburban Nassau County, and is largely rural (Note 2). Virtually all of the expansion will be south of the MKAD.

    The plan is to create a much larger, automobile-oriented municipality, with large portions of the Russian government to be moved to the expanded area. Employment will be decentralized, given the hardening of the transport arterials that makes the monocentric employment pattern unsustainable. Early plans call for commercial construction more than four times that of Chicago’s loop.

    At the same time, the leadership does not intend to abandon the older, transit-oriented part of the municipality. Mayor Sergei Sobyanin has voiced plans to convert central area government buildings into residences and hotels, adding that there will be the opportunity to build underground parking facilities as refurbishments proceed. Moscow appears to be preparing to offer its citizens both an automobile-oriented lifestyle and a transit-oriented one. The reduced commercial traffic should also make central Moscow a more attractive environment for tourists, who spend too much time traveling between their hotels and historic sites, such as the Kremlin and St. Basil’s.

    Expanding the Family?

    As Moscow expands, the national leadership also wants the Russian family to expand. Russia has been losing population for more than 20 years. Since 1989, the population of the Russian Federation has dropped by 4.5 million residents. When the increase of 3.0 million in the Moscow area is considered, the rest of the nation has lost approximately 7.5 million since 1989. Between the 2002 and the 2010 censuses, Russia lost 2.2 million people and dropped into a population of 142.9 million. Russia’s population losses are pervasive. Out of the 83 federal regions, 66 lost population during the last census.

    Continued population losses could significantly impair national economic growth. The projected smaller number of working age residents will produce less income, while a growing elderly population will need more financial support. This is not just a Russian problem, but Russia is the first of the world’s largest nations to face the issue while undergoing a significant population loss.

    The government is planning strong measures to counter the demographic decline, increase the birth rate, and create a home ownership-based "Russian Dream". Families having three or more children will be granted land for building single-family houses across the nation., including plots of up to nearly one-third of an acre (1,500 square meters).  Many of these houses could be built in Moscow’s new automobile- oriented two-thirds, as well as in the extensive suburbs on the other three sides of the core municipality.

    Expanding Outside the Core

    While population decline is the rule across the Russian Federation, the Moscow urban area has experienced strong growth. Between 2002 and 2010, the Moscow urban area grew from 14.6 million to 16.1 million residents (Note 3). This 1.3 percent annual rate of increase  exceeds the recently the recently announced growth in Canada (1.2 percent). This rate of increase exceeds that of all but 8 of the 51 major metropolitan areas (Note 4) in the United States between 2000 and 2010.

    While the core district grew 6 percent  and added 41,000 residents, growth was strongest outside the core, which accommodated 97 percent of the new residents (See Table). Moscow’s outer districts grew by nearly 1.1 million residents, an 11 percent increase, and its suburbs continued to expand, adding 400,000 residents, an increase of 10  percent. These areas have much lower densities than the city, with many single-family houses.

    Table
    Moscow Urban Area Population
    2002 2010 Change % Change Share of Growth
    Inner Moscow 701,000 743,000 41,000 5.9% 2.7%
    Outer Moscow 9,681,000 10,772,000 1,090,000 11.3% 70.3%
    Suburban 4,198,000 4,617,000 420,000 10.0% 27.0%
    Total 14,581,000 16,132,000 1,551,000 10.6% 100.0%
    Note: Suburban population includes the total population of each district and city that is at least partially in the urban area.


    Moscow, like other international urban areas, is decentralizing, despite considerable barriers. The expansion will lead to even more decentralization, which is likely to lead to less time "stuck in traffic" and more comfortable lifestyles. Let’s hope that Russia’s urban development policies, along with its plans to restore population growth, will lead to higher household incomes and much improved economic performance.

    Wendell Cox is a Visiting Professor, Conservatoire National des Arts et Metiers, Paris and the author of “War on the Dream: How Anti-Sprawl Policy Threatens the Quality of Life

    —–

    Note 1: The 23 ward (ku) area of Tokyo is the geography of the former city of Tokyo, which was abolished in the 1940s. There is considerable confusion about the geography of Tokyo. For example, the 23 ward area is a part of the prefecture of Tokyo, which is also called the Tokyo Metropolis, which has led some analysts to think of it as the Tokyo metropolitan area (labor market area). In fact, the Tokyo metropolitan area, variously defined, includes, at a minimum the prefectures of Tokyo, Kanagawa, Chiba and Saitama with some municipalities in Gunma, Ibaraki and Tochigi. The metropolitan area contains nearly three times the population of the "Tokyo Metropolis."

    Note 2: The expansion area (556 square miles or 1,440 square kilometers) has a current population of 250,000.

    Note 3: Includes all residents in suburban districts with at least part of their population in the urban area.

    Note 4: Urban area data not yet available.

    Photo: St. Basil’s Cathedral (all photos by author)

  • Unintended Consequences of the Neo-Traditional City Planning Model

    Since the early 20th century, the almost universal adoption of the automobile by US residents has had a profound impact on how we plan and design communities. The widespread use of the auto not only spurred development outside of traditional urban centers, it minimized the need to blend multiple land uses into compact areas.

    In contrast, traditional neighborhood design, especially in the northern Midwest and Northeast, accommodated a microcosm of commerce including grocery, butcher, hardware, tavern, cafe and dining establishments to serve relatively small markets living and working within walking distance of the neighborhood.

    The advent of the automotive age has spurred the development of suburbs outside the urban core that are characterized by carefully separated land uses, especially between residential and non-residential uses. Most cities developed zoning ordinances which created barriers to ‘protect’ residential sanctity. In contrast to this style of development, a new school of thought began to evolve in the early 90s, which followed the principles used to guide urban development prior to the dominance of the automobile.

    Neo-traditional is the favored label for this new school of planning thought; however, the terms Transit Oriented Design (TOD), New Urbanism, Walkable Communities, Smart Growth and Sustainable Communities are also used to identify subcomponents of this form of urban growth. The basic principles behind the neo-traditional movement include:

    • enhanced walkability
    • mixed land uses
    • ease of access to public transit
    • sustainability
    • high density residential
    • defined town/commerce center
    • mixture of housing types

    Each of these principles has merit and plays a valid role in the development decision making process. However, in the dash to adopt the neo-traditional model for suburban development, planners have attempted to create a formula of inflexible planning techniques that establishes a one-size-fits-all model with the goal of curing all of the ills attributed to suburban growth.

    This tactical criteria of the Neo-traditional model, however, can create unintended negative consequences. The criteria to which I refer includes:

    • grid street patterns
    • connectivity to adjacent neighborhoods
    • mixed, non-residential land uses
    • alley access/rear loaded house

    The inflexible application of these tactical criteria enhances opportunities for criminal activities to occur.

    Predictable Criminal Behavior
    To understand how a space can facilitate criminal activity, it is important to understand the relative opportunities and risks perceived in the criminal mind. 

    There are many factors which contribute to criminal activity; however there are four factors a “thinking” criminal evaluates prior to engaging in crimes against property, especially home burglary. The first factor is anonymity; more specifically the ability to engage in a criminal act without being easily identified by potential witnesses. The second factor is the ability to study and evaluate a potential target prior to initiating the specific act. By integrating themselves and their vehicles into a neighborhood’s daily routine, criminals can identify potential targets by determining the occupancy of residences or operating patterns of commercial establishments. The third factor is the ability for a quick, inconspicuous departure which is enhanced by the ability to easily flee the scene via multiple exit routes. The fourth factor is accessibility by car. Certainly some crimes are committed on foot, however a vehicle is predominately used to facilitate a hasty retreat and remove stolen goods from a burglary site.

    Grid Street Patterns
    As early as the 12th century urban design was used to discourage patterns of criminal activity in London. In the 1970s, studies began to document criminal activities and how they were facilitated by the design decisions that shape our everyday environment. The practice of utilizing design decisions to minimize criminal activity became known as “Crime Prevention through Environmental Design” (CPTED).  The CPTED Guidelines were developed through extensive study of criminal activities. I want to stress that environmental design decisions do not cause the criminal activity, but they can facilitate a more accommodating environment for it to occur. Oscar Newman explains in Design Guidelines for Creating Defensible Space how thoughtful design of the places in which we live, work, play and learn as well as the routes which connects them can significantly reduce the occurrence of crime against property. Google lists over 13 million sites on the topic “street design and crime”. Simply stated, communities with greater street complexity (fewer exit routes) and fewer common destinations (land uses which attract non-residents) have lower rates of crime as noted in a study by Daniel Beaverton for the School of Criminology at Simon Fraser University. The grid street pattern combined with high level of connection to adjacent neighborhoods provides maximum opportunities for non-residents to enter and leave a neighborhood with minimal notice.

    Advocates for highly connected neighborhoods contend that dispersing driving patterns over a greater number of neighborhood streets minimizes traffic congestion. However, it also creates a means for non-residents to traverse neighborhoods without undue notice. These dispersed travel patterns also allow potential criminals easy access and familiarization with neighborhoods in which they have little first hand knowledge.

    In Newman’s study for the U.S. Department of Housing and Urban Development, Defensible Space – Crime Prevention Through Urban Design, he notes that criminals seldom conduct their activity in areas not familiar to them.  Newman’s theory concurs with the study prepared by C. Bevis and J. B. Nutter, Changing Street Layouts to Reduce Residential Burglary that burglars tend to victimize areas with which they are familiar.

    Simply put, increased criminal activity is enhanced in communities where transient traffic is encouraged and increased street connectivity allows for ease of access, observation and escape. The practice of merging homes and businesses into a single community to reduce the reliance on the automobile has validity.  However, it also provides anonymity for criminals as they become cloaked within the community. The neo-traditional design relies on straight streets, rectangular blocks and interlinking grids to connect adjacent neighborhoods and provide numerous access and departure points for residents and non-residents. The grid system also provides criminals a means to anonymously cruise their target without detection.

    The consequences of the neo-traditional community design are underscored by the National Crime Prevention Council’s research that shows a correlation between the increase in accessibility for any street segment and the increase in the crime rate. 

    To better illustrate the point, the Los Angeles Metropolitan Area is generally designed on the grid system. The network of streets allows traffic to leave congested roadways and traverse neighborhoods as an alternate route of movement. In 1996, the Los Angeles Police Department studied the effects of roadways on criminal activity, establishing barricades to stop thru traffic in high crime areas. The study concluded “closing thru streets makes offenders escape more problematic”. For the two years after the barriers were put in place drug activity, residential break-ins, drive-by shootings and homicides were reduced by 65%. Many other inner cities’ designs are based on grid patterns, New York City, Denver, Phoenix, Chicago, et al. This design increases the susceptibility to criminal activities in areas where poor maintenance, vacant buildings and low street traffic compound the pattern of crime.

    Common Destinations Attracting Non-Residents
    The principle of multi-use communities may provide a reduction of vehicular traffic, however multi-family and commercial uses draw non-residents into the neighborhood. Convenience stores, clubs and taverns operating well into the night provide a convenient venue for potential criminals to congregate and hang out.

    Land uses which attract individuals from outside the community provide a neutral location to observe the adjacent neighborhoods as well as a cloak of activity for criminals to remain unnoticed.

    Alley Access
    Many neo-traditional communities require alley access behind all single-family dwellings. Although this creates a more aesthetically pleasing streetscape and enhances walkability, it also increases the street permeability and opportunity to observe all sides of the house as a potential target for burglary. Alleys also provide an additional means of escape as well as a venue for criminal activity as its utilitarian design discourages social interaction providing a welcome area to foster and avoid detection for criminal enterprise.

    The current status of neo-traditional community planning is entering a crucial stage. The imposition of planning techniques to shape our future communities is forcing suburban growth into a dictated one-size-fits-all planning model endorsed and promoted at the federal level and enthusiastically supported by many states, local governments and most of academia. Without the flexibility to incorporate factors such as local values, market preferences and geographic character; future communities may result in higher housing costs, limit the selection of housing types while simultaneously enhancing the opportunity for criminal activity.

    Obviously, the negative consequences identified can be mitigated.  However, the key here lies in planning flexibility. Many communities enamored with neo-traditional concepts seek to impose absolute formulaic solutions which offer little flexibility in compliance with the technical standards rather than focusing on achieving the guiding principles which form the basis of the neo-traditional movement.

    Joe Verdoorn, a Principal at SEC Planning, LLC, has over 40 years land planning and development experience working with clients such as Pulte/Del Webb, Motorola, Apple and Hunt Investments.  He is a pioneer in the field of active adult community design who continues to research the retiree market to understand their evolving wants and needs. 

    Photo courtesy of BigStockPhoto.com.

  • Why Downtowns Fail and How They Can Come Back

    To many Florida developers in the last decade, downtown condo towers seemed to make a lot of sense. They were sold as the logical locale for active seniors and millennials, great affordable starter homes, and best of all, investments.  Reinvigorating downtowns became fashionable currency in many of Florida’s second and third tier cities. 

    Sadly, many of these new structures have turned into hulking shadows today in places such as Delray Beach, Tampa, and Orlando. Many of Florida’s core urban districts suffer the dark windows, unoccupied balconies, vacant storefronts and wide open sidewalks that signify the opposite of thriving urbanity.  Repairing this false renaissance in downtowns requires city leaders to see the central business district for what it really is: just another suburb needing attention to stay healthy, safe, and productive.

    Suburbs are heavily marketed by their developers with product launches, public relations campaigns and lavish sales centers.  Downtowns, on the other hand, produce websites, but rarely have more, relying instead on the desirability of a downtown address to fill up space.  Rental apartments in former condominiums are competing with the slickly marketed suburbs for people.

    In terms of buying, the suburbs are winning, with the more desirable single-family detached dwelling now suddenly affordable.  Suburbs are comfortable, safe, and familiar to most buyers.  Downtowns are seen as edgy, transitional, and alien to many people, but they are attracting adventurous renters and a few buyers here and there who want to create a new scene.  A scene is one thing; a stable social network and a feeling of safety and security is entirely another.

    What downtowns lack is the sense of neighborhood that many inner-ring suburbs have, and the outer-ring suburbs are effectively gaining.  Until downtowns start reinventing their identity, they will have a difficult time selling a sense of place among the empty lots and decaying infrastructure.  Touring the downtown residential properties today is like touring a movie set, with new developer inventory garishly contrasting with the older, grown-in building stock. Few dare to tread past the end of the fresh concrete sidewalk, and the urban infill efforts are sporadic and unconnected. But, unfortunately, this has always been the case.

    Central Florida’s downtowns have languished for years, raising the question of their reason for existence.  Competing with, and often losing to, suburban fringe developments like Westshore in Tampa, the decline of these downtowns began years ago.  Sanborn maps (fire insurance documents from the early 20th century) reveal that neither Orlando nor Tampa ever really had fully built-out downtowns.  Warehouses, garages, residences and small hotels have coexisted with empty lots forever in these cities.  While their potential has always been high, they have never realized it.

    Perhaps we ask too much from the current form of our cities.  Our urban core regulatory structure and property values are geared towards a level of development that never occurred, and might never occur, while the suburban fringe has no such constraint put upon it.  It is past time to think of our downtowns a bit differently, put aside our emotional ties to them as “centers”, and begin to look at them as neighborhoods.

    Compared to suburban tracts, Florida’s downtowns have a stiffer regulatory environment, with downtown development boards and aesthetic police to prevent all but the most deep-pocketed players from entering the game.  These citizen-led authorities may be emboldened with pure intentions, but they tend to focus on nitpicky, hair-splitting trivia.  Arguments about the size of a fence or the color of a stucco band seem absurd to most people who wonder when an empty lot might eventually boast thriving businesses once again.  Downtowns, with their guardians of taste, may be preventing the horror of chain link fence in the district, but are unconsciously slowing the growth of any real soul as well.

    Tampa’s “Channelside” expanded this city’s downtown eastward towards the Latin Quarter, Ybor City.  With one of Florida’s tiniest Central Business Districts at 1 square mile, Tampa saw grand marble bank lobbies go dark, repurposed to host blueprinters serving the local design and construction industry.  It was a post-apocalyptic experience to see industrial-size copy machines busy at work where a once proud bank traded money.  But such has been the fate of Tampa’s downtown, left behind by edge cities like Westshore and eastern fringe suburban development.

    The hard work of downtown redevelopment, however, took second priority to the easier work of condemning empty industrial warehouse tracts between Tampa’s downtown and its port.  Selling off large chunks to developers, Tampa created a new Channelside district, where a lovely two bedroom condominium can be had for $157,000 .

    Orlando’s downtown has no natural boundaries, but blends into 1920s historic neighborhoods, and it saw many condominium towers rise up as well.  Mostly rental units today, many of these have suffered through a phase when recent college graduates roomed together in granite countertop heaven, turning the luxury towers into post-college dormitories complete with drunken pool parties, busted drywall, and beer bottles littering the hallways.  Such behavior is characteristic of transitional residents, who have little investment in their surroundings and are for the most part barely past adolescence.  The downtown model isn’t working too well for adults, but it isn’t working too well for these post-adolescents, either.

    Downtowns would do well to reconsider their model, relax the beauty boards, and allow a greater variety of development, mixing in affordable residential ownership.  People who come to stay downtown for the longer term will be the ones who can turn them into neighborhoods. Currently, the downtowns of Central Florida only have business or commercial interactions, with a few still going to church downtown. The idea of a network of social interactions easily fits into a suburban neighborhood, where neighbors see each other, their kids play together, and they casually meet and converse. This model does not fit a downtown in Central Florida at the present moment.

    This function has to be transplanted into downtowns if they are to keep their relevance.  Rather than imagine the resurgence of the downtown as urban center – which never really took hold in much of Florida – cities need to realize that their next step is to start aggressively turning downtown into an alternative form of suburb.  Suburbs have consumer necessities like grocery and drug stores, conveniently accessible by driving; maybe in downtowns a bit of walking is OK.  Suburbs have consistent identities; maybe in downtowns a new set of sidewalks is in order.  Neighborhoods with loyal residents also have spontaneity and variety; maybe in downtowns the beauty police could give it a rest.  Suburbs have relative safety and security; in downtowns this must be provided also, and is non-negotiable.

    Such an idea may be anathema to many of Florida’s urban designers.  Yet, what downtowns need is what makes the suburbs so successful: safety, continuity, and ease of contact with neighbors.  Recasting a downtown as a suburb simply acknowledges the sense of neighborhood that most people now can only find on the suburban frontier.

    The exciting prospect of turning downtowns into neighborhoods may be the hard work of the next generation of urban residents. Achieving true neighborhoods again in the once-thriving cores of Florida’s cities means that the older building stock, mixed with the new, will begin to have meaning once again.   The heritage of these places and the stories these buildings tell is rich and vibrant. The ability to sustain them into the 21st century means that their contribution will not be lost.  Reintegrating our older centers with the rest of the city will make them some of the most interesting and varied places of all.

    Richard Reep is an Architect and artist living in Winter Park, Florida. His practice has centered around hospitality-driven mixed use, and has contributed in various capacities to urban mixed-use projects, both nationally and internationally, for the last 25 years.

    Photo courtesy of BigStockPhoto.com.