Category: housing

  • A New Story for Timeshare

    By Richard Reep

    More employment sectors are increasingly migratory and less fixated on a particular place. Many of us are instead working from home, or from places where we prefer – it might be a coffeeshop, or it might be a vacation condo. Housing’s rigid systems belong to the Old Economy.

    Meanwhile, a new form of housing less than 2 generations old has quickly gained ground as a part of the luxury leisure lifestyle of the middle class: timeshare. Unfortunately, during the real estate boom in the last several years, timeshares have been severely overbuilt, and the market is years, perhaps even decades, away from filling this oversupply. This form of housing is based not on real estate mortgages – although one or two companies still practice this – but based upon points. And the genius of the points-based residence is its transportability, which served the vacation market extremely well.

    By applying a points-based approach to primary housing, a developer will be able to take advantage of the increasing percentage of workers that move frequently for their careers. This unchains workers from their mortgages and lawnmowers, and enables the nomadic nature that has defined several segments of our economy where project-based employment has replaced company-based employment.

    Most timeshare developers privately agree: “The party’s over. It won’t be anything like it was, even if the economy comes back. At least not for a long, long time,” confessed one senior developer for an international timeshare company privately. Meanwhile, many of the communities who assumed a vast market of affluent customers need to start asking big questions.

    One of them is to refocus on the quality of places. Gated condominium developments, with little or no connection to the communities where they reside, are a study in self-absorbed lifestyles. Turning these into real homes and communities will require opening them up, integrating them into the local culture and civic life of their places, and making timeshares something other than…well, simply a commodity.

    It will also require some fundamental changes that are overdue in the timeshare industry itself. The points-based system was originally fabricated as a customer-loyalty system. It will need to be adapted to suit a worker wishing the flexibility to travel from place to place and stay for longer periods of time. Perhaps a more ominous dilemma that the timeshare developers have created for themselves, however, is the crushing maintenance fees, running often $750 to $1000 a week or more.

    The credit-backed future dreams of luxury and leisure remain idle, but the physical properties sit on some pricey and fundamentally attractive real estate at ski area bases, golf courses, desert getaways, and beaches. Few may be in the mood these days to buy a bunch of ephemeral points for a vacation, but the same system would serve well any project-based endeavor that assembles workers for an assignment and disbands these workers when the assignment is completed.

    The movie industry has operated on this model for years, and other industries have begun working in this same manner. In the Old Economy, this was rare, and most pursuits encouraged a young college graduate to put down roots as fast as possible: Start a career, start a family, and buy a house. Increasingly, however, entry-level workers have resisted this, preferring instead to experiment with multiple careers, often moving from place to place, sometimes until well into their thirties. In the technology industry, software developers have tended to work on this model, and especially in digital media, the permanent nature of jobs and companies has given way to temporary alliances and co-ops to get things done – the so-called Digital Nomads.

    Yet even as the workforce and its physical plants adapted, the housing industry instead has trudged along its same path, with mortgages or rental property as the two options. It is time for timeshare to fill the gap in between these two extremes and offer this as a third option. At this point, the timeshare industry has little to lose. Market contraction and the loss of its credit foundation have rendered these companies dormant. There needs to be a paradigm shift to recover at least some of these investments and, over time, create long-term value.

    Timeshare developers built plenty of beach resorts, which are still fairly active, but still can be turned into more semi-permanent communities. Their interior resorts – desert, golf, and ski areas – have an even more urgent need for reinvention. A stronger and more stable sense of community, safety and security, and higher quality of life could draw more workers away from the large metropolitan areas, as baby boomers downshift and global corporations onshore their workers.

    All this adds up to an opportunity for a timeshare developer who wants to fill his units with paying customers. When digital media employment is studied, it might resemble the timeshare model more closely than one thinks. Dominated by no one single old-economy company, digital media assignments are often accomplished by a temporary alliance of multiple small studios that work together, then decamp and move to the next assignment. This is a perfect scenario for a points-based housing system. Freed from the chains of the mortgage banks and from the landlord-lease situation, the points-based system enables free flow of workers who enjoy sampling the tastes of different cities and have no real interest in setting down roots, mowing lawns, and fixing leaky gutters.

    Ski timeshare properties in particular are quite ready for this shift in focus. Ski towns were built upon timber or mining town functions. They already have reinvented themselves and need to do this again. If these towns were to partner with their timeshare properties and incentivize technology and research employers, a new story and a new model could revitalize them.

    Marrying this desire to move to more low-density regions combines what timeshare developers do best – create amenity-laden residential communities – with a free-flow form of ownership. This approach is worth a closer look. We need to thaw the frozen residential concepts and look at new models and new stories that are happening in America and elsewhere. By adapting timeshare to the New Economy at this critical point, an industry can be repurposed and a new sustainable housing option can be born.

    Richard Reep is an Architect and artist living in Winter Park, Florida. His practice has centered around hospitality-driven mixed use, and has contributed in various capacities to urban mixed-use projects, both nationally and internationally, for the last 25 years.

  • The Fate of America’s Homebuilders: The Changing Landscape of America

    During the first ten days of October 2008, the Dow Jones dropped 2,399.47 points, losing 22.11% of its value and trillions of investor equity. The Federal Government pushed a $700 billion bail-out through Congress to rescue the beleaguered financial institutions. The collapse of the financial system in the fall of 2008 was likened to an earthquake. In reality, what happened was more like a shift of tectonic plates.

    History will record that the tectonic plates of our financial world began to drift apart in the fall of 2008. The scale of this change may be most evident in housing.

    PART TWO – THE HOME BUILDERS

    For decades, home ownership epitomized the American dream. For years, Americans saved their money for the required 20% down payment to purchase their dream home and become part of the great American Middle Class. They saved their money in a special account at the local savings & loan that paid a little more interest than the banks. Interest rates were fixed by law. A typical mortgage was written at a fixed rate for 30 years. Most American home owners stayed in their homes and celebrated the pay-off with a mortgage burning party.

    In this arrangement, it was understood that the savings & loans were allowed to pay more interest because they provided long term home mortgages. They paid depositors 4 – 5% and lent money at 6% making a little profit on the arbitrage for their risk. With a 20% down payment, there was little risk. Mortgage bankers knew the homes they lent money on and more importantly, they knew their clients. The mortgage stayed on the books at the local savings & loan until paid.

    In this time, home builders were mostly small local shops known by their customers and the lenders. For decades the industry was quite stable. Homes averaged 1,400 square feet in 1970 according to the National Association of Homebuilders. A quality home could be purchased for under $20,000. Not everyone could afford to buy a home but almost everyone aspired to this. Savings & loans provided 60% of all home mortgages.

    The first crack in the dam appeared in the late 1970s. Under President Jimmy Carter, America suffered double-digit inflation. As the value of the dollar eroded, Americans sought investments that could protect their dollars from the ravages of inflation. Regulation D prohibited banks from paying interest on checking accounts. A tiny bank in Massachusetts, the Consumers Savings Bank of Worcester, Massachusetts introduced the NOW Account (Negotiable Order of Withdrawal) and began paying a higher rate of interest than the savings & loans. Money flooded into the bank.

    The Depository Institutions Deregulation and Monetary Control Act of 1980 began the six-year process of phasing out limits on interest rate. Money flowed out of savings & loans and into NOW accounts and MMDA accounts (Money Market Depository Accounts). The S&Ls, with long term fixed loans on their books and short term money leaving for higher rates at the banks, never fully recovered. The primary source of funding for America’s home building industry was changed forever.

    In the late 1980s the S&L industry attempt to recapture market share by entering the equity side of real estate development with disastrous consequences. The government was forced to seize most of the S&Ls and sell off their assets through the Resolution Trust Company (RTC). In 1989, Congress passed TEFRA, the Tax Equity and Fiscal Responsibility Act that effectively outlawed direct ownership of property by S&Ls. It was a death blow to the industry and the end of the 30-year home mortgage as we knew it.

    This is where the seeds of the current housing disaster and financial meltdown were sown. Wall Street and politics entered the financial vacuum left by the demise of the savings & loan industry. The Garn-St Germain Depository Institutions Act of 1982 introduced the ARM (adjustable rate mortgage) which allowed rates paid to depositors to balance rates charged to borrowers. Our politicians, filled with good intentions, began down an irreversible path of using the home mortgage for social engineering.

    Seeking to increase homeownership, Congress began to unwind the financial safety net that protected the American dream for nearly 100 years. An ugly brew was concocted with the marriage of too much money and too much power. Congress began to consider housing as a right instead of a privilege.

    Over the ensuing quarter century, Wall Street and Congress conspired to turn the traditional 20% down, fixed 30 year mortgage on its ear. In 1977, they passed the Community Reinvestment Act that outlawed red-lining and forced lenders to make loans to poor neighborhoods. In 1982, they passed the Alternative Mortgage Transactions Parity Act (AMTPA) that expanded the funding and powers of Fannie Mae and Freddie Mac by lifting the restrictions on adjustable rate mortgages (ARM), balloon payment mortgages and the Option ARM (negative amortization loan). When a savings & loan made a mortgage in the past, they held it for 30 years or until paid. Freddie and Fannie became the new absentee owner of the majority of mortgages by purchasing them from the originators in the secondary market.

    Thus the die was cast. Mortgage bankers and brokers became salesman and paper pushers packaging applications for the secondary market and financial investors who never saw the asset they lent money against or met the borrowers for whom they made the loan. But this was not enough to satisfy the greed of Wall Street which invented the CMBS (commercial mortgage backed security) in 1991. This was nothing more than a private label pool of mortgages that they sold off to equally unconnected financial investors in their own secondary market. Home mortgage lending by commercial banks went from nothing to 40% of the market in a matter of years.

    The market could have possibly tolerated this bastardization of the conventional mortgage but neither Congress nor Wall Street could control themselves. There was simply too much money to be made. Congress determined that the credit score was discriminatory and violated the rights of the poor and minorities. In 1994, Congress approved the formation of the Home Loan Secondary Market Program by a group called the Self-Help Credit Union. They asked for and received the right to offer loans to first time homebuyers who did not have credit or assets to qualify for conventional loans. Conventional 80% financing was replaced with 90% loans and then 95% and finally 100% financing that allowed a home buyer to purchase a home with no down payment. The frenzy climaxed with negative amortization loans that actually allowed homes to be purchased with 105% financing.

    In June of 1995, President Clinton, Vice President Gore, and Secretary Cisneros announced a new strategy to raise home-ownership to an all-time high. Clinton stated: “Our homeownership strategy will not cost the taxpayers one extra cent. It will not require legislation.” Clinton intended to use an informal partnership between Fannie and Freddie and community activist groups like ACORN to make mortgages available to those “who have historically been excluded from homeownership.”

    Historically, a good credit score was essential to receive a conventional mortgage. Under pressure from the politicians, lenders created a new class of lending called “sub-prime” and as these new borrowers flooded the market, housing prices rose. Lenders used “teaser rates”, a form of loss leader, to help the least credit worthy to qualify for loans.

    Congress instructed Fannie and Freddie to purchase mortgages even though there was no down payment and no proof of earnings by the applicant. An applicant could “state” his or her income and provide no proof of employment. Stated income loans eventually became known as “liar loans”. Sub-prime loans grew from 41% to 76% of the market between 2003 and 2005.

    This devilish brew caused a record 7,000,000 home sales in 2005, including more than 2,000,000 new homes and condominiums. Mortgage lending jumped from $150 billion in 2000 to $650 billion in 2005. Prices rose relentlessly, pushed by more and more buyers entering the market. The top 10 builders in the United States in 2005 were:

    1. D.R. Horton – 51,383 Homes Built
    2. Pulte Homes – 45,630 Homes Built
    3. Lennar Corp. – 42,359 Homes Built
    4. Centex Corp. – 37,022 Homes Built
    5. KB Homes – 31,009 Homes Built
    6. Beazer Homes – 18,401 Homes Built
    7. Hovnanian Enterprises –17,783 Homes Built
    8. Ryland Group – 16,673 Homes Built
    9. M.D.C. Holdings – 15,307 Homes Built
    10. NVR – 13,787 Homes Built

    Economists and pundits eventually began to identify the phenomenon as the housing bubble. And, bubbles burst. But Congress was not ready to confront reality. Rep. Barney Frank testified he “saw nothing that questioned the safety and soundness of Fannie and Freddie”. Fannie Mae Chairman Franklin Raines was paid $91.1 million in salary and bonuses between 1998 and 2004. In 1998 Fannie’s stock was $75/share. Today it is 67 cents.

    In 2007 as prices stopped rising, the flood of buyers entering the market ceased putting market values into a free-fall. Home building is not a nimble industry. It takes years of planning and development to bring a project to market. America’s homebuilders had hundreds of thousands of homes and condos under construction when the housing market came to a crashing halt in the fall of 2008. New home sales, which topped 2,000,000 units per year in 2005, fell to an annual level of under 400,000 units in early 2009. Prices have retreated to 2003 levels and in some markets even lower.


    What happens to America’s home builders? Do they follow General Motors and Chrysler into bankruptcy? Can they survive? New home sales are down 80% since 2005 – doing worse even than automobile sales. The tectonic plates of the housing industry are shifting rapidly and have not settled into any discernible pattern.

    Residential land has dropped precipitously in value but a case can be made that raw residential land now has a “negative residual value”. There are hundreds of thousands of completed but unsold, foreclosed, and vacant, homes littering the countryside. The chart above demonstrates how dramatically sales have fallen since their peak in 2005. This “overhand” inventory must be cleared out before any recovery can ensue. The prices of these units must be cut by draconian margins to attract the bottom fishers and speculators who will take the risk from the home builders and purchase the outstanding inventory. This will not happen quickly. This is not a market that can generate an early rebound.

    Has Congress learned from its mistakes? Apparently not. In March 2009, Democratic Representatives Green, Wexler and Waters introduced HR600 entitled “Seller Assisted Down Payments” that instructs FHA to accept 100% financing from those who cannot fund the required 3.5% down payment.

    A year from now the landscape of America will be forever changed. Five years from now, will American ingenuity have revolutionized the home building industry? The imperative is to find homebuilders who can speed production and lower costs. And government needs to learn from its own mistakes and realize that a successful housing sector depends on solid market fundamentals as opposed to pursuing an agenda of social engineering.

    ***********************************

    This is the second in a series on The Changing Landscape of America. Future articles will discuss real estate, politics, healthcare and other aspects of our economy and our society. Robert J. Cristiano PhD is a successful real estate developer and the Real Estate Professional in Residence at Chapman University in Orange, CA.
    PART ONE – THE AUTOMOBILE INDUSTRY (May 2009)

  • Housing Downturn Update: We May Have Reached Bottom, But Not Everywhere

    It is well known that the largest percentage losses in house prices occurred early in the housing bubble in inland California, Sacramento and Riverside-San Bernardino, Las Vegas and Phoenix. These were the very southwestern areas that housing refugees fled to in search of less unaffordable housing in California’s coastal metropolitan areas (Los Angeles, San Francisco, San Diego and San Jose).

    Yet now the prices in these hyper-expensive markets are beginning to fall. Once considered widely immune from the severe housing slump, the San Francisco area now has muscled its way into the list of biggest losers. The newly published first quarter 2009 house price data from the National Association of Realtors indicates that prices are down 52.5 percent from the peak. Only Riverside-San Bernardino and Sacramento have experienced greater losses out of the 49 metropolitan areas with a population of more than 1,000,000 for which there is data (see table below). Other metropolitan areas that have seen prices drop more than 50 percent include Phoenix, Las Vegas and, for very different reasons, that rustbelt sad sack, Cleveland.

    Table 1
    Median House Price Loss: Metropolitan Areas Over 1,000,000 Population
    Rank Metropolitan Area
    Median House Price % Loss from 2000-2008 Peak
    Median House Price Loss from 2000-2008 Peak
          1 Riverside-San Bernardino, CA -57.7% $235,600
          2 Sacramento, CA -56.5% $219,600
          3 San Francisco, CA -52.5% $444,800
          4 Phoenix, AZ -51.9% $139,200
          5 Cleveland, OH -51.5% $74,300
          6 Las Vegas, NV -51.3% $163,800
          7 Los Angeles, CA -48.8% $289,400
          8 San Jose, CA -48.0% $415,000
          9 San Diego, CA -47.5% $291,900
        10 Miami-West Palm Beach, FL -47.3% $185,200
        11 Orlando, FL -43.1% $117,200
        12 Tampa-St. Petersburg, FL -42.2% $98,800
        13 Washington, DC-VA-MD-WV -37.3% $165,900
        14 St. Louis, MO-IL -35.8% $56,300
        15 Chicago, IL -35.2% $100,900
        16 Atlanta, GA -34.4% $60,600
        17 Memphis, TN-MS-AR -34.0% $49,400
        18 Providence, RI-MA -33.6% $102,600
        19 Boston, MA-NH -32.5% $140,200
        20 Cincinnati, OH-KY-IN -28.6% $42,600
        21 Richmond, VA -27.9% $66,800
        22 Indianapolis, IN -26.6% $34,300
        23 Minneapolis-St. Paul, MN-WI -25.9% $60,800
        24 Columbus, OH -24.5% $38,400
        25 Denver, CO -24.1% $61,200
        26 Birmingham, AL -23.2% $39,300
        27 Jacksonville, FL -22.4% $44,600
        28 Charlotte, NC-SC -22.1% $48,700
        29 New York, NY-NJ-PA -21.9% $104,700
        30 Virginia Beach-Norfolk, VA -21.2% $54,000
        31 Kansas City, MO-KS -20.4% $32,400
        32 Seattle, WA -20.1% $79,500
        33 Pittsburgh, PA -19.0% $24,300
        34 Hartford, CT -17.7% $47,800
        35 Portland, OR-WA -17.0% $51,100
        36 Baltimore, MD -16.3% $47,900
        37 New Orleans, LA -15.6% $27,800
        38 Philadelphia, PA-NJ-DE-MD -15.2% $37,000
        39 Louisville, KY-IN -15.1% $21,500
        40 Rochester, NY -14.5% $18,000
        41 Houston, TX -13.6% $21,800
        42 Dallas-Fort Worth, TX -13.5% $21,100
        43 Buffalo, NY -13.1% $15,000
        44 Milwaukee, WI -12.1% $27,800
        45 Salt Lake City, UT -6.7% $16,500
        46 San Antonio, TX -6.2% $9,800
        47 Austin, TX -6.1% $11,900
        48 Raleigh, NC -5.3% $12,600
        49 Oklahoma City, OK -3.3% $4,500

    Cleveland, the newest entrant to the “over 50” club, fell largely because of the collapse of its industrial economy. It remains the only one of the thirteen mega-losers without prescriptive land use policies (sometimes called “smart growth”), which raise house prices by rationing land for development and imposing more stringent regulatory requirements. Cleveland illustrates a point made in a previous commentary: that the huge house price losses in the housing downturn have spread broadly from the original metropolitan areas that precipitated Meltdown Monday, the Lehman Brothers bankruptcy on September 15, and the Panic of 2008.

    During Phase I of the housing downturn (through September 2008), the largest losses were concentrated in the “Ground Zero” markets of California, Florida, Las Vegas, Phoenix and Washington, DC. In each of these 11 markets, median house prices dropped at least 25 percent, with per house over $100,000 except in Tampa-St. Petersburg during Phase I. These markets, all with more prescriptive planning, accounted for nearly 75 percent of the gross house value loss in the nation, with other more prescriptive markets accounting for another 20 percent. The more responsive markets, where land use regulation follows more traditional market-driven lines, accounted for slightly more than 5 percent of the loss.

    The Chart below and Table 1 in The Housing Downturn in the United States: 2009 First Quarter Update financial collapse, however, now has spread the losses much more generally. In Phase II, the Ground Zero markets represented 44 percent of the loss, the other more prescriptive markets 38 percent and the more responsive markets 18 percent.

    As of the first quarter of 2009, prices had dropped in all major metropolitan areas. The average per house loss in the Ground Zero markets was still the highest, at 48 percent, though the overall all loss had increased to 34 percent.

    There are indications that the housing downturn may be slowing. The latest data indicates that the median house price increased in March, though not enough to forestall a loss in the first quarter. Another indicator is the fact that the Median Multiple (median house price divided by median household income) has fallen to a national level of 3.1, which is slightly more than the 2.9 historic rate and well below the 4.6 peak.

    The best news of all is that the Median Multiple has dropped to 3.8 in the Ground Zero markets, which is equal to the historic level and well below the peak of 7.3. In the other more prescriptive markets, the Median Multiple is at 3.5, above the 2.9 historic average but well below the peak of 4.8. In the more responsive markets, the Median Multiple has dropped to 2.6, just above the historic average of 2.5 and below the peak figure of 3.2.


    Prices have fallen so much that they now stand at historic 1980 to 2000 Median Multiple levels in 18 of the 49 metropolitan areas. Critically, this includes the Ground Zero markets of Riverside-San Bernardino, Sacramento, Phoenix and Las Vegas.

    Other Ground Zero markets have seen much of their price inflation whittled away, but still have a way to go. Prices need to decline $33,500 to reach the historic Median Multiple level in Los Angeles, $32,300 in Miami, $31,200 in Washington, $18,500 in San Francisco, $11,100 in San Diego and only $1,700 in Tampa-St. Petersburg.

    In other markets, however, prices still have some distance to go before the historic Median Multiple is reached. The largest decrease would have to occur in New York, at $122,000, followed by Portland ($95,000), Seattle ($94,000), Baltimore ($75,000) and Salt Lake City ($74,000). Other markets, including Philadelphia, Virginia Beach, Milwaukee and Ground Zero San Jose would need to have price declines of more than $50,000 to restore their historic Median Multiples. See Table 2.

    Table 2
    Median House Price Reduction Required to Reach Historic Price/Income Ratio (Median Multiple)
    Median House Price Reduction Required to Reach 1980-2000 Median Multiple
    Median Multiple
    Rank Metropolitan Area
    1980-2000 Average
    2000-2008 Peak
    Current (2009: 1st Quarter)
          1 New York, NY-NJ-PA $122,200             3.9            7.7           5.8
          2 Portland, OR-WA $94,700             2.7            5.4           4.4
          3 Seattle, WA $94,400             3.3            6.2           4.7
          4 Baltimore, MD $74,700             2.6            4.6           3.7
          5 Salt Lake City, UT $73,800             2.6            4.3           3.8
          6 Philadelphia, PA-NJ-DE-MD $61,500             2.4            4.2           3.4
          7 San Jose, CA $55,400             4.5          10.2           5.1
          8 Virginia Beach-Norfolk, VA $53,600             2.6            4.7           3.5
          9 Milwaukee, WI $51,400             2.8            4.4           3.8
        10 Boston, MA-NH $41,900             3.5            6.1           4.1
        11 Los Angeles, CA $33,500             4.5          10.1           5.1
        12 Miami-West Palm Beach, FL $32,300             3.4            7.0           4.0
        13 Jacksonville, FL $32,000             2.3            3.6           2.9
        14 Washington, DC-VA-MD-WV $31,200             2.9            5.3           3.3
        15 Providence, RI-MA $29,400             3.1            5.4           3.6
        16 Raleigh, NC $26,700             3.3            3.9           3.7
        17 Austin, TX $20,500             2.8            3.3           3.2
        18 San Francisco, CA $18,500             5.0          11.2           5.2
        19 Denver, CO $18,000             2.9            4.3           3.2
        20 Minneapolis-St. Paul, MN-WI $15,700             2.4            3.6           2.6
        21 Hartford, CT $14,300             3.1            4.2           3.3
        22 San Diego, CA $11,100             4.9            9.5           5.1
        23 Buffalo, NY $10,900             1.9            2.5           2.1
        24 Charlotte, NC-SC $10,100             3.0            4.1           3.2
        25 Richmond, VA $9,500             2.8            4.1           3.0
        26 Louisville, KY-IN $8,100             2.4            3.1           2.6
        27 Chicago, IL $7,800             2.9            4.8           3.0
        28 San Antonio, TX $5,200             3.0            3.3           3.1
        29 Orlando, FL $4,000             2.9            5.2           3.0
        30 Pittsburgh, PA $3,400             2.1            2.8           2.2
        31 Tampa-St. Petersburg, FL $1,700             2.8            4.7           2.8
    Las Vegas, NV  At or Below              3.4            5.3           2.7
    Riverside-San Bernardino, CA  At or Below              3.7            6.6           3.0
    Sacramento, CA  At or Below              3.6            5.6           2.8
    Memphis, TN-MS-AR  At or Below              3.0            3.1           2.0
    New Orleans, LA  At or Below              3.1            3.3           2.8
    Phoenix, AZ  At or Below              2.8            4.7           2.4
    Atlanta, GA  At or Below              2.4            3.1           2.0
    Birmingham, AL  At or Below              3.0            3.5           2.7
    Cincinnati, OH-KY-IN  At or Below              2.3            2.8           2.0
    Cleveland, OH  At or Below              2.2            2.8           1.4
    Columbus, OH  At or Below              2.4            2.9           2.2
    Dallas-Fort Worth, TX  At or Below              2.7            2.7           2.4
    Houston, TX  At or Below              2.5            2.9           2.5
    Indianapolis, IN  At or Below              2.1            2.3           1.7
    Kansas City, MO-KS  At or Below              2.5            2.9           2.3
    Oklahoma City, OK  At or Below              2.8            2.9           2.8
    Rochester, NY  At or Below              2.2            2.4           2.0
    St. Louis, MO-IL  At or Below              2.2            2.9           1.9
    Median Multiple: Median house price divided by median household income.

    These price reductions may or may not occur in over-valued metropolitan areas like New York, Portland and Seattle, all of which are also experiencing serious increases in unemployment. However, given the pervasive evidence that the market is returning to the vicinity of historic price ratios, it would not be surprising if significant price reductions happen in these metropolitan areas, which were previously seen and saw themselves as immune to the fallout that hit the less well-regarded ground zero markets.

    Additional information is available in:
    The Housing Downturn in the United States: 2009 First Quarter Update

    Wendell Cox is a Visiting Professor, Conservatoire National des Arts et Metiers, Paris. He was born in Los Angeles and was appointed to three terms on the Los Angeles County Transportation Commission by Mayor Tom Bradley. He is the author of “War on the Dream: How Anti-Sprawl Policy Threatens the Quality of Life.

  • Smart Growth? Or Not So Bright Idea?

    Smart Growth and New Urbanism have increasingly merged into a loosely aligned set of ideas. The benefits of this high-density housing viewpoint are fast becoming a ‘given’ to planners and city governments, but studies that promote the advantages often omit the obvious disadvantages. Here are some downsides that show a much different story:

    Smart Growth or Dumb Idea?

    One goal of Smart Growth is to move our society away from dependence on cars, and many Smart Growth plans intentionally make it difficult to drive through the neighborhood, making walking more inviting. Smart Growth planners advocate short blocks in a grid pattern to distribute traffic (vehicular and pedestrian) evenly within a development. These short blocks produce a multitude of 4-way intersections, and add a multitude of those trendy “turnabouts,” to make a bland site plan look more interesting.

    But all of this together destroys “flow”. On the other hand, in a grid planned neighborhood you might drive a straight line with an occasional turn, giving the impression of a much shorter drive than a curved subdivision. But with short blocks, a driver must stop completely, pause, then when safe accelerate through the intersection onto the next intersection, then repeat… multiple times. This scenario uses a tremendous amount of energy; the car eats gas.

    To understand this point clearly, go out and try to push a modern car. All the safety and convenience features, even in the most basic car sold today, add weight. Even a Toyota Prius is just under 3,000 lbs. While a given model may get great mileage the bulk of energy consumed is in getting the thing moving from a full stop. Should a vehicle maintain a constant flow (at any speed), the energy usage plummets, compared to stop-and-go traffic patterns that intentionally force conflicts.

    To make matters worse, the majority of vehicular vs. pedestrian accidents occur at intersections. Smart Growth designs have many more intersections than conventional suburban plans . Even more dangerous, Smart Growth walkways are placed close to the where the cars turns. Check out Traffic by Vanderbilt for an understanding of the psychology of driving.

    One may argue that cars will become more efficient. So what? This stop and go scenario also consumes time.

    Rooting Out Tree Issues

    Nobody can argue against the character of a tree-lined street… no one, that is, except the city Public Works department that must maintain structures being destroyed by trees growing in close confines to concrete walks and curbs. Smart Growth/New Urbanist compact front yard spaces are typically 10 feet or less. This simply cannot provide for enough room for tree growth when there is a 4’ wide walk typically a few feet away from the curb, the area where street trees grow. Without trees to define the street, these solutions have very little organic life to offset the vast volume of paving in front of each porch.

    Now and in the near future there will be a new era of solar heat and power, most of which will be mounted on the roofs of homes. Guess what blocks the sun’s energy? Yep – street trees! High density means that the proximity of trees to roofs will deter the sun’s energy from reaching those solar panels.

    Get Real About Presentations, Porches and People

    Typically, when a high-density development is proposed, the renderings show large green common areas bounded by homes with grand porches. The presentations usually show only a few cars parked along the street, and plenty of residents enjoying the spaces lined by mature trees that have had about 20 years of growth. This misrepresentation helps to win over councils, planning commissions and concerned neighbors. What is not shown in the presentations for approvals are claustrophobic, intense areas, such as the typical street most residents will live on, or perhaps the views down the alleys.

    There may be some neighborhoods that are built as represented, but architectural and land planning consultants are likely to stretch the truth more than a wee bit to gain approvals. Where can we see the original presentation images compared to what actually gets built?

    Those inviting large porches where neighbors sit and gossip in the presentation: Do they ultimately end up as stoops hardly large enough to fit a standing person? Those large mature trees: Are they actually just seedlings? Does the real streetscape have people walking on the typically narrow 4 foot wide walkways? How many people are walking along the roadway instead? Are the streets lined with just a few cars, as the renderings show, or are they packed with unsightly vehicles, while the nice cars are likely stored in the rear garage?

    The Evolution of Pavement

    Suburbs have changed during the last few decades. For example, in Minnesota thirty years ago an average suburban lot would have been 15,000 square feet and 90 to 100 feet wide. Today, 8,000 square feet and 70 feet wide would be more typical. In a conventional suburban plan, there weren’t any alleys, and the front loaded driveways were appropriately tapered. There were few side streets. The lots might have been 20% larger than in a Smart Growth high density plan, but the street layout might have had about 30% less linear feet of street compared to a Smart Growth grid layout. In the south, where the typical suburban lot is about the same size as that high density lot, the numbers favor the conventional layout even more; the total paved surface area could be 50% or more lower. So, the Smart Growth/New Urban plans place a greater burden on the tax payers to municipally maintain (more) paved surfaces.

    A Final Consolation…

    In reality, fire and police departments, as well as traffic engineers, review suburban development plans. And often the original high-density narrow street proposal doesn’t make it all the way to approvals. With or without the popularity of Smart Growth and New Urbanism, a much wider paved section or a compromised width is often the ultimate result.

    Rick Harrison is President of Rick Harrison Site Design Studio and author of Prefurbia: Reinventing The Suburbs From Disdainable To Sustainable. His websites are rhsdplanning and prefurbia.com.

  • Can Eddie Mac Solve the Housing Crisis?

    Every downturn comes to an end. Recovery has followed every recession including the Great Depression. In 1932, John D. Rockefeller said, “These are days when many are discouraged. In the 93 years of my life, depressions have come and gone. Prosperity has always returned and will again.” The question is not ”IF”, rather it is “WHEN” recovery will begin. The age-old question remains: what can government do to get the nation out of recession?

    Government can act wisely. In the past, it used tax legislation (the mortgage interest deduction) to create the highest home ownership rate in the industrialized world. It can also act stupidly by promoting “Sub-Prime” mortgages, “105%” financing and the “No-Doc” loan that got us into this financial mess. As many as 4.4 million more Americans could lose their homes – unless drastic action is taken to stop the process.

    Much of this was built on good intentions. One example of poor planning can be seen in Department of Housing Development’s “Dollar Homes” program. The HUD website describes this as an altruistic program “to foster housing opportunities for low and moderate income families” by selling homes for $1 after the Federal Housing Authority has been unable to sell them after six months.

    This sounds like a good idea but the program has become consumed by fraud and waste and has delivered little benefit to the parties intended. First, the policy eliminated any ability to sell the properties at market since it is clear that the value will be marked down to $1 in six months. The result was massive losses to the government as previously saleable properties were re-priced to $1. Second, the homes were snatched up by businessmen and the cronies of politicians who knew how to game the system. These homes were then sold on the retail market for huge profits. Very few homes made it to the needy parties intended. This dumb legislation created and fed a lazy, corrupt, bloated, ineffective and expensive bureaucracy.

    In contrast, smart legislation can end the housing crisis that threatens to send our economy reeling into the next Great Depression. A simple but effective governmental action does not have to cost a lot of money and more importantly, does not require a new permanent and expensive bureaucracy. It can be a win-win-win for federal government, local government and working families. This smart legislation is called Eddie Mac, which stands for the Empower Direct Ownership Mortgage Corporation.

    The genesis of Eddie Mac comes from the “good old days” when home prices were high. The most common complaint heard from police, fire, teachers, nurses and municipal workers was that they could not afford to live in the very communities where they worked. The lower wages of these groups forced them onto the freeways to more affordable neighborhoods in distant suburbs. The commute of hundreds of thousands of city workers across the nation clogged our roads, added harmful emissions to our atmosphere and exacerbated our dependence on foreign oil.

    Simply stated, the Eddie Mac program allows local government to buy vacant foreclosed homes from the banks and institutions. Local government then stimulates the local economy by hiring local realtors, appraisers and contracting with local labor to fix up the deteriorated properties. It then leases the properties to police, fire, teachers, nurses and municipal workers who otherwise could not afford to live in their own communities. Local government enters into an “Empower Direct Ownership Lease Option” with their employees so that the employees have the right to purchase the homes in the future using their rental payments to build equity. The Empower Direct Ownership Lease Option allows the employee to acquire the home in five years for the original purchase price plus 50% of the appreciated value.

    Instead of concentrating power in Washington, Eddie Mac empowers local government to solve their own local real estate economy. Eddie would employ local realtors to identify vacant foreclosed properties qualified for the Eddie Mac program. Realtors would earn a 1% fee for identifying and assisting local government with the acquisition. The purchase price would be set by a local appraiser who would also earn an appraisal fee. Use of local appraisers avoids banks profiting unfairly from a government program. The free market system would set the value. The purchase price would include an estimate of costs to bring the home back to local standards, using local workers to fix up these properties. Local government would obtain 100% financing for the acquisition from Eddie Mac bonds that would be sold on Wall Street along side of Fannie Mae, Freddie Mac and Ginnie Mae guaranteed loans.

    A $200,000 home, foreclosed upon, vacant and allowed to deteriorate has likely deteriorated to just $120,000. Its actual value will be determined by appraisal. At $120,000, a 4% guaranteed Eddie Mac mortgage would cost local government just $4,800 per year. Local government would be able to rent that home for $400 per month making it affordable to police, fire, teachers, nurses and municipal workers.

    The Empower Direct Ownership Lease Option allows the employee to acquire the home in five years for the original purchase price plus 50% of the appreciated value. If the baseline value is $120,000 and the home appreciates at 5% per year, it will increase in value $6,000 per year or $33,153 over 5 years. The employee’s Empower Direct Ownership Lease Option allows them to acquire the home in five years for the original purchase price plus 50% of the appreciation or $136,577. The price is $16,577 below market price, creating equity for the home buyer of $16,577 which can be used as the future down payment to acquire the home.

    This is a win-win-win scenario. Stopping the slide in home values by buying up foreclosed homes with federally insured 4% bonds is a low tech, low cost effort to put the brakes on the recession. And it entails no new bureaucracy. The Federal government is the big winner because they would be footing the bill for the bail-out if the economy continued to unravel. Local government wins by solving an age old dilemma of how to house its local work force. The local economy wins as fresh stimulus is put into the economy to locate, appraise, acquire, insure, repair, repaint and refurbish these homes. The city/county/municipal workers win with an opportunity to enjoy the American dream of home ownership in the very communities where they work. The environment wins as we take commuters off the road and lessen the environmental impact of their commute. And, we help reduce our dependence on Middle East oil as the ripple effect of tens of thousands of Eddie Mac homes are leased to local employees who now live and work in their own communities.

    Eddie Mac can become the firebreak to the mortgage crisis, the game changer needed to change market momentum. The hundreds and thousands of vacant foreclosed home sales generated by the implementation of the Eddie Mac program would send a strong signal to the public that the market has bottomed and the recovery has begun. Vacant homes would be acquired, fixed up and occupied by stable, important and long-term members of our communities.

    John D. Rockefeller once stood on the floor of the New York Stock Exchange and quieted the panic by firmly proclaiming; “Buy” in the dark days of the 1929 collapse. Our government can help stop the slide in prices by standing with our local governments and firmly encouraging “Buy” in the local markets. Reckless government got us into this mess. Smart government can get us out.

    Robert J. Cristiano Ph.D. has more than 25 years experience in real estate development in Southern California. He is a resident of Newport Beach, CA.

  • HOPE for Only One Homeowner with a $300 billion Price Tag

    The Housing & Economic Recovery Act of 2008 was passed last August. It created the HOPE for Homeowners Program, which the Congressional Budget Office estimated would help 400,000 homeowners to refinance their loans and stay in their homes. Here’s a stunning revelation: According to the Federal Housing Authority (FHA), in the first six months since the law was passed, exactly one (1) homeowner refinanced under the program!

    You can listen to the story on NPR, “Investors Support Overhauling Homeowner Program“. One such investor, PIMCO, supports programs that would reduce the principal balance on mortgages by a small amount in order to keep the cash flow coming from mortgage payments. Given what we know about investment strategies to push companies into bankruptcy in order to benefit from credit default swap payouts, I was initially leery of such statements coming from bond investors. Then I remembered the problem with the paperwork on the mortgages – if bondholders can’t prove ownership of the lien the homeowner keeps the house with no further payments. That’s when it started to make sense.

    Of course, if they can get the homeowners to come in for a re-fi they can correct the paperwork mistakes. It could be worth it to investors without default protection to accept principal reductions – if the homeowner goes into bankruptcy they may not be able to prove they own the mortgage without the new paperwork. With the re-fi, they get all new documentation.

    These programs were designed for homeowners who are current on their mortgage payments but whose homes are “underwater”, that is, the principal balance on the mortgage is more than the market value of the house. Some can keep up their payments with the hope that the market price of the home adjusts in the distant future; others might benefit by the modest reductions in principal favored by some bond investors. But in a situation described by a Stockton (CA) homeowner the principal reduction is unlikely to be enough – the home is worth $220,000 and the mortgage balance is $420,000. These homeowners’ best financial strategy is to take the hit to their credit report and default on the mortgage. Investors like PIMCO might, if their paperwork is good, get half their investment back by taking possession of the property; they’ll get it all back if they bought the credit default swap; and they get nothing if the paperwork is screwed up.

    How many mortgages are underwater? Bank of America’s annual report says that 23 percent of their residential mortgage portfolio has current loan-to-market value ratios greater than 90 percent. When they include home equity loans in the calculation, totaling lending on a residential property, the share with less than 10 percent equity rises to 37 percent. At the end of 2008, Bank of America held $248 billion in residential mortgages and $152 billion in home equity loans, after taking write-offs of about $4.4 billion last year. On the other hand, Wells Fargo did not specifically report the share of their portfolio with loan-to-market value ratios greater than 90 percent. It’s hard to tell just how many mortgages are how far underwater at an aggregate level. I would imagine that these numbers are being checked in the Treasury’s stress testing of individual banks.

    In any event, Congress is not giving up (although we almost wish they would before this gets any worse). The House Committee on Financial Services combined with the House Judiciary Committee has introduced a new bill to improve the old bill’s version of Hope for Homeowners. Trying to take it a step further, the House Financial Services Committee is holding hearings on a Mortgage Reform Bill next week. The plan is to set lending standards for all mortgage originators. Chairman Barney Frank (D-MA) is of the view that the “great economic hole” we are in was started by“ policymakers’ distrust of regulation in general, their enduring belief that markets and financial institutions could effectively police themselves.”

    With this we do agree: self-regulation in financial services is a root cause of our current economic disaster. Until it is completely removed – not just from mortgage lending but from all financial products and services – nothing Congress does will prevent another crisis.

  • Sydney: From World City to “Sick Man” of Australia

    Americans have their “American Dream” of home ownership. Australians go one step further. They have a “Great Australian Dream” of home ownership. This was all part of a culture that celebrated its egalitarian ethos. Yet, to an even greater degree than in the United States, the “Dream” is in the process of being extinguished. It all started and is the worst in Sydney.

    Sydney is Australia’s largest urban area, having passed Melbourne in the last half of the 19th century. With an urban area population of approximately 3.6 million, Sydney leads Melbourne by nearly 300,000.

    The “Great Australian Dream” in Sydney: Sydney incubated and perfected the Great Australian Dream. New housing was built in all directions from the central business district. The most expensive was built to the east and north, while the least expensive – the bungalows and other modest detached houses – rose principally to the west and the south. Western Sydney is the culmination of the Great Australian Dream for perhaps more middle and lower middle income households than any other place in the nation.

    Of course, Western Sydney was not planned in the radical sense of the word currently used by contemporary urbanists. In fact, most have little more regard for Western Sydney than for the shantytowns of Jakarta or Manila. Yet, the people of Western Sydney, like the people of countless modest suburban areas around the world, are proud of their communities and of their homes.

    Rationing Land, Blowing Out Land Prices: About three decades ago, Sydney embarked upon what was to become one of the world’s strongest “smart growth” programs (called “urban consolidation” in Australia). Aimed at concentrating population closer to the core, urban consolidation sought to restrict and even prohibit new housing on the urban fringe. Sydney developed its own equivalent of the famous Portland urban growth boundary. The result is that every land owner knows whether or not their property can be developed, and the favored understandably take advantage by charging whatever price the highly constrained market will bear.

    Reserve Bank of Australia research indicates that the price of raw land – Sydney urban fringe land for building a house that has not yet been fitted with infrastructure (sewers, water, streets, etc.) has now risen to a price of about $190,000 for a one-eighth acre lot. In the days before smart growth, the land would cost about $1,000. Needless to say, adding an unnecessary nearly $190,000 plus margins to the price of a house makes housing less affordable.

    But even where development is nominally allowed, government restrictions make building almost impossible. For years the state government has promised to “release” land for new housing on the western fringe. Yet despite announcement and re-announcement, there have been interminable delays.

    Destroying Housing Affordability: As a result, Sydney is now the second most expensive major housing market in the six nations in our Demographia International Housing Affordability Survey, trailing only Vancouver. Sydney’s Median Multiple (the median house price divided by the median household income) is now 8.3. It should be close to the historic norm of 3.0 or less. Indeed, if land prices had risen with inflation from before urban consolidation, Sydney’s Median Multiple would be less than 3.0. As a result, households entering the housing market can expect to pay nearly three times as much for their houses than was the case before. This will lead to an inevitably lower standard of living compared to what would have otherwise been.

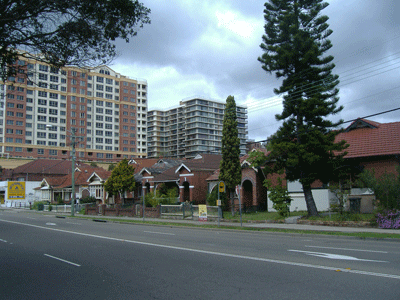
    Forcing Density: Urban consolidation is destroying not only housing affordability, but also the character of Sydney itself. Sydney is an urban area of low density suburbs. It is also an urban area of high rise living. These two housing forms have combined with one of the world’s most attractive geographical settings to create an attractive and livable urban area.

    The planners, empowered by the state of New South Wales government, are changing all of that. From the suburbs of Western Sydney to the attractive and more affluent North Shore suburbs, high-rise residential buildings are being thrust upon detached housing neighborhoods. One of Sydney’s great strengths is that the urban area has many local government areas (municipalities), empowering local democracy. These local governments have done their best to resist the state government densification mandates, in response to opposition from their citizens.

    Raw Exercise of Power: One of Sydney’s greatest weaknesses is that the state government exercises undue control over the municipalities and is using its power to “shoe-horn” high density into places where it makes no sense. High density is fine in the Toney Eastern suburbs, but has no place where detached housing is the rule. Unfortunately, the planners seem to presume communities with detached housing have no character worth salvaging.

    Urban Consolidation: Infrastructure Costs: Further, there is an inherent assumption that densification has no costs. The planners routinely exaggerate the cost of providing infrastructure on the urban fringes (failing, for example, to understand that much infrastructure is included in the price of the house, without government involvement). However, the infrastructure built for lower density detached housing is not sufficient for higher densities. As a result, there have been sewer overflows in densifying areas. Huge expenditures have been made for sewer upgrades. Tony Recsei, president of Save Our Suburbs, a community organization seeking to limit inappropriate densification, blamed recent power failures on an electricity infrastructure that was not built for high density in an April 7 Daily Telegraph letter, noting that “Cram in more people and overloading must result. That should not be too hard for people to understand.”

    Greater Traffic Congestion: And, of course, insufficient road expansion has been undertaken to accommodate the inevitable intensification of traffic congestion. The planners like to say that higher densities mean less traffic. In fact virtually all of the evidence, throughout the first world, indicates that more intense traffic congestion is associated with higher densities.

    Sydney is no exception. The average one-way work trip now takes 34 minutes, which equals that of America’s largest urban area, New York, which has more than five times the population and the land area as well as the longest travel time of any major urban area in the nation. Sydney’s planners delight in comparisons with Los Angeles, frequently suggesting that their regulations are necessary to ensure that Sydney does not “sprawl” as much as Los Angeles. Actually Sydney sprawls considerably more in relation to its population. The Los Angeles urban area is a full one-third more dense than the Sydney urban area. And despite the fact that nearly half of the planned Los Angeles freeway system was not built, Angelinos spend one hour less each week getting to work each than Sydneysiders. Even in Atlanta, with a pathetic freeway system little better than Sydney’s and one-third Sydney’s density, people spend an hour less commuting to and from work every two weeks and spend less total time traveling than in Sydney.

    The Economic Cost: There may also be an economic cost. Bernard Salt – perhaps Australia’s leading demographer – has predicted that Melbourne will overtake Sydney in population by 2028. Moreover, there has been substantial domestic migration from New South Wales to Queensland. At current growth rates this could lead the Brisbane-Gold Coast region being larger than Sydney by mid-century. Salt blames Sydney’s declining fortunes on its overly expensive housing.

    Sydney: World-Class City Status Threatened? Research in the United States has associated restrictive land use regulation with lower levels of employment growth in US metropolitan areas. In a more colorful finding, Australia’s Access Economics characterized the economy of New South as “so sick that it is at risk of adoption by Angelina Jolie.” A few decades ago, the English economy was referred to as the “sick man of Europe.” Sydney may well be on its way to becoming the “sick man of Australia.”

    Wendell Cox is a Visiting Professor, Conservatoire National des Arts et Metiers, Paris. He was born in Los Angeles and was appointed to three terms on the Los Angeles County Transportation Commission by Mayor Tom Bradley. He is the author of “War on the Dream: How Anti-Sprawl Policy Threatens the Quality of Life.

  • London Calling: Bad News For Home Buyers

    The demand for housing in London has outstripped supply since the post-war period, making housing unaffordable to a majority of the city’s low and middle-income families. And although the house price growth of the last two decades has reversed itself recently, it is far from clear that London’s housing problems are in any way diminished. The opportunities for first-time buyers to get into the game may be worse than at any time in recent decades.

    In some ways, the London housing market is unique. The buy-to-let market is almost entirely dominated by private individuals, rather than by big investment funds. For instance, in 2006, two-thirds of the buyers of new private homes in the city were mostly small investors, and the remaining were owner-occupiers. Over half of the buyers are UK-nationals; the rest are of foreign origin. Overseas buyers have been attracted by the idea of holding investments in Sterling, a currency historically seen as stable and appreciating. For instance, South Africans have been enthusiastic investors in London housing as a hedge against the Rand. The city is made up of 3 million dwellings, most of which were built before the 2nd World War, and so the market is almost entirely for second-hand property . In fact, newly built housing in any year constitutes less than half a percent of total stock in London.

    The city is also unusual in that most Londoners are 20 to 39 year-olds. The city’s in-migrants tend to be young, while out-migrants are likely to be older. As a result, not only has the number of households been growing faster than the overall population, but the average size of the household has been falling. The supply of three or more bedroom-flats has shrunk rapidly as a proportion of total supply; it fell to 14% in 2007-08, less than half the level 10 years ago. The supply of new one and two bedroom flats, however, has mushroomed over the same period. This trend is set to continue: of the 570,000 to 710,000 additional households that London will have by 2026, three quarters will be single person households.

    Initial evidence that sub-prime mortgages were defaulting in greater and greater numbers in the United States in February’07 did not seem to have an impact on the UK housing market up until November of that year. The following months witnessed the crash of house prices, which continued their free fall into the final quarter of 2008. According to the Department of Communities and Local Government, properties in the UK lost a record 11.5% of their value over the year ending January’09, although the rate of house price deflation eased slightly in the last quarter. In London, house prices fell by 16% over the same period (the average house price in Greater London is 53% above the UK average).

    Prior to that, the United Kingdom enjoyed a major house price boom for a decade. Growth was fueled primarily by low interest rates, which kept the costs of mortgage finance low, and by shortages in the property market. Financial deregulation and the entry of banks into the mortgage market in the 1980s and 90s meant increased competition and easy availability of mortgage finance. Add to this stable and growing employment in the city, rising incomes and expectations that interest rates would remain low, and the house price boom was hardly surprising. The boom meant that housing became increasingly unaffordable for Londoners.

    But even the recent recession-related fall in house prices and the slump in sales have not necessarily translated into better opportunities to get a foot on to the housing ladder. On the contrary, the current credit crunch is compounding the problem. Falls in house prices in recent months have been accompanied by tightening of mortgage access criteria. Even if a mortgage can be obtained, average deposits and payments remain much higher than average incomes. The average first-time buyer needed to borrow 3.27 times their average income (joint or individual) in 2008, as compared to an income multiplier of 2.42 in 2000, or 2.31 in 1990. Research also shows that Londoners are increasingly dependent on help from family, since deposits can be prohibitive.

    Recent analysis by the Royal Institute of Chartered Surveyors concludes that despite falling prices, London has seen the largest deterioration in housing market accessibility of any region, as would-be-buyers struggle to find deposits or secure affordable mortgages. Indeed, the volume of first-time buyers was 55% lower in August’08 as compared to a year ago, and it seems that in recent months they have been shut out of the housing market in growing numbers. A quarter fewer first time buyers are accessing the market now than at the bottom of the housing market crisis in the early 1990s, and levels are at their lowest for 30 years.

    Although 80% of the housing in the UK is sold on the private market, the government plays an important role by intervening in the market through the provision of social housing, provided through housing associations or registered social landlords. There has been a dramatic surge in the demand for social housing as the recession has started to bite: the housing waiting lists have grown. According to the National Housing Federation, an additional 80,000 are expected to lack a home owing to recession-related repossessions and unemployment.

    However, there are a few encouraging signs. According to government figures published in December’08, the number of new homes being constructed in London did not fall as much as one might have expected as a result of the credit crunch. This is heartening, seeing that house builders have been hit by lower prices, restricted demand, severe problems accessing credit and rising construction costs.

    And surprisingly, according to primelocation.com, house prices in four of the five prime areas in London actually rose in February’09. Central London (3.24%) and West/South-West London (2.84%) saw the highest increase, although prices for property outside of London continued to free fall. The reasons for the rise could be a recent jump in sales. The investor interest pick up might be the result of yields on property rental looking attractive compared to record-low interest rates.

    Rising rents, falling house prices and a potential glut of unsold new market homes can also provide an improved investment opportunity to larger institutions. In his Economic Recovery Plan, announced in December’08, the Mayor of London, Boris Johnson, put aside GBP 5 billion to be channeled into increasing the stock of affordable housing. The funds are also targeted at Londoners who are threatened with repossession, and to help would-be first-time buyers become home owners.

    For the time being, the private rental sector has absorbed the re-directed demand from the housing market, as more people delay buying a home in the current climate of uncertainty. Rents in London have been strong, in some cases even rising over the last few months, especially in the face of diminishing supply of buy-to-let housing. And although the change in average price from Feb-March’09 for central boroughs in London was positive, some of the outlying London boroughs continued to experience falling house prices. Since movements in house prices in London tend to anticipate those across the United Kingdom, these changes provide an indication of what the rest of the country may expect very soon.

    Megha Mukim is currently reading for a PhD at the London School of Economics. Prior to this she was a visiting fellow at the MacMillan Center for International and Area Studies at Yale University.

  • Kansas City and the Great Plains is a Zone of Sanity

    Over the past year, coverage of the economy appears like a soap opera written by a manic-depressive. Yet once you get away from the coasts – where unemployment is skyrocketing and economies collapsing – you enter what may be best to call the zone of sanity.

    The zone starts somewhere in Texas and goes through much of the Great Plains all the way to the Mexican border. It covers a vast region where unemployment is relatively low, foreclosures still rare and much of the economy centers on the production of basic goods like foodstuffs, specialized equipment and energy.

    People and companies in the zone feel the recession, but they are not, to date, in anything like the tailspin seen in places like the upper Great Lakes auto-manufacturing zone, the Sunbelt boom towns or, increasingly, the finance-dependent Northeast. Last month, for example, New York City’s unemployment experienced the largest jump on record.

    “That whole swath from Texas and North Dakota did not see either the bump or the decline,” notes Dan Whitney, a principal at Landmarketing.com, a real estate research company based in Kansas City, Kan. “People have a more conservative nature here. It’s just saner.”

    The housing market is one indicator of greater sanity. Kansas City housing prices dropped 7% between 2006 and 2008, compared with 10% in Chicago, 15% in San Francisco, 20% in Washington, D.C., and over 30% in Los Angeles. Houston and Dallas, the Southern anchors of the zone, have seen little movement either way in prices.

    One key measurement is affordability. The median multiple for Kansas City housing – that is the number of years of income compared with a median-priced house – has remained remarkably stable at under 3.0. In contrast, notes demographer Wendell Cox, the ratio approached up to 10 in places like Los Angeles and San Francisco, as well as something close to 7 in New York and Miami.

    The result has been that foreclosures – the key driver of many regional economic collapses – have been relatively scarce throughout the zone. This USA Today map reveals how the foreclosures are heavily concentrated in Florida, California, Arizona and Nevada, as well as parts of the old Industrial Belt of the Great Lakes.

    housing_foreclosure_565.jpg

    Analysis by my colleagues at Praxis Strategy Group of the job market’s condition also reveals the divergence between the zone and the rest of the country. Regions from the Northeast, the Great Lakes and the Southeast all have seen significant job losses, and the damage is spreading to the Pacific Northwest, New York and New Jersey. In contrast, the Kansas City area and much of the zone of sanity has experienced only a ratcheting down of its generally steady growth rate. Things are not bustling, but there seem to be few signs of a basic economic collapse.

    unemployment_state_565.gif

    unemployment_country_565.gif

    Sanity, as Whitney put it, may constitute a critical part of the equation. If you discuss why people live in a place like Kansas City, people tend to speak about stability, family-friendliness and the basic ease of everyday life. Many executives, notes Phil DeNicola, who runs Strong Suit Relocation, initially resist a transfer to the region but quickly see the advantages.

    “It is attractive to be here,” notes DeNicola. “You don’t get a lot of highs and lows for years. There is stability instead, particularly for families. It all reduces your stress.”

    Of course, not everyone is satisfied with the status quo. As in many second-tier urban centers, many in Kansas City’s leadership crave being something other than pleasant, affordable and stable. Leaders in the city – home to roughly one in four of the region’s 2 million residents – have been particularly exercised to show that KC can be as hip and cool as New York, L.A. or, at the very least, Chicago.

    “There’s a real kind of self-loathing here,” notes Mary Cyr, a Harvard-trained architect, who works on projects throughout the region. “We feel less than what we are. We do not know what we are as a city. We don’t even realize what we have.”

    Hundreds of millions have been poured and continue to pour into the usual monuments favored by urban policymakers and subsidy-hungry developers – a sparkling new arena, plans for an expanded convention center and a massive entertainment complex called the Power and Light District. Yet at the same time, the city’s budget, like many others, is severely strapped, so much so that City Hall is considering not turning on the city’s iconic fountains this spring.

    Even worse, city and regional issues seem to result in plenty of money for new expressions of wannabe grandiosity. One notable example: plans to build a $700 million-plus light-rail line, the kind of thing that has become the sine qua non for the “monkey see, monkey do” school of urban policymakers across the country.

    This project makes little sense in a region with a well-below-average percentage of jobs in its downtown core – roughly around 7% – with one of the lowest shares of transit-riding residents in the nation. The relative lack of traffic makes a rail system less sensible than could be argued for higher-density urban corridors, where it at least can be imagined that many would give up their cars.

    Ultimately, none of this taxpayer largesse is likely to do much more than replicate the same kind of development that can be found in scores of cities – from St. Louis to Dallas – that have tried it. At best, you get a few blocks of activity but very little in terms of urban dynamism.

    “The growth of downtown is not at all organic – it’s kind of forced,” notes architect Cyr. “They build all those projects in there, and you end up with the huge monumental buildings and the Gap.”

    The problem for the downtown crowd is that Kansas City has remained a quintessential American city, most dynamic in places where private initiative leads the way. Typically the bulk of new growth has taken place in the suburban fringes, but there are several successful nodes within the city, particularly around the lovely, 1920s vintage, privately developed Country Club Plaza area, famous for being the world’s first modern shopping center.

    Similarly, the artist-inspired Crossroads district has also evolved – largely without government help – into a genuine bastion of bohemians, with small companies and locally owned restaurants. With its low-cost commercial and residential space, as opposed to government subsidies, many see the area as precisely the kind of grass-roots urban life with a future in a place like Kansas City.

    Such developments in the city, as well as outside, make it possible to project a very bright future for Kansas City – and across the zone of sanity. Unless there is a massive shift in conditions, the zone should see a return to prosperity earlier than places bogged down with excess foreclosures, shuttering industries, soaring taxes and ever-tightening regulation. Dan Whitney, for example, expects the local housing supply to run out soon – with “tremendous pent-up demand” by the end of the year. If credit conditions improve, new construction should resume within the next 18 months.

    This all reflects the essential attractiveness of cites like Kansas City. Overall, in fact, its rate of domestic in-migration has been higher than much-celebrated Seattle and only slightly below that of Denver. Indeed, since 2000, Kansas City’s regional population has grown 8.6%, more than twice as much as New York, Boston, San Francisco or Los Angeles.

    Unlike the national media, which rarely focus on mundane things that drive most people’s lives, some seem to get the appeal of lower prices, affordable housing options and a generally calm environment. Although never a beacon for newcomers, like Phoenix, Atlanta or Dallas, Kansas City has not suffered the massive out-migration seen in such big metropolitan regions as Los Angeles, San Francisco, Chicago or New York.

    In fact, Kansas City has enjoyed a slow but steady in-migration through the past decade. These newcomers could provide the energy, talent and initiative that a region, known for stability, needs to get to the next level. Attracting more of them – not new prestige projects or subsidized developments – remains the key to the region’s future.

    Instead of trying to duplicate growth patterns that are foundering on the coasts and in countless Rust Belt cities, the denizens of the zone of sanity need to learn how to build on their virtues of stability and affordability. Particularly in hard times, such things count for much more than many – both inside and outside the region – might imagine.

    This article originally appeared at Forbes.

    Joel Kotkin is executive editor of NewGeography.com and is a presidential fellow in urban futures at Chapman University. He is author of The City: A Global History and is finishing a book on the American future.

  • While Fixing Housing, Fix the Regulations

    Everyone knows that subprime mortgages lie at the root of our current financial crisis. Lenders originated too many of them, they were securitized amidst an increasingly complex credit market, and the bubble popped. The rest is painful history.

    Most commentators have explained the source of the problem by pointing either to faulty federal housing policies – such as Fannie Mae’s affordable housing goals, the Fed’s easy money practices, and the Community Reinvestment Act – or to the imprudent zest for gain among investors who miscalculated risk and kept up the demand for bad mortgages. Both views are correct to varying degrees. These perceptions will shape the ongoing policy debate about needed reforms.

    But as this debate advances, we should not lose sight of another consequential, yet mundane, factor in the crisis: the way that regulations raised house prices and created conditions ripe for subprime loans. Regulations may be one of the least debated contributors to the current crisis, and yet their effect on the middle class’s ability to buy homes may arguably have been a key reason why subprime loans flourished in the first place.

    In the heated housing market before 2007, a median income family in the U.S. could only afford 40 percent of homes for sale across the country, compared to more than two-thirds of homes in 1997. Banks got creative and helped ordinary families buy overly expensive homes with risky mortgages. In a hot market, the risks seemed low. People never should have purchased homes they could not afford, but at the same time, rising prices were putting homeownership out of the reach of ordinary families such that unconventional loans seemed a convenient solution.

    Why were housing prices rising so rapidly? Observers have traditionally held that land scarcity drives up prices by preventing supply from meeting demand. But the more likely answer is that regulations on housing overly constricted supply in many parts of the U.S. Through the groundbreaking work of Wendell Cox at Demographia and scholars such as Ed Glaeser at Harvard and Joe Gyourko at the University of Pennsylvania, we have come to see that rules and regulations drive up housing prices much more than we had originally thought. Blaming supply problems on land scarcity has been a convenient excuse for too long for those who see hyper-regulation of housing as a good thing.

    Regulations often limit the number of housing units that can be built on a given lot, or they restrict the number of new home permits that can be issued in a given municipality, making supply a function of rules, not land scarcity. Restrictions to the property itself, such as environmental or design requirements, also raise the cost of construction (see Andres Duany’s thoughtful article on this issue here.).

    Increased regulation on housing has been a quiet, but disquieting, trend. For example, Glaeser has shown that only 50 percent of communities in greater Boston had restrictions on subdivisions in 1975, compared to nearly 100 percent today. Housing prices in the Boston area would have been between 23 and 36 percent lower on the eve of the crisis were it not for burdensome restrictions on housing. While the Boston area’s regulatory impulse may be excessive, it is nonetheless emblematic of a national trend. A recent U.S. Department of Housing and Urban Development has found that more than 90 percent of the subdivisions in a recent national study now have excessive restrictions.

    According to Harvard’s housing research center, the growing cost of regulations has edged smaller builders out of the construction market and increased the market share of the nation’s ten largest builders from 10 to 25 percent since the early 1990s. This doesn’t mean that the larger builders are happy about restrictions. Bob Toll, president of one of the nation’s largest builders, has said that his company quit building “starter homes” for young families years ago because the margins on small homes grew too narrow due to excessive regulations.

    How big is the problem? Most observers have typically agreed that housing regulations account for 15 to 35 percent of a median-priced home in the U.S. These percentages come from a 1991 federal housing commission, and they are likely to have increased considerably since then. If we conservatively use them to calculate the scope of regulations by the time the housing crisis began in earnest in 2007, they suggest that regulations accounted for between $35,850 and $83,650 of a median-priced home. Using the National Association of Homebuilders’ methodology for determining the impact of price increases on home affordability, we can say that regulatory restrictions priced at least 7 million – and as many as 18 million – families out of their local housing markets in 2007. As we have learned, families priced out of their markets still purchased homes – usually with unconventional, risky mortgages.

    Of course, not all housing regulations are bad, and zero regulation would introduce unnecessary risks to homeowners. But the increasing rate of regulation in the U.S. represents one of the nation’s larger assaults on the middle class that defenders of “working families” rarely talk about. Conservatives avoid the issue for federalism reasons, since any effective restraint on land-use planners will likely require the federal government’s involvement. And liberals hide from an honest debate about the effects of regulations for fear that it will derail their environmental agenda that relies up on regulations to limit the kind of housing most people want – such as single family homes.

    Now that there is an over-supply of housing in the U.S., the problem of housing regulations may seem moot. But if we do nothing about this issue, it will trip us up again in the future. While I served in the George W. Bush White House between 2005 and 2007, economists inside and outside the administration offered mixed – and sometimes completely contradictory – assessments of what was happening in the housing sector. We continued to work on our proposed reforms of Fannie and Freddie and the Federal Housing Administration in an effort to reduce the “systemic risk” but approached it more as a theoretical matter than as a perceived, impending crisis. We even had a HUD-based initiative on reducing regulatory barriers that quietly lumbered along but which we never elevated as a major policy issue. We now know that what we were grossly underestimating the scope of a potential crisis. We should have made housing sector reform a front burner issue.

    That is all behind us now, and we can see much more clearly what led to the crisis. We need to look at how rule-makers have for too long been making housing unnecessarily expensive for ordinary families. There is a limit to what the federal government can and should do about local housing regulations, but options exist for President Obama and Congress to consider.

    First of all, just as federal agencies are legally required to analyze the environmental impact of new regulations, Congress could require federal agencies to demonstrate the impact of new federal regulations on the cost of home construction. Federal agencies already have the personnel required for the task, and such a requirement would cost the taxpayer nothing extra. Second, Congress should consider new incentives in existing federal law, from highway construction to affordable housing, that would prompt states and municipalities to reduce burdensome regulations in exchange for federal resources. Third, President Obama could issue an executive order requiring federal agencies to amend regulations that have a negative effect on home construction costs. He could also use the same order to establish a task force whose job would be to identify the chief price-increasing regulations in use around the country to inform the legislative process.

    If we ignore the problem, as the housing market recovers, regulations will once again make housing more expensive than it should be. Unconventional mortgages will no longer be available due to the current crisis, and we will be back in a familiar debate about “affordable housing” in which the federal government is called upon to subsidize housing that others have made too expensive. In other words we return to the status quo in which we once again increase the role of a government that – under both Republican and Democratic administrations – has gotten ever bigger, more expensive and increasingly intrusive.

    Ryan Streeter is Senior Fellow at the London-based Legatum Institute and former special assistant to President George W. Bush for domestic policy.