Category: housing

  • Homesteading Detroit

    I was in Detroit recently for the Congress for New Urbanism, the Strong Towns gathering, and a Small Developers Workshop. I used Airbnb instead of the corporate hotel option while in town.


    c5c26459-7aac-4bb9-8551-4f32bbe3ee04

    IMG_3272 (1024x683)

    3d8901d3-8940-41c7-b3ee-3f1ab363ef85

    dc613c34-9a0e-4703-a6b2-f617c096ad49

    e295af4c-4a56-4511-8a36-f51d779bff0a

    66b0716b-00d9-4a6c-bff8-248ad7e70d50

    dff01bb7-2176-4b01-8a4c-60199b81f376

    IMG_3340 (1024x683)

    This is what $13,000 buys you in Detroit. Well… $13,000 and four years of blood, sweat, and tears. Detroit allows people with the right attitude to substitute personal effort for money. This solid brick century old duplex is within bicycle distance of downtown and it came with the adjacent vacant lots. This young couple paid cash from savings and is homesteading in the city. They live upstairs and rent out the downstairs to visitors like me.

    IMG_3251 (1024x683)

    IMG_3261 (1024x683)

    IMG_3132 (1024x683)

    IMG_3188 (1024x683)

    When people have a spacious comfortable place to live with no rent or mortgage they have time to pursue their real interests. Gardening, woodworking, metalworking, fashion, painting…

    IMG_3087 (1024x683) (2)

    87333c7d-b83c-488e-942c-0de9c1ac2d9d

    58e21315-c170-4107-b1ac-9a446e914272

    IMG_3229 (1024x683)

    IMG_3203 (1024x683)

    Instead of taking jobs that would chain them to someone else’s schedule and values the couple continuously cultivates small ventures from their home. The internet allows them to reach out to a global customer base with their Frontier Industry.

    IMG_4695 (1024x683)

    IMG_4702 (1024x683)

    IMG_4795 (1024x683)

    IMG_4782 (1024x683)

    IMG_4709 (1024x683)

    I’ve said this before. I’ll say it again. If you’re tired of spending $1,000 a month for your share of a rented two bedroom apartment with five room mates in Brooklyn or San Francisco… do what Americans have always done. Hitch up your Conestoga wagon and head out to the territories. It’s a big country. Be a pioneer.

    John Sanphillippo lives in San Francisco and blogs about urbanism, adaptation, and resilience at granolashotgun.com. He’s a member of the Congress for New Urbanism, films videos for faircompanies.com, and is a regular contributor to Strongtowns.org. He earns his living by buying, renovating, and renting undervalued properties in places that have good long term prospects. He is a graduate of Rutgers University.

  • Outer California: Sacramento Sends Jobs (and People) to Nashville

    A reader comment on a feature by John Sanphillipo (“Finally! Great New Affordable Bay Area Housing! Caught my eye.”). The comment ("You shouldn’t have to go to Nashville") expressed an understandable frustration about the sad reality that firms leaving coastal California often skip right over the Central Valley “where the housing costs are reasonable, there are some lovely old homes on tree lined streets, the humidity is less, the mountains are nearby, and you can drive there in 2-3 hours rather than fly.”

    Would that it were true. In fact, as this article will show, housing costs are anything but reasonable, given the median income, in the Central Valley, which along with the rest of the non-coastal portion of the state, will be referred to as Outer California in this article.

    California Housing Affordability: Into the Abyss

    California’s severely unaffordable housing is legendary, having escalated from approximately the average national price to income ratio in 1970. This is most evident in the four largest coastal metropolitan areas, Los Angeles, San Francisco, San Diego and San Jose. Out of the 87 major markets (over 1 million population) in nine nations, these markets ranked fourth, seventh and in a ninth place tie for the least affordable 8n the 12th Annual Demographia International Housing Affordability Survey. Their median multiples (median house price divided by median household income) required from 8.1 to 9.8 years income to purchase the median priced house. This compares to the affordability of these and other California markets which had median multiples of approximately 3.0 or less in 1970 and in prior years (Figure 1).

    The housing unaffordability of these markets, with an average median multiple of 8.8 is rivaled by the smaller coastal markets (such as Monterey County, San Luis Obispo, Santa Barbara and Ventura County), with their median multiple of 7.0. Both market categories are rated as severely unaffordable. But housing has become seriously unaffordable even in Outer California, where the average median multiple is 4.7(Figure 2). House prices have been escalating relative to incomes in Outer California since the housing bust, before which their housing affordability was even worse than now (below).

    Housing Affordability in Outer California

    A few examples will make the point. Riverside-San Bernardino, and exurban metropolitan area adjacent to Los Angeles had a severely unaffordable median multiple of 5.2 in 2015. Sacramento, had a seriously unaffordable median multiple of 4.7. Both of these major metropolitan areas reached far higher median multiples in the run-up to the housing bust, with Riverside San Bernardino reaching 7.6 and Sacramento reaching 6.6.

    But the problem is by no means limited to the largest metropolitan areas. Stockton, now officially a part of the larger San Jose-San Francisco combined statistical area as a result of a housing cost driven exodus of commuters from the Bay Area has a severely unaffordable median multiple of 5.3. Things were much worse in the run-up to the bust, at 8.6. Even long depressed Fresno, far from either the Bay Area or Los Angeles, is nearing severe unaffordability, with a median multiple of 5.0 and reached 7.2 during the bubble. More remote Chico, one of the smallest US markets in the Demographia survey also has a median multiple of 5.0 (see Central Valley map at the top).

    Modesto, a 2020 candidate for addition to the San Jose – San Francisco combined statistical area due to the overspill of households seeking houses they can afford, also has a seriously unaffordable median multiple of 4.5. Modesto reached 7.6 during the bubble.

    Among the 29 markets rated in California, the most affordable was Bakersfield, which in a few years is likely to follow Fresno into the over 1 million category. During the bubble, Bakersfield reached a median multiple of 6.6. Small town Visalia, nestled against the Sierra foothills, tied Bakersfield’s most affordable 4.3 median multiple, and reached an astounding 5.8 during the bubble. Hanford also tied for the most affordable.

    The comparison to the bubble peaks is particularly important because it illustrates the volatility of housing markets. Even in small markets, house prices are prone to explode when demand exceeds supply, due in large part to land use regulatory and environmental law structure that restricts housing even in more remote areas,   driving prices up (See William A. Fischel, Regulatory Takings). Figure 3 shows that California house prices in each of the three geographic categories were even more unaffordable during the bubble than today.

    Even at their current housing affordability levels, the housing markets of Outer California are considerably overpriced. This is indicated by Figure 2, which compares the median multiples in Stockton, Fresno, Bakersfield, Modesto, Redding, Chico, Merced, Madera and the Imperial Valley’s El Centro with severely unaffordable and overregulated Portland, Seattle and Denver, as well as Nashville and other major markets that are more affordable than any in California (Figure 4).

    Indeed, out of the 231 US markets in the Demographia International Housing Affordability Survey, the 27 California markets represent nearly half of the 58 most expensive.

    Meanwhile, a recent report by Zumper indicated among the 50 largest municipalities in the nation, four of the most expensive seven are also in California, with the city of San Francisco ranked number one, followed   San Jose at third, the city of Oakland at fifth and the city of Los Angeles at seventh. Eight of the most expensive municipalities out of the 100 largest are also in California, such as Palo Alto in the Bay Area, Coronado in the San Diego area and Santa Monica in the Los Angeles area.

    As if the regulatory and legal structure that combined with the artificially higher demand from loose lending policies were not enough, barely a decade later California is in the process of implementing one of the most radical land-use regulatory structure in a liberal democracy. It will be far more difficult in many areas to build the detached housing that is been the mainstay of the state, which already has the highest urban population density in the nation (see: “California declares war on suburbia"). This suggests that housing affordability is likely to worsen further.

    There is good reason for a both companies and middle income households to stay away from or leave California.

    More than Housing Affordability

    But people and businesses are moving to places like Nashville for reasons other than housing affordability. The state could hardly make it more clear that most business is not welcome. For at least 10 years, CEO Magazine has rated California as having the least favorable business climate. With competition like Illinois, Connecticut and New Jersey, to be ranked 50th with such regularity is a notable underachievement.

    Data recently released by the California Manufacturers & Technology Association (CMTA) indicated that California ranked last among the states in per capita attraction of manufacturing investments in 2015. Corporate relocation specialist Joseph Vranich continues to add to a long but for California unfortunate list of companies and jobs that have recently left the state (see: "California companies had for greatness – out of California).

    Of course, California is a beautiful place with one of the best climates in the world. But   millions of people and many companies have found greener pastures in Nashville, Austin, Dallas-Fort Worth, Houston, Charlotte, Atlanta and elsewhere. People will continue to visit, but the exodus is likely to continue.

    Wendell Cox is principal of Demographia, an international pubilc policy and demographics firm. He is a Senior Fellow of the Center for Opportunity Urbanism (US), Senior Fellow for Housing Affordability and Municipal Policy for the Frontier Centre for Public Policy (Canada), and a member of the Board of Advisors of the Center for Demographics and Policy at Chapman University (California). He is co-author of the “Demographia International Housing Affordability Survey” and author of “Demographia World Urban Areas” and “War on the Dream: How Anti-Sprawl Policy Threatens the Quality of Life.” He was appointed to three terms on the Los Angeles County Transportation Commission, where he served with the leading city and county leadership as the only non-elected member. He served as a visiting professor at the Conservatoire National des Arts et Metiers, a national university in Paris.

    Photo: Map of Central Valley (Sacramento Valley to the north, San Joaquin Valley to the south) courtesy of the U.S. Geological Survey

  • Dublin Facing Another Housing Bubble?

    In a recent column in the Sunday Independent, Ireland’s largest weekend newspaper, one of Ireland’s leading economists, Colm McCarthy of University College (Dublin) raised the prospect another housing bubble in Dublin, Ireland’s leading weekend newspaper. Dublin is the nation’s capital and home to approximately 40% of the population. This is a potentially serious concern, given the economic devastation that the previous Dublin housing bubble contributed to across Ireland during 2006-2010.

    The Housing and Economic Bust in Ireland

    Ireland suffered one of the worst economic reversals of any nation during the Great Financial Crisis. This had been preceded by Ireland’s impressive economic advance, which had the nation registering a higher gross domestic product per capita-purchasing power parity (GDP-PPP) than even its former colonial overlord, the United Kingdom. Anyone who had predicted in 1960 that Ireland would be more prosperous than the United Kingdom would have been summarily dismissed.

    But the Great Financial Crisis brought an 11.3 percent reduction in GDP-PPP to Ireland between 2006 and 2010. This was nearly double the reduction in the United Kingdom (6.0 percent). The loss was nearly three times the peak to trough decline in the United States (4.0 percent). Unemployment reached above 15 percent and Ireland required bail-out loans totaling €67.5 billion ($75 billion or C$95 billion) from the European Union and the International Monetary Fund.

    Happily, however, Ireland has struggled back and now has nearly reached its peak 2006 GDP-PPP. But as in the United States and elsewhere, restoration of previous levels of prosperity at the national level has not made whole many of the individual victims of the downturn (Figure 1).

    Urban Containment Policy and Higher House Prices

    In a previous Sunday Independent commentary, McCarthy noted asserted  Ireland’s land use regulations had been an important contributor to the housing bubble (see: “Urban Containment and the Housing Bubble in Ireland”).

    Ireland’s planning regulations have been copied and imported from the British Town and Country Planning Act of 1947, which have been largely responsible for the continuing and worsening housing crisis in the United Kingdom. In Ireland, as in the United Kingdom, these regulations deny planning permission to suburban locations. McCarthy attributes the "dysfunctionality of the housing market" in Dublin to such land use restrictions, which are called "urban containment” as well as other terms (such as growth management, smart growth, livability, compact city policy, etc.).

    McCarthy notes that the housing shortage in Dublin is not caused by a lack of housing so much as it is by restrictions imposed by planners (planning permission), which slows the pace of home building. This policy environment drives house prices up, which reduces household discretionary incomes and results in a lower standard of living than would have occurred without urban containment.

    Urban Growth Boundaries

    As elsewhere, Ireland’s urban containment policies seek to minimize the urban footprint (urban land area) by rationing land for housing development, often by urban growth boundaries. Urban growth boundaries come in various forms, such as lines around cities that forbid new urban residential development on the outside, euphemistic "growth areas," usually small and  inadequate, outside of which building is not permitted. This includes the apparent intention very difficult to build new detached housing on the urban fringes in California metropolitan areas, with a strong policy preference for high density, transit oriented development. Urban growth boundaries may be urban containment’s "killer app."

    The problem is that restricting the supply of any good or service (such as land for housing) leads to higher prices as demand swamps supply (other things being equal). A similar relationship between supply restrictions and higher prices can be seen in the fluctuating price of oil, based especially on OPEC production decisions, the large increases in banana prices in Australia, when periodic cyclones produce shortates by devastating crops.

    Urban growth boundaries and related land rationing strategies are associated with huge price differentials between land that may or may not be developed. In Auckland and Portland, virtual “across the street” land values vary on average by 10 or more times at the urban growth boundary. In the United Kingdom, differences of hundreds of times have been cited in the UK by London School of Economics researchers Paul Cheshire, Max Nathan and Henry Overman. The impact of urban growth boundaries on land within a metropolitan area is illustrated in Figure 2. The theoretical economic relationship is that land prices are forced higher within the urban growth boundary, while declining to the outside, where development is severely restricted (other things being equal, with the assumption that the urban growth boundary is “binding,” or strongly enforced).

    Not surprisingly, urban growth boundaries are the most common feature of the severely unaffordable housing markets (where the median multiple exceeds 5,0) in the 12 annual editions of the Demographia International Housing Affordability Survey.

    The Next Housing Bubble?

    McCarthy details rising land and house prices in the Dublin area that have largely driven first time home buyers out of the Dublin area. Many are being forced to buy housing that is affordable 70 to 80 kilometers (35 to 40 miles) away. This requires “a daily commute of up to two hours through the vacant countryside. “McCarthy refers to the "huge rolling prairies of land that can be found north and west of the ring road” (The M-50 belt route) on which new housing could be built as close as 10 to 12 km from the city center (6 to 7 miles).

    The locations McCarthy refers to could easily shelter households in less expensive housing, without the necessity of long commutes, producing, ironically, perhaps  less of the dreaded “sprawl”.

    Not surprisingly, rents in Dublin are now reported to be higher than at the peak of the property bubble. Further, the problem is spreading to other parts of the country. In Cork, with its burgeoning information technology growth, with firms like Apple and Pay Pal, there are concerns that the shortage of housing could limit further business expansion.

    Needed Reform

    A Dublin and an Ireland interested in not repeating the devastating economics of a decade ago would be wise to heed economist McCarthy’s advice. He calls for cheaper housing, which requires “the zoning for residential development of the very large volume of derelict and undeveloped land in the Dublin area.” Ireland’s middle-class needs more jobs, but it also needs lower house prices to maintain its affluence.

    Photograph: Dublin by Barcex (Own work) [CC BY-SA 3.0], via Wikimedia Commons

    Wendell Cox is principal of Demographia, an international pubilc policy and demographics firm. He is a Senior Fellow of the Center for Opportunity Urbanism (US), Senior Fellow for Housing Affordability and Municipal Policy for the Frontier Centre for Public Policy (Canada), and a member of the Board of Advisors of the Center for Demographics and Policy at Chapman University (California). He is co-author of the “Demographia International Housing Affordability Survey” and author of “Demographia World Urban Areas” and “War on the Dream: How Anti-Sprawl Policy Threatens the Quality of Life.” He was appointed to three terms on the Los Angeles County Transportation Commission, where he served with the leading city and county leadership as the only non-elected member. He served as a visiting professor at the Conservatoire National des Arts et Metiers, a national university in Paris.

  • Luxury Urban Housing, Built on a Myth, Is About to Take a Big Hit

    From steamy Miami to the thriving cores of cities from New York, San Francisco, Houston and Chicago, swank towers, some of them pencil thin and all richly appointed. This surge in the luxury apartment construction has often been seen as validation of the purported massive shift of population, notably of the retired wealthy, to the inner cities. Indeed with the exception of a brief period right after the Great Recession, there was slightly greater growth in core cities than the suburbs and exurbs. It was said that we were in the midst of a massive “return to the city.”

    Yet in reality the movement to the inner core has been much less spectacular than that. Indeed by 2014, growth once again was faster not only in traditional suburbs but also in the exurban areas that were broadly predicted to be the most doomed. At the same time, the fastest city growth, notes economist Jed Kolko, occurred largely in the most “suburbanized” cities, like Phoenix, San Antonio, and San Diego.

    One major meme for the luxury developers had to do with well-off retirees—the one domestic population with the money to afford such housing. Newspapers have been crammed with anecdotal stories about this “trend.” Yet analysis of Census trends among seniors shows that the senior percentage share in both the inner core and older suburbs dropped between 2000 and 2010 while growing substantially in the newer suburbs and exurbs. The most recent data show these patterns continue. Since 2010 the senior population in core cities has risen by 621,000 while the numbers in suburbia have surged by 2.6 million.

    So who’s buying them? It’s wealthy foreign nationals, largely as investments. In many cases these units are not really residences but pieds-a-terres for the world’s wealthy; in some markets, as many as 60 percent of units are not primary residences. But such sales are susceptible to changes in foreign economies. And today, many of these buyers must contend with slowing economies at home.     

    Perhaps most damaging has been the decline in many countries, such as Russia, Brazil, Argentina, Canada and some countries of the Middle East, that have been hit hard by the commodity slowdown. Most critical in many markets, particularly in California, has been the economic slow-down in China, now the largest foreign investor in U.S. real estate. In some markets, like Irvine and in Bay Area suburbs, Chinese investors have accounted for upwards of 30 percent of all buyers.

    Realtors in Southern California, long a favored destination for Asian investors, report a significant slowdown in investment , particularly along the coast. In some developments, roughly half the Chinese buyers paid cash, often well over $1 million per unit. This in markets where barely 10 to 20 percent of the houses are affordable to the median income family.

    Perhaps nowhere in urban America better epitomizes the relationship between foreign capital and high-end real estate than Miami. From 2004 to 2008, Miami enjoyed a massive luxury housing boom, with over 20,000 new units constructed—only to see many go them vacant for years.

    The last five years have seen a resurgence once again. As  fortunes were being minted, foreign money tended to end up invested in Miami’s luxury towers.

    Now this dependence on foreign investment may wreak havoc. Some sources of investment, such as  Russia, are drying up as low oil prices dissipate the wealth of that country’s free-spending oligarchs, and now must cope with sanctions over the annexation of the Crimea. In 2013, Russian buyers accounted for 23 percent of Miami luxury condo buyers; in 2014 they accounted for just 7 percent.

    But in Miami, the big story has been the Latin Americans. Like the Russians, the major Latin American investors have been hard hit by declining oil and other commodity prices. In 2014, luxury developer Gil Gezer thanked Brazilians, for turning around the Miami high-end condo market; now they seem to be driving the market down.  In the fourth quarter of 2015 the number of Miami Beach condo transactions declined nearly 20 percent from a year earlier, while inventory jumped by nearly a third, according to a report from appraisal firm Miller Samuel Inc. The median sales price slipped 6.6 percent. As prices drop and sales slow, more than half a dozen projects have been cancelled.

    South Florida may be the ultimate mecca for luxury developers, but it’s hardly alone in facing a high-end property crash. Over the past decade, New York has been inundated with ultra-expensive high-rise real estate. The new towers have affirmed the city’s fundamental attraction to the ultra rich. In Lower Manhattan, 31 towers with over 5,000 apartments are sprouting up, with a median price for condos of $2.43 million, a 70 per cent increase since 2013. The overall Manhattan condo market has shot up “only” 54% to $1.84 million.

    As in Florida, some of the problem stems from the retreat of foreign investors. Analyst Sami Karan suggests that rather than a massive demographic evidence of a “return to the city” by the ultra-rich, the luxury surge  seems to be mostly a matter of investment strategies that can change more quickly than shifting one’s long-time domicile.

    Not surprising then that some developments are being stalled across Manhattan. Property Markets Group and JDS Development Group, developers of the 111 West 57th Street, a 60-unit tower have announced that the once-imminent sales launch at the 60-unit tower would be pushed back for at least a year. In other cases, once ballyhooed  conversions of office towers to condos—notably the famous “Chippendale” Sony/ATT building located at 550 Madison Avenue—have been shelved, signaling that some well-fed rats may be deserting the luxury yacht before the fall. The city faces what new analysis by the consultancy Miller Samuel could be a glutted luxury market for the next five years.

    But over the past few years, no luxury market has been more over-heated than San Francisco. As occurred in the 1990s, the city’s luxury market has ridden the current tech bubble to unprecedented heights—in the process creating what may be one of the most severe real estate bubbles in the country. In the city proper, the median value of homes has skyrocketed, from $670,000 at the beginning of 2012 to $1.12 million today, a gain of more than 67 percent, according to Zillow.com.

    Now there  are signs that this boom is about to slow. This stems from two factors—the inability of consumers to afford this housing and the gradual slowdown of the tech bubble. The 87 tech IPOs over the past two years are trading 80 percent below their IPO price, and not surprisingly, venture capitalists are become more wary. Many key firms—Twitter, Hewlett Packard, Yahoo—are all laying workers off.

    All this suggests that, as in Miami and New York, San Francisco property owners face stagnant or even declining prices. The market could be further weakened as  tech workers and  companies head to more affordable markets  elsewhere. 

    Right now the decline in the luxury market has not yet turned into a full-on crash in multi-family housing. But there are some worrisome warning signs, such as rising apartment vacancy rates. Already some markets, such as Houston, seem to be overbuilt, particulary given weakness in the area’s critical energy sector. Other urban cores  threatened by overbuilding include such disparate cities as Indianapolis, Raleigh-Durham, Denver and Atlanta. According to the consultancy firm Costar, vacancies in downtown areas are  reaching double digits in such attractive markets as Boston, Charlotte and Philadelphia.

    In some areas like San Francisco and New York, a rollback of multi-family prices could be beneficial, because high prices are driving young, educated people out to other regions. Since 2010 educated millennials have been headed increasingly to more affordable regions such as Nashville, Orlando, New Orleans, Houston, Dallas-Fort Worth, Pittsburgh, and Columbus. Even Cleveland and California’s exurban Inland Empire, which still has relatively reasonable housing prices, at least by California standards, aregrowing their millennial workforces faster than places like New York or San Francisco.

    Young people may also benefit as units shift  from condo to rental.  Of course, the weakening market won’t be too good for the investors, developers and landlords, many of whom embraced the “back to the city” mantra with religious zeal and now will have to confront demographic reality.

    But other trends suggest that this decline may be more painful than many suspect. We may be entering a phase where we have reached  “peak urban millennials” as they head into their 30s, get  married and move  to the suburbs.  The idea that investing in the urban core, and in luxurious density, guarantees a happy result has now lapsed into mythology. It needs to be replaced with something that more accurately effects not what developers hope (or planners decree) but what people need, and can afford.

    This piece originally appeared at The Daily Beast.

    Joel Kotkin is executive editor of NewGeography.com. He is the Roger Hobbs Distinguished Fellow in Urban Studies at Chapman University and executive director of the Houston-based Center for Opportunity Urbanism. His newest book, The Human City: Urbanism for the rest of us, will be published in April by Agate. He is also author of The New Class ConflictThe City: A Global History, and The Next Hundred Million: America in 2050. He lives in Orange County, CA.

    Wendell Cox is principal of Demographia, an international pubilc policy and demographics firm. He is a Senior Fellow of the Center for Opportunity Urbanism (US), Senior Fellow for Housing Affordability and Municipal Policy for the Frontier Centre for Public Policy (Canada), and a member of the Board of Advisors of the Center for Demographics and Policy at Chapman University (California). He is co-author of the “Demographia International Housing Affordability Survey” and author of “Demographia World Urban Areas” and “War on the Dream: How Anti-Sprawl Policy Threatens the Quality of Life.” He was appointed to three terms on the Los Angeles County Transportation Commission, where he served with the leading city and county leadership as the only non-elected member. He served as a visiting professor at the Conservatoire National des Arts et Metiers, a national university in Paris.

    Photo by Marc Averette (Own work) [CC BY 3.0], via Wikimedia Commons

  • Finally! Great New Affordable Bay Area Housing!

    These are highly educated well paid workers at a San Francisco tech company. They’re mostly young. Some are single. Some are newly coupled. Some are married with young children. There are exceptions, but they tend to want to live in a vibrant urban neighborhood with a short commute rather than a distant suburb.


    Screen Shot 2016-05-27 at 11.08.39 PM

    Screen Shot 2016-05-27 at 11.07.30 PM

    Screen Shot 2016-05-27 at 11.08.07 PM

    Screen Shot 2016-05-27 at 10.51.05 PM

    Screen Shot 2016-05-28 at 1.45.52 AM

    Screen Shot 2016-05-28 at 1.46.17 AM

    Screen Shot 2016-05-28 at 12.17.05 AM

    Some enjoy living in a rented apartment above a trendy wine bar right on the edge of the downtown core. They can effortlessly pop down for a drink or a bite to eat with friends. When the weather is good they can ride a bicycle to work and skip the traffic congestion for a healthy commute.

    Screen Shot 2016-05-28 at 1.42.07 AM

    Screen Shot 2016-05-27 at 10.51.21 PM

    Screen Shot 2016-05-28 at 12.01.20 AM

    Screen Shot 2016-05-28 at 12.15.42 AM

    Others choose to own a loft style condo above shops. They can step outside their door and immediately find good food, good company, clothes, groceries, a hairdresser… most daily needs are close at hand.

    Screen Shot 2016-05-27 at 11.47.16 PM

    Screen Shot 2016-05-27 at 11.49.00 PM

    Screen Shot 2016-05-27 at 11.48.28 PM

    Screen Shot 2016-05-27 at 11.48.44 PM

    Screen Shot 2016-05-27 at 11.51.15 PM

    Still others love a little detached cottage in a courtyard with shared garden space. This arrangement provides all the benefits of a traditional home on a smaller scale.

    Screen Shot 2016-05-27 at 11.47.41 PM

    Screen Shot 2016-05-27 at 10.58.08 PM

    Screen Shot 2016-05-27 at 10.58.38 PM

    Screen Shot 2016-05-27 at 10.58.24 PM

    Then there are those who gravitate toward a regular stand alone single family home – of various styles, sizes, and price points.

    IMG_0794 (1024x694)

    Screen Shot 2016-05-27 at 10.59.59 PM

    Screen Shot 2016-05-28 at 1.44.50 AM

    Screen Shot 2016-05-28 at 12.06.05 AM

    Screen Shot 2016-05-27 at 10.56.40 PM

    Screen Shot 2016-05-27 at 10.52.34 PM

    In this new development all of these options are available on a single block just a ten minute bike ride from downtown. This is exactly what San Franciscans desperately want and someone has finally figured out how to build it at a price people can afford…

    Screen Shot 2016-05-28 at 12.16.10 AM

    Screen Shot 2016-05-28 at 2.17.00 AM

    Screen Shot 2016-05-28 at 2.21.31 AM

    Screen Shot 2016-05-28 at 2.21.04 AM

    Screen Shot 2016-05-28 at 2.20.38 AM

    Screen Shot 2016-05-28 at 2.20.21 AM

    …in Nashville. Uber, Lyft, Eventbright, and many other tech companies that began in San Francisco have all opened branch offices in Nashville. The standard offer is simple. Relocate to Tennessee, take a 30% pay cut, and enjoy a much higher quality of life with much more cash left over at the end of each month. Go ahead. Soak up the complimentary affordable home ownership.

    John Sanphillippo lives in San Francisco and blogs about urbanism, adaptation, and resilience at granolashotgun.com. He’s a member of the Congress for New Urbanism, films videos for faircompanies.com, and is a regular contributor to Strongtowns.org. He earns his living by buying, renovating, and renting undervalued properties in places that have good long term prospects. He is a graduate of Rutgers University.

  • The Cost of NOT Housing: A New Report

    This is the introduction to an new report "The Cost of NOT Housing" authored by Joel Kotkin for the National CORE Symposium on Affordability of Housing. Download the entire report (pdf) here.

    It is a commonplace view that housing does not contribute to the overall fiscal and economic condition of cities. Recent trends—both nationally and here in California—suggest that this is not the case. New housing, including affordable units, provide some direct stimulation through construction jobs, but also allow people, particularly young families, to stay, work and shop locally. Lack of affordable housing ultimately drives people, particularly the entry level and young educated, out of regions where their labor would be coveted by local companies.

    Some in the real estate industry, seeing ever higher prices, do not see a crisis here. Yet the current real estate “bubble” is not a durable replacement for a strong, sustainable economy. Older owners, and land speculators with a hold on scarce developable parcel, may do well under such conditions, but draining household finances for rents depresses retail sales, and makes saving for a home purchase ever more difficult.

    The problems are particularly relevant to areas like the Inland Empire and the Central Valley, whose economies depend on the migration of middle and working class families seeking more affordable housing. Yet developing such houses—critical to future economic growth—has been greatly constrained by a regulatory regime that works to reduce housing growth, particularly for single family houses, in the periphery. The result has been steadily escalating rents and house prices across the state.

    To meet the needs of its increasingly diverse population, and particularly the next generation, California needs to reform its regulations to more fully reflect the needs and preferences of its citizens. Once the home of the peculiarly optimistic “California Dream”, our state is in danger of becoming a place good for the wealthy and well-established but offering little to the vast majority of its citizens who wish to live affordably and comfortably in this most blessed of states.

    Download the entire report (pdf) here.

    Joel Kotkin is executive editor of NewGeography.com. He is the Roger Hobbs Distinguished Fellow in Urban Studies at Chapman University and executive director of the Houston-based Center for Opportunity Urbanism. His newest book, The Human City: Urbanism for the rest of us, will be published in April by Agate. He is also author of The New Class ConflictThe City: A Global History, and The Next Hundred Million: America in 2050. He lives in Orange County, CA.

  • Are Compact Cities More Affordable?

    Housing affordability has been a tenacious and intractable urban problem for as long as stats have been kept. Several cities recently declared it a crisis. But what kind of problem is it? Opinions vary widely. An economic problem, or a social one? A land resource issue? Or, as traded wisdom would have it, the result of reliance on the wrong urban form? Proposed solutions vary accordingly. Now, new evidence rules out one potential source of unaffordable housing: clearly, it is not an urban form problem. The widely-believed theory that a city’s lack of affordable housing can be fixed with increased compactness — when combined with public transit — is apparently wrong.

    In a recent article we questioned a publicized correlation between a compactness index level (i.e., urban form) and housing affordability. The argument supporting compactness is that it enables the use of public transit and active mobility modes, which reduce transport expenses sufficiently to eclipse the higher cost of housing prevalent in compact districts. We challenged that assumption, and found that data from eighteen US regional metro regions showed no such effect. Even if it were at all present, it would not be sufficiently pronounced to be an effective solution. Those conclusions were based on a regional look at the problem.

    While the aggregate regional data undermined the urban form theory of affordability, what do sub-regional level data show? At this finer level, could the housing-plus-transportation burden work to the advantage of households? To answer this question, we used data from 18 districts of the Metro Vancouver (BC) region. In this case, the official data exclude certain types of households — a critical limitation. But, given that such disaggregated data are rare, an effort at deciphering their meaning is warranted.

    The two subject groups were Working Homeowners and Working Renters. First, we looked at whether or not the working homeowners could find accommodation that suited their income without stretching themselves thin.

    Chart #1 shows the progression of housing costs in each sub-regional district, and the corresponding household median income. The in-step slopes of the two data sets suggest that working home-owning households have housing costs in tune with their earnings. This implication is further confirmed by the strong correlation (R2= 0.8598) between their income and their housing expenses.

    Housing costs that are proportional with income are a positive sign, but can these homeowners actually make their mortgage payments without financial stress? The data says yes, they can. This group’s average ratio of housing payments to income is 26%. It never exceeds 30%, the accepted threshold of financial strain.

    Instructively, from an urban form perspective, the highest ratios occur in the central, compact district; a confirmatory finding. Equally expected are that the lowest cost-to-income ratios occur in districts furthest from the center; these districts are either suburban or exurban.

    But are any of these home-owning households disadvantaged by excessive transportation costs due to their location? The data show a normal, average transportation expense of 14% of income and a range from about 8% to 20%. The ratios do increase with distance, but bear no significant correlation with income (R2= 0.0178).

    When choosing the place of residence, do homeowners consider housing costs, but disregard transportation costs? If so, could this lead to an affordability problem as measured by the combined costs? Apparently not. Chart #3 graphs (blue line) this group’s cost burden for combined housing and transportation (H+T) expenses, which never exceed the recognized affordability threshold: 45% of income.

    Conclusion? Metro Vancouver’s 305,000 households of working homeowners with mortgages aren’t experiencing financial strain due to their housing costs, no matter what their preferred housing form, location or transportation arrangements. The urban and suburban locations of the city structure fully satisfy their housing and transport needs. Neither compactness nor its absence has a negative impact on their finances.

    The data paints an entirely different picture for the 224,000 working households that rent their accommodations. Their average H+T burden (Chart #3; orange line) is 51% of their median income, and it ranges from the 45% threshold of affordability to an extreme of 65%.

    This picture, however, is not the result of high housing costs; rents register in the affordable range in all locations but two. The average working renter’s housing cost is 26%, which mimics that of a homeowner, and the range is below the stress level of 30%, with only two outliers (out of 18 districts) at 35% and 45% of income. For renters, as is the case for homeowners, the highest housing costs occur in the more compact districts. The outliers are found in elite social cluster districts — highly desirable neighborhoods — entirely unrelated to urban form.

    Given that rent costs are within the affordable range in all but two locations, we may infer that the Metro Region provides a sufficient range of housing costs for this group in its current urban/suburban structure.

    These findings are reinforced by the proportionality of incomes and housing expenses for both homeowners and renters. The incomes of renter households range from 45% to 63% of homeowners by location, and their rent costs are from 45% to 65%, an almost identical range.

    It would seem, then, that the excessive H+T burden renters face can be attributed partially to the transportation costs of this group. However, contrary to expectations, of the six districts that have rapid rail service (sky-train; black markers on Chart #3), not one manages to have a total burden below the affordability threshold. That even goes for the two suburban districts that offer the lowest rents.

    Chart #4 clearly shows the division between the earnings of owners and renters, and the affordability threshold that separates them. The belief that a compact urban form provides a path to solving housing affordability problems appears untenable.

    Overall, the data shows that for working homeowners there are no locations in the Metro Vancouver Region, whether urban, suburban or exurban, that push housing costs or the combined costs of housing and transportation above the affordability threshold. Urban form is not affecting budgets in these households.

    For working renters, rents are affordable in 16 of the 18 districts, whether urban, suburban or exurban. However, when transportation costs are added to their housing costs, the new sum puts them in financial stress, even in districts served by rapid rail transit.

    This sub-regional, limited analysis confirms the findings of our earlier regional look: compactness and access to transit do not produce the affordability benefits that have been claimed. The compact urban form does not equal more affordable living, particularly for the less affluent.

    Fanis Grammenos heads Urban Pattern Associates (UPA), a planning consultancy. UPA researches and promotes sustainable planning practices including the implementation of the Fused Grid, a new urban network model. He is a regular columnist for the Canadian Home Builder magazine, and author of Remaking the City Street Grid: A model for urban and suburban development. Reach him at fanis.grammenos at gmail.com.

    Flickr photo by Nick Kenrick: The Neighbourhood of East Van

  • Manhattan Ultra-Luxury ‘Battling the Serpent of Chaos’

    The deceleration of China and resulting commodities crash have created a problem for developers of ultra luxury condominiums.

    The ancient Egyptians believed that the sky was a solid dome, the belly of the goddess Nut who arched her body from one side of the horizon to the other. Every day, the sun god Ra emerged in the east and sailed in his boat across the sky until dusk when he disappeared in the west by dipping below the surface of Nun, the ocean upon which the whole flat earth floated.

    This story would have been useful two years ago when Manhattan real estate was soaring and many participants were proclaiming that the sky was the limit. It turns out that that particular sky, the ‘real estate sky’, is not as infinite and rich in wonders as the real sky. It is instead very finite like the sky of ancient Egyptian cosmology, its hard boundary formed not by Nut’s belly but by the marginal buyer’s stomach for paying ever rising prices.

    Until recently, the strong Chinese economy and resulting surge in commodity prices had fueled an economic boom in many developing countries. With this boom came rapid wealth to a segment of the population sometimes referred to as the oligarchy, or the world elite, or the global UHNW (ultra high net worth) class. And with that wealth, largely earned within the borders of countries with an unpredictable polity, came the logical and prudent decision to place some of it abroad where the likelihood of seizure or expropriation by unfriendly authorities was deemed to be low or nonexistent.

    There seemed to be a large conduit, a money superhighway, running beneath the world’s oceans through which trillions of dollars flowed smoothly for thousands of miles from that Chinese demand to that commodities boom to that sudden wealth and finally to this prudent decision. A great many of this conduit’s outlets were invisible and hidden in the hushed basements of Swiss or other offshore private banks. Yet others were semi-visible in the proliferation of hedge funds, private equity funds and other ventures solely dedicated to the management of paper assets.

    And finally some outlets were very visible in the real estate markets of London, New York, Miami and other cities. The trillions of dollars on the money superhighway traveling inbound from Russia, China, Brazil, Qatar and other places have seeded and fertilized Manhattan’s Billionaire’s Row on 57th street and other parts of Midtown, resulting in the sudden emergence, like weeds out of the ground, of tall and super-tall condominium towers.

    If they were trees instead of buildings, they would follow the normal cycle of nature rationing their reserves in winter and flourishing in the summer. But human constructs are less well calibrated and real estate cycles can be difficult to navigate. It takes a long time to carry a new building from conception to delivery. Few developers have the wherewithal or the resources to make big plans in the trough of a bust. But many embark on long cycle projects during boom times, accepting the risk that completion may not come before the next downturn.

    IMG_4249

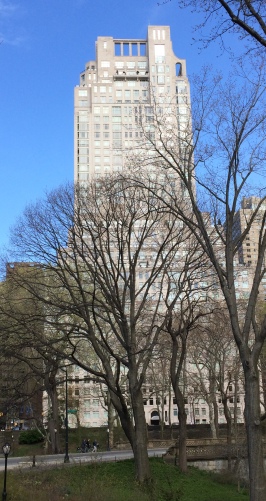
    15 Central Park West.

    Until now, the way to market these new condominiums was to sell as many units as possible pre-construction or during construction, thereby transferring the time-related risk to the buyer. This approach worked beautifully in recent years as evidenced by the huge success of the Time Warner Center, 15 Central Park West and of a good part ofOne57, the first in this cycle among several tall ultra-luxury towers.

    How did we get here in the first place? And why was Manhattan a choice destination for this foreign wealth? The answer is that, in addition to offering the promise of secrecy and safety, new condominiums benefited from lax regulation and zoning and preferential tax treatments.

    When secrecy was no longer as readily on offer at Swiss private banks, foreigners shifted their sights to other havens and found US real estate to be a uniquely welcoming alternative. Here, it was still possible for agents to transact via shell companies that were organized onshore or offshore, ostensibly to conceal the identity of foreign parties who preferred to remain anonymous.

    A recent Washington Post article explains:

    What many Americans might not realize is that foreign-owned shell companies play a big role in the U.S. economy through the real estate market. When purchased through a shell company, an offshore company or a trust, U.S. real estate offers wealthy foreigners a stable and secretive investment.

    In the last quarter of 2015, 58 percent of all property purchases of more than $3 million in the United States were made by limited liability corporations, rather than named people. Altogether, those transactions totaled $61.2 billion, according to data from real estate database company Zillow.

    And further:

    The U.S. government doesn’t ask real estate brokers to monitor their clients for money laundering risks, the way that banks and other financial institutions – and real estate brokers in some other countries — are required to do. The 2001 Patriot Act gave the Treasury Department the ability to do this, but lobbying from the real estate industry has helped secure an exemption for the last 15 years.

    One57

    One57 dominates today but taller condominiums are now under construction.

    Last year, an extensive report by the New York Times titled Towers of Secrecy investigated shell companies that invest in Manhattan real estate. The report estimated that in six of Manhattan’s most expensive buildings including 15 Central Park West, One57, The Plaza and the Time Warner Center, shell companies owned between 57% and 77% of the condominiums.

    Across the United States in recent years, nearly half the residential purchases of over $5 million were made by shell companies rather than named people, according to data from First American Data Tree analyzed by The Times.

    In addition to favorable regulation welcoming this wave of cash, New York’s tax policy also made it easier for developers to meet the surging demand. Some ultra-luxury buildings received tax abatements initially intended to encourage the construction of affordable housing.

    Today however, the money flow, safety, secrecy, regulation and tax policy that enabled the boom are all threatening to reverse course at the same time, creating a new reality that may be problematic for investors and developers.

    It is a new reality that could also be problematic for the city. Money in Swiss private banking accounts can be easily withdrawn but money withdrawn from luxury condos with limited local appeal leaves a large footprint behind. Foreign money can be quickly gone but the buildings will be here quasi-forever.

    China’s economy has softened, commodities have crashed and the money flow from emerging markets to midtown Manhattan has slowed from a gusher to a stream, or perhaps a trickle. As a result, the profitability of many condominiums that are now under construction looks less assured than it was eighteen or twenty-four months ago.

    In addition, there are new calls for better monitoring of shell companies and for disallowing tax abatements in the case of super luxury apartments.

    This seems to all be coming at a bad time with several of the newest towers now rising above street level and boosting the pre-construction inventory. The surge in supply is taking place just as demand is slackening.

    A top Manhattan broker told populyst that the high luxury segment (apartments priced over $10 million) had buckled under a worsening macro environment, with signed contracts running at 38% below last year. Meanwhile, new supply is up 5.4% from last year and expected to continue growing.

    Sales at some of the new condominiums are likely to do well while others suffer. Because of its location and the success of 15 Central Park West designed by the same architect Robert A. M. Stern, it is fair to expect that 220 Central Park South will do fine by attracting demand from New Yorkers and wealthy Americans. Other buildings with less enviable locations will probably do well in their upper reaches but may have trouble selling mid-height units where views do not clear surrounding buildings.

    IMG_4248

    220 Central Park South.

    Asking prices are already being adjusted downward. Extell Development lowered its total sellout price by more than $200 million to $1.87 billion for its One Manhattan Squareproject. Toll Brothers has had price reductions at 1110 Park Avenue and 400 Park Avenue South. World Wide Group and Rose Associates have followed suit at 252 East 57th Street. And at 111 East 57th, JDS Development Group and Property Markets Group will wait about a year before launching sales at their ‘Billionaires’ Row’ tower.

    The broader market seems to also be coming under pressure. A recent study by research firm Miller Samuel for the Real Deal estimated that “by the end of 2017, Manhattan will have five years of excess inventory”.

    Roughly 14,500 units are expected to hit the market between 2015 and 2017But by the end of 2017, just over 5,000 of those units are expected to have sold, and going by the current rate of sales, it would take more than five years to sell all that excess inventory.

    The analysis looks at all new units that have launched or are set to launch in Manhattan over a three-year period, across all price points. It assumes the same rate of sales the new development market saw during the second half of 2015, which equates to just under 1,850 closed sales per year.

    Based on that absorption rate, more than 9,400 new units would be unsold by the end of 2017.

    What may retrenchment look like for Manhattan now? According to a recent New York Post article,

    In the past five years, about $8 billion worth of apartments worth $5 million or more have been bought, or three times higher than years previous. Most troubling is that 50 percent of these have been bought for cash, forked out by shell companies controlled by persons unknown.

    And further:

    An end to secrecy is supported by the G7, United Nations and the Organization for Economic Cooperation and Development. The concern is that countries with hot money outflows are being destabilized, while countries inundated with illicit cash are developing real estate bubbles and high housing costs for ordinary residents.

    The biggest losers are China, where $1.39 trillion left between 2004 and 2013; Russia, with $1 trillion hidden, and Mexico, with an outflow of $528 billion.

    In some African nations, the outflow of funds is so sizable that it is shrinking the size of their economies and sabotaging their societies.

    Meanwhile, in New York, the flood of buying by persons unknown is damaging the housing market. Between 2010 and 2015, the average square-foot price of a residence in New York City jumped from $1,000 to $1,450, an increase of 45 percent.

    The bottom line is that there are now many factors conspiring to slow down the tens of billions of dollars moving from emerging markets into US and European property markets. Profitability models for individual projects drawn during the boom are now incorporating less ambitious assumptions. Can the global economy reaccelerate in the next two years to vindicate the initial return projections? Anything is possible but this would require a stabilization of the Chinese economy and some recovery in commodity prices.

    Instead of the soaring rocket of boom years, the real estate cycle is more akin to the journey of the sun god Ra, who at night “visited the underworld, a watery realm of the demons of the dead, where he battled with the serpent of chaos, and victoriously returned to the day each morning”.

    Sami Karam is the founder and editor of populyst.net and the creator of the populyst index™. populyst is about innovation, demography and society. Before populyst, he was the founder and manager of the Seven Global funds and a fund manager at leading asset managers in Boston and New York. In addition to a finance MBA from the Wharton School, he holds a Master’s in Civil Engineering from Cornell and a Bachelor of Architecture from UT Austin.

  • Millennial Home Ownership: Disappointment Ahead in Some Places?

    Millennial renters overwhelmingly plan on buying their own homes, though affording them could be far more challenging than they think. This is an important conclusion from a renters’ survey by apartmentlist.com, an apartment search website (See: The Affordability Crisis: Are Millennials Destined to be Renters?). Apartmentlist.com matched results from its own survey of prospective renters that visit its site with housing market data from more than 90 metropolitan areas around the country, The most revealing finding:  Millennials intend to purchase their own homes, but that housing affordability is the greatest barrier. According to apartmentlist.com, the problem is the greatest on the West Coast, New York and Miami (See Figure “% of Millennial Renters that Can’t Afford to Buy”, from apartmentlist.com):

    In nearly all the metros we looked at, affordability was the #1 reason for delaying homeownership, but millennials on the west coast struggled the most: Portland, San Diego, Seattle, Los Angeles, and San Francisco all had more than 80% of renters listing affordability as a concern. Miami and New York, expensive metros with many cost-burdened renters, were #6 and #7 on the list.

    Perhaps surprisingly, two metropolitan areas that have been among the greatest beneficiaries of the housing affordability driven net domestic migration from coastal California, Portland and Seattle, scored the worst on affordability as a barrier to purchasing homes (90 percent and 89 percent respectively). These areas were once much less expensive in the past, but are rapidly catching up with California in terms of unaffordability.

    The Preference for Home Ownership

    The apartmentlist.com survey found that 79 percent of Millennials eventually plan to become home or apartment owners, while only six percent expect to rent for their whole lives. The balance (15 percent) are not sure. This 79 percent preference for home ownership is well above the current homeownership rate of approximately 64 percent.

    The preference for home ownership was pervasive in the apartmentlist.com data. Among the 50 metropolitan areas with more than 1,000,000 population, none scored below two thirds (67 percent) in Millennial home ownership preference. This is, again, above the national home ownership rate. The lowest home ownership preference among these was in Las Vegas. The highest preference for home ownership was in Rochester, at 94 percent. Charlotte and Salt Lake City also scored a 90 percent home ownership preference.

    Millennials indicated a strong preference for home ownership even in metropolitan areas that have depressed home ownership rates. In 2015, Los Angeles had the lowest home ownership rate of any major metropolitan area, at 49 percent, yet 76 percent of the area’s Millennials intend to own their own homes. In New York, with only a 50 percent homeownership rate, 74 percent of Millennials plan on buying their own homes. In San Jose, with only a 51 percent home ownership rate, 74 percent of Millennials aspire to buy their own homes. In San Diego, the home ownership rate was 52 percent, yet the interest in home ownership was half-again higher (78 percent). In San Francisco, where the home ownership rate is 56 percent, 76 percent expressed an interest in owning their own homes (home ownership rates calculated from Census Bureau quarterly data from 2015).

    The story is the same in the metropolitan areas often characterized as magnets for Millennial migration. In Portland and Denver, 81 percent of Millennials anticipate owning their own homes. Boston (78 percent), Seattle (77 percent) and Minneapolis-St. Paul (77 percent) are not far behind.

    Saving for Decades

    This data suggests that many Millennials could need to relocate to afford their own homes. The really innovative contribution of the apartmentlist.com research is as estimate of how long it will take the average Millennial to save enough money for a down payment on a starter home, which according to Trulia, is generally defined as the lower third of the market.

    Apartmentlist.com develops an estimate for each metropolitan area, using monthly savings rates, existing savings and the potential for financial assistance (for example from relatives) in obtaining enough for the down payment. In the most costly market, San Francisco, the average Millennial will need more than 28 years to build up enough funding for a down payment in San Francisco. This means that older Millennials would be old enough (62) to qualify for early retirement benefits from Social Security by the time they have enough to pay the down payment on a starter home. Sacramento is nearly as challenging, where it would take another 27 years to accumulate a down payment. Things are not that much better in Los Angeles (20 years), San Diego (19 years) and Denver (18 years).

    Optimistic Expectations and Disappointment

    But the most important bottom line conclusion of the research is what apartmentlist.com calls the “affordability gap.” This is the difference between the actual time required to accumulate a down payment and the time expected by survey respondents. The biggest affordability gap is in San Francisco, where respondents expected down payment requirements that would take only 11 years more to save. The reality, according to the study, is 28 years, more than 2.5 times that figure. In Sacramento, respondents expected that it would take 16 years, still far short of the more realistic 27 years. In Los Angeles, San Diego and Denver, it is likely to take from eight to ten years more to save enough for a down payment than survey respondents estimate.

    Setting up for More Domestic Migration

    In contrast, in a number of other metropolitan areas, such as Houston, Dallas-Fort Worth, Atlanta, Philadelphia and Kansas City, Millennials have over-estimated the size of down payments necessary to enter the housing market.

    For some time, domestic migration trends in the United States has been principally about moving from more expensive metropolitan areas to less expensive metropolitan areas. The apartmentlist.com data suggests that this trend could continue. To achieve their dreams of home ownership and to avoid a life of renting, many Millennials may move to places where housing is priced more for livability.

    Wendell Cox is principal of Demographia, an international pubilc policy and demographics firm. He is a Senior Fellow of the Center for Opportunity Urbanism (US), Senior Fellow for Housing Affordability and Municipal Policy for the Frontier Centre for Public Policy (Canada), and a member of the Board of Advisors of the Center for Demographics and Policy at Chapman University (California). He is co-author of the “Demographia International Housing Affordability Survey” and author of “Demographia World Urban Areas” and “War on the Dream: How Anti-Sprawl Policy Threatens the Quality of Life.” He was appointed to three terms on the Los Angeles County Transportation Commission, where he served with the leading city and county leadership as the only non-elected member. He served as a visiting professor at the Conservatoire National des Arts et Metiers, a national university in Paris.

    Photo by Bigstockphoto.com.

  • Liberals — Except When it Comes Home

    My old boss, Bruce Brugmann, who ran the Bay Guardian, told me early on in my career that you could tell the real politics of a big-city newspaper by the person they endorse for mayor.

    Nice liberal outfits like the New York Times support Democrats for president and (typically) governor and US Senate. The SF Chronicle doesn’t endorse many Republicans any more. But when it comes to the local stuff, the decisions on who should run the city where they live and operate and connect with the power structure, the truth comes out.

    The Times loved Ed Koch and backed Michael Bloomberg. The paper didn’t endorse Bill DeBlasio in the Democratic primary. The Chron backed Dianne Feinstein, John Molinari, Willie Brown, Gavin Newsom, and Ed Lee.

    There’s a perception that cities like SF, because they tend to vote overwhelmingly for Democrats, and send Democrats to the state Legislature and Congress, are by nature progressive communities. And that all breaks down when it comes to local issues, particularly when they involve real estate.

    The biggest Democratic Party donors in SF in the 1980 and 1990s were the members of the Shorenstein family, who hosted Bill Clinton at their home. They were also big downtown developers who spent that same Democratic money blocking any attempts to development limits.

    Our Democratic member of Congress, Nancy Pelosi, is either missing or on the wrong side on pretty much every land-use and development issue back at home.

    Gavin Newsom, who wants to be the next governor of California, got his start in local politics attacking homeless people.

    In other words, the gentrification and displacement in San Francisco is happening despite, and I could argue with the concurrence of, some of those “liberal” Democrats who, from a distance, seem much more progressive than they are when you look at their records right here at home.

    So we get what I call the David Chiu phenomenon – a person who pushed and promoted legislation backed by and in part written by Airbnb, which has driven thousands of housing units off the market, gets seen as a San Francisco progressive when he’s away in Sacramento.

    You can tell what a newspaper really thinks by its endorsement for mayor. And you can tell what a politician really thinks by what they do on the local issues that pit the power structure (in this case, tech, real estate, and the mayor) against the rest of the community.

    Which brings me, more or less, to Paul Krugman, the great liberal economist of the New York Times.

    Krugman is great on a lot of big national economic issues. He’s terrible when it comes to cities.

    The guy famously came out against rent control years ago, when any urban economist with any sense knows that rent control is one of the most powerful tools agaist displacement. It’s what makes an urban middle class possible in a city like San Francisco.

    And now he’s saying that cities need to reduce zoning rules and allow more housing, or any height, pretty much anywhere. He praises the idea that NY Mayor DeBlasio is pushing, which is similar to what SF Mayor Lee is pushing, which in essence cedes to the private market the responsibility to provide affordable housing and assumes that some modest percentage of “affordable” units in luxury towers that are geared to the same crooks and despots now in the news will be a real solution to the urban housing crisis.

    I shouldn’t have to keep saying this, but I will: You need to build at least 30 percent affordable housing in every luxury project just to stay even, and not make things worse. Which means if you want to add to the stock of affordable housing, you have to force developers to build 40, 50, 60 percent of the units for people of more modest means.

    That’s not even on the agenda in SF or NYC.

    If we took Krugman’s national approach – the rich ought to pay more taxes to pay for investment in the nation’s service and infrastructure – and applied it to cities, you’d get a very different approach. Urban developer profits have created great fortunes (Shorenstein, Trump); to a great extent, local governments have failed to tax those profits at a level that’s necessary to mitigate the impacts of their projects.

    Krugman ought to know that the middle class in an American city is not a natural consequence of capitalism. It requires strict regulations and controls. It means, sometimes, slowing down the booms that make a few rich so that the rest of us have a chance, too.

    That’s perfect liberalism, in the old school. Except that these great scholars and writers (and politicians) don’t seem to want to bring those policies back home.

    Author Tim Redmond, the former longtime editor of the San Francisco Bay Guardian, edits the online San Francisco publication 48 hills.

    This piece originally appeared at 48hills.org.

    By Prolineserver (Own work) [GFDL 1.2], via Wikimedia Commons