Category: planning

  • Time to Acknowledge Falling Private Car Use

    The prospect of falling car use now needs to be firmly factored into planning for western cities. 

    That may come as a bit of a surprise in light of the preoccupation with city plans that aim to get people out of their cars, but it is already happening.  And it is highly likely to continue regardless of whether or not we promote urban consolidation and expensive transit systems. 

    But not necessarily lower resource consumption
    Of course, as day-to-day travel savings are made by households these can simply result in other forms of consumption, offsetting any resource savings.  This should not be surprising.   Final demand embodies resources consumed right across the production and distribution chain.  Savings from lower transport spending (including commuting) – an intermediate input in the chain – that lead to lower prices translate into increases in discretionary spending (assuming constant or rising incomes). 

    Hence, the reduction in resource use and pollution sought by subsidising public transport and promoting higher density living may simply be spent on resource-intensive appliances, recreation, entertainment, and inter-city and international travel.

    Look to the fringe to look to the future
    Putting that inconvenient equation aside, long-term plans for cities should avoid simply projecting past behaviours into the future. Instead, we might look to changes at the margin that signal the issues, discoveries, and events that might determine the long-term outcomes we are interested in. 

    So let’s look at what’s happening at the margins of car use, focusing for the purpose of illustration on Auckland.

    First, travel demand
    The New Zealand Travel Survey has been conducted since 2003.  The results are published on a two-yearly rolling basis.  Using Statistics New Zealand population estimates I have calculated annual “per person” measures for Auckland from 2003 to 2011.  There are some sampling issues and qualifications regarding the survey that mean motor cycle and bicycle use statistics for Auckland are not considered reliable enough to use. Even given sampling error, the balance point to some significant and consistent shifts.

    For example, total travel (measured as annual kilometres per resident) appears to have peaked around 2007 (Figure 1). In fact, recorded travel declined by 15% over the period.  Public transport has done better, down 12% overall but actually increasing 13% between 2007 and 2011.

    Figure 1: Aucklanders’ Travel by Mode, 2003-2011


    More telling, though, has been declining car use.  The first column in Table 1 shows changes over the whole period.  The second column shows changes between the 2007 travel peak and 2011.

    The fall in car dependence since 2007 has been marked among passengers (-23%).  Perhaps that means fewer discretionary trips are being taken. This and a 14% decline in driver kilometres and 17% fewer trip legs confirms what the vehicle counts say – cars are being driven significantly less in Auckland  (particularly inner Auckland) now than they were five or ten years ago.

     
    Period

    2003-11
    Peak
    2007-11
    Driver
    Km
    -4%
    -14%
    Hours
    3%
    -12%
    Trip Legs
    1%
    -17%
    Passenger
    Km
    -33%
    -23%
    Hours
    -18%
    -17%
    Trip Legs
    -8%
    -22%
    All Car Users
    Km
    -16%
    -17%
    Hours
    -5%
    -13%
    Trip Legs
    -3%
    -19%

    Possible reasons:

    1.      We know already that an ageing population reduces car use.

    2.      Public transport is playing a growing but so far minor role (up from 3.7% to 3.9% share of all kilometres travelled).  An average 76km per person growth in public transport use since 2007 hardly offsets the 1,810km average contraction in distance travelled by car.

    3.      Lower real incomes and higher fuel prices play a part.  A sharp contraction since 2007 suggests that economic conditions have an impact on motoring far more immediate and influential than trying to reshape the shape the city and how people live in it might.   

    4.      The decentralisation of jobs, recreation and entertainment, professional services, and consumer services – including retailing – mean that people can get more done closer to where they live.  Trying to turn this clock back by pushing commercial activity back into the central city and then providing subsidised public transport to access it seems somewhat obtuse in the light of this development.

    Second, car purchases

    The Ministry of Transport publishes new car registrations (which include imported used cars).  It also provides data on the total  vehicle fleet since 2000.  

    Long-term registration statistics are interesting when related to national population data (Figure 2). Apart from a hiccup in 1991 growth in registrations was more or less continuous from 1950 until 2003.  Since then there has been a sharp decline.  Time will tell whether this is cyclical or signals a long-term shift.  It is noteable, though, that 2009, 2010, and 2011 figures fall well below trend.

    Figure 2: Trends in New Car Registrations

    This slowdown in new car registrations is reflected in two ways.  First, it is reflected in total fleet size, for which data are available from 2000 (Figure 3). This shows that  2007 was a turning point in total numbers, consistent with evidence that driving in Auckland peaked in that year.  That’s presumably good for the environment.

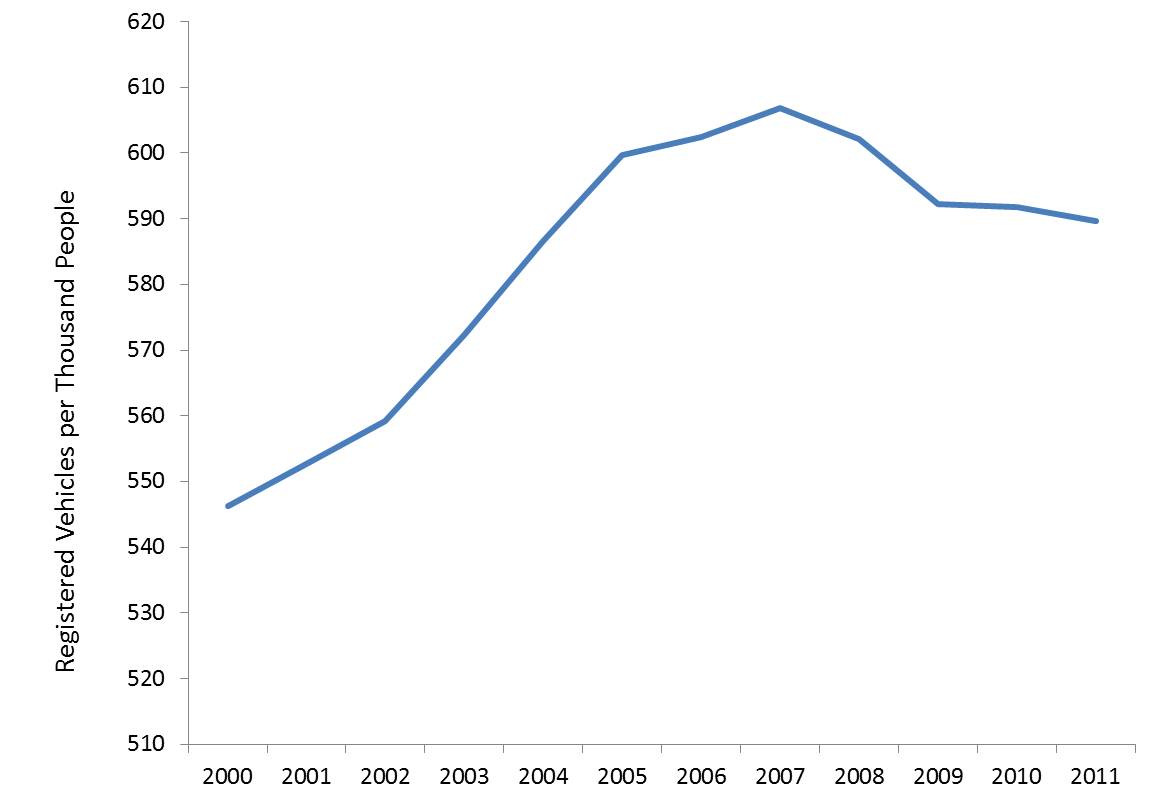
    Figure 3: New Car Registrations, New Zealand 2000-2011,

    Second, with the slow-down in imports, the fleet has begun to age (Figure 4).  That’s presumably bad for the environment, as older cars are less efficient and generate more emissions.

    Figure 4: New Zealand’s Ageing Car Fleet

    Third, fleet changes
    Fleet composition is changing as growth slows. The average CC rating of newly registered vehicles in 2000 was 2,127.  This climbed to 2,191 in 2005, but fell to 2,033 in 2011, an 8% fall in six years. 

    If this is a sign of things to come an increase in the turnover of vehicles would boost fleet efficiency over the medium term even without taking account of the greater engine efficiencies being delivered and gains among electric and hybrid vehicles

    Add to that the prospect supported by these numbers of increasing differentiation among vehicle styles (Figure 5).  At one end sits the large weekend recreational vehicle, perhaps falling as a share of new vehicles – or at least being down-sized.  At the other is the increasingly popular city runabout or smart car, and in the middle  the family sedan, the work horse with an engine size now likely to be well under 2,000cc.  

    Figure 5: Changes in Engine Size of Newly Registered Vehicles, 2000-2011

    So what does this all mean?
    There is evidence accumulating to suggest that significant changes are taking place at the margin of transport demand and car dependence.  If this is a sign of things to come it raises questions about long-term road expenditure, about dire predictions of road congestion, and about the benefits of adopting expensive land use and transport measures designed to force people out of their cars.

    Already, within a more constrained economy, people seem to be making their own decisions to reduce car dependence.

    In terms of city planning, it suggests that decentralisation may be more sustainable than the compact city protagonists make out.  In this respect, is interesting that motorway traffic counts show that significant reductions in inner city vehicle flows are offset by gains (albeit much smaller) in outer parts of the city – even as measured distance travelled falls. 

    And Auckland definitely needs to rethink assumptions behind spending plans for major road and rail infrastructure – and confront the risks and costs of getting them wrong. 

    And, incidentally, it’s about time New Zealand’s Ministry for the Environment updated its report card on trends in the environmental impact of vehicle travel – which only goes up to 2007, a year which may prove to be a turning point in long-term travel behaviour.

    Phil McDermott is a Director of CityScope Consultants in Auckland, New Zealand, and Adjunct Professor of Regional and Urban Development at Auckland University of Technology.  He works in urban, economic and transport development throughout New Zealand and in Australia, Asia, and the Pacific.  He was formerly Head of the School of Resource and Environmental Planning at Massey University and General Manager of the Centre for Asia Pacific Aviation in Sydney. This piece originally appeared at is blog: Cities Matter.

    Aukland harbour photo by Bigstockphoto.com.

  • Dispersion in the World’s Largest Urban Areas

    No decade in history has experienced such an increase in urban population as the last. From Tokyo-Yokohama, the world’s largest urban area (population: 37 million) to Godegård, Sweden, which may be the smallest (population: 200), urban areas added 700 million people between 2000 and 2010.

    Nearly one in 10 of the world’s new urban residents were in the fastest growing metropolitan regions (see: Definition of Terms used in "The Evolving Urban Form" Series), which added nearly 60 million residents. They ranged from a an estimated increase of more than 8.5 people in Karachi (Note 1) to 3.9 million people in Mumbai (Figure 1). The average population growth in these 10 metropolitan regions was 6 million, approximately the population of Dallas-Fort Worth or Toronto, which were fast-growers on their own in comparison to other high income world cities.

    By comparison, the largest growth over any single decade over the past half century in US metropolitan areas has been less than one half of the 6 million average: 2.43 million in New York (1920s) and 2.37 million in Los Angeles (1950s). Only Tokyo-Yokohama (1960s) and Shenzhen (1990s) have added more than 5 million people in a single decade before the last decade.

    Growth has been overwhelmingly concentrated outside the urban cores (Note 2) in these 10 fastest growing metropolitan region. Excluding Karachi (for which sufficient data is unavailable), approximately 85 percent of the growth was outside the urban cores (A 42 million increase in the suburbs and 8 million in the urban cores).

    Dispersion in World Megacities

    This is consistent with the findings of The Evolving Urban Form series, which is now two years old. These analyses have generally demonstrated that urban spatial expansion (pejoratively called "sprawl") is world-wide and contrary to some perceptions, not limited to the United States. Cities expand geographically as they add population, though this organic tendency is sometimes contained by urban planning. Peripheral growth is virtually always at lower densities than in urban cores, which means that as cities grow they tend to become less dense (Note 3).

    This process ironically is sometimes accelerated by planning decision-making. London‘s greenbelt —which banned the extension of housing into the near periphery of the city — has result in even greater sprawl to far outside the principal urban area. This trend since World War II, has forced commuters to travel longer times and distances to the urban core (All of metropolitan London’s growth has been suburban for 100 years, with a loss of 1.8 million in inner London, while the suburbs and exurbs grew by 10.5 million).

    The Evolving Urban Form has now covered 23 of the world’s 28 megacities (Note 4). As the Table indicates, population growth has been strongly oriented away from the urban cores and toward more suburban areas

    Table
    Summary of Megacity Population Trends
    URBAN AREA CORRESPONDING METROPOLITAN REGION
    Bangkok 10 Years: 55% of growth outside core municipality
    Beijing 10 Years: 99% of growth outside core districts
    Buenos Aires 60 Years: 100%+ of growth outside core municipality
    Cairo 16 Years: 2/3 of growth outside core governate
    Delhi 10 Years: 90% of growth outside core districts
    Dhaka 10 Years: 50% of growth outside core municipalities
    Guangzhou-Foshan 10 Years: 75%+ of growth outside core districts
    Istanbul 25 Years: 100%+ growth outside core districts
    Jakarta 20 Years: 85% of growth outside core jurisdiction
    Kolkata 20 Years: 95% of growth outside core municipality
    Los Angeles 60 Years: 85% growth outside core municipality
    Manila 60 Years: 95% growth outside core municipality
    Mexico City 60 Years: 100%+ of growth outside core districts
    Moscow 8 Years: 95% of growth outside core districts
    Mumbai 50 Years: 98% of growth outside core districts
    New York 60 Years: 95% growth outside core municipality
    Osaka-Kobe-Kyoto 50 Years: 95% of growth outside core municipalities
    Rio de Janeiro 10 Years: 95% of growth outside core districts
    Sao Paulo 20 Years: 2/3 of growth outside core municipality
    Seoul 20 Years: 115%+ of growth outside core municipality
    Shanghai 10 Years: 99% of growth outside core districts
    Shenzhen 10 Years: 70%+ of growth outside core districts
    Tokyo 50 Years: 95% of growth outside core municipalities


    In US examples, New York and Los Angeles, 95 percent and 85 percent of growth respectively of their corresponding metropolitan region growth has occurred outside the core municipalities since 1950. But these US regions are joined by middle income Buenos Aires and Mexico City where all growth has been outside urban core since 1950. In lower income Manila, 95 percent of the growth has been outside the urban core since 1950.

    The world’s largest metropolitan region, Tokyo-Yokohama, has experienced a virtual monopoly of suburban growth over the past 50 years, as has Japan’s second largest metropolitan region, Osaka-Kobe-Kyoto.

    Over the past quarter century, all of Istanbul‘s growth has been outside the urban core. The urban expansion has been going on for much longer, as is illustrated over the past 60 years (Figure 2). Cairo‘s urban expansion is similarly substantial (Figure 3). In one of the developing world’s poorer megacities, nearly all population growth in the Mumbai region has been outside the urban core for 50 years

    For the last 20 years, more than 115 percent of the growth in the Seoul-Incheon metropolitan region has been outside the core city. In the world’s second largest urban area, Jakarta (Jabotabek), growth is also strongly suburban, accounting for 85 percent of growth over the past two decades. In Kolkata suburban growth has been 95 percent over the same two decades.

    The same tendency is evident in the other megacities. Over the past decade or two, nearly all population growth in China’s four megacities (Shanghai, Beijing, Guangzhou-Foshan and Shenzhen), Delhi and Rio de Janeiro has been outside the urban cores.

    Dispersion in Other Large Urban Areas

    The Evolving Urban Form has also examined smaller urban areas. The same pattern of dispersal is evident there as well even in traditionally compact cities. Zürich, for example has had all of its growth outside the core city since 1950. All of the growth in Barcelona and Milan has been outside the core cities for 40 years. Even high density Hong Kong has experienced all of its growth outside the urban core for three decades. Low income Addis Abeba indicates a pattern of urban expansion is not unlike that of Istanbul or Cairo (Figure 4). In megacity wannabe Chicago (1.4 million short), 125 percent of growth since 1950 has been outside the core; this number reflects that the central city has been shrinking even as the periphery expands. Even in fast-growing Dallas-Fort Worth, more than 80 percent of population growth over the past 60 years has been outside the city of Dallas (which itself is largely suburban in form, see Suburbanized Core Cities).

    The one notable exception to the peripheral growth model is Quanzhou (Fujian, China), which is developing under an even more dispersed pattern, described by Yu Zhu, Xinhua Qi, Huaiyou Shao and Kaijing He at Fujian Normal University. Typically, urban areas expand from an urban core on the periphery. Quanzhou is experiencing "in situ" urbanization, the spontaneous conversion of rural areas into urban development that does not expand from the urban core. The result is a sparsely developed urban area (especially for China), with plenty of land for potential infill development in the future.

    The Future of Urbanization

    It is likely that urban areas will continue to expand as they grow larger, consistent with what appears to be both economic pressures and market preferences for lower cost, more spacious housing. For example, fast growing Ho Chi Minh City is expected to see virtually all of its population increase over the next 15 years outside the urban core. Not surprisingly Shlomo Angel, Jason Parent, Daniel Civco, Alexander Blei and David Potere at the Lincoln Land Institute project significant expansions of urban land by mid-century. And, Angel, in his Planet of Cities, notes how important it is to allow the expansion, in order to improve the quality of life for the majority of people, who deserve to live as well as people in the West.

    —-

    Note 1: Incomplete results of the 2011 Pakistan census have been reported by media in both Pakistan and India. However, no official announcement of the results has been identified from Pakistan census authorities. The Karachi population increase would be the largest metropolitan region 10 year rate of increase in history.

    Note 2: Urban cores are generally the core historical jurisdiction, which often contains substantial non-core areas, even outside the United States. Core district data within these jurisdictions is used where available. Thus, this estimate over-states the urban core population increase.

    Note 3: The driving factor in declining densities is principally transportation advances. Substantial urban expansion began with the coming of mass transit in the 19th century. However an even greater expansion began occurring with the availability of the automobile. As automobile orientation replaces transit orientation, densities tend to decline until it nearly all travel is by automobile. Even among automobile oriented urban areas, there can be large differences in urban densities. For example, transit’s market share in the Boston urban area is substantially greater than in the Los Angeles urban area. Yet the Los Angeles urban area has a population density of 7000 per square mile (2,700 per square kilometer), more than three times that of the Boston urban area, at 220 per square mile (850 per square kilometer). The difference is that in Los Angeles residential development has largely occurred densities determined by the market, with single-family housing being typically built on 1/4 acre lots. In Boston, suburban lot sizes were forced higher by urban planning requirements for large lot zoning. The result is much greater land consumption than would have occurred if people’s preferences (the market) had driven development. If Los Angeles had been developed at the same low density as Boston, its urban land area would equal that of the state of Connecticut.

    Note 4: Megacities are urban areas with more than 10 million population. Five megacities remain to be described in The Evolving Urban Form (Karachi, Lagos, Nagoya, Paris and Teheran). Corresponding metropolitan regions are used for this analysis, since historic urban area data (areas of continuous urban development) is not available for most nations.

    Wendell Cox is a Visiting Professor, Conservatoire National des Arts et Metiers, Paris and the author of “War on the Dream: How Anti-Sprawl Policy Threatens the Quality of Life.”

    —–

    Photo: New detached housing, suburban Tokyo-Yokohama (by author).

  • Hong Kong’s Decentralizing Commuting Patterns

    Hong Kong is a city of superlatives. Hong Kong has at least twice the population density of any other urban area in the more developed world, at 67,000 per square mile or 25,900 per square kilometer. The Hong Kong skyline is rated the world’s best by both emporis.com (a building database) and diserio.com, which use substantially different criteria. This is an honor that could not have been bestowed on any city outside New York for most of the 20th century.

    No world city is better suited to mass transit than Hong Kong. Hong Kong may also be the best served — it has the transit usage levels to prove it. According to Hong Kong 2011 census data, 87 percent of combined transit and car work trip travel in Hong Kong is by transit, though this is a small decline from the 90 percent of 2001. This is the highest transit market share of any high-income world metropolitan area.

    Change in Work Access Patterns

    Between 2001 and 2011 Hong Kong’s employment increased nine percent. Most of these new workers (38 percent), however, did not travel to fixed work locations in Hong Kong. Reflecting continuing decentralization and the impact of information technology, 62 percent of the new workers (1) worked at home, (2) had no fixed place of work or (3) worked outside Hong Kong, especially in Macau and the province of Guangdong, principally in Shenzhen (Figure 1). The 2001 and 2011 census data is summarized in the table below.

    HONG KONG WORK ACCESS: METHODS: 2001 AND 2011
    2001 2011 Change % Change Share: 2001 Share: 2011
    MASS TRANSIT   2,091,552  2,226,818    135,266 6.5% 70.4% 70.1%
    Bus & Coach  1,400,770  1,188,897  (211,873) -15.1% 47.2% 37.4%
       Large Bus   1,118,388     938,467   (179,921) -16.1% 37.7% 29.5%
       Minibus (Public Light)      226,646     217,219      (9,427) -4.2% 7.6% 6.8%
       Residential Coach       55,736       33,211    (22,525) -40.4% 1.9% 1.0%
    Rail     690,782  1,037,921   347,139 50.3% 23.3% 32.7%
       Metro (Original MTR)      495,128     697,475    202,347 40.9% 16.7% 21.9%
       Suburban Rail (Original KCR)      195,654     297,416    101,762 52.0% 6.6% 9.4%
       Light Rail              –         43,030     43,030 NA 0.0% 1.4%
    CAR & TAXI      232,978     333,192    100,214 43.0% 7.8% 10.5%
    WALK      335,859     266,574    (69,285) -20.6% 11.3% 8.4%
    OTHER      123,455       68,509    (54,946) -44.5% 4.2% 2.2%
    TRAVEL TO HK FIXED PLACE OF WORK   2,783,844  2,895,093    111,249 4.0% 93.8% 91.1%
    WORK AT HOME      185,367     283,497     98,130 52.9% 6.2% 8.9%
    FIXED PLACE OF WORK   2,969,211  3,178,590    209,379 7.1% 100.0% 100.0%
    NO FIXED WORK PLACE      188,998     247,916     58,918 31.2%
    WORK IN HONG KONG   3,158,209  3,426,506    268,297 8.5%
    WORK OUTSIDE HONG KONG       94,497     120,858     26,361 27.9%
    WORKING RESIDENTS   3,252,706  3,547,364    294,658 9.1%
    EXHIBIT
    Travel to Work in Hong Kong   2,783,844  2,895,093    111,249 37.8%
    Home, No Fixed Place, Outside HK      468,862     652,271    183,409 62.2%
    TOTAL   3,252,706  3,547,364    294,658 100.0%
    Source: Hong Kong Census, 2001 & 2011
    No Fixed Place of Work: Access method not determined


    The Shift from Bus to Rail: Transit’s overall share of work trip access was 70.1 percent in 2011 (all methods). This is a slight decline from the 70.4 percent in 2001. Over the last decade, Hong Kong has substantially expanded its urban rail system, including major improvements such as a new tunnel under Hong Kong Harbor and the new West rail line (former Kowloon Canton Railway) to Yuen Long and Tuen Mun. I wrote a supporting commentary in the Apple Daily (Hong Kong’s largest newspaper) supporting the rail expansion program in 2000.

    The results are apparent in the ridership data. The rail work access market share rose nearly 10 points to 32.7 percent. At the same time, the bus market share dropped nearly 10 points to 37.4 percent. Overall, in a modestly growing labor market, transit added 135,000 new one away work trips.

    Car Commuting Up: Cars and taxis experienced a much larger percentage gain, largely as a result of starting from a much smaller base. The car and taxi work trip access market share rose from 7.8 percent to 10.5 percent. Overall, approximately 100,000 more people commuted one way by car to work in 2011 than in 2001. The median incomes of car and taxi commuters are the highest, at more than twice that of rail and bus users.

    More Working at Home:Hong Kong’s working at home grew the most of any category, rising 53 percent from 185,000 to 283,000 daily. As a result, working at home now accounts for 8.9 percent of work access, compared to 6.2 percent in 2001. Hong Kong’s reliance on working at home was greater than that of the United States in the early 2000s. Over the last decade Hong Kong’s 53 percent increase in working at home was well above the 41 percent increase in the United States. In Hong Kong, 33 percent of new employment was home-based work between 2001 and 2011. This is greater than in the US, where 20 percent of new jobs involved working at home as the usual mode of access between 2000 and 2010.

    The Decline of Walking: Given Hong Kong’s intensely high densities, it may come as a surprise that there was a huge loss in walking to work. Nearly 70,000 fewer people walked to work in 2011 than in 2001, as the walking market share dropped 21 percent. In 2011, commuters who walked (and those who used light rail) had the lowest incomes. In 2001, more people walked to work than either travelled by car or work at home. By 2011, fewer people walked to work than travel by car or work at home.

    There was also a nearly 55,000 loss in work access by other modes (such as ferries, motorized 2-wheelers and cycling).

    Finally, Hong Kong separately categorizes workers without a fixed place of employment and does not obtain information on how they access work. This category experienced an increase of nearly 60,000 from 2001 to 2011.

    The Decentralization of Hong Kong’s Labor Markets

    The distribution of employment changed little over the 10 years, with Hong Kong Island and Kowloon sectors retaining two-thirds of the jobs. These two areas also have more than one-half of the population.  Even so, the Hong Kong labor market followed the global pattern of decentralization.   More people traveled outside their home areas in 2011 than in 2001. Among resident workers living on Hong Kong Island and in Kowloon, there was an 18 percent increase in working outside these home sectors. Further, the increase in people with no fixed place of work reflects greater mobility and labor force decentralization.

    Jobs-Housing Balance? Not Much

    The high density of jobs and population, its short trip distances, its extraordinary transit system and its high transit market share would seem to make Hong Kong a poster city for the jobs – housing balance ("self containment") that urban planners seem so intent to seek. The data indicates no such thing.

    Hong Kong’s 18 districts illustrate a comparatively low rate of self containment. Only 21.4 percent of working residents are employed in their home districts, including those who work at home. This is only slightly higher than in highly decentralized suburban Los Angeles County, where 18.5 percent of resident workers are employed in their home municipalities. With far lower population and employment densities and a 50 percent smaller geographical size, the suburban municipalities of Los Angeles County (city of Los Angeles excluded, see Note below) nearly equal the local-area jobs-housing balance of the Hong Kong districts (Figure 4).

    This tendency to work away from home districts contributes to Hong Kong’s extraordinarily long average commute times. In 2002, the average work trip was 46 minutes, longer than any high-income world metropolitan area except Tokyo. By comparison, Dallas-Fort Worth, with a similar population and a population density less than 1/20th that of Hong Kong, has an average work trip travel time of 26 minutes. Los Angeles, with its world-class traffic congestion has a work trip travel time of 27 minutes, principally because its automobile dominant commuting is much faster than Hong Kong’s world class, rail based transit system.

    These data, both in Hong Kong and Los Angeles, show that, within a metropolitan area (labor market),  people will tend to seek the employment that best meets their needs, just as employers will hire the people best suited to theirs. Within a labor market, this can be anywhere, subject to the preferences of people and employers, not of planners. This is the basis of former World Bank principal planner Alain Bertaud’s caution that a city’s economic efficiency requires … avoiding any spatial fragmentation of labor markets.

    The Mistake of Trying to Emulate the Unique

    It is a mistake to think that urban planning can emulate Hong Kong. Besides its superlatives, Hong Kong did not become so dense as a result of urban planning or the unfettered preferences of people (market forces). Hong Kong’s uniqueness is the result of unique geo-political influences. This history forced an unprecedented accommodation of millions in a small space, especially in the third quarter of the 20th century when it stood as a capitalist island in the midst of a Communist sea.

    Hong Kong is unique and will be for a long time.

    Note: The city Los Angeles has a very high jobs-housing balance (61 percent). However, this is largely due to its huge geographic size (more than 40 times the average suburban jurisdiction).

    Wendell Cox is a Visiting Professor, Conservatoire National des Arts et Metiers, Paris and the author of “War on the Dream: How Anti-Sprawl Policy Threatens the Quality of Life.”

    —-

    Photo: West Rail Line, Tin Shui Wai Station bus interchange, Yuen Long (by author)

  • Separation of Church and Urban Planning

    Recently, the Journal of the American Planning Association (JAPA) published research that directly challenged prevailing views in urban planning. In an article entitled Growing Cities Sustainably, Marcial H. Echenique, and Anthony J. Hargreaves from Cambridge University, Gordon Mitchell (University of Leeds) and Anil Namdeo (University of Newcastle) found that compact development (smart growth) had only a marginal impact on sustainable development and should not "automatically be associated with the preferred spatial growth strategy" (See Questioning The Messianic Conception of Smart Growth). This was particularly unsettling to the powers-that-be in urban planning, who have struggled for years – predating the current greenhouse gas emission (GHG) reduction concerns – to make anything but smart growth virtually illegal.

    The Reaction

    Soon after, the JAPA editor (Randy Crane of UCLA) was criticized by fellow academics in the "PLANET" listserv for permitting publication, at least partly because the research questioned the value of compact development (smart growth) in achieving environmental sustainability.

    In early November, a session was held at the 53rd Annual Association of Collegiate Schools of Planning conference in Cincinnati entitled "Spinning Wheels and Witch Hunts: Debating the Merits of Planning Research," devoted to discussion of what at least some considered the heresy of Echenique, et al. The conference program description of the session included questions such as the following:

    "What are the dangers of applying the “scientific method” in planning?"

    My comment: Any dangers are problems of planners, not the scientific method

    "How do ethics, politics and normative values factor into what gets published?"

    My comment: It is hoped as little as possible, which is why concern is expressed here.

    "On the issue of compact cities, are we spinning our wheels, or are we provocatively challenging conventional wisdom? Is the problem of sprawl still an open question? Do these debates ever end, or, with JAPA’s help, do they keep going indefinitely?"

    My comment: The debates must continue until perfect knowledge has been achieved and all relevant information has been objectively considered (with or without JAPA). Neither condition has been satisfied.

    A Report from the Front

    Professor Lisa Schweitzer of the University of Southern California provided comments on the session in an article entitled ACSP Reflections #1 Should Researchers be Allowed to Question Smart Growth?. Professor Schweitzer describes only the beginning of the session, indicating that she left because the room was too crowded and out of a concern that the authors would not be represented. This is despite the fact that the purpose of the session was, in effect, to discuss whether the researchers were "out of bounds" in raising the issue. Even abbreviated, Professor Schweitzer’s account raises substantial concerns, which are described below.

    The session began with a critique of the Echenique, et al research by Professor Emily Talen of Arizona State University. Professor Schweitzer characterized Talen’s criticism as boiling down to "practitioners have a tough time convincing people to pursue smart growth."

    Censoring Criticisms of Smart Growth?

    Professor Schweitzer continues: "The problem with Talen’s idea is that it suggests researchers ‘owe’ it to practitioners to only inquire within the framework that compact development is unambiguously meritorious and sprawl is ambiguously not." Professor Schweitzer rightly questions how compact development can be considered "unambiguously good" if it is not examined closely.

    In fact, there is no room for icons or the sacred in academic inquiry. The imperative to question is the very justification for publication of the Echenique, et al research.

    Avoided Issues

    Indeed, there is considerable evidence that compact development has not been examined closely enough. For example, urban planning research has usually discounted, ignored or even denied the association of compact development with inordinately higher house prices relative to incomes – despite massive evidence to the contrary. This is because housing is the largest element in the cost of living, higher house prices necessarily reduce discretionary incomes and increase poverty.

    This is an issue not only for high-income cities but also for developing ones. New York University Professor Shlomo Angel expresses concern that: …strict measures to protect the natural environment by blocking urban expansion could "choke the supplies of affordable lands on the fringes of cities and limit the abilities of ordinary people the house themselves." (See: A Planet of People: Angel’s Planet of Cities).

    Similar concern is raised by Brandon Fuller of Charter Cities: … if governments respond by trying to contain urban expansion with greenbelts or urban growth boundaries that artificially restrict the supply of developable land, the result will be prices and rents higher than many arriving families can afford.

    The association between higher densities and more intensive traffic congestion is also avoided in much of the planning press. Echenique, et al are an exception, citing research showing that when density rises, vehicle travel rises almost as much. This is no small matter, since expanding mobility throughout metropolitan areas means more economic growth (read more affluence and less poverty). This is before considering the negative impacts of greater traffic intensity on localized air pollution and health.

    Sanctioning Objective Inquiry?  

    The need for greater openness in academia also caught the attention of Australian transport and urban development consultant Alan Davies (in Will Compact Cities Deliver on the Environment), who wrote:

    There needs to be more consideration of evidence-based research by those interested in cities. One reason why there isn’t is illustrated by the reaction to the Echinique et al paper by some members of the US Association of Collegiate Schools of Planning (ACSA).

    On a similar note, Professor Schweitzer noted that it is common for advocates of compact development to charge skeptics with unethical behavior. This creates an environment that is not conducive to developing objective and reliable strategies that effectively addresses objectives such as environmental sustainability.

    Back to the (17th Century) Future?

    Open minds have always been a threat to dogma and its proponents. Progress comes from the objective application of science, which is the very opposite of dogma.

    Yet, there is a long tradition of sanctioning thought and publication that questions the conventional wisdom. It is not an honorable tradition. In the 17th century, Galileo was bold enough to challenge the doctrines of the Church about the relationship of Earth to the sun. The Church determined that it was inappropriate for him to publish such views and Galileo spent the rest of his life under house arrest. Of course, doctrines change, especially when exposed to the light of new or ignored evidence.

    Researchers like Echenique, et al should not be confined to an ivory tower equivalent of house arrest. Their work and that of researchers disagreeing with them should be roundly debated in an open, academically free environment. All of this requires a separation of church and urban planning.

    Wendell Cox is a Visiting Professor, Conservatoire National des Arts et Metiers, Paris and the author of “War on the Dream: How Anti-Sprawl Policy Threatens the Quality of Life.”

    ——

    Photo: Sather Tower, University of California, Berkeley (by author)

  • A Housing Preference Sea Change? Not in California

    For some time, many in the urban planning community have been proclaiming a “sea-change” in household preferences away from suburban housing in the United States.

    Perhaps no one is more identified with the "sea-change" thesis than Arthur C. Nelson, Presidential Professor, City & Metropolitan Planning, University of Utah. Professor Nelson has provided detailed modeled market estimates for California in a paper published by the Urban Land Institute, entitled The New California Dream: How Demographic and Economic Trends May Shape the Housing Market: A Land Use Scenario for 2020 and 2035 (He had made generally similar points in a Journal of the American Planning Association article in 2006).

    Professor Nelson says that the supply of detached housing on what he defines as conventional sized lots (more than 1/8 acre) is far greater than the demand in California (Note 1). He further finds that the demand of detached housing on smaller lots is far greater than the supply. Professor Nelson’s conclusions are principally modeled from stated preference surveys, which can mislead if people act differently when they make choices in the real world.

    The Modeled Demand Estimates

    Nelson models the demand for housing types in California’s largest four planning regions (Southern California Association of Governments for the Los Angeles area, and the Bay Area Association of Governments for the San Francisco-San Jose area, the San Diego Association of Governments and the Sacramento Area Council of Governments). He estimates 2010 both supply and demand. His demand estimates rely strongly on data from three early 2000s stated preference surveys conducted by the Public Policy Institute of California (PPIC).

    • Nelson’s data indicates a strong preference for multi-family housing, which he places at 62% of demand in 2010, compared to the 2000 supply of 42%. Thus, the demand for multi-family housing is suggested to be one half above the supply.
    • The most stunning conclusion, however, is an over-supply of detached housing on conventional lots that Nelson estimates. Compared to a 2000 supply of 42% of the market, Nelson estimates the demand to be only 16%. This would indicate the supply of such housing to be more than 2.5 times the demand as is indicated in Figure 1.

    Nelson’s findings on conventional lot detached housing have obtained the most attention. He surmises that virtually all of the demand over the next 25 years can be met by the existing stock of conventional lot detached housing. This is music to the ears of many urban planners, who have for decades demonized  the suburbanization that has been preferred by the overwhelming majority of Californians (and Americans, and people elsewhere in the world where they can afford them).

    Actual Demand: Revealed Preferences: 2000-2008

    To perform a similar analysis, we used revealed preference data: the actual change in housing by type from the 2000 Census data to the latest American Community Survey (ACS) 2006-2010 data at the census tract level (Note 2).  

    In contrast to Professor Nelson’s estimates, the demand data indicates a strong continuing preference among Californians for detached housing on conventional lots. From 2000 to 2008 (the middle year for the 2006-2010 data), 51 percent of the new occupied housing in the four planning areas is estimated to have been detached on conventional lots (Figure 2). This is more than three times the 16% demand estimate in Professor Nelson’s data. In fact, the actual demand was higher than the 2000 supply (42%), indicating that the demand for detached houses on conventional lots has increased.

    If there is a sea change, it would appear to be in multi-family housing. In contrast with the 62% share for multi-family dwellings modeled by Nelson, the actual demand indicated in the census tract data was two-thirds less, at 19% (Figure 3), well below the supply of 43 percent in 2000. This suggests a tanking of demand for multi-family housing, even as builders, in California and elsewhere, put more product on the market.

    Why Accounts for the Difference

    Various factors appear likely to contribute to the difference between the modeled demand and the actual demand.

    Smaller Lots and Higher Density Do Not Mean Shorter Commutes: The PPIC survey questions implied a connection between larger lots (lower density) and longer commutes. This is the broadly shared perception, but in reality houses on smaller lots (necessarily in higher density neighborhoods) do not mean shorter commutes. This is illustrated in a chart by Southern California Association of Governments (SCAG) researchers on page 62 of The New California Dream. In the original SCAG document, the authors note that "commuting time is about the same for all density" (Figure 4).  This is not surprising, since higher densities are associated with more intense traffic congestion and with greater transit use, both of which lengthen commutes (Note 3).

    The "higher density means shorter commute" myth is rooted in the obsolete mono-centric conception of the city. Almost all US urban areas have become poly-centric with job locations highly-dispersed, as jobs have followed people to the suburbs. Gordon and Lee (Note 4) have shown that work trip travel times in the United States are shorter to dispersed employment locations than to central business districts or secondary business centers (such as "Edge Cities").  

    Invalid Perceptions of Transit Mobility: Professor Nelson also stresses stated preference responses showing that many people would prefer to live near transit service. All things being equal, who wouldn’t?

    But all things are not equal. Living near transit does not mean practical transit access to most of the urban area. In most cases, only a car can provide that. Transit systems are necessarily focused on downtown areas (central business districts), which contain, on average, only 8% of employment in the four planning regions. , Travel to other destinations is usually inconvenient, because of time-consuming transfers, or   not available at all.

    A Brookings Institution report indicated that 87 percent of people in California’s major metropolitan areas (Los Angeles, San Francisco, Riverside-San Bernardino, San Diego and Sacramento) live within walking distance of transit. Yet, the average employee can reach only 6% of the jobs in their respective metropolitan area in 45 minutes (Figure 5). By contrast, the average work trip travel time ranges from 25 minutes to under 30 minutes in the four planning regions .

    Households thinking about a move to higher density could have been, upon more serious examination, deterred by transit’s severe mobility limitations. 

    Data Insufficiently Robust for the Modeling: There is also the potential that the PPIC surveys, with their general questions, were not of sufficient robustness to support Professor Nelson’s assertions. For example, PPIC did not define the size of small lots.

    Planning and Reality

    If households were so eager to move from detached houses on conventional lots to smaller lots, 2000 to 2008 would have been the ideal time. The mortgage industry was literally falling over itself to fund home purchases. Urban core wannabes could have flooded the market pursuing their smaller lot "stated preferences." The actual, revealed preference data says they did not, which is also indicated by the continuing strength of suburban growth relative to central city growth (Note 5).

    Thus, the modeled demand estimates in The New California Dream appear to be at substantial odds with the actual demand.This is much more than an academic issue. The conclusions of The New California Dream have achieved the status of sacred text in the canon of urban planning and are mouthed unquestioningly by organizations like the Urban Land Institute.

    Worse, demand estimates from The New California Dream are being relied upon in regional transportation plans being developed by California’s metropolitan planning organizations (MPOs). This is particularly risky because these same MPOs have been granted greater power over housing under California’s Senate Bill 375, goaded on by a sue-happy state Attorney General’s office. The attempt by MPOs to impose their housing plans and regulations on consumers could well backfire, for investors in condominium and multifamily housing.  This would not be a first time that   developers followed urban planning illusions like lemmings over a cliff, to which huge losses in the last decade attest. The more destructive effects, however, are likely to be paid by households and the economies of California’s metropolitan areas.

    ———

    Note 1: More than 70% of the detached housing stock was on conventional lots in 2000.

    Note 2: There is no census tract data on detached house lot size. We scaled the detached housing data from the 2000 census to match Professor Nelson’s distribution of detached housing supply by lot size, using population density. Nelson’s method and ours were sufficiently similar that the results should have been roughly comparable. As the text indicates, they were not.

    Note 3: In each of the three PPIC surveys, respondents are asked to choose between housing alternatives that are high in the questions to commute "lengths." From the description and survey instruments in the PPIC reports, there is no indication that respondents were given any idea what commute "length" means. There are two way to judge commute "length." One is distance or miles, while the other is time. Based upon the PPIC survey instrument, it cannot be known which definition was perceived by the respondents.

    Even so, it seems more likely that the term "commute length" was perceived by respondents in time rather than in distance by respondents. Each day, people have only so many hours and minutes available. However, distance is not so constrained, depending upon the speed of the commute. Further, the extensive research on commuting often refers to "travel budgets," which are expressed in time, not distance.

    Note 4: Reference: Gordon, P. and B. Lee (2012), "Spatial Structure and Travel: Trends in Commuting and Non-Commuting Travels in US Metropolitan Areas," draft chapter for the International Handbook on Transport and Development edited by Robin Hickman, David Bonilla, Moshe Givoni and David Banister.

    Note 5: The most recent year (2010-2011), for which the Census Bureau had issued invalid municipal population estimates, indicated a continued the trend toward suburban rather than urban core growth, as has been shown by Trulia Chief Economist Jed Kolko (see: Even After the Housing Bust, Americans Still Love the Suburbs).

    =======

    Photograph: Suburban San Diego

    Wendell Cox is a Visiting Professor, Conservatoire National des Arts et Metiers, Paris and the author of “War on the Dream: How Anti-Sprawl Policy Threatens the Quality of Life.”

  • Postwar Prefabs: Britain’s Factory-Made Palaces

    After the financial crisis of 2008, much of Great Britain’s construction industry capacity was wiped out. Now, in 2012, there is much fear that the “traditional” construction industry is too weak to rapidly increase the rate of housing production, even if the administrative planning system wanted it to. Which it doesn’t. Yet there is also no suggestion by Local Authorities or the national government that the present lack of construction capacity could be addressed by the manufacture of housing by new businesses in other industrial sectors — the creation of factory made homes — as was done post-World War II.

    Between 1944 and 1949 the British Government organised the production and installation of two bedroom prefabricated bungalows as emergency housing. The Prefabs were a popular success, but have never been repeated.

    As the Second World War was concluding, Clement Attlee, the Labour Party’s Deputy Prime Minister in Winston Churchill’s wartime coalition Government, told the House of Commons,
    ‘The Government have reviewed the potential building capacity of the country, and have come to the conclusion that it will not be possible, for some years, to build enough permanent houses to meet the urgent demands for separate homes. We shall therefore need, in addition, emergency factory-made houses.’

    A budget of £150,000,000 was sanctioned in the Housing (Temporary Accommodation) Act, 1944, and increased to £220,000,000 by 1947. By the time the financial account was closed in 1957 a total of 156,623 prefabricated bungalows of a few types were built on Local Authority Land for £207,309,000. They were all rented out by 1949, popular as suburban “prefabs”.

    Many of of the Prefabs were manufactured by the aircraft industry using aluminium as the production of war-planes wound down. Others were constructed with steel and timber. The aluminium bungalows were road-delivered as sectional buildings. All the Prefabs were built round a central core of a kitchen, toilet and bathroom. The fitted kitchen had a fridge and cooker, running hot water, and a wash (laundry) boiler There was built-in storage, electric lighting, and sockets. For many residents the Prefabs offered a huge advance in their quality of life.

    They were supposed to last 10 to 15 years, but many were so popular that their residents successfully campaigned to save them from demolition. They proved as permanent as any other housing.

    A few of the Prefabs still exist today, but they are gradually being cleared by Local Authorities keen to arrange the redevelopment of the often well-located land that can now be occupied with far denser housing, mostly for a lucrative sale. In today’s model, space inside and outside the home are both sacrificed. Buyers hope that expensive mortage payments might result in equity in an inflating housing market, where rents have also become unaffordable.

    Of course, new housing is needed, but it begs the question of who can afford it. Not the residents of the homes that are being demolished, that is certain. The Prefabs were built during a time when the aim was to keep rents low, while producing spacious homes with gardens for working class people.

    The best example of this Prefab demolition is to be seen at the Excalibur Estate in Catford, South East London, which is Britain’s largest and last surviving post-war prefab estate. It consists of 186 homes built by Italian and German prisoners of war in 1945 and ’46 to house returning servicemen and their families. For many years, a long and bitter battle between the residents and Lewisham Council has continued. The Council plans to develop the site with up to 400 new homes. Some residents continue to fight against the plan. Six Prefabs are listed by English Heritage and saved from demolition; 180 are to be pulled down in phases within the next few years, starting this month.

    Photographer Elisabeth Blanchet has long studied the way these surviving “Palaces for the People” have been lived in by residents. She was struck by the way the Prefabs did not look like British brick, semi-detatched or terraced houses, but more like American homes, with a garden and more space and privacy. “Prefab estates around the country were designed with a sense of community,” says Blanchet, “… sometimes around a green and connected by footpaths, giving them the feel of holiday villages.”

    Speaking of the way the Excalibur Estate has been lived in over the many decades after it was supposed to be demolished, she says, “Apart from slight modifications, the Catford Estate remains virtually unchanged. Some residents have added new doors and windows, painted walls… Some have even given their home mock-Tudor makeovers, or added fake beams to the outside. The sense of community, a rare thing in today’s society, is in danger… I met wonderful people, mainly in their 60s, 70s, 80s and even 90s.” One resident, Eddy, who had been living there since 1946 told Blanchet, “I wouldn’t swap the place for Buckingham Palace, even if it included the Queen!”

    Over more than a decade Blanchet collaborated with Greg Stevenson on a book, Palaces for the People, that includes her unique archive of photographs and interviews with residents. She is now recording stories from people who once lived in the Prefabs, and planning a documentary film, all aiming to answer a simple question: Why do people love these homes so much?

    It is almost impossible to imagine any British Government initiating such an ambitious and popular manufacturing effort today. Even while the rate of “traditional” house building is at an historic low, there appears little willingness by the planning system to increase construction industry capacity. No one is arguing for it in Parliament, but Prefabs 2014-2019 would be great for the public, and a boost to the construction and manufacturing industries.

    Photos by Elisabeth Blanchet

    Ian Abley is a Project Manager for audacity, an experienced site Architect, and is co-author of Why Is Construction So Backward?, as well as co-editor of Manmade Modular Megastructures. He is planning 250 new British towns. Elisabeth Blanchet’s current project, “The Prefabs Tour of the UK”, will show how the homes produced in an emergency turned out to be enduring and well liked. You can get involved here.

  • The Land Premium That’s Punishing Property

    High land prices have all but killed the Australian housing industry.

    Lower housing starts has led to lower GST revenues (house construction attracts full GST) and lower stamp duty receipts are crippling state budgets and cruelling the chances of low and middle income earners to get a start in the housing market.

    What has caused this slump in housing starts? Land prices.

    Raw land for new housing developments should be close to its agricultural value – in other words, around $10,000 per hectare. But land released for residential development fetches up to $1 million per hectare – 100 times the agricultural price.

    Government land management agencies and private land developers may well argue a lot of land has been released for residential development, but clearly it is not enough.

    Only when urban growth boundaries are removed will we know a piece of land’s true value. It will then be a trade-off between price and distance. People may be prepared to travel another 10 or 15 minutes by car (10 to 20km) to get a cheaper block.

    To highlight the “‘X’ years supply of land available” argument, I heard a state bureaucrat say recently that the government had released enough land for 15 years supply. I raised my hand and asked “15 years supply – at what price?” He didn’t know what I meant. I said “at $200,000 a block it may well take 15 years to sell. So why don’t you double the price and then you’ll have 30 years supply?”

    These points highlight the fact that, as with most central planning, housing planning is based on a fundamental flaw – that price does not matter. But as we know, price does matter. Imagine the demand for housing if land was $100,000 per block cheaper. Think LCD, LED and plasma TVs over the past five years.

    Australia does not have, and never has had, a housing affordability problem, it has a land affordability problem. The cost of building a new house has hardly moved in 20 years. Land prices however have skyrocketed. By restricting the amount of land available on the urban fringes of our cities, state governments have sent the price of entry-level housing through the roof.

    The reasons state governments give for these restrictions all centre on urban planning. They have persisted with their policies of urban densification (squeezing more and more people into existing suburbs), an idea that has failed all over the world.

    Whether it’s traffic congestion, air pollution, the destruction of bio-diversity or the unsustainable pressure on electricity, water, sewage or stormwater infrastructure, urban densification has been a disaster. The evidence is overwhelming; urban densification is not good for the environment, it does not save water, it does not lead to a reduction in motor vehicle use, it does not result in nicer neighbourhoods, it does not stem the loss of agricultural land, it does not save on infrastructure costs for government and, worst of all, it puts home ownership out of the reach of those on low and middle incomes.

    State governments use urban planning laws to restrict the amount of fringe land available and then drip feed it through their land management agencies to a land- starved housing industry at inflated prices. Hmmm. After a change of state government a few years ago, a former cabinet minister was asked why her government didn’t release more land to kick-start the housing industry. She replied: “We needed the money.” So much for urban planning.

    And of course land developers with massive land banks on their books urge state governments to maintain the scarcity to maintain the ‘value’ of the developers’ inventory. Developers would be better off if they supported the removal of urban growth boundaries and allowed more broadacre land to come onto the market which they could buy at greatly reduced prices. With land prices significantly lower than they are today it wouldn’t take long for the industry to recover. Until land prices fall, there will be no recovery.

    The Australian housing industry is building 40,000 fewer homes a year than it should be. That’s more than $10 billion worth of work a year the industry is missing out on. That’s a lot of bricks, concrete, timber, tiles, steel and, of course, labour.

    Governments and industry associations have known for years this was coming but just played footsies with each other – read US economist George Stigler’s book Regulatory Capture to understand how and why this happens.

    Australia’s economy has been seriously distorted due to a massive overinvestment in household debt. We have a housing industry on its knees. Getting all this back into alignment with reality will take time but it is a realignment that is necessary.

    We cannot continue to deny the next generation a home of their own merely to satisfy the indulgences of urban planners and state government treasury officials.

    This piece originally appeared in Business Spectator.

    Bob Day AO is managing director of national homebuilder Home Australia.

    Brighton Beach bathing box photo by Bigstock.

  • A Planet of People: Angel’s Planet of Cities

    Professor Shlomo Angel’s new book, Planet of Cities, seems likely to command a place on the authoritative bookshelf of urbanization between Tertius Chandler’s Four Thousand Years of Urban Growthand Sir Peter Hall’s Cities and Civilization and The Containment of Urban England. Chandler produced the definitive volume of gross population figures for urban areas (cities) over millennia. Angel, takes the subject much further, describing detail how urban areas have grown over the last two centuries, both in population and continuous urban land area. The book focuses principally on population growth,  urban spatial expanse, and density. Moreover, Professor Angel develops both a statistical and analytic framework that complements the voluminous work of Peter Hall. Planet of Cities is liberally illustrated, which greatly aids understanding the trends.

    Urban Population, Land Area & Density Evolution from 1800

    Planet of Cities looks at the urbanization trend from various dimensions. A sample of 30 urban areas was used to gauge urban expansion and density changes from 1800 to 2000.

    At the same time, he describes the well documented urban density declines in the United States as well as the similar trends in Western European urban areas  often been missed by analysts who imagine that spatial expansion is limited to America.

    He goes further, showing that the rapidly growing urban areas of the developing world are also declining in urban density, with spatial expansion rates far exceeding those of population growth. This has been evident in New Geography’s  Evolving Urban Areas series (such as Mumbai, Jakarta, Manila, Ho Chi Minh City and others).

    Angel uses examples, such as Cairo and Accra, Ghana to illustrate both longer term and recent expansions of urban land area and the consequent drastic declines in urban density. In Cairo, the urban land area increased 16 times from 1938 to 2000, well in excess of the approximately 10 times population increase. In Accra, a 50 percent population increase from 1985 to 2000 was dwarfed by a 150 percent increase in urban land area.

    The analysis also includes a larger number (3600) with populations greater than 100,000. He estimates that all of the world’s urbanization covers no more than 0.5 percent of the world’s land. Angel suggests that the world the urban footprint could double or triple in the next few decades. However, he concludes that, even with this expansion, there are "adequate reserves of cultivatable land sufficient to feed the planet in perpetuity."

    Taking note of the slow growth or even population declines in the more developed world, he reminds readers that that nearly all of future population growth will occur in the urban areas of the less developed world. Angel strongly contends that this urban expansion is necessary. This, of course, places him "swimming upstream" against the prevailing doctrines of urban planning. The title of his first chapter "Coming to Terms with Urban Expansion" gives fair warning of his challenge to current planning doctrines. Throughout the volume, Angel expresses the view that declining urban densities are "inevitable," based upon his historic analysis, review of current trends and perceptions of the future.


    A Mumbai slum

    The Prime Concern: Housing

    Angel’s "primary policy concern" as "that in the absence of ample and accessible land for expansion on the urban periphery, artificial shortages of residential land will quickly extinguish any hope that housing will remain affordable, especially for the urban poor…"

    Angel expresses concern that the urban containment policies that so dominate American and Western European planning could be damaging to less developed nations, cancelling out much of the economic rewards of rapid urbanization. He expresses surprise that the attempt to impose Western planning models on the developing world raises so little objection (see China Should Send the Western Planners Home).

    Consistent with his "primary policy concern," Angel offers a "decent housing proposition," countering the present one-dimensional focus on environmental issues. In contrast, Angel suggests a more rounded approach to urban planning. He surmises \ the very purpose of cities:  to improve the economic lot of those who are attracted there. People are not generally attracted to cities because of the quality of their planning or the uniqueness of their architecture. In short, as he puts it, "few move to the city for its fountains." Unless they perform their economic task, cities stagnate or die, as so often happened before the modern age. The near exclusive draw of cities is household economics. Beyond the unprecedented value of the quantitative data and analysis provided, Planet of Cities is rooted in the reality of that   measure.

    At the same time, Angel is himself is unabashedly a planner. He is an adjunct professor of urban planning at the Robert F. Wagner School of Public Service at New York University, a lecturer at the Woodrow Wilson School at Princeton University and a senior research scholar at the urbanization project at the Stern School of Business at New York University.

    Restoring a Genuine Focus to Planning

    Angel expresses a strong interest in the most fundamental of planning issues: the provision of infrastructure that allows the urban area to better serve its residents and those it attracts. He is thus simultaneously for both more and less planning. He would curb the excesses of intervention in land markets that are now rife because they compromise the ability of cities to perform their primary function of improving affluence. He would expand the focus of planning to facilitate the organic urban expansion associated with growing cities.  This means that sufficient available land must be available for development without materially increasing land and house prices. It also requires making provision for the basic infrastructure such as an arterial grid of dirt roads on the expanding fringes of developing world cities.

    Abandoning Destructive Planning Doctrines

    Angel calls for abandonment of artificial limits on urban expansion and population growth (such as urban growth boundaries and housing moratoria) and instead seeks economic development and improvements in the quality of life.

    Professor Angel does not mince words about the consequences of relying of urban containment policy ("smart growth," "growth management," "compact cities,") as a strategy for reducing greenhouse gas emissions. The consequence would be that the "protection of our planet would likely come at the expense of the poor." He adds that strict measures to protect the natural environment by blocking urban expansion   could "choke the supplies of affordable lands on the fringes of cities and limit the abilities of ordinary people the house themselves."  He decries the notion that "cities should simply be contained and enclosed by greenbelts or impenetrable urban growth boundaries as "uninformed and utopian" because it makes sustainability "an absolute end that justifies all means to attain it." This policy approach sacrifices such imperatives as the quality of life and full employment.  

    A Planet of People

    Angel’s treatment is consistent with the urban scaling research of West et al at the Santa Fe Institute, which found that as cities increased in population they become more productive (As we indicated in a previous article, the Santa Fe Institute research did not deal with urban densities, despite misconceptions of some analysts).

    Angel’s concern about the impact on low income households is consistent with the focus of the international sustainability movement, which , declared at the recent Rio +20 conference:

    Eradicating poverty is the greatest global challenge facing the world today and an
    indispensable requirement for sustainable development. In this regard we are committed to
    free humanity from poverty and hunger as a matter of urgency.

    Angel’s Planet of Cities is about urban areas that serve their residents instead of theoretical, often utopian notions.

    Wendell Cox is a Visiting Professor, Conservatoire National des Arts et Metiers, Paris and the author of “War on the Dream: How Anti-Sprawl Policy Threatens the Quality of Life.”

    —–

    Publication information:
    Shlomo Angel, Planet of Cities (2012) Lincoln Institute of Land Policy

    Photo: Cover: Planet of Cities.  http://www.lincolninst.edu/pubs/images/2094_Planet_of_Cities_Cover_web.jpg

  • Florida: When Your Best (Place) Just Ain’t Good Enough

    Real estate broker Coldwell Banker handles corporate relocations for a large portion of our middle class. It recently released a survey of Suburbanite Best Places to Live. While it’s easy to dismiss as a sales tool for their realtors, the survey provides a fascinating glimpse of middle class, suburban preferences, influenced by our current economy. Coldwell Banker’s top honors go to Cherry Hills Village, Colorado, a suburb of Denver. Suburbs of Seattle, New York City, Washington, DC, and other prominent cities feature strongly on Coldwell Banker’s list, which highlights places that are sprinkled evenly throughout the United States. Notably missing are any communities in Florida.

    For a state with sunshine, beaches, and low taxes, Florida just doesn’t have the chops to get even one community onto the top 100 list.

    Weather, evidently, has little to do with our middle class’s desirable locations. Frigid Whitefish Bay, just south of Milwaukee, captured spot #100. Situated along the shore of Lake Michigan, this suburb of 14,000 doesn’t exactly have the kind of weather that makes people flock to the beach. Instead, it offers residents a strong sense of community, heritage, and a culture that values education and family. If you move here, you’ll find yourself within a suburban community with a high homeownership ratio, an educated population, and a quality of life that includes short commutes, low crime rates, close conveniences, and a tendency to eat at home.

    Suburban living has maintained a strong appeal for middle-class Americans due to the popularity of many of the factors on which Coldwell Banker based its rankings. While socialites prefer more urban, dense lifestyles (which is another list that Banker recently produced), suburbanites prefer backyards and quieter neighborhoods away from the hustle and bustle of the city; they don’t need to be near the action. Florida has all these things in abundance, except when compared to… almost everywhere else.

    Windermere, Florida’s top ranked suburb, came closest, ranking just below Whitefish Bay and a couple of others. Like most suburbs on the list, Windermere is on the periphery of a large metropolitan area (Orlando), and contains conveniences, good schools, parks, and recreation facilities.

    For much of its history, Florida represented the suburban American dream. The net benefits included an affordable cost of living and upward mobility, and Florida’s growth has consisted almost entirely of suburban densities. No one can accuse Florida developers of building communities that people didn’t want – the product was carefully researched to fit the market.

    In the late period of the boom, urban options were also developed, in the belief that a new demand for socialite “downtown” style living would emerge. Townhomes and condominiums rose in Florida’s primary and secondary urban markets. Even tertiary cities like Sanford, a historic agricultural town north of Orlando, begot a six-story condo. Those who migrated from Chicago and the dense Northeast now had a diverse set of choices, from rural to urban, with something to please everybody.

    It is perhaps this dilution of the market that has made Florida’s star fade a bit in relation to the national constellation of suburbs. If East Grand Rapids, Michigan (Coldwell Banker’s #8) can outrank the hundreds of suburbs around Tampa, Miami, Jacksonville, Tallahassee, and Orlando, there’s something else going on besides beauty.

    One thing that many of the top 100 have in common is a strong public education system. Florida, which has refused to invest in education, may now be harvesting the bitter fruit of this stubborn negligence. The state’s primary growth today continues to be in retirees who are uninterested in supporting education, and who control a large part of the state’s political power.

    Another aspect that the top 100 suburbs offer is safety. “Safety is a priority,” states the opening page of this survey, but it simply isn’t something that most people associate with the Sunshine State. A state that doesn’t offer a strong sense of personal safety isn’t going to rank highly, no matter what else is being offered. With two out of the ten most dangerous cities in the country, Florida seems more like the wild West than a suburbanite’s dream come true.

    Increasing public safety and public education are two efforts that government can do best, most people agree. Florida has spiraled downward on both fronts. The state’s leadership, by cutting taxes during the worst part of the recession, haven’t exactly helped the situation. With Florida’s new home sales up, the state’s economists are whistling a happy tune, convinced that the worst is over. But what Coldwell Banker is telling Florida is a different, darker story.

    Florida’s best offerings are attracting a population less interested in the core values stated in the Coldwell Banker survey – safety, good education, a sense of community – and so we continue to get more of the same. More population that reinforces Florida’s lack of investment in community, more population reluctant to put money into education, and more population that is quick to move somewhere else at the earliest opportunity seem to be Florida’s fate. This represents a lost opportunity to those who wish to see Florida make gains in these spheres – education, community, and safety. And it represents a lost opportunity to match up a truly beautiful place with truly involved people.

    Corporations seeking to relocate and recruit good people pay attention to these surveys. Florida’s low taxes may lure a few more down south, but if corporations need to attract and retain top talent, this survey points to where they are likely to go, regardless of the incentives our state has to offer.

    Places like Whitefish Bay, Wisconsin; Rossmoor, California; and Haworth, New Jersey will continue to gain in the type of population that share these same values. The middle class, fighting its way back from a threatened extinction, isn’t likely to take a chance on a place that has a rapidly degrading quality of life. Until Florida’s culture starts caring about the quality of its community, safety, and education, our state will continue to grow without flourishing as a place where people desire to be.

    Richard Reep is an architect and artist who lives in Winter Park, Florida. His practice has centered around hospitality-driven mixed use, and he has contributed in various capacities to urban mixed-use projects, both nationally and internationally, for the last 25 years.

    Bigstock photo: Florida Housing

  • Even After the Housing Bust, Americans Still Love the Suburbs

    For decades, Americans have chosen to live in suburbs rather than in cities. Suburban growth has outpaced urban growth, and many big cities have even lost population. But in recent years, some experts have said it’s time for cities to make a comeback. Why? Urban crime rates have fallen; many baby boomers want to live near restaurants, shops, and all the other good things that cities offer; and the housing bust has caused more people to rent instead of buy – sometimes by choice and sometimes out of necessity. Moreover, cities offer shorter commutes, a big draw given today’s higher gas prices and growing concerns about the environment.

    So is there evidence that cities are really making a comeback? Earlier this year, a widely-reported Brookings analysis using 2011 Census estimates suggested that they were, reversing the long-term trend of faster suburban growth. However, it later became clear that those 2011 Census estimates should not be used for areas smaller than counties, which includes most cities and suburbs (see “the fine print” at the end of this post).

    Knowing that we couldn’t use these Census data, we decided to tackle this question another way. Using U.S. Postal Service data on occupied addresses receiving mail, we calculated household growth in every ZIP code from September 2011 to September 2012. (A previous Trulia Trends post explains in more detail how these data are collected.) Consistent with earlier studies of city versus suburb growth, we compared the growth in a metro area’s biggest city with the growth in the rest of the metropolitan area, across America’s 50 largest metros.

    By this measure, there was essentially no difference between city and suburban growth. When we looked at all 50 metros together, household growth was 0.536% in the metros’ biggest cities and 0.546% in the rest of the metro area over the past year – which means that suburbs grew ever so slightly faster than big cities. The biggest city grew faster than the suburbs in 24 of those metros, including New York, Los Angeles, Chicago, Miami and Philadelphia; the suburbs grew faster than the biggest city in the other 26 metros, including Dallas, Houston, Atlanta, Detroit and Phoenix.

    But comparing the biggest city with the rest of the metro area misses some of the action. In most metros, there are neighborhoods outside the biggest city that are more urban than some neighborhoods in the biggest city (as measured by density). For example, Hoboken NJ, just across the river from New York City, is denser and feels more urban than much of Staten Island, which is part of New York City. Central Square in Cambridge, next to Boston, feels more urban than West Roxbury and Hyde Park, two quiet neighborhoods within the City of Boston. In southern California, Santa Monica and Pasadena – which are outside the Los Angeles city boundary – feel more urban than Sylmar, Chatsworth and other outlying neighborhoods in the San Fernando Valley that are technically part of the City of Los Angeles.

    Therefore, we took a new approach. We compared growth in neighborhoods based on whether they actually are more urban or suburban based on their density, regardless of whether those neighborhoods happen to be inside or outside the boundary of a metro area’s biggest city. Within each metro area, we ranked every neighborhood – as defined by ZIP codes — by household density. Neighborhoods with higher density than the metro area average are “more urban”; neighborhoods with lower density than the metro area average are “more suburban.” (See “the fine print” at end of this post.)

    By defining “urban” and “suburban” in this way, suburban growth is clearly outpacing urban growth. Growth in the “more suburban” neighborhoods was 0.73% in the past year, more than twice as high as in the “more urban” neighborhoods, where growth was just 0.35%. In fact, urban neighborhoods grew faster than suburban neighborhoods in only 5 of the 50 largest metros: Memphis, New York, Chicago, San Jose and Pittsburgh – and often by a really small margin. In the other 45 large metros, the suburbs grew faster than the more urban neighborhoods.

    Top 5 Metros Where Urban Growth Outpaced Suburban Growth
    U.S. Metro

    Urban Growth

    Suburban Growth

    Difference: Urban minus Suburban

    Memphis, TN

    0.92%

    0.42%

    0.50%

    New York, NY

    0.58%

    0.27%

    0.31%

    Chicago, IL

    0.31%

    0.26%

    0.06%

    San Jose, CA

    0.73%

    0.71%

    0.02%

    Pittsburgh, PA

    0.44%

    0.43%

    0.01%

    Note: among largest 50 metros.

    Top 5 Metros Where Suburban Growth Most Outpaced Urban Growth
    U.S. Metro

    Urban Growth

    Suburban Growth

    Difference: Urban minus Suburban

    San Antonio, TX

    0.40%

    2.46%

    -2.07%

    Oklahoma City, OK

    0.38%

    1.87%

    -1.49%

    Houston, TX

    0.44%

    1.91%

    -1.48%

    Austin, TX

    0.88%

    2.13%

    -1.25%

    Detroit, MI

    -0.94%

    0.20%

    -1.14%

    Note: among largest 50 metros.

    Looking more closely: what happened to growth in not just in the “more urban” neighborhoods, but in the MOST urban? Within each metro, we split neighborhoods into ten categories, based on their density. The highest-density category covers just the “most urban” parts of big cities (much of Manhattan, for instance, but none of Brooklyn) including a few neighborhoods that are technically outside the metro’s biggest city (parts of Cambridge MA, Arlington VA and Scottsdale AZ, for instance). On the other end of the spectrum, the lowest-density neighborhoods are the “most suburban” (in fact, in some metros, the lowest-density neighborhoods feel downright rural). Now the pattern gets interesting:

    Trulia City vs. Suburban Growth Bar Chart

    In general, the “more suburban” neighborhoods grew faster than the “more urban” neighborhoods. But the “most urban” neighborhoods actually had solid growth, as the leftmost bar in the graph shows. Household growth was 0.54% in these “most urban” neighborhoods,” which matched the overall growth rate for the metro areas examined. Furthermore, among only the largest 10 metros, household growth was 0.65% in the “most urban” neighborhoods, compared with 0.48% growth in these metros overall.

    That’s the punchline: America’s suburban areas are continuing to grow faster than America’s urban areas. Despite falling homeownership, rising gas prices, downsizing baby boomers and improvements to city living, American suburbanization hasn’t reversed. Even though the highest-density neighborhoods, particularly in the largest metros, have grown in the past year, the suburbanization of America marches on.

    We’ve provided the full data set of urban and suburban growth in the 50 largest U.S. metro areas below.

    The fine print:

    • This Brookings analysis showed cities growing faster than their suburbs between 2010 and 2011, based on 2011 Census estimates. Posts at newgeography.com here and here criticized the 2011 Census estimates and questioned research based on those estimates, including the Brookings analysis. The problem with the 2011 Census estimates is that the 2010-2011 growth rates for subcounty areas – which includes most cities and suburbs — were assumed to be the same as the growth rate for the whole county (with the exception of population in “group quarters”).
    • We used the largest 50 metro areas. In this report, the “San Francisco” metro area includes Oakland; “Dallas” includes Fort Worth; “Washington DC” includes the Bethesda metro division; “New York” includes Long Island; and so on. (Most Trulia Trends posts use the smaller “metropolitan division” where they exist for consistency with other housing data reports.)
    • The U.S. Postal Service reports delivery statistics by ZIP codes. We calculated density using 2010 Census data for ZCTA’s, a Census approximation of ZIP codes. 

    Jed Kolko is Trulia’s Chief Economist, leading the company’s housing research and providing insight on market trends and public policy to major media outlets including TIME magazine, CNN, and numerous others. Read more of his work at Trulia Trends blog.

    This piece originally appeared at the Trulia blog.

    Suburban neighborhood photo by Bigstock.