Category: planning

  • Predictable Punditry Down Under

    The New South Wales Government has been following an extreme version of currently fashionable planning doctrines based on higher population densities. These policies have resulted in exorbitant housing costs and increasing traffic congestion.  A Liberal/National Coalition Government has come into power in New South Wales, replacing the previous Labor Government. In its election platform it promised to change planning policies for the better. These include fewer additional dwellings to be forced into Sydney suburbs, more fringe land release, decentralisation and giving planning powers back to the community.

    The New South Wales Department of Planning bureaucracy is consequently ostensibly devising a new housing strategy.  As the main feature in a community discussion on this new strategy, the Department organised a presentation by Harvard Professor Edward Glaeser in Sydney entitled “Triumph of the City”, The promotional description read

    recognised as the world’s leading urban economist, Harvard University’s Professor Edward Glaeser, along with four of NSW Government’s planning and infrastructure experts, will discuss fresh approaches to meeting Sydney’s biggest challenge now and into the future — planning for a population that is expected to increase from 4.2 million to more than 5.6 million by 2031”.

    Previous consultation exercises for planning strategies had proved to be tokenistic and mere public relations exercises.  Unfortunately this event proved to be no exception. It promoted the current high-density policies with no discussion of alternatives or fresh approaches.

    Professor Glaeser spoke about how cities evolved as engines of development and wealth creation. He portrayed cities facilitating people getting together, sharing ideas and building on previous innovations. He described how the advent of popular means of transport — from horse drawn transport to cars — allowed cities to spread and maintained that low density areas are associated with longer car journeys and larger homes that consume more energy. To facilitate the person to person contact he considers necessary to sustain innovation and to reduce energy consumption he advocated ever higher-densities closer to the city core.   

    He implied this is especially important so as to set an example to highly populated China and India in order to limit the otherwise huge escalation in energy usage in those countries.

    Throughout the proceedings the conference facilitator promoted the concept of high densities by such statements as “We need to re-examine the suburban model, living more like urban model” and “Go up, not out.  Can we do that? How do we do that?”
    The overwhelming impression given by the consultation proceedings was that high-density is the only possible strategy worth considering and that Glaeser’s USA perspective can be applied to New South Wales.

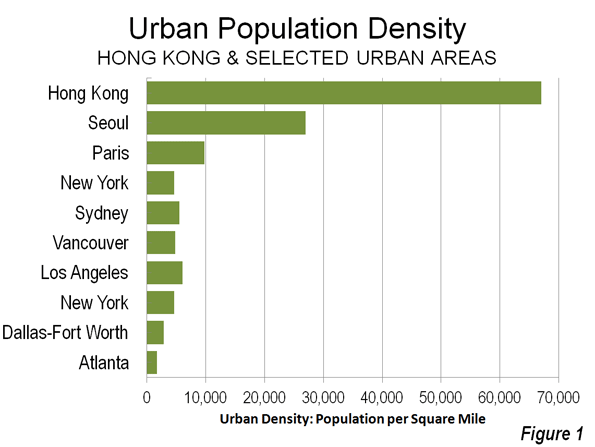
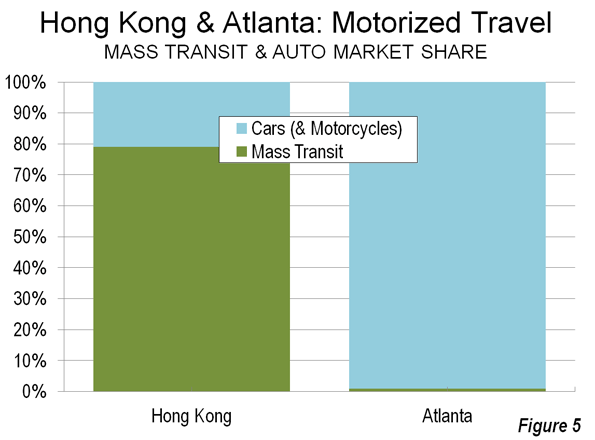
    Yet the argument that high density means more innovation seems flawed. In the United States of America the greatest innovative activity takes place not in crowded Manhattan but in regions of densities similar to that of Sydney, the urban area of which has 2100 persons per square kilometre (5,500 per square mile).  The San Jose urban area in Silicon Valley, with a similar population density, has a booming world-changing local technology industry including Cisco Systems and IBM. It also is almost totally dependent on automobiles, with only a small share of people taking transit.

    Companies operating in Hillsboro in the Portland urban area (population density of 1400 per square kilometre or 3600 per square mile) include Yahoo!, Credence Systems, Synopsys, Epson and Sun Microsystems.  Seattle, the home of Microsoft and the initiation of Boeing, has a population density of 1,200 per square kilometre, or 3,000 per square mile. The densities in these dynamic areas are equal to or less than that of Sydney and a far cry from the Manhattan or even Hong Kong type of density of 25,000 (67,000 per square mile) or more that Glaeser seems to prefer.

    Although high-density living may not be for everyone, apparently, particularly those with kids. Glaeser, like another prominent advocate of rapid densification, David Owen “copes” with living in suburbia.  I guess dense housing is for other families.

    The claim by Glaeser that high-density is superior environmentally also is not borne out in Australian studies.  A publication of his finds emissions in low-density suburbs in several United States cities to be higher than in high-density suburbs.  Australian data does not show this.

    A study of energy-related emissions at the final point of consumption finds per capita energy usage in a group of low density Sydney suburbs (96 GJ per annum) to be lower than in high-density suburbs (169 GJ).  One of several factors accounting for these differences is there are more people per household in the lower density areas. Glaeser models emissions on a “standard household” of 2.2 people; many, if not most suburban households, have more than that number, although city households frequently don’t.  One wonders whether possible differences in the number of people per dwelling in high-density and low-density areas can be adequately catered for in such models.

    For another thing, the Australian climate is very different and that is probably a significant reason for higher densities to be more energy intensive. If dwellings are too close they are more difficult to cool whereas it is easier to heat them.  Also, cooling technically needs more energy than heating as a much larger volume of air needs to be circulated (NOTE 1).

    Glaeser’s advocacy of high-density to reduce transport emissions needs special consideration.  In Australia such reduction, if any, is trivial.  Transport greenhouse gas emissions account for only a small proportion of household emissions and higher-densities reduce these to a minimal extent. (NOTE 2

    It is not only in Australia where evidence for significant environmental benefits from high-density planning is lacking.  As a result of studies testing the relative performance of spatial options in England, Echenique et al conclude: “The current planning policy strategies for land use and transport have virtually no impact on the major long-term increases in resource and energy consumption. They generally tend to increase costs and reduce economic competitiveness. The relatively small differences between options are over-whelmed by the impacts of socioeconomic change and population growth”.

    The Department of Planning-sponsored Glaeser presentation was not a genuine consultation. It promoted existing government policies with no attempt to consider their downside or to discuss alternatives.  It is extraordinary and downright arrogant to expect Sydney communities to change their preferred mode of life to live in tiny apartments perched in towers (see picture) in the unproven expectation that this will significantly reduce greenhouse gas emissions. It is yet even more extraordinary to presume that such a transformation would influence policies in China and India in any significant way. The days when these great countries looked to the West for models has already passed; and look where many people from these countries settle when they get to the United States or to Australia: the suburbs. Classic cases include the San Gabriel Valley East of Los Angeles, the Santa Clara Valley communities of Silicon Valley, large swaths of northern New Jersey and to Sydney’s North Shore in Australia.

    The proceedings proved to be an attempt to promote a particular point of view, so perpetuating previous approaches of trying to manipulate opinion in the guise of consultation.

    It appears clear that in spite of a change of government there will be no change in planning policies.  The new government looks like having been captured by the bureaucracy and its cult of densification that has no more chance of changing its views than the College of Cardinals is likely to eschew the Papacy. 

    (Dr) Tony Recsei has a background in chemistry and is an environmental consultant. Since retiring he has taken an interest in community affairs and is president of the Save Our Suburbs community group which opposes over-development forced onto communities by the New South Wales State Government.

    Photo: Kowloon, Hong Kong

  • Housing Affordability Protests Occurring in “Livable” Hong Kong, Not “Sprawling” Atlanta

    The Economist has published another in its city rating series, under the headline "The Best city in the World." This one was the result of a contest examining ways to elaborate on its rating system. The winner, Filippo Lovato, added a spatial dimension to the ratings, which included a 5 point rating of "sprawl," a pejorative term for the natural expansion of cities (which in this article means urban areas, areas of continuous urban development). Much of the urban planning literature is pre-occupied with combating urban sprawl, though urban expansion continues virtually everywhere around the world, as cities add population and become more affluent.

    Livability for Whom?

    As Jon Copestake, the Editor of the Economist Intelligence Unit’s Cost of Living and Livability surveys and I discussed in front of a Property Institute of Western Australia meeting, The Economist livability ratings are not aimed at average resident households, but rather at an international audience, such as corporate executives and corporate relocation services. This distinction can be important.

    Hong Kong was top ranked for livability in the new Economist list. Doubtless this is accurate for well paid executives posted temporarily, who are granted substantial housing allowances by their employers and who can live in luxury condominiums within a short walk or taxi ride to their jobs in Central (the core of the Hong Kong central business district).

    For local residents, livability is measured differently than for jet-setters or corporate executives.

    Hong Kong: Smart Growth Model

    With the developed world’s highest urban area density and lowest automobile market share, Hong Kong beguiles anti-sprawl "smart growth" crusaders, for whom these two characteristics are the "two great commandments."

    The entire  Hong Kong urban form (urban area) is as dense as Manhattan at 67,000 per square mile (25,900 per square kilometer), but is more than twelve times the density of the New York urban area: the city and its “sprawling” surrounding suburbs (5,300 per square or 2,100 per square kilometer). Similarly, Hong Kong is somewhat more dense than the ville de Paris, but seven times the density of the Paris urban area (9,800 per square mile or 3,800 per square kilometer). This hyper-density combined with one of the world’s strongest central business districts give Hong Kong a nearly 80% mass transit share of motorized travel, nearly 10 times that of the New York urban area and more than three times that of the Paris urban area (Figure 1).

    "Livable" Hong Kong?

    To its permanent and unsubsidized residents, though, Hong Kong’s spatial Nirvana does not provide much in terms of livability.

    Excessively Long Commutes Hong Kong’s high density indicates that jobs and houses are relatively close to one another, which should indicate that commute times would be short. Not so. Commutes are among the longest in the developed world – only Tokyo residents take more time to get to work. (Figure 2)

    The average one way commute is 46 minutes in Hong Kong, well above the developed world average of 33 minutes for urban areas over 5,000,000 population. By comparison, commuters in similarly sized Dallas-Fort Worth (26 minutes) and "gridlocked" Los Angeles (27 minutes) get to work much faster. Commuting also takes longer in Hong Kong than in Paris (34 minutes) and London (37 minutes).  Lengthy commutes impose an economic price and make Hong Kong less livable.

    Exorbitant House Prices: Hong Kong’s housing, the largest household budget item, is profoundly unaffordable. The 8th Annual Demographia International Housing Affordability Survey rates Hong Kong as the most costly out of 325 metropolitan areas. The median house price in Hong Kong’s is 12.6 times the median annual gross household income (the "median multiple"), which leaves little more than a pittance in discretionary income for many households. Perhaps this is why Hong Kong’s fertility rate has fallen to rock bottom levels near the lowest on the planet – people cannot afford kids.

    Even during the housing bubble, coastal California never became so unaffordable. Hong Kong housing is nearly twice as costly as San Francisco (6.7 median multiple) and more than four times as costly as Dallas-Fort Worth (2.9), Houston (2.9) or Atlanta (Figure 3).

    Concern about housing affordability has become so intense that it is an issue in public protests, which The Economist reports to have drawn up to 400,000 people earlier this month (link to photo). Exorbitant house prices make Hong Kong less livable.

    "Sprawling" Atlanta

    Things are much different in "sprawling" Atlanta, which The Economist’s spatial list ranks as the worst among the US entries. Atlanta is at the opposite end of the density spectrum from Hong Kong, with the lowest urban population density of any major developed world urban area.

    Short Commutes: Atlanta’s low density would suggest that jobs and houses must be so far apart that commute times are very long. Again, not so. Atlanta commuters have among the shortest travel times (29 minutes) in the world among urban areas of similar size (see Note: Jobs-Housing Balance). Shorter travel times make Atlanta more livable (Figure 4).

    Other similarly sized US urban areas do even better, such as Dallas-Fort Worth (26 minutes) and Atlanta’s leaders know that traffic congestion need to be eased to improve Atlanta’s competitiveness. But the political process politics has offered a dysfunctional plan that would spend more than half of a new tax on mass transit, which is used by only the one percent. Less than one half of the money would be spent on the roads that the 99 percent use (Figure 5). Any strong growth will overwhelm the stingy highway improvements, and if the voters approve the July 31 referendum, Atlanta’s travel time advantage over Hong Kong could narrow.

    Affordable House Prices: Despite being the bane of planning orthodoxy, Atlanta’s has far better housing affordability than Hong Kong. The median multiple is 1.9, compared to Hong Kong’s 12.6. Hong Kongers pay six times as much of their income for their houses (which are also two-thirds smaller than in Atlanta). So far, there have been no protests against Atlanta’s low house prices. Better housing affordability makes Atlanta area more livable.  

    The Hong Kong Model

    Hong Kong’s high density (more than double that of any other large developed world urban area) is an accident of history, the result of geo-politics, not urban planning. Further, China’s impressive new cities are being built at a small fraction of Hong Kong densities. Yet, Hong Kong has given much to the world. Not least is the fact that its market oriented economy served as the model for economic reform which has radically improved livability for hundreds of millions of people in China.

    Further, Hong Kong is attractive as one of the world’s premier tourist destinations. For aficionados of cities, like me, Hong Kong is intensely interesting. It is the ultimate in urbanization. It is a wonderful place to visit and to live – if someone else is paying the bills.

    However, the interplay between Hong Kong’s hyper-dense urban form and its transportation system burdens Hong Kong residents dearly, both in time and money. For them, Hong Kong is hardly a model of livability.

    ——————-

    Note: Commuting in Dallas-Fort Worth: Larger Dallas-Fort Worth has faster average work trip travel times than Atlanta, at 26 minutes, which are principally are aided by its much superior freeway (motorway) systems and arterial street (non-freeway boulevard) systems. Transit carries about one-half the share (0.6%) of travel in Dallas-Fort Worth as in Atlanta.

    Note: Jobs-Housing Balance: One of urban planning’s principal goals is to achieve a jobs-housing balance, wherein jobs and housing are so close that people can walk to work or use transit, minimizing travel times and distances. Hong Kong is best in this, with its small urban footprint. Yet, despite having achieved the ultimate, it takes Hong Kongers much longer to get to work than Atlantans. The comparison of Hong Kong and Atlanta shows this theoretical measure to be of little importance. A better indicator of the jobs-housing balance is practical – how long it takes to get to work.

    Note: Travel Times by Car and Transit: Mass transit has substantially longer average work trip travel times than cars in nearly all of the world metropolitan areas for which data is available. In Atlanta, the average work trip by car (single-occupancy) was 29 minutes in 2007, compared to 54 minutes for mass transit.

    ———-

    Wendell Cox is a Visiting Professor, Conservatoire National des Arts et Metiers, Paris and the author of “War on the Dream: How Anti-Sprawl Policy Threatens the Quality of Life.”

    Photograph: Kowloon, Hong Kong (by author)

  • Modern Families: Fact from Fiction

    I sometimes struggle with our willingness to look straight through evidence to see only what we want to see, or what we believe we should be seeing. Some recent interpretations of the Australian census and conclusions about housing form and consumer choice regrettably fall into this category.

    Early results from the Australian census may have disappointed some boosters who have actively promoted the view that the typical family household is a thing of the past. The argument has had many forms but usually includes one or more of the following:

    • that single person households are the fastest growing household type; that lifestyle choices mean that more people want to live closer to city centres;
    • that the suburban housing block is an environmental calamity and is no longer even suited to what households want;
    • that high density, multi-level housing with high reliance on public transport is a preferred housing model for the ‘new’ generation of family types.

    And so it goes.

    Sadly for the promoters of rapid social change, the census reveals that the facts aren’t on their side. Indeed, in terms of housing form and family type, nothing much has really changed. There have been movements at the margin and movements in both directions, but nothing I would interpret as conclusive evidence of fundamental social change.

    Housing form

    Across Australia, 73.8% of us live in a detached house. In the last census, it was 74.3%. That’s hardly a seismic shift. In 2011, 14.6% of us lived in apartments compared to 14.7% five years earlier. Townhouses account for 9.9% of households versus 9.3%.  Don’t hold the front page, nothing much has changed.

    There are regional differences. In Sydney, detached housing is at 58.9% from 60.9% while apartments represent 27.6% of households against 26.4% five years earlier. This higher proportion in apartments comes as little surprise given the highly restrictive planning policies of NSW in that period and prior (which included a virtual prohibition on suburban expansion), combined with the long established tendency of Sydney to accommodate more people in apartments than other capitals. But for all the hype about Bob Carr’s ‘brawl against sprawl’ and subsequent planning regimes, the actual change in housing has been minimal. (Instead, what happened is that the industry stopped supplying much of either).

    In Melbourne by contrast, detached housing represents 71.1% of housing from 71.6% five years earlier. Apartments are 16.6% versus 16.4%. Melbourne, and Victoria generally, has had a less deterministic approach to planning whereby detached suburban expansion hasn’t been as vigorously opposed, so the higher dominance of the detached house is no surprise. But it also shows little change over recent times, which doesn’t support the view that a majority of consumers would prefer higher density over lower.

    In Brisbane, detached housing is at 77.6% versus 78.7% five years earlier, which is a very small change and also one of the highest proportions of households in detached housing in the country. Once again, the evidence isn’t pointing to massive social change. It isn’t even pointing to modest change.

    Family type

    Also regrettable for the promoters of widespread social change has been the fact that family types have remained largely unchanged. There are 43% of people living as a couple with children (it was 43.3% five years earlier) and there are 39.5% living as couples without children.  Remember also that ‘couples without children’ includes couples in the pre-family formation stage (young, and starting out in life in the main) and also ‘empty nesters’ (parents whose children have left the family home). A further 16% are single parent families. 

    The Census this time also went into some detail about same sex couples. But set aside the media and political hype and the facts show that the proportion of same sex couples across the country is 0.7%. There’s been a lot of media comment and public policy attention recently about that 0.7%.

    The inevitable conclusion from this evidence is simply that the overwhelming majority of people in Australia remain families who either have children, who plan to have children, or who have had children who have left home, and that this proportion hasn’t changed to anywhere near the extent promoters of social change might have wished.

    This also has implications for housing choice and style. There will be a market for higher density, inner city housing but our policy makers need to keep in mind that the detached home remains the overwhelming preference for families as a place to raise children. That also includes couples planning to raise children (not all of whom live in apartments until the first child comes along – many prefer to plan ahead) and it also includes couples with children who have left home but for whom a third or fourth bedroom is needed for grandparent child minding or children returning to the family home.

    However, the evidence hasn’t stopped some sections of the media or social commentators from reaching entirely different conclusions. “Up not out for housing” declared one writer who wrote: “Australia is increasingly favouring higher density living, according to the 2011 census.” Really? Based on the same evidence above? You’d be seriously pushed to draw that conclusion. Add to this that supply side policies have restricted the choice of detached housing in preference to the promotion of higher density, which means that increasingly housing choice has been restricted, and what there is of it, much more expensive. To conclude anything about ‘favouring’ one type of housing or another, without assessing the supply side policy constraints which limit choice, is a bit like saying more people prefer mangoes in summer than in winter. Duh.

    The Grattan Institute is another that seems committed to turning the evidence on its side to support pre-determined points of view. In this opinion piece, Grattan Institute cities program fellow Peter Mares concluded that: “that despite paying significantly more to put a roof over their head than they were five years ago, many are not ending up in the kind of housing that best matches their preferences.”  Describing the “popular view that we are wedded to the suburban block” as a mismatch, the conclusion is that ‘we’ (being, I presume, the unelected policy makers)  need to have “a serious, if difficult, conversation about what type of housing we should build and where it should be built.”

    Well, that would be difficult if it means imposing a form of housing on a population that might prefer to make its own choices about what type of housing it ‘should’ have and where they ‘should’ be living. 

    These aren’t the only examples and as more Census data becomes available, plenty more commentators will seek to extrapolate minor changes at the margin into claims this represents evidence of fundamental social change. It doesn’t and we can only hope our policy makers know the difference between evidence and a sitcom.

    Ross Elliott has more than 20 years experience in property and public policy. His past roles have included stints in urban economics, national and state roles with the Property Council, and in destination marketing. He has written extensively on a range of public policy issues centering around urban issues, and continues to maintain his recreational interest in public policy through ongoing contributions such as this or via his monthly blog The Pulse.

    Family illustration by BigStockPhoto.com.

  • Coney Island’s Invisible Towers

    When crowds thronged Coney Island for the annual Nathan’s hot dog eating contest on July 4th, they found a boardwalk amusement strip that was, for the umpteenth year in a row, undergoing a summer of change and transition.

    There is the new: go-carts and a new roller coaster for the "Scream Zone" that the Luna Park amusement park added last summer; and the start of a new pavilion alongside the Parachute Jump, where the old B&B Carousell (second "l" now enshrined as a historic typo), relegated to storage since 2005 and painstakingly restored at city expense, will once again whirl next spring.

    There is the disappeared and the disappearing: Henderson’s Music Hall, where Harpo Marx made his stage debut, was demolished two winters ago by landowner Thor Equities; this spring, it was replaced by a nondescript one-story structure that, lacking tenants, was instantly boarded up with plywood. And barring an unforeseen reprieve, this will be the final summer for both Denny’s ice cream and the Eldorado bumper cars, each of which is expected to see its Surf Avenue storefront razed for new construction — or at least occupied by new businesses — in the near future.

    It’s another step in the remaking of the Brooklyn beachfront that began in 2003, when the city launched a rezoning process to transform the diminished yet still-popular summer destination into what it hoped would be a year-round hot spot for both residents and entertainment-seekers. In the years since, what seemed like the beach’s inexorable slow slide into decay — a bathhouse burned down one decade, a derelict rollercoaster razed the next —turned into a whirlwind of change, as developers and longtime neighborhood property owners alike began smelling greenbacks in the air, and the 46-year-old Astroland amusement park and many longtime boardwalk businesses were pushed out in the rush to make way for promised glitzier attractions.

    Yet amidst all the noisy mermaid-filled debates that accompanied the rezoning battle, it’s been easy to forget that the amusement district proper — a beachfront strip of rides, carny games and skeeball parlors that over the decades has shrunk to a relict dozen or so acres — was never the main target of the city’s rezoning efforts. Though the storefronts along Surf (including the homes of Denny’s and Eldorado) were slated for high-rise hotels on the city’s rezoning renderings, much of the focus of the Coney Island Development Corporation (spun off by the city Economic Development Corporation in 2003 to oversee redevelopment plans) was to the west, where the city’s stated intent was to bring mixed-use housing and retail towers to the vacant lots that have littered Surf Avenue since they were cleared for urban renewal in the 1960s. Click here to see a map of the rezoned area.

    "It’s a neighborhood with a significant amount of poverty, very few jobs and lots of abandoned lots," said city Economic Development Corporation (EDC) president Seth Pinsky after the rezoning was approved by the City Council in 2009. The hope at the time was that by dropping some high-end residents into Coney Island, as well as new storefronts along Surf Avenue that could host restaurants, movie theaters and other year-round attractions, local residents could finally have access to more than the seasonal jobs that have traditionally accompanied the summer beach season.

    Three years later, though, there is little sign of the condo messiah arriving anytime soon. A single apartment building on the boardwalk at West 32nd Street was begun two winters ago, but today remains unfinished. Nearby, Coney Island Commons, a mixed-income coop complex that will include a new YMCA-run community center, has blown past its original summer 2009 target completion date — thanks to delays in finalizing financing and community agreements, according to developer Jerome Kretchmer — and is now slated for an opening in 2013.

    Among the actual lots rezoned three years ago, meanwhile, Thor’s plywood-bedecked single-story building is the only sign of new construction. In particular, the "Coney West" lots just west of the Brooklyn Cyclones stadium, which in city renderings appeared as modern glass-and-brick towers fronting tree-lined boulevards, remain much as they have for decades: empty expanses of dirt and gravel, used as ad-hoc parking lots if anything at all.

    Some of this, no doubt, can be blamed on the collapse of the housing bubble, which struck just as the city put the finishing touches on its rezoning plan. Yet even if demand for beachfront condos rebounded tomorrow, many longtime residents warn that it would still take years, if not decades, of sewer and electrical upgrades before Bloomberg’s residential dreams could become reality.

    "Before they put up one major building, they basically have to rip up the entire peninsula, and put in stormwater lines and sewage lines," says Ida Sanoff, a former Community Board 13 member who has become the beachfront’s most dedicated environmental watchdog.

    It’s an investment that the city says it’s willing to make — eventually: The EDC is now openly talking about a "30-year plan" for redevelopment. The price tag, according to city figures, could run close to half a billion dollars, making it one of the most expensive city redevelopment projects of the Bloomberg era. And even then, it’s an expensive gamble by the city that the promised construction will ever arrive.

    * * * *

    If Thor Equities’ Joe Sitt was the developer that Coney fans loved to hate — the man who evicted Astroland, who threatened to build high-rise apartment buildings and hotels right on the boardwalk — then Taconic Investment Partners were the designated good guys. With none of Sitt’s bluster, the real estate investment firm quietly bought up several blocks of vacant lots along Surf Avenue — one, bought by Sitt for $13 million, cost Taconic $90 million less than a year later — and announced plans to work with the city to bring in mixed-use condo towers at a respectful distance from the amusement zone.

    Taconic officials were amiable and readily accessible at the time, but have since all but disappeared from public view; company officials did not return numerous calls and emails for this article, and its websitenotes only that "Taconic is in the process of evaluating the economics of a planned development for some or all of our holdings."

    The city, meanwhile, is moving slowly on the infrastructure upgrades that it will take to support the new buildings, when and if they arrive. The first phase — a set of new storm sewers and ungraded sanitary pipes along W. 15th St. and a short stretch of Surf Avenue — is currently in the design phase, with work set to start in the fall and a target completion date of 2015. Two more phases will expand into surrounding blocks, but not until 2022. A total of $140 million has been budgeted for new sewer and water lines between West 12th Street and West 21st Street, according to EDC.

    But the peninsula’s infrastructure needs, according to longtime locals, go far beyond the few square blocks around the Taconic properties. "Everything south of Surf Ave., there’s no storm water lines in," says Sanoff. "You’re going to have a lot of paved surfaces, and where is all that stormwater going to go?" Already, she says, "If you walk the beach here after a heavy rain, it’s just littered with poop bags" that dog owners have thrown into the sewers — and which have popped back up when stormwater backs up.

    "The whole peninsula is in need of [infrastructure work]," says CB13 district manager Chuck Reichenthal. "You can’t put up highrise hotels, buildings, or anything else, when what exists now has flooding problems."

    Brian Gotlieb, who served as chair of Community Board 13 from 2002 to 2006, says he expects that the city would have moved more quickly on sewer upgrades if developers were champing at the bit to put shovels in the ground. Even so, he worries that sewers are only the tip of the iceberg when it comes to needed infrastructure upgrades. "Coney Island has always had problems with brownouts and blackouts," he says, predicting a need for major electrical upgrades. (EDC says these will be handled by ConEd on an as-needed basis.) And then there’s the eventual demand for schools to educate the children of all those condo dwellers if and when they arrive.

    What the total cost would be, no one can say. The city Independent Budget Office projects a total city expense of $277 million on land acquisition, park and boardwalk reconstruction, and other neighborhood capital projects through 2013; add in the $140 million budgeted by the Department of Environmental Protection for sewer work, and the total price tag is at $417 million. (If you include the $39 million Keyspan Park and $250 million Stillwell Avenue subway terminal — first put in motion when Rudy Giuliani was touting Coney Island and as the next Times Square — total public expense on the rebuilding of Coney rises to more than $700 million.) And that’s not even factoring in any increased costs of protecting a newly developed beachfront from the ravages of climate change: In 2007, Rohit Aggarwala, who was then running Mayor Bloomberg’s PlaNYC project to plan for the city’s future growth, called a five-inch rise in water level by 2030 "a moderate scenario"; a University of Arizona sea-level mapping toolprojects that in a worst-case scenario, Coney Island could be reduced to three disconnected islands by the end of this century. (The rezoning does require that local streets be raised to guard against sea-level rise, according to EDC, but specific plans—and budgets—will be worked out only "as sites are developed.")

    This is par for the course in city redevelopment efforts, says Hunter College planning professor Tom Angotti. "I don’t know of anyone who systematically calculates costs in New York City," he says. "The infrastructure that does get built is a very pragmatic response to either developer needs or community opposition." In other cities, he notes, "when you have a significant negative impact, then there’s a whole discussion of whether new infrastructure is needed — here, it doesn’t get discussed."

    * * * *

    If there’s an upside to the city’s deliberate pace, it’s that if the market for Coney condos never recovers to pre-crash expectations, then taxpayers save the hundreds of millions of dollars it would take to build the infrastructure to support the influx of new inhabitants. (The $95 million the city spent to relieve Sitt of his stretch of the amusement district, though, is a sunk cost.) The downside is that then the last ten years of upheaval on Coney Island has failed to achieve its primary goal.

    It would also mean the death of hopes that the rezoning drama will ultimately produce jobs for the impoverished blocks to the west, a cul-de-sac known as the West End that sports some of the highest unemployment rates in the city. During the rezoning battle, a coalition calling itself Coney Island CLEAR, made up of representatives of several city unions and a handful of locals (most prominently Rev. Connis Mobley of the West End’s United Community Baptist Church), lobbied for job guarantees for local residents as part of the rezoning.

    Gotlieb, who served on CLEAR’s board, says that the hope was that new development would bring not just jobs — which in Brooklyn as often as not employ people outside the immediate neighborhood— but training opportunities to help residents plan for careers. And while the CIDC has helped some people get building certifications, he says, so far there’s been little to build. "Once the economy took a turn that it did, nobody was doing a heck of a lot."

    For now, the city is publicly professing patience, with an EDC spokesperson saying that an timetable for the Taconic properties "is determined by the private developer," adding, "We’re less than three years into a 30-year redevelopment plan and significant progress has already been made. We’re confident the 2009 rezoning lays out a practical pathway going forward."

    Looked at another way, though, this round of predictions of a reborn Coney Island has been going on for almost a decade, and its biggest booster is only a year and a half from departing City Hall. If the long history of failed plans for the neighborhood — from the post-war urban renewal plans that first created today’s vacant lots to Ed Koch’s late-’70s promises of beachfront casinos — tells us anything, it’s that in Coney Island, nothing is a sure bet.

    This piece originally appeared at The Brooklyn Bureau.

    Photo By Pearl Gabel.

  • Questioning the Messianic Conception of Smart Growth

    A new analysis from the United Kingdom concludes that smart growth (compact city) policies are not inherently preferable to other urban land use policy regimes, despite the claims of proponents."The current planning policy strategies for land use and transport have virtually no impact on the major long-term increases in resource and energy consumption. They generally tend to increase costs and reduce economic competitiveness." The article goes on: "Claims that compaction will make cities more sustainable have been debated for some time, but they lack conclusive supporting evidence as to the environmental and, particularly, economic and social effects."

    These would not be surprising findings to Newgeography.com readers, who are accustomed to similar analyses rooted in economic, demographic, and environmental data. However, this article appeared in the Spring 2012 issue of the Journal of the American Planning Association, under the title, "Growing Cities Sustainably: Does Urban Form Really Matter?"

    Moreover, the authors are urban planning insiders, including Marcial H. Echenique, a land use and transport professor at Cambridge University, Anthony J. Hargreaves from the Martin Centre for Architectural Studies at Cambridge, Gordon Mitchell from the Faculty of the Environment at the University of Leeds and Anil Namdea of the School of Engineering at the University of Newcastle.

    Smart Growth Criticisms

    Many of the British critiques parallel those made by critics of smart growth for years. They focus particularly on the concern that smart growth generally has neglected economic and social costs. For example, smart growth policies lead to higher house prices by rationing land (such as with urban growth boundaries). Higher house prices lead to less discretionary income for households, so that there is less money for other goods and services, lowering employment levels. The resulting densification leads to more intense traffic congestion, with resulting economic losses and more intense air pollution, which is less healthful.

    The Research

    The authors modeled land use and travel behavior in three areas of England, subjecting them to three land use alternatives: compact development (smart growth), planned development (which I would label "smart growth light") and dispersal, the generally liberal approach common in United States, Canada, Australia and New Zealand for decades after World War II (and still in many US and some Canadian markets).

    Echenique et al analyzed the London metropolitan region (Greater London Authority, Southeast England and East England), which has a population of 20 million and the Newcastle (Tyne and Wear) metropolitan region, which has a population of 1,000,000. They also analyzed a sub-region within London metropolitan region, Cambridge, with a population of 500,000.

    Their model projected little difference in outcomes between the three land use regulatory regimes to 2031. Predictably, land consumption was less under the compact development, but the variation in land consumed varied no more than plus or minus one percent from the trend (base case) in the London area, where only 11 percent of the land is in urban or transport use. Other factors, such as the change in transport energy use, greenhouse gas (GHG) emissions from transport and residences and air pollution varied little between the three regulatory regimes.

    Economic costs in 2031 were projected to be the lowest (best) for the dispersed option and the highest for the compact development option, both in the London and Newcastle metropolitan regions. Planned development ranked second.

    The compact development option scored best in the Cambridge sub-region, while the planned development option was the highest cost. The dispersed option ranked second. The researchers attributed the better result for compact development in the Cambridge area to its uniqueness as a low-density, centrally oriented, high-tech, university community and further noted that densification could "reduce its attractiveness over the longer term."

    Smart Growth Claims: Setting the Record Straight

    Based upon their research and review of the literature, the authors proceed to undermine some of smart growth’s most sacred foundations.

    Smart Growth Claim: Smart growth has little or no impact on house prices:

    Echenique et al: "…restrictions on the supply of development land have led to property price increases, penalizing city dwellers by leading to less dwelling space…”

    Smart Growth Claim: Smart growth increases housing choice:

    Echenique et al: "One downside of this policy is a substantial reduction in choice of dwelling types, with new dwellings being mainly apartments."

    Smart Growth Claim: Smart growth does not increase traffic congestion:

    Echenique et al: The authors cite research indicating that high average density is the main cause of highway congestion in Los Angeles. They also cite Reid Ewing (University of Utah) and Robert Cervero (University of California) who reviewed studies of household travel behavior finding that a doubling of density would lead to only a 5 percent reduction per person, or an increase of 90 percent in travel (Note 1). The authors add: "The obvious conclusion is that an increase in density will increase traffic congestion."

    Smart Growth Claim: Smart growth reduces air pollution:

    Echenique et al: "It can also increase the overall respiratory disease burden as exposure to traffic emissions is increased.

    Smart Growth Claim: "Empty nesters" (aging households with no offspring at home) will seek smaller houses in the urban core: 

    Echenique et al: "There is, however, no substantial evidence that older couples leave their spacious houses and gardens…"

    Smart Growth Claim: Smart growth improves the jobs-housing balance.

    Echenique et al: "One of the main arguments for the dispersed city is that there is no longer a single center where most jobs and services occur. Urban areas, rather, exhibit a dispersed and often polycentric structure, bringing jobs and services closer to residents with a more complex movement pattern not readily served by public transport.

    The authors suggest the following "takeaway:"

    "Urban form policies can have important impacts on local environmental quality, economy, crowding, and social equity, but their influence on energy consumption and land use is very modest; compact development should not automatically be associated with the preferred spatial growth strategy."

    Thus, the Echenique et research contradicts the thesis that compact development or smart growth should replace (make illegal) other regulatory regimes, including the more liberal dispersed pattern.

    "Smart growth principles should not unquestioningly promote increasing levels of compaction on the basis of reducing energy consumption without also considering its potential negative consequences. In many cases, the potential socioeconomic consequences of less housing choice, crowding, and congestion may outweigh its very modest CO2 reduction benefits."

    The British research is an important step toward focusing urban policies on objectives, rather than means. Cities are economic organisms. They have increased their share of the population 10 fold in just two centuries and been pivotal to unprecedented economic growth and affluence. People moved to the cities for economic opportunity, not to sample particular urban forms. Cities best serve their principal purpose and their residents best when they encourage economic growth. The fundamental objective is to maximize the discretionary income of residents, and this can be done while reasonable environmental standards are maintained. Yet, as Echenique et al and others have shown, smart growth tends to retard economic growth. In an age of teetering national economies, failing pension funds and the most uncertain fiscal environment in at least 80 years, the world needs cities to be unleashed for the economic growth. Urban policies that ignore economics need to be replaced with wholistic approaches strongly focused on the key reason that cities exist: to enrich their citizens.

    Wendell Cox is a Visiting Professor, Conservatoire National des Arts et Metiers, Paris and the author of “War on the Dream: How Anti-Sprawl Policy Threatens the Quality of Life.”

    ——

    Photo: Letchworth Garden City, London metropolitan region (by author).

    Note 1: Calculation: According to the research, doubling the density of an area reduces vehicle travel per capita by 5 percent. With 200 percent of the previous population (double the density), vehicle travel would be increased 90 percent (200% [x] 95% [=] 190%).

  • Architecture Critic Paul Goldberger on Silicon Valley, San Jose, and Apple

    Last week Paul Goldberger, Pulitzer Prize winning architecture critic for the New Yorker and Vanity Fair, sat down with Allison Arief of the San Francisco Planning and Urban Research Association (SPUR) in downtown San Jose to discuss the state of 21st Century urbanism with a focus on Silicon Valley. Though admired the world over as the preeminent center for technological innovation, Silicon Valley has never been known for its great architecture. Goldberger suggested that this reputation could’ve improved had Apple not missed the mark with the design of their proposed Apple Campus 2 building in Cupertino.

    While acknowledging that Apple is probably the best design company at the moment, Goldberger asserted that the company’s design abilities end with small consumer gadgets and fail spectacularly at the urban level. Calling the Norman Foster designed building for the new Apple Campus a ‘beautifully designed donut or spaceship’, he lamented the lack of context and connection to anything around it. Speaking to an audience that included members of San Jose’s city government, Goldberger suggested that Apple missed the opportunity to take the reins to help transform San Jose by relocating at least some of its operations to help its long struggling (and subsidized) downtown.

    The reality is that most of the big tech companies in the Valley, not just Apple, have an extreme indifference to place-choosing to locate operations in suburban office parks. This has much to do with the history of Silicon Valley planning as it does with the nature of tech companies, which tend to employ legions of introverted computer engineering types and go to great lengths to remain insular and secretive (Apple taking this to the extreme). Perhaps it also makes perfect sense that rather than even acknowledging the true urban environment, companies whose primary business is creating the virtual world in which we increasingly experience public life take an active stance on turning their backs on the city.

    Yet for those still interested in experiencing the delights of pre-Information Era, pre-21 Century urbanism, there is always San Francisco not far up the road.  Goldberger made the point that the handful of tech companies who do choose to locate their operations in the city probably have a different mindset than those that stay in the Valley. Twitter being the prime example of the moment- the micro blogging site just leased 400,000 square feet of space on a long-maligned section of Market Street. Up in Seattle, Amazon recently announced its plan to build three new 37-story towers in the downtown area, which the proposal’s architect said is “not about building a corporate campus, it’s about building a neighborhood.”

    So even though not every tech company is averse to the city, the Richard Florida argument that high urban density is a prerequisite for innovation and creativity is a bit of a stretch, as the economic success of suburban Silicon Valley continually disproves. Near the end of the discussion, Goldberger suggested that deliberately designing space for innovation might be a bit too self-conscious. This implies that rather than design, factors such as human resources, access to capital and a culture with openness to trial-and-error matter more than the traditional urban hardware of cities.

    Adam Nathaniel Mayer is an American architectural design professional currently based in China and California. In addition to his job designing buildings he writes the China Urban Development Blog. Follow him on Twitter: @AdamNMayer.

  • Midcentury Modern

    Midcentury modern tours now are taking place in cities all over the country. Renewed interest in this era capitalizes on the millennials’ interest in design from a time that seems almost impossibly optimistic compared to today’s zeitgeist. Most cities around the country boast a healthy building stock from this postwar period, nicknamed “the suburbs,” although these are ritually condemned – and designated for annihilation – by academics, urban land speculators and the urban clerisy.

    Yet the new interest in the mid-century modern form reflects its basic and enduring appeal. As the curious and the trendy take bus tours of these inner-ring neighborhoods, the forms of this era evoke a sense of great confidence and faith in the future, both of which seem to be lost in the obsession with neo-traditional forms that hearken to the pre-car era or to the cartoonlike, sculpture-as-architecture one sees in many urban centers.

    Suburban expansion after World War II reached out beyond the streetcar systems that created the traditional neighborhoods of the late 19thand early 20th Century. The returning GIs wanted something simple and affordable to begin their lives after serving their country. Confidence surged in America’s know-how and ability to solve even the deepest social problems. The triumph of science and technology was a palpable presence. The dark side, of course, was the atomic threat, restraining our enthusiasm but only a little.

    In this midcentury era, planning and design began to be car-based. Residences were designed to show off the car, putting it out front for display – and some home plans even had tailfinned beauties in the living room


    Living Garage, photo from Populuxe by Thomas Hine

    Consumer goods were no longer accessed on foot; a new form of luxury consisted of driving up to the front door of a shop with parking in front. Front-loading houses and stores became unquestionably more efficient as a means to accommodate the new American lifestyle.

    Yet despite the auto-orientation, the architecture of this era retained the pedestrian scale and intimate feel that marked Main Street before World War 2. This both/and aesthetic marks the form of the 1940s and 1950s, with streamlined design styles like Art Deco Revival and materials like glass and stainless steel. Gentle angles suggested motion, and the theme of mobility was everywhere in the architecture.  Wider streets and lower, longer horizontal lines accommodated this theme and even today the architecture reinforces a feel of motion when driving past these structures.

    Modernism also formed a certain ethic. To be modern was more than a lifestyle choice; it was an acceptance of science, knowledge, and technology, free from preconceptions.  At the time, modernism elevated architecture above the style debate, and was considered even a shedding of styles. The politics of the time was similarly marked by Truman’s “straight talk”, and there was a shedding of rhetoric and posturing that lasted up until Joe McCarthy began once again a divide-and-conquer campaign against people.

    Translated to the suburbs, modernism meant practical homes, without the adornment that marked Victorian architecture. Instead, modernist residences were marked by deep horizontals and large picture windows, providing a sense of openness that was a hallmark of modernist thought. Floor plans also were open, allowing free movement through space, rather than cutting the house up into cluttered little parlors, dining rooms, or nooks. 

    Today, midcentury modern design is fetishized for mass consumption in magazines like Dwell that emphasize acquisitiveness over ethics. But back then, the design meant something else, something cleaner and more powerful. In the 1950s, modernism meant consumption, but even more, the modernism defined the quest for the inner self and a new, forward looking outlook.

    By reducing modernism to a sofa style or wallpaper pattern, we risk losing all that this era stood for.  Buildings from the 1950s have sustained themselves through multiple recessions, the rise of the internet, cultural acceleration, massive city growth, and globalism. So perhaps they point towards a real definition of sustainability by having good bones and adapting through all these changes.

    The current millennial generation seeks a practical domestic situation, much like returning GIs. Most would prefer to reduce car-trips, but are realistic about this goal, given the range of their travel. Most in this generation see right through car-free living claims; more than one of my students, when discussing walkability, stated that “I’m not gonna lug my groceries even a block in this heat.” The battle with the car is chiefly about making the car more efficient, and less ubiquitous through the use of telecommuting and on-line shopping. It is not about removing it from the scene entirely.

    So as McMansions have swollen to represent a kind of architectural obesity, they have made many midcentury neighborhoods unfashionable, for typically these older homes have one parking space, often in a carport, not a true garage. They also are front-loaded, a much more efficient planning concept than alleys, but then the car becomes part of the front façade. Millennials have a hard time understanding what’s wrong with that. Again, as one 28-year-old student put it to me, “It’s just a house, after all…what’s the big deal?”

    Developers seeking first-time homebuyers, however, respond to the regulatory climate, which favors solutions like garages on alleys, big homes on tight lots, and neotraditional styling.  Bonus density and other zoning incentives rig the game in favor of this highly regulated development pattern, even in the exurbs.  Here in Central Florida, the development zone nicknamed Horizon West has been codified to enforce these form-based principles, with stiff permitting fees and a highly participatory government staff to keep things on the straight-and-narrow.

    Keeping prices low with all this overburden requires developers to cut the cost of the home drastically, likely reducing lifespan of components and systems. Ironically, the house meeting these tortured standards of today is less sustainable than the house built in 1953, with better bones and an adaptable floor plan.

    Meanwhile, these 1950s neighborhoods are under attack for their very form. Cities, persuaded by planners to heal the effects of the car, cannot do so in a granular manner, so ordinances are passed  forbidding front-facing garages, or garages set back arbitrarily from the house front. These 1950s homes, with their carports, couldn’t be built today, and so are reduced to the status of heritage sites from a bygone era. In Winter Park, garages are banished to the rear on new homes, and if you are adding a garage to your midcentury home, it must be arbitrarily set back at least four feet from your front wall whether or not your lot can accommodate this arbitrary, and seemingly pointless, ordinance.

    Of course mid modern tours allow people to rediscover the essence of the 1950s, and these overlooked neighborhoods could be the springboard for a new era in modern planning.  Front-loaded neighborhoods can be successful when the architecture is designed at a human scale, and fine-grained integration of residential and commercial uses point to a future of home-office, cottage-industry, people-based industry once again.

    The Victorian era ended rather abruptly in the 1890s with a series of economic catastrophes that changed America’s middle class. Architecture switched to a more streamlined, Edwardian style – simple, flexible, and utilitarian forms that quickly gave rise to modernist design.  This current economic transition may well bode a similar outcome – design styles, often labeled “contemporary,” reduce the amount of architectural gingerbread and fussiness, reducing cost and maintenance, and may be favored by the coming generation for its cleanliness and utility.

    A new era that manages the car at a human scale, forgives people for wanting mobility and efficiency, and allows for contemporary exploration of style and design can and should inform new neighborhood planning. Midcentury suburbs, rediscovered by popular interest, can point the way to a middle ground between mcmansion-style subdivisions and neotraditional fussiness, and maybe even help us rediscover our confidence and faith once again.

    This essay is a summary of Richard Reep’s talk “Populuxe and the Atomic Bungalow” given at the 3rd annual Colloquium on Historic Preservation, hosted by Friends of Casa Feliz, Winter Park, Florida in April 2012.  Richard and his wife, Kim Mathis, hosted a midcentury modern tour in their own 1950s home for the colloquium.

  • CNU20: Shootout at the New Urbanism Congress

    I knew there was the possibility that this month’s Congress of New Urbanism — CNU20 — in West Palm Beach would be an exercise in brainwashing. While I was excited to be meeting some of the thinkers at the forefront of my profession, I certainly was aware that the founders of the movement were opinionated and outspoken. The number of attendees has way outgrown the close dinner group that began New Urbanism more than 20 years ago, but heavy hitters like Andres Duany, Elizabeth Plater-Zyberk, Ellen Dunham-Jones, and John Norquist, to name a few, still have a big hand in the direction of the movement.

    I was pleasantly surprised to find just the opposite. The first session was a debate on theology between two very prominent urban designers, Daniel Solomon and Andres Duany, which set the tone of challenging our own and each other’s beliefs in what New Urbanism is and should be.

    During what is hopefully the worst economic downturn I will ever see there has been almost no New Urbanism development. The movement, along with the rest of the housing market, has stalled. When the market picks back up will developers and planners condemn the stringent LEED-ND framework, a prescriptive guide for sustainable development developed in part by the CNU?

    Daniel Solomon thinks so. In Solomon’s lecture, which he humorously titled “My Dinner with Andres,” he challenged the prescriptive and code-based turn New Urbanism had taken, saying that the movement’s implementation guide, particularly LEED-ND, “strangles and sucks the life out of the American economy.” He blamed Duany’s Smart Code and Manual, describing Duany as a man who was rigorous and defiant in his beliefs, and simultaneously as a man who questioned his own ideas constantly, saying “Andres Duany creates an intellectual straightjacket that others wear, but that he won’t even put one arm in.”

    I think I understand why people gravitate towards concrete codes and manuals. We live in a time that is full of challenges for our built environment. People feel comforted by a set of rules: Here’s a problem, and if I follow this, I can fix it. This equals confidence and control for urban designers and planners.

    But perhaps Solomon’s most striking argument was to call the New Urbanist code a “reductive certitude” that was no different than Le Corbusier’s Athens Charter. For the uninitiated: Just the mention of this document makes planners shudder. It is blamed for some of the biggest idealistic planning screw-ups ever. Solomon’s argument was that, like Duany’s Smart Code, Le Corbusier’s plan was written with certainty, and with little room for questioning. It was a quite a slam to compare Andres Duany, the founder of the very movement to which all in attendance subscribe, to Le Corbusier, often cited as the destroyer of city life. Man, were we in for a rebuttal.

    And we got one.

    I was eagerly watching the first row for the response of some of the New Urban heavies. Ellen Dunham-Jones leapt up immediately, cheering and loudly applauding. It was obvious that there was a divide in this union, but it existed in a context that welcomed it.

    Duany came out on fire in defense of his “straightjacket,” saying that the code allows for local calibrations and adaptations. His argument focused on the fact that the real world is a world of laws, not a world of opinions and ideas, and that the same system that was used to destroy the urban form can be responsible for fixing it. Disputing the notion that without a code planners will be free, he made the case that the building code is the default setting for US municipalities, it is not going away, and that we need to use it to make change. In short, don’t fight the system; use it to your advantage.

    Interestingly, Duany also defended those who love traditional suburbs. He described research exercises where people were shown a picture of an ideal New Urbanism development, and a picture of typical suburban scenario. The former usually contained a compact, dense cottage with a picket fence and beautiful streetscape. The latter contained a plain house with garage alongside the front door, sitting on a large, empty street. Despite the obvious attempt to sway opinion, 30% of people still chose the suburban scenario as their optimal place to live. He takes the stance that these people’s freedom to choose older-style suburbs must be protected, and that his smart code provides for that.

    I challenge you to watch the session here and ask yourself the same questions about New Urbanism that these men do. I look forward to sharing my response to the other sessions at CNU20. Stay tuned….

    Erin Chantry is an Urban Designer in the Urban Design and Community Planning Service Team with Tindale-Oliver & Associates, and the author of At the Helm of the Public Realm. A different version of this post appeared there. With a BA in Architecture, an MA in Urban Design, and an MSc in Urban Planning, she has served Florida Community Loan Fund, Townhouses at Henrietta, West Palm Beach, FL. Developed by New Urban League CDC / Urban League of Palm Beach County.

  • A Free Range Life

    Some may have never heard of the term exurbia before now. According to the free on-line dictionary it means: The exurbs collectively; the region beyond the suburbs.

    Exurbia to me is an expression that defines a free range lifestyle. Where I live there is space, nature surrounds my house, I can play music as loudly as I care to, trails connect me to beautiful places, when a recipe calls for lemons or rosemary, I can walk outside and collect whatever I need, and a seasonal garden provides all the abundance I require to make healthy and organic meals.

    Getting around town is easy and I usually find everything I need in one trip. I used to live in an urban area and now feel grateful that I don’t have to cope with the inconveniences of that lifestyle any more. More on that later!

    It takes about 20 minutes for my husband to commute to work every day. When the day is over and he comes home, he looks forward to propping up his legs, reading and smoking a cigar. We have neighbors and we like waving to them from across the way. Recently, we have been getting together to make wine.

    We did not always have the privilege to live in this atmosphere of peaceful, quiet living. When we lived in the city, we were constantly fighting for parking spaces, we had to traipse up and down stairs to do laundry and then dry clothes on a line outside and risk icicles on the sleeves of our shirts and the bottom of our pants.  The traffic was exhausting and the noise from the neighbors below us, behind us, and on top of us was annoying and distracting. Raising kids in this environment was tedious and kept us constantly vigilant.

    The day we finally moved into our house in the exurbs was a great day! Unfortunately, our dream of retiring in this home, developing the orchard and the garden, and enjoying our new quality of life, may be directly impacted by a new trend in planning called sustainable development and smart growth.

    As I research these new planning trends I have learned that what this force of change really means is a whole life plan. Sustainable development seeks to change the way we live, how we interact with nature, how we choose to use our land and our property (all property–even your own person!!), where we live and how we live! It is a massive propaganda piece to change our behavior and how we think.

    We must educate ourselves about the truth behind the ‘green’ agenda, the urban consolidation agenda, the livability agenda, and any and all agendas having to do with sustainable development.

    In order to recognize this whole life plan when you see it, you must understand the words they are using and the methods they are using to implement it. The planners, environmentalists, social activists, city, state and federal officials, media, and public relations firms are telling us what these plans are. We are not educated yet.

    I want to share my exurban quality of life.

    Check out Mary Baker’s new blog, Exurbia Chronicles.

  • Toward More Competitive Canadian Metropolitan Areas

    The Federation of Canadian Municipalities (FCN) and the Canadian Urban Transit Association (CUTA) have expressed serious concern about generally longer commute trip times making Canadian metropolitan areas less competitive. Each has called for additional funding for transit at the federal level to help reduce commute times and improve metropolitan competitiveness.

    The Right Concern

    The concern over commute times is well placed. Economic research generally concludes that greater economic and employment growth is likely where people can quickly reach their jobs in the metropolitan area. Five of the nation’s six major metropolitan areas (Toronto, Montréal, Vancouver, Ottawa-Gatineau and Calgary) have average one-way work trip travel times that are among the highest in their size classes among 109 metropolitan areas in the more developed world for which data is available. Only Edmonton has an average commute time that is among the shortest (Table 1).

    Table 1
    Average One-way Commute Times: Major Metropolitan Areas
    Compared with International Major Metropolitan Areas
    Major Metropolitan Area One-way Commute Time (Minutes) Overall One-way Commute: Rank out of 109 One-way Commute: Rank in Population Class
    Population Size Class
    Toronto 33 97th  Over 5,000,000 11th out of 19
    Montréal 31 90th  2,500,000 – 5,000,000 19th out of 23
    Vancouver 30 86th  1,000,000 – 2,500,000 60th out of 67
    Ottawa-Gatineau 27 60th  1,000,000 – 2,500,000 55th out of 67
    Calgary 26 58th  1,000,000 – 2,500,000 50th out of 67
    Edmonton 23 15th  1,000,000 – 2,500,000 15th out of 67


    The Wrong Answer

    Yet the solution – more transit and funding for transit – misses the mark. Transit does many things well, but it does not reduce commute times (Figure 1). According to Statistics Canada, average commute times by transit in the Toronto, Montréal and Vancouver metropolitan areas are from 30 per cent longer to nearly double those of average automobile commuters (Note 2). Some 58 percent of car users (drivers and passengers) reach their work locations in under 30 minutes, something accomplished by merely y 25 percent of transit commuters. Overall Toronto commute times are longer than either Los Angeles – famed for its traffic – as well as much less dense, and far less transit dependent, Dallas-Fort Worth. In Toronto, 21 percent of commuters take transit, compared to two percent in Dallas-Fort Worth. Among Montréal commuters, 20 percent use transit and spend more time commuting than their counterparts in more decentralized Phoenix, where less than two percent take transit. Commute times in transit-focused Vancouver are worse than much larger Los Angeles and indeed longer than nearly American metropolitan area, including Dallas-Fort Worth, Houston, and Philadelphia (Table 2).

    Given this pattern, transferring car travel to transit likely would increase commute times and make metropolitan areas even less competitive.

    Table 2
    30- and 40-minute Commute Shares:
    Representative Metropolitan Areas
    Population Classification Work Trip Under 30 Minutes Work Trip 30 to 44 Minutes Work Trip Under 45 Minutes
    5,000,000 and Over      
    Dallas-Fort Worth 59% 24% 83%
    Los Angeles 55% 24% 79%
    Toronto 48% 25% 73%
    Paris 45% 22% 67%
    2,500,000 – 5,000,000      
    Phoenix 57% 26% 83%
    Montréal 47% 27% 74%
    1,000,000 – 2,500,000       
    Edmonton 68% 20% 88%
    Indianapolis 66% 22% 88%
    Ottawa-Gatineau 65% 21% 86%
    Tampa-St. Petersburg 62% 22% 84%
    Calgary 54% 29% 83%
    Vancouver 55% 21% 76%
    Source: Statistics Canada, U.S. American Community Survey, National Institute of Statistics and Economic Studies (France)


    The Geography of Transit

    Rational Transit and Downtown:Transit’s greatest strength is in providing access to the largest downtown areas. These areas have the greatest job densities (jobs per square kilometre) in their metropolitan areas and are typically well served by frequent, rapid and convenient transit service from throughout the metropolitan area. This combination of high employment density and superior transit service attracts one-half or more of all downtown commuters in Canada’s major metropolitan areas to transit (Figure 2). Transit is meets the needs of people who commute to downtown and is the rational choice for many, if not most. However, downtowns contain only a relatively small share (14 per cent) of metropolitan area jobs (Figure 3).

    Rational Personal Mobility Elsewhere: Areas outside downtown lack any such intense concentration of jobs. The area outside downtown, accounting for 6 out of every 7 jobs (Figure 4), maintain much lower employment densities and generally lacks transit service. This is illustrated by the nation’s largest employment center, which surrounds Pearson International Airport in Toronto. Its more than 350,000 employees are spread around an area the size of city of Vancouver (or the city of San Francisco) at a density so low that quick and efficient transit is simply impossible.

    For the overwhelming share of work trips to outside the downtown area, the car does the job and transit accounts for less than 10 percent of commuters. Thus, the automobile is the rational choice for most people who commute to locations outside downtown. And things are not getting better for transit. According to Statistics Canada, employment has been growing much faster outside of downtown than in the high density core areas suited for transit. The 2011 census indicated a continuing dispersion of population as well.


    Transit’s Robust Funding Growth and Declining Productivity

    Strongly Rising Transit Subsidies: Transit subsidies have been growing strongly. According to Transport Canada data, from 1999 to 2008 subsidies grew 83 percent (adjusted for inflation), which is more than three times the 26 percent ridership growth rate and 3.5 times the rate of general inflation. Transit’s declining productivity could indicate a substantial potential for improved cost effectiveness and service expansion within the generous present funding levels.

    Declining Transit Productivity: At the same time, there are concerns about transit productivity. The Conference Board of Canada has documented a 1.2 percent annual decline in productivity for two decades. The same analysis found productivity in other transport sectors to be generally improving. Transit costs have risen well in excess of inflation, service levels and ridership. Rising costs seriously limit transit’s ability to increase its share of travel in metropolitan areas and limits the important role that it is called upon to play in providing door-to-door mobility for the transportation-impaired, such as disabled citizens, the elderly, and students.

    Land Use Strategies that Retard Metropolitan Competitiveness

    Policies that Could Make Metropolitan Areas Less Competitive: While the prospects for improving transit commute times are discouraging, some current land use strategies further increase traffic congestion and lengthen commute times and make metropolitan areas and make metropolitan areas less competitive . Compact cities (also called smart growth) policies have been adopted across Canada in an effort to reduce automobile use and increase urban densities. The planning expectation is that housing should be placed near rail stations. Yet job locations throughout metropolitan areas remain highly dispersed, and with the rise of working at home, are becoming more so. The potential for transit systems (or walking or cycling) to materially impact commuting is very limited in the least.

    International data indicate that higher densities are associated with greater traffic congestion. Further, higher traffic densities are strongly associated with higher levels of air pollution. Improvements in vehicle technology will make reductions in automobile use to reduce greenhouse gas emissions unnecessary, according to U.S. research by McKinsey & Company. Finally, smart growth type policies have been found to retard metropolitan economic growth in the Netherlands, the United Kingdom and the United States (Note 2).

    Improving Metropolitan Competitiveness

    Strategies that reduce commute times can improve metropolitan competitiveness. Expanded telecommuting reduces average commute times by its very nature (though the reported commute times routinely exclude the working at home sector, both in Canada and the US). There are also lessons to be learned from Edmonton and the international metropolitan areas that have been more successful in maintaining shorter commutes: more dispersed employment, lower population densities and a larger share of travel by car (Table 3).

    Table 3
    Comparison of Canadian and U.S. Major Metropolitan Areas
    Average One-way Commute Times and Urban Area Densities
     
    CANADA Canada Metropolitan Areas United States: Metropolitan Area Size Classes
    Commute Time Principal Population Centre Density (per KM2) Average Commute Time Average Principal Population Centre Density (per KM2)
    5,000,000 and Over        
    Toronto 33 2,900 28 1,400
    2,500,000 – 5,000,000        
    Montréal 31 2,200 26 1,200
    1,000,000 – 2,500,00        
    Vancouver 30 1,900 23 1,100
    Ottawa-Gatineau 27 1,900
    Calgary 26 1,600
    Edmonton 23 1,100
    Principal Population Centre: Largest population centre (Statistics Canada term for urban area) in the metropolitan area.


    Focusing on Objectives: To become more competitive, Canada’s metropolitan areas need to improve their average commute times. This requires focusing on strategies that have the highest potential to reduce traffic congestion.

    Residents and businesses in metropolitan areas would be best served by goal-oriented and objective policies squarely directed toward getting people to work faster. The focus should be on what makes commutes shorter, regardless of transport mode, rather than on idealistic notions of how a city should look or how people should travel.

    Wendell Cox is a Visiting Professor, Conservatoire National des Arts et Metiers, Paris and the author of “War on the Dream: How Anti-Sprawl Policy Threatens the Quality of Life”.

    –––

    Note: This article is based upon the recently released Frontier Centre for Public Policy report Improving the Competitiveness of Metropolitan Areas by Wendell Cox, who also serves as a senior fellow at the Centre.

    Note 1: Data not provided for other metropolitan areas.

    Note 2: On a related note, the Bank of Canada (the central bank) and others have indicated a concern about rising house costs relative to incomes. This is to be expected in metropolitan areas adopting green belts, urban growth boundaries and other land rationing policies. Huge housing price increases have occurred in Vancouver, Toronto, Montréal and Calgary (for example), in response to such policies (This is evident from the annual editions of the Demographia International Housing Affordability Survey, sponsored in Canada by the Frontier Centre for Public Policy). The Bank of Canada may be virtually powerless to slow this loss of housing affordability, since its cause (constraining metropolitan land supply) is beyond the reach of the Bank’s monetary policies.

    Photo: Suburban Montreal (by author)