Category: planning

  • Smart-Growth and Smarter Technology

    If you’re an enviro-regulator with a mission, preventing “sprawl” has been ideologically trendy in recent decades. You have successfully predicated your argument on past-history soils-management technological inadequacy, it must be enormously threatening to look back and realize that technology has been gaining on you and is now capable (in engineering terms) and affordable (in end-user cost terms) of enabling just the sorts of rural development the majority of the market-for-housing wants, but you’ve been trying so hard to prevent: Currier-and-Ives-tradition large-lot houses in the countryside.

    Case in point: the inadequate-soils argument long used by anti-rural-housing-and-business advocates to demand that buildings not be built anywhere soils aren’t naturally capable of environmentally-sound management of on-site sewage flows, and connection to a piped municipal sewer system isn’t feasible.

    One way to win the sewage-flow argument is to control the information flow so that targets of your engineering-inadequacy argument don’t get to know about technologies they might employ, passing all tests of environmental quality and product affordability, to build and occupy the house and-or business in the countryside they want and you don’t want them to have.

    If you’re good at it, you can keep the new technologies pretty much unknown to the public long after they’ve ceased being new. For example: chances are your local and regional planners and zoners never passed along to you the Winter 1996 issue of “Pipeline,” a quarterly effort of the National Small Flows Clearinghouse, a Federally-funded enterprise of the National Environmental Services Center within the U.S. Department of Agriculture and headquartered at West Virginia University. That issue was devoted almost entirely to a then-quite-innovative alternative to traditional septic-tank-and-disposal-field design: it was labeled “aerobic” to reflect its use of electric-powered air flows to enable oxygenated digestion, in contrast to the anaerobic design for traditional septic tanks.

    As the text explains, “aerobic…a good option…where soil quality…isn’t.” The Aerobic Wastewater Treatment module can be installed and used irrespective of natural site conditions. That was 26 years ago. Last month, the State of Maryland adopted legislation to advance “Smart-Growth” and prevent rural development by establishing new and more rigorous criteria for septic (anaerobic) tank installations. Not a word in the press releases about aerobic technology. Irony: your tax dollars pay for “Pipeline,”  which describes its objective as “small community wastewater issues explained to the public,” but in the last 26 years there’s been zero effort, on the part of your planners and zoners to assist in that effort. Have they actually worked to suppress such (in their opinion) non-useful information, possible counterpoints to their growth-control doctrines? You decide.

    It was (and still is) understandable that land with low-permeability clay soils, high water tables, shallow depth to bedrock, and similar negative qualities would be disqualified for in-ground septic systems on the grounds of predictable system failure. If non-soil-based systems didn’t exist, the logic of rural-development-prevention (no access to municipal piped systems) would prevail. That’s why Denver, back in the 80s, mounted a regional green-belt anti-sprawl campaign by curtailing municipal system expansion into previously-unserved real estate. It’s not understandable that development controls based on soil (in)capabilities should still be in place long after non-soils-based technologies have been engineered, manufactured, and marketed. Unless, of course, the soil-capability argument was an excuse, not a real reason.

    * * * * * *

    Before these little AWT packages became available (and have been unsuccessfully publicized by the Feds since the 90s) the industry was already interested in an even lower-tech non-soils-based design: the evapo-transpiration concept, where primary-treated effluent coming from a traditional septic tank is released into an under-sealed heavily-vegetated patch (in some designs, a shallow lagoon) where about two feet of vertical evaporation will take place annually if rain and snow are kept off. That’s a typical number for northern New England.

    Depending on location with respect to septic-tank discharge, electric power for pumping may or may not be needed. But industry interest was pretty much trumped by regulator hostility. Many fruitless meetings were held in Montpelier and Waterbury on the subject, even one at which copies of the 1980 Environmental Protection Agency Design Manual were handed around the table, to no avail.

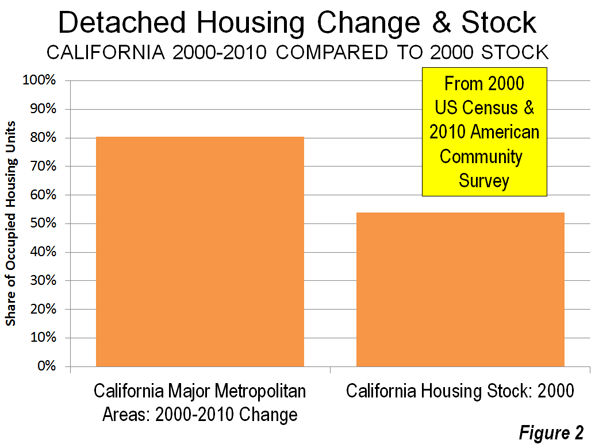
    This raises the basic Smart-Growth question: can it be sold to (or forced on) a generally unwilling public only by pretending that the engineering basis for “sprawl” doesn’t work? There’s ample historical evidence –see Chapter 5, Ben Wattenberg’s “The First Measured Century”, for example—that “…the preference for the single-family detached house was even higher at the end of the 20th century than at the beginning…” but the top-down campaign against just such “sprawl” continues anyway.

    It doesn’t seem to matter that such exemplars of Smart-Growth as Portland, OR now show some of the highest housing costs in the nation; or that a new Cal State report on housing costs and young-adult out-migration speaks to a preference “…for raising children on backyards rather than condominium balconies.” One way to counter that, of course, would be to make the backyard even more expensive than the condo by pretending that the traditional on-site sewage system for the former is an engineering health hazard, and that no environmentally-acceptable customer-affordable alternates exist.

    To advance Smart-Growth it helps to keep the research and publications of the National Small Flows Clearinghouse as hidden as possible. There are some things, you understand, that the natives are better off not knowing, lest it make them restless.

    Martin Harris is a Princeton graduate in architecture and urban planning with a range of experience in fields ranging from urban renewal and air-industrial parks to the trajectory of small-town planning and zoning in States like Vermont.

    Rural Vermont home photo by Bigstockphoto.com.

  • London’s Social Cleansing

    Unscrupulous landlords are forcing poorer tenants out of their London homes, freeing them up to rent out to visitors to the Olympics this summer, according to the housing charity Shelter. At the same time, the government’s cap on rent subsidies (Housing Benefits) for those out of work or on low incomes threaten to force less well-off tenants out of the capital. Newham Mayor Sir Robin Wales says that they will have to move people as far afield as Stoke-on-Trent if they are to meet their obligations to house the homeless. Fears of ‘social cleansing’ featured in the Mayoral election where Tory incumbent Boris Johnson made sure to distance himself from his own government’s policy to beat off the challenge from veteran left-winger Ken Livingstone.


    Inner London, outer London (Newham in red); London, Stoke-on-Trent

    Critics of London’s ‘Social Cleansing’ have fixed on the changes to the law regarding housing benefits and the Olympics, but failed to notice that working class Londoners have been being forced out of the nation’s capital for some time now – thanks to the ceaseless rise in house prices. On the London Programme in 2003, I said that without opening up more land to building in the green belt, house prices would spiral out of control, pricing ordinary Londoners out of the capital. Mayor Ken Livingstone slapped me down saying that he would never sanction building on the green belt.

    Today Eva Wiseman, a commissioning editor on the upmarket broadsheet, the Observer, says that she cannot afford to rent in London’s once poorest borough, Tower Hamlets, let alone buy a house. She cites Shelter’s estimate that you would need an income of £67,669 to rent there (average income is £26,244).1

    It is not hard to understand why prices are so steep. Housebuilding in the UK has failed to keep pace with demand. New housing starts are slightly up after the crash, but overall they are woefully short of actual need. The reason is that Britain has among the most stringent laws on building – the ‘planning laws’ – which stop building on the ever-growing ‘green belts’ that surround our cities.

    Given that the working class are the Labour Party’s natural constituency, you might have thought that its years in government (1997-2010) would have seen more homes built for working people. But Labour turned its back on the working classes a long time ago, while keeping its neurotic interest in regulating the economy. The outcome was a re-vamped planning system that put the brakes on home building. This time this was done in the name of the environment, not to protect the Tory Shires from ‘bungaloid sprawl’, as it was originally intended. Housebuilding fell below the bare minimum of 250,000 you would need just to replace the increasingly dilapidated stock.

    When David Cameron’s Conservative-Liberal coalition came to power in 2010, his Communities Minister Eric Pickles and Housing Minister Grant Shapps had promised a large scale liberalisation of the planning laws – and even blamed their predecessors for doing more damage than the Luftwaffe to Britain’s housing stock. But the fine print on Shapps’ new planning law proved as prohibitive as what went before. Even those champions of the Green Belt at the Guardian were moved to editorialise that ‘these convoluted and qualified planning laws will become another aid to the big-money lawyers’. 2

    The Conservative government’s commitment to liberalisation is like its Labour predecessor’s commitment to the working class, theoretical. Home building remains stalled, and prices have not seriously fallen despite the shortage of credit). Governments of all stripes are most committed to orderly regulation of change, and dread the unsupervised activity of their citizens – a prejudice which has only led to chaos.

    The short supply/rising price dilemma is particularly intense in London. A metropolis of nine million creates a fierce competition for prime sites. Even putting aside the super-rich boroughs, like Kensington and Chelsea, where average prices are £1.3 million (roughly $2 million US), the overall London average is £406,000 ($770,000 US) .

    Besides being the most logical place for real estate speculation from around the world, London also has been in the grip of the planning system. It was in London that the Labour mayor took on architect Richard Rogers as an advisor, and committed the capital to a programme of building only on brownfield (already developed) land, ‘building up, not out’. The result is not much building at all, except to pack more four and five storey blocks into what few pockets of green space can be grabbed. His successor Boris Johnson has avoided challenging the Livingstone system, preferring a quiet life to any hint of controversy.

    Rather than face the problem of the absolute shortfall in new homes, most critics have fixated on peripheral issues, such as the number of empty homes (which, despite the attention they receive, are, because of high prices, at an all-time low). Easy credit, too, has been blamed for high prices, which is true, but the shortage of credit has not led to a great fall in prices, because the underlying problem was the absolute shortage of homes. Others have argued that the British are too wedded to the idea that they should own their own homes, and could rent, like the Germans, failing to understand that the availability of homes to rent depends on their being built, and rents tend to move in the same direction as prices, as The Observer’s Eva Wiseman has discovered. London’s Mayors have dedicated much attention to schemes to build ‘affordable homes’ – sometimes reserved for occupations like teachers and firefighters – though these are too few in number to have much impact on prices overall.

    Over time, this means working people are being priced out of central London. Tim Butler, Chris Hamnett and Mark Ramsden’s analysis of London’s employment in the 2001 census shows that outer London and the South East is more working class than inner London. Inner London had more large employers, professionals and managers than outer London and the South East. Outer London had more routine, semi-routine and technical or lower supervisory workers. Inner London did have more unemployed than outer London, and outer London had more self-employed than inner London. This employment profile was new, following changes that took place after fifteen years of economic growth, say Butler and his colleagues, though many have noted the sharper contrasts between wealthy enclaves and impoverished housing estates dogged by underemployment. 3

    These social changes show inner London’s parallel embourgeoisment and deepening social poverty. Of course, those who live in the outer suburbs scoff at the protests from well-heeled social commentators about the prices in inner London as ‘Zone Six snobbery’. Still the changes go some way to explaining why Ken Livingstone was unable to sustain the traditional City Hall machine he built consolidating constituencies among inner London’s poor immigrant and residual working class   communities while Tory Boris Johnson won  over the more working and middle class outer suburbs.

    In his last term Livingstone concentrated on winning over London’s bloated financial service sector more than he did on popular support – but the City of London switched its allegiances to the Tory Johnson, who champions it as an engine of growth. Neither candidate has understood that the skew towards the overheated financial service sector creates a weakness in the London economy, with manufacturing having moved out to the surrounding South East and a growing lack of upwardly mobile jobs for all but the most skilled or privileged.

    The housing benefit cap clearly is a problem for welfare-dependent families who are caught in the poverty trap and cannot earn enough to pay the rent. But the problem of the less well-off being priced out of London began long before the changes in housing benefit rules, or London’s winning the Olympic bid. The city the world will visit this summer increasingly resembles not the social democracy imagined after the Second World War, but increasingly a social bifurcated place increasingly resembling that of Victorian times.

    James Heartfield is the author of Let’s Build: Why we need five million new homes, a director of Audacity.org, and a member of the 250 New Towns Club.

    ————————————–

    A Mile High Tower for London

    One imaginative solution to London’s housing problem was proposed by Ian Abley and Jonathan Schwinge of the 250 New Towns Club. Abley and his colleagues have been pressing for new building in Britain’s green spaces to meet housing need.

    Taking on the challenge of building up as well as out, Ian unveiled a plan for a tower one mile high for London at the Building Centre, which could house 90,000 people.


    ‘Locked out of the Property Market’, Observer,  6 May 2012

    27 March 2012, http://www.guardian.co.uk/commentisfree/2012/mar/27/planning-builders-charter-lawyers-delight-editorial, and see ‘Coalition of the Unwilling’, New Geography, 1 July 2011, http://www.newgeography.com/content/001966-coalition-unwilling

    Inward and Upward: Marking Out Social Class Change in London, 1981–2001, Urban Studies 45(1) 67–88, January 2008, 72

    London photo by Bigstockphoto.com.

  • Homebuilding Recovery: A Zoning & Planning Overhaul

    Part III of the Recovery Blueprint for homebuilding. Defining good zoning and good planning, and a look at how social engineering plays in.

    What exactly is ‘planning’?

    It can be government creation of an Interstate Highway, or a city council vote on a new park. For the purposes of this blueprint, planning refers to the design of a new land development or a design for redevelopment. In both cases, the land plan is the developer’s business plan. The design will either be positive or negative for the sustainability — long-term health — of the city.

    Typically, the ‘planner’ will be an engineer or surveyor if the development is suburban, or an architect or ‘urban planner’ designing an urban redevelopment. In any case, the planner will follow regulations that set ‘minimums,’ such as a minimum on lot size, side yards, front and rear setbacks, and so forth. There are a few major problems with this ‘minimums’ based system.

    In order to maximize profits for the client (the builder or developer), the planner is encouraged to squeeze as many units as possible within the available land. The design of the development becomes a mathematical exercise, more than an attempt to create an attractive and functional neighborhood design.

    The result becomes a monotonous, cookie-cutter solution. It maximizes not just density, but also construction costs, with a high volume of streets, utility mains, and sidewalks.

    Technology made the situation worse, with software not only limiting creativity, but also influencing the planning to correspond with the predetermined, robotic functions of the widely used software.

    A minimums-based design is quite rigid. In the long run, if a design is driven only by density, the development can be far less profitable for the developer, despite the original intention to economize. Builders who buy lots from the developer also end up paying more than they would have with a different approach. When topography and the overall property configuration are more complex, and as restrictions on wetlands and tree ordinances increase, it gets worse. Rigid designing is like trying to fit a square peg in an odd shaped hole, increasing waste.

    Development after development becomes a clone, because of the way regulations are written and interpreted. This monotony can then only be broken up with a much greater attention to architecture and landscaping. The ‘geometry’ of each development remains similar.

    This is where the confusion between good planning and good architecture comes in. An example is New Urbanism, with architecture as its key component. A coherent architectural theme, full front porch, and street trees are typical of these developments. Compare that to the vinyl sided, bland subdivision where the three-car garage is the dominant feature. New Urbanism typically wins the curb appeal beauty contest. (Of course, in upscale suburban communities where every home showcases great architecture and landscaping, that is not necessarily the case.)

    Underlying New Urbanism is the implication that certain design elements will change behavior and solve social problems. Neighbors will want to interact regardless of income, race, religion, and so on. Many think this ‘Stepford Wife’ approach places design as a tool to implement mind control. Is it?

    Those who reside in New Urban communities desire the more attractive setting. The architectural and landscaping control creates a welcoming and cohesive community appearance, compared to the garage snout vinyl cladded subdivision. These developments are typically more expensive per home square foot, thus your neighbor is likely to be somewhat successful, just like you. This is no more social engineering than is providing any market for successful people who value appearance and like to live among others with similar values.

    Within a city, other planning solutions can result in social change. Replacing a blighted, high crime neighborhood with a gentrified urban mecca for wealthy residents that enjoy the nightlife is one sure formula to do so. But is it a change in the right direction for a city?

    What happens to those low-income families that are displaced? How are their lives improved? Theoretically, they could move to a safer, less blighted area, like many who were displaced by Katrina. Instead of displacing poor families, there are viable solutions based on rebuilding blighted areas and maintaining affordability. Not the typical ‘smart growth’ solutions, though; those often add significantly to redevelopment costs. Compressing these families into dense, high-rise structures does nothing to foster pride, thus, high-density low-income housing could be considered unsocial engineering.

    Zoning gets attacked, but the truth is that it tends to preserve property values better than intermixed usage does. New Urbanism offers the promise that the rich and poor can all live on the same block. That would be marketing suicide for the developer and builder. Suburban zoning can also be a terrible model. It places the strip mall or multi-family homes along arterial roads, then transitions to the large single family lots and homes as one drives deeper into the subdivision or the ‘master planned’ community (i.e., ‘larger’ subdivision). Showcasing the cheapest housing, and placing the most families in the worst places is land use madness. To highlight inexpensive homes and strip malls cheapens the development and the city as a whole.

    A blueprint for recovery without class barriers, one that benefits all income levels, can easily be accomplished today. To start, the suburban zoning pattern is in serious need for an overhaul. Reversing the pattern would increase property values and profitability, and values would be more stable over time.

    A less rigid geometric pattern would reduce monotony, while allowing the development design to adhere to the natural terrain. An adherence to the natural terrain allows surface flow, which reduces the expense and negative impact of traditional storm sewer systems.

    How can all of the above be expedited? Cities can be proactive by writing regulations that reward better solutions. That particularly includes a modification of their existing minimums-based regulations.

    Flickr photo by infomatique (William Murphy): “Discussion: ‘Can Zoning Be Bad For You?’ All land in Dublin City is zoned for one particular use or another, some more restrictive than others…”

    Rick Harrison is President of Rick Harrison Site Design Studio and Neighborhood Innovations, LLC. He is author of Prefurbia: Reinventing The Suburbs From Disdainable To Sustainable and creator of Performance Planning System. His websites are rhsdplanning.com and pps-vr.com.

  • The Export Business in California (People and Jobs)

    California Senate President Pro-Tem Darrell Steinberg countered my Wall Street Journal commentary California Declares War on Suburbia in a letter to the editor (A Bold Plan for Sustainable California Communities) that could be interpreted as suggesting that all is well in the Golden State. The letter suggests that business are not being driven away to other states and that the state is "good at producing high-wage jobs," while pointing to the state’s 10 percent growth over the last decade. Senate President Steinberg further notes that the urban planning law he authored (Senate Bill 375) is leading greater housing choices and greater access to transit.

    This may be a description of the California past, but not present.

    Exporting People

    Yes, California continues to grow. California is growing only because there are more births than deaths and the state had a net large influx of international immigration over the past decade. At the same time, the state has been hemorrhaging residents (Figure 1).

    Californians are leaving. Between 2000 and 2009 (Note), a net 1.5 million Californians left for other states. Only New York lost more of its residents (1.6 million). California’s loss was greater than the population of its second largest municipality, San Diego. More Californians moved away than lived in 12 states at the beginning of the decade. Among the net 6.3 million interstate domestic migrants in the nation, nearly one-quarter fled California for somewhere else.

    The bulk of the exodus was from the premier coastal metropolitan areas. Since World War II, Los Angeles, San Francisco, San Diego and San Jose have been among the fastest growing metropolitan areas in the United States and the high-income world. Over the last decade, this growth has slowed substantially, as residents have moved to places that, all things being considered, have become their preferences.

    More than a net 1.35 million residents left the Los Angeles metropolitan area, or approximately 11 percent of the 2000 population. The San Jose metropolitan area lost 240,000 residents, nearly 14 percent of its 2000 population. These two metropolitan areas ranked among the bottom two of the 51largest metropolitan areas (over 1,000,000 population) in the percentage of lost domestic migrants during the period. The San Francisco metropolitan area lost 340,000 residents, more than 8 percent of its 2000 population and ranked 47th worst in domestic migration (New York placed worse than San Francisco but better than Los Angeles). Each of these three metropolitan areas lost domestic migrants at a rate faster than that of Rust Belt basket cases Detroit, Cleveland and Buffalo.

    San Diego lost the fewest of the large coastal metropolitan areas (125,000). Even this was double the rate of Rust Belt Pittsburgh.

    Exporting Jobs

    California is no longer an incubator of high-wage jobs. The state lost 370,000 jobs paying 25 percent or more of the average wage between 2000 and 2008. This compares to a 770,000 increase in the previous 8 years. California is trailing Texas badly and the nation overall in creating criticial STEM jobs and middle skills jobs (Figures 2 & 3) Only two states have higher unemployment rates than California (Nevada and Rhode Island) . California has the second highest underemployment rate (20.8 percent), which includes the number of unemployed, plus those who have given up looking for work ("discouraged" workers) and those who are working only part time because they cannot find full time work. Only Nevada, with its economy that is overly-dependent on California, has a higher underemployment rate.


    Business relocation coach Joseph Vranich conducts an annual census of companies moving jobs out of California and found a quickening pace in 2012. Often these are the very kinds of companies capable of creating the high-wage jobs that used to be California’s forte. Vranich says that the actual number may be five times as high, which is not surprising, not least because there is no reliable compilation of off-shoring of jobs to places like Bangalore, Manila or Cordoba (Argentina).

    To make matters worse, California is becoming less educated. California’s share of younger people with college degrees is now about in the middle of the states, while older, now retiring Californians are among the most educated in the nation (Figure 4).

    Denying Housing Choice

    It is fantasy to believe, as Steinberg claims, that there are enough single family (detached) houses in the state to meet the demand for years to come. More than 80 percent of the new households in the state chose detached housing over the last decade. People’s actual choices define the market, not the theories or preferences of planners often contemptuous of the dominant suburban lifestyle.

    In contrast, however, the regional plans adopted or under consideration in the Bay Area, Los Angeles and San Diego would require nearly all new housing be multi-family, at five to 10 times normal California densities (20 or more units to the acre are being called for). New detached housing on the urban fringe would be virtually outlawed by these plans. And, when Sacramento does not find the regional plans dense enough, state officials (such as the last two state Attorneys General) are quick to sue. If the "enough detached housing" fantasy held any water, state officials and planners would not be seeking its legal prohibition. To call outlawing the revealed choice of the 80 percent (detached housing) would justify the equivalent of a Nobel Prize in Doublespeak.

    At the same time by limiting the amount of land on which the state preferred high density housing must be built, land and house prices can be expected to rise even further from their already elevated levels (already largely the result of California’s pre-SB 375 regulatory restrictions).

    Transit Rhetoric and Reality

    Transit is important in some markets. About one-half of commuters to downtown San Francisco use transit. The assumptions of SB 375 might make sense if all of California looked like downtown San Francisco. It doesn’t, nor does even most of the San Francisco metropolitan area. Only about 15 percent of employment is downtown, while the 85 percent (and nearly all jobs in the rest of the state) simply cannot be reached by transit in a time that competes with the car. Even in the wealthy San Jose area (Silicon Valley), with its light rail lines and commuter rail line, having a transit stop nearby provides 45 minute transit access to less than 10 percent of jobs in the metropolitan area.

    A recent Brookings Institution report showed that the average commuter in the four large coastal metropolitan areas can reach only 6.5 percent of the jobs in a 45 minute transit commute. This is despite the fact that more than 90 percent of residents can walk to transit stops. Even when transit is close, you can’t get there from here in most cases in any practical sense (Figure 5).

    SB 375 did little to change this. For example, San Diego plans to spend more than 50 percent of its transportation money on transit over the next 40 years. This is 25 times transit’s share of travel (which is less than 2 percent). Yet, planners forecast that all of this spending will still leave 7 out of 8 work and higher education trips inaccessible by transit in 30 minutes in 2050. Already 60 to 80 percent of work trips in California are completed by car in 45 minutes and the average travel time is about 25 minutes.

    For years, planners have embraced the ideal of balancing jobs and housing, so that people would live near where they work, while minimizing travel distances. This philosophy strongly drives the new SB 375 regional plans. What these plans miss is that people choose where to work from the great array of opportunities available throughout the metropolitan area. These varied employment opportunities that are the very reason that large metropolitan areas exist, according to former World Bank principal planner Alain Bertaud.

    People change jobs far more frequently than before and multiple earners in households are likely to work far apart. Similar intentions led to the development up to four decades ago of centers like Tensta in Stockholm, which ended up as concentrated low income areas (Photo). It California, such a concentration would do little to improve transit ridership, even low-income citizens are four to 10 times as likely use cars to get to work than to use transit.


    Tensta Transit Oriented Development: Stockholm

    All of this means more traffic congestion and more intense local air pollution, because higher population densities are associated with greater traffic congestion. Residents of the new denser housing would face negative health effects because there is more intense air pollution, especially along congested traffic corridors.

    Self-Inflicted Wounds

    Worst of all, California’s radical housing and transportation strategies are unnecessary. The unbalanced and one-dimensional pursuit of an idealized sustainability damages both quality of life and the economy. This is exacerbated by other issues, especially the state’s dysfunctional economic and tax policies. It is no wonder California is exporting so many people and jobs. California’s urban planning regime under SB 375 is poised to make it worse.

    Wendell Cox is a Visiting Professor, Conservatoire National des Arts et Metiers, Paris and the author of “War on the Dream: How Anti-Sprawl Policy Threatens the Quality of Life”.

    Net Domestic Migration: 2000-2009
    Rank Metropolitan Area Net Domestic Migration Compared to 2000 Population
    1 Raleigh, NC         194,361 24.2%
    2 Las Vegas, NV         311,463 22.4%
    3 Charlotte, NC-SC         248,379 18.5%
    4 Austin, TX         234,239 18.5%
    5 Phoenix, AZ         543,409 16.6%
    6 Riverside-San Bernardino, CA         469,093 14.3%
    7 Orlando, FL         225,259 13.6%
    8 Jacksonville, FL         126,766 11.3%
    9 Tampa-St. Petersburg, FL         260,333 10.8%
    10 San Antonio, TX         177,447 10.3%
    11 Atlanta, GA         428,620 10.0%
    12 Nashville, TN         123,199 9.4%
    13 Sacramento, CA         141,117 7.8%
    14 Richmond, VA           75,886 6.9%
    15 Portland, OR-WA         121,957 6.3%
    16 Dallas-Fort Worth, TX         317,062 6.1%
    17 Houston, TX         243,567 5.1%
    18 Indianapolis. IN           72,517 4.7%
    19 Oklahoma City, OK           41,082 3.7%
    20 Denver, CO           66,269 3.0%
    21 Louisville, KY-IN           34,381 3.0%
    22 Birmingham, AL           26,934 2.6%
    23 Columbus, OH           34,204 2.1%
    24 Kansas City, MO-KS           31,747 1.7%
    25 Seattle, WA           40,741 1.3%
    26 Minneapolis-St. Paul, MN-WI          (19,731) -0.7%
    27 Memphis, TN-MS-AR            (8,583) -0.7%
    28 Hartford, CT            (9,349) -0.8%
    29 Cincinnati, OH-KY-IN          (17,648) -0.9%
    30 Virginia Beach-Norfolk, VA-NC          (20,005) -1.3%
    31 Baltimore, MD          (36,407) -1.4%
    32 St. Louis, MO-IL          (43,750) -1.6%
    33 Philadelphia, PA-NJ-DE-MD        (115,890) -2.0%
    34 Pittsburgh, PA          (52,028) -2.1%
    35 Washington, DC-VA-MD-WV        (107,305) -2.2%
    36 Providence, RI-MA          (49,168) -3.1%
    37 Salt Lake City, UT          (34,428) -3.5%
    38 Rochester, NY          (40,219) -3.9%
    39 San Diego, CA        (126,860) -4.5%
    40 Buffalo, NY          (55,162) -4.7%
    41 Milwaukee,WI          (74,453) -5.0%
    42 Boston, MA-NH        (235,915) -5.4%
    43 Miami, FL        (287,135) -5.7%
    44 Chicago, IL-IN-WI        (561,670) -6.2%
    45 Cleveland, OH        (136,943) -6.4%
    46 Detroit,  MI        (366,790) -8.2%
    47 San Francisco-Oakland, CA        (347,375) -8.4%
    48 New York, NY-NJ-PA     (1,962,055) -10.7%
    49 Los Angeles, CA     (1,365,120) -11.0%
    50 San Jose, CA        (240,012) -13.8%
    51 New Orleans, LA        (301,731) -22.9%
    Data from US Census Bureau


    —–

    Note:  2000 to 2010 data not available

    Lead photo: Largely illegal to build housing under California Senate Bill 375 planning

  • Homebuilding Recovery: How CAD Stifles Solutions

    The Recovery Blueprint is a multipart series on homebuilding. Part II addresses how a reliance on CAD software and a lack of collaboration stifle sustainable land development solutions.

    The front cover of Engineering News-Record on March 12th, 2012 was about a technology survey conducted a few weeks earlier. Of 18 issues surveyed, the need for better software was mentioned most frequently. Under the heading “Software Shortfall – Better, Simpler, Cheaper”, the editors noted that ‘dissatisfaction with current products cuts across all responses,’ and labeled the area, ‘Needs Improvement’.

    Better Software: Until a few decades ago the development of the world was represented by a hand drawn plan. Computer Aided Drafting (CAD) did not exist. There was an intimacy between the design of buildings and the land development task at hand. Since the introduction of CAD, the typical American city has seen few technology changes in the ways that housing is designed. There is virtually no advancement in the design of land development that can be associated with this new era of software-enabled design. If anything, it could be argued that CAD technology resulted in worse design of the cities in which we dwell.

    During a recent lunch with a prominent architect, he explained to me how easy it is to do multifamily design. Simply create one interior unit and one end unit, and then repeat with minor modifications for the first floor units. There was no mention on how to increase the views, or of perceived space (versus actual space), or of efficiencies that could help make everyday living better for the residents. Only that CAD made things so much faster and ‘easier’ for the architect.

    Several software solutions companies boast in their literature about how the development of hundreds of lots can be generated in a minute. The attitude that technology is a tool for speed, instead of for quality, feeds complacency and dumbs down design to series of ‘typicals’ or ‘blocks’ that can be instantly duplicated.

    CAD was intended as a drafting tool to serve hundreds of purposes within a multi-billion dollar software industry. To serve all industrial usages, CAD has become a ‘jack of all trades but master of none’. This is most apparent in land-based design, which requires calculations based upon coordinate geometry. CAD requires a separate data structure to perform these calculations. As an industry core technology, CAD compromises and limits land development design. To do land based calculations for environmental and economic reporting requires precision spatial analysis, and CAD technology fails to deliver. If CAD were a spatial platform there would be no need for a separate GIS technology (another industry problem) for analytical data.

    CAD Saturation: The hand drafting tools used just a few decades ago simply do not exist today. In a saturated market, CAD companies must generate fees through updates, support and training. If these systems were easy (see above complaints) and quick to learn the support and training income would plummet. Thus, intentional complexity assures CAD an income stream for companies at the expense of limiting progress and stifling design advancements.

    Pre-packaged software results in pre-packaged solutions. For example, imagine that an engineer schooled in the use of a particular software is given the task of designing a storm sewer on a 100-acre subdivision. To design and create the required drawings and reports for the multi-million dollar storm sewer system using add-on software to CAD, it might take only a day or so. A more natural alternative using surface flow is likely a viable option, potentially reducing infrastructure expense by tens of thousands, and in some cases millions, of dollars. However, there is no ‘button press’ for surface flow. If consulting fees are based upon a percentage of construction costs the situation becomes worse.

    Many Architects intelligently use technology that is not possible through CAD. Some of these more intelligent software solutions have even been acquired by leading CAD companies. GIS (Geographic Information System) technology is generally based upon polygons, that is, a series of straight lines forming a shape. Typically, it’s useless for precision engineering and surveying irregular, real-world sites.

    Technology Inhibited Collaboration: Architects, engineers, surveyors and planners — the group of consultants that are given responsibility to design and produce plans for our world’s growth — have been, historically, un-collaborative. Technology has done little to change this and foster collaboration.

    Only a few decades ago, it was a given that hand drawn sketches would need to be calculated for construction. Today, a planner using CAD could ‘sketch’ thousands of inaccurate lines and arcs that look like a finished plan, but would be useless for engineering and surveying. Data transferred to the CAD system of an engineer or surveyor does not magically become accurate, and therefore usable. The way CAD has been utilized destroys collaboration instead of building it.

    This isn’t the fault of CAD technology, which actually can create precise drawings. The blame falls on those that teach its use. One way to build collaboration would be for schools in engineering, architecture, planning, and surveying to work on common projects, teaching the needs of each other in a way that reduces time and workload, allowing more time for better decision making.
    Unsustainable Sustainability: It’s human nature to find comfort at a certain stage of equilibrium. What does this mean? We relent to the flow of everyday life. In the case of land development issues, methods and technology that go with the flow lead to an unsustainable path.

    Those involved in the development industry, whether working for private or for public entities, know our growth is not sustainable. Instead of seeking better methods, we have reduced planning to either mindlessly automating design, or to creating stricter design models that promise progress by providing a better architectural façade.

    Instead of being more efficient and reducing the physical elements required for development, we have added solutions that often increase installation and maintenance costs. An example is permeable paving, which is a wonderful idea: pavement that allows rainwater to pass into the ground, instead of running off the pavement’s end and flooding the surrounding area. The problem is not the pavement, but the fact that the under layer supporting the paving must also be permeable. To do this is often prohibitively expensive. If it’s not done properly, it traps water that can freeze (in colder climates) and then expand, and may not hold up to the weight of heavy loads.

    Despite the promise of permeable pavement, design innovations that can reduce the volume of street surface by 30% or more without reducing functionality make more sense. Eliminating an excessive amount of street surface is an efficient solution that costs less to install and maintain than permeable pavement.

    Funding Sources For Innovation: Would it be possible for someone to discover a way to create an affordable base for permeable pavement? Probably. There are hundreds of millions of dollars available from private foundations and government grants for solutions leading to sustainable growth. However, foundation grants fund only 501c non-profits. Should future solutions to development be tied only to non-profit or politically connected entities, or to private firms which may be more capable of innovation?

    There is no technology that can create a better design; we can only create better designers. Instead of educating CAD users on how to automate design, we need to create a generation of designers who use technology to create wonderful neighborhoods instead of quick subdivision plans.

    The consultant needs to concentrate on the best solution, not just the solution that is a mere button press away. Today, there is no excuse for creating designs that are not precise. Architects, engineers, planners, and surveyors need to learn to fulfill each other’s basic needs. This would go a long way towards creating a new era of collaborative design.

    Rick Harrison is President of Rick Harrison Site Design Studio and Neighborhood Innovations, LLC. He is author of Prefurbia: Reinventing The Suburbs From Disdainable To Sustainable and creator of Performance Planning System. His websites are rhsdplanning.com and pps-vr.com.

    Flickr Photo: Designing tools by evrenozbilen.

  • Staying the Same: Urbanization in America

    The recent release of the 2010 US census data on urban areas (Note 1) shows that Americans continue to prefer their lower density lifestyles, with both suburbs and exurbs (Note 2) growing more rapidly than the historic core municipalities.  This may appear to be at odds with the recent Census Bureau 2011 metropolitan area population estimates, which were widely mischaracterized as indicating exurban (and suburban) losses and historical core municipality gains. In fact, core counties lost domestic migrants, while suburban and exurban counties gained domestic migrants. The better performance of the core counties was caused by higher rates of international migration, more births in relation to deaths and an economic malaise that has people staying in (counties are the lowest level at which migration data is reported). Nonetheless, the improving environment of core cities in recent decades has been heartening.

    The urban area data permits analysis of metropolitan area population growth by sector at nearly the smallest census geography (census blocks, which are smaller than census tracts). Overall, the new data indicates that an average urban population density stands at 2,343 per square mile (904 per square kilometer). This is little different from urban density in 1980 and nearly 10 percent above the lowest urban density of 2,141 per square mile (827) recorded in the 1990 census. Thus, in recent decades, formerly falling US urban densities have stabilized .

    Urban density in 2010, however, remains approximately 27 percent below that of 1950, as many core municipalities lost population while suburban and suburban populations expanded. This resulted in the substantial expansion of urban land area reflecting the preference for low-density lifestyles among Americans and most people in other high-income areas of the world.   Between the 1960s and 2000, nearly all of the growth in the major metropolitan regions of Western Europe and Canada has taken place in suburban areas, as these nations’ urban areas have dispersed in a manner similar to that of the United States. The trend continued through 2011 in Canada and domestic migration data in Western Europe shows a continuing movement of people from the historical cores to the suburbs and exurbs.

    This dispersion, pejoratively called "urban sprawl" has been routinely linked with everything from obesity and global warming to "bowling alone." In fact, while population densities have fallen, households densities have remained steady, barely droppping at all. Average household size has fallen dramatically, as fewer children have been born and divorce rates have soared. New households have been formed at more than 1.5 times the rate of population growth. The result is that a 27 percent decline in urban density since 1950 translated into a much more modest 4 percent decline in household density. A more genuine target for anti-suburban crusaders would be household sprawl rather than urban sprawl (Figure 1).

    Smaller Urban Areas Growing Faster

    Even as urban densities have reached a floor, Americans still continue to move to areas of lower density and smaller populations. For example, the urban areas of more than 1 million population in 1990 attracted 48 percent of the nation’s urban growth between 1990 and 2000. Between 2000 and 2010, these areas attracted a smaller 38 percent of urban growth (Figure 2).

    The Exurbs: A Two-Way Exodus

    For much of the last decade (and even before), the media has been heralding an epochal “return” to core cities. This idea is fundamentally misleading since most suburbanites actually came not from core cities but smaller towns and rural areas. The census results have made it clear that the urban focus of population growth was largely anecdotal, although  small inner city areas of some core cities (such as small sections of  St. Louis, Chicago, Dallas, Seattle, San Diego and Portland)  have experienced uncharacteristic growth. But overall, most growth continued to be in the suburbs and exurbs.  Measured at the census block level, exurbs are constantly at risk of being converted into suburbs as they become a part of the continuously developed area. Even so, as of 2010, exurban areas accounted for 16.1 percent of the population in the 51 major metropolitan areas. The historical core municipalities accounted for 26.3 percent of the population, while suburban areas housed 57.6 percent of the population (Figure 3).

    It should be considered, however, that in many urban areas — such as Houston, Los Angeles, Phoenix, Portland, Seattle and Orlando — many historic city neighborhoods were developed as and remain suburban in their form, being dominated detached homes and automobiles. It is unlikely that exurban areas (measured at the census block level) will exceed the historical core cities in population, since they are at constant risk of being merged with suburbs (as the urban area expands).

    Smaller Urban Areas: Where the Sprawl Is

    The principal urban areas of the major metropolitan areas are nearly twice as dense as the rest of America’s urban areas. These urban areas have 53 percent of the urban population, but occupy only 39 percent of the urban land area. By contrast, the smaller urban areas have 47 percent of the urban population, while occupying 61 percent of the urban land area (Figure 4). It seems odd  that the fury of urban planners is directed at the larger, more dense urban areas rather than the smaller, much less dense urban areas, that sprawl to a far greater degree (Figure 5).

    Most and Least Dense Major Urban Areas

    Among the major metropolitan areas, the most dense urban area is Los Angeles, at a density of 6,999 per square mile (2,702 per square kilometer). This is a 32 percent denser than fourth ranked New York whose  hyper-dense core is offset by its low density suburbs. In fact, San Jose, which is virtually all suburban in its urban form and was a small urban area in 1950 (link to 1950-2010 data), ranks third and also is more dense than the New York urban area. Second ranked San Francisco is also more dense than New York (Figure 6). New Orleans ranked 10th most dense, however experienced a reduction in density of more approximately 30 percent due to the devastation of Hurricanes Katrina

    It may be surprising that Portland, with by far the most radical densification policies in the nation, does not even rank among the 10 most dense urban areas. Portland ranked 13th, behind urban areas like Las Vegas, Salt Lake City, San Diego, Sacramento, Denver and exclusively suburban Riverside-San Bernardino (and even the much smaller urban areas of Fresno, Bakersfield, Turlock and Los Banos in California’s San Joaquin Valley). However Portland did densify, reaching one-half the density of Los Angeles.  Portland will catch Los Angeles in density by 2120 at the current rate.   

    The least dense urban area is Birmingham, with a population density of 1,414 per square mile (546 per square kilometer). Atlanta, the least dense urban area of more than 3 million population in the world right is the third least dense at 1,707 per square mile (659 per square kilometer). The second least dense urban area, Charlotte, had a density of 1,685 per square mile (651 per square kilometer), while increasing its land area over the decade at twice the rate of Atlanta (Figure 7).

    Staying the Same

    Urbanization in the United States over the last decade can be characterized by the old French proverb that "the more things change the more they stay the same."

    As in Europe and elsewhere (see the Evolving Urban Form series), when they move, Americans go to less dense areas such as to suburban and exurban areas within the larger metropolitan areas as well as smaller, lower density urban regions. The extent to which they move, however, will depend more upon economic improvement than the lure of core areas that, in reality, continue to lose younger people in their thirties while continuing not attracting their boomer parents as they get older.

    Wendell Cox is a Visiting Professor, Conservatoire National des Arts et Metiers, Paris and the author of “War on the Dream: How Anti-Sprawl Policy Threatens the Quality of Life

    —-

    Note 1: Urban Areas and Metropolitan Areas: An urban area is the area of continuous development and as Sir Peter Hall put it, is thus the "physical" urban form. The urban area is a similar, but fundamentally different concept than a metropolitan area and analysts routinely confuse the terms. The United States Census Bureau calls urban areas over 50,000 population "urbanized areas." The metropolitan area is larger, and includes one or more urban areas as well as economically connected rural areas. . The metropolitan area is the "functional" urban form. There is no rural territory within urban areas, but there can be substantial rural territory in a metropolitan area (For example, the US defines metropolitan areas by counties. This can lead to artificially large metropolitan areas. For example, the Riverside San Bernardino metropolitan area, in the West where counties tend to be larger, covers 27,300 square miles (a land area larger than Ireland). The Cleveland metropolitan area, with a principal urban area similar in population to Riverside-San Bernardino, covers only 2,000 square miles, because it is located in Ohio, where counties are smaller. At the same, the far lower population density of the Riverside-San Bernardino metropolitan area is despite the fact that the urban area is approximately 50 percent more dense than the Cleveland urban area

    Note 2: Historical Core Municipalities, Suburbs and Exurbs: For the purposes of this article, an area outside a historical core municipality is considered a suburb if it is in the urban area and an exurb if it is in the corresponding metropolitan area, but outside the principal urban area. Urban areas are delineated at a small census geographical area (the census block), which makes more precise analysis possible than is available at the county level, the lowest level at which domestic migration data is available.

    Note 3: Principal Urban Areas: The principal urban area is the urban area within a metropolitan area that has the largest population. For example, in the Riverside-San Bernardino metropolitan area, the Riverside-San Bernardino urban area is the principal urban area. Other urban areas, such as Murrietta, Hemet and Indio (Palm Springs) would be secondary urban areas.

    —-

    Photograph: Exurban St. Louis (photo by author)

  • Homebuilding: Recovery & Red Tape

    The Recovery Blueprint is a multipart series of articles that offers suggestions on how to recover from the homebuilding recession.

    Since the recession began, there haven’t been any significant changes in how regulations could be improved to energize the housing market and foster innovation. Three areas where big regulation changes are needed? Environmental subsidies, density requirements, and zoning laws.

    Environmental Incentives: Repeating the mistakes of the Carter era, federal and state governments have thrown vast sums of tax money at ‘green’ solutions likely to fail. A massive amount of our nation’s total energy use seeps out of inefficient housing, draining families of income at a time when they can least afford it. The subsidization of inefficient construction that incorporates energy saving alternatives is as flawed today as it was 25 years ago. Federal and state credits allow funding for improvements such as insulation, solar panels, wind generation, geothermal systems, and the like. These tax credits have to be balanced against taxes paid by families who are barely surviving this recession, if they are still in their homes making mortgage payments.

    Who benefits? Not the mortgage companies that repossess energy inefficient homes. Not the families in traditional homes burdened with high energy costs. Only those wealthy enough to need tax breaks can benefit. But a household at the income level where it makes financial sense to upgrade an existing home can easily afford the upgrade without burdening the already overtaxed public.

    In a low income, possibly downtrodden neighborhood, upgrading a home for energy efficiency results in an expense (even after tax breaks) not likely to be recovered at the sale of the home. It would make more sense to use the same amount of funds to replace older, inefficient homes with new construction. New construction essentially replaces homes with the least efficient HVAC (heating/ventilation/ air conditioning) and insulation with new ones that operate the most efficient systems. But new construction gets almost no tax benefits; only geothermal or solar systems on new construction are subsidized. Does that make sense?

    Density Targets: Making funds available to cities on the condition that certain higher densities are met is not a solution, either. What I hear most often is that we need to provide high-density housing and public transportation so that poor people can get to their jobs, assuming, of course, that all people of low income work downtown.

    Are multi-billion dollar light rail projects and heavily subsidized low-income high-rise towers justified by such rhetoric? A low-income family on the 6th floor of a high-density building will not have the same quality of living or the pride-of-place that a home with a yard would provide. Travel dependent on a train or bus schedule does not offer the independence of owning a vehicle and travelling on one’s own schedule. Travel by foot or bike makes perfect sense for some of those who live in San Diego, but in the rest of the world those alternatives are viable only for the few nice weather days.

    When the recession began, urban architects and planners celebrated the death of the suburbs and the coming advent of an urban rebirth. While the suburbs were certainly hard hit, urban areas did not receive the expected mass migration.

    There is a myth that sprawl was the result of large lots and low density in the suburbs. Over the past 20 years, the firm I founded has planned over 730 developments in 46 States and 15 countries. I would estimate the average density of our suburban developments at between four and five units per useable acre. Today’s suburban development must preserve wetlands, steep slopes, wooded areas, and most often contain a minimum percentage of the site in open space. None of those requirements were in place when our core cities were built. One simply gridded streets through swamps (the previous term for wetlands) and bulldozed slopes and woodlands. Had our existing core cities been built under today’s regulations, they would likely sprawl 30% or more beyond the areas they currently occupy.

    Density targets that must be hit in order to receive government financial assistance not only doesn’t increase the quality of lower income life, it doesn’t result in more sustainable and affordable cities. Instead, most funding has resulted in displacing low-income neighborhoods with gentrified, wealthy development. Many of these projects were initial financial failures. The next developer — the one who picked up the project at bargain prices — realized the profit. Successful, affordable urban redevelopment remains elusive.

    Ordinances & Codes: The designer of any development, suburban or urban, will squeeze every inch out of the site to stay within the most minimal dimensions allowed by local ordinances. This effort to maximize the client’s profits can only result in monotonous, cookie-cutter development.

    Many city planning boards have been manipulated into believing the illusion that a ‘forms based’ or ‘smart-code’ approach is a solution. These new regulations simply increase the number of minimum standards, and restrict innovative solutions. What a ‘forms based’ or ‘smart’ code does accomplish is to significantly increase the consulting income of the firm that promotes this alternative.

    Many engineers and architects base their fees on a percentage of the final construction costs. A consultant who charges on a percentage of infrastructure costs has an incentive to introduce excessive sewer pipes, retaining walls, or other non-needed construction. A fee structure based upon increased profit derived on the least efficient design is a huge roadblock to developing sustainable cities.

    Innovations in land development and in methods of design now allow a reduction of both environmental and economic impact from 15% to over 50%, compared to conventional or New Urban planning methods. While these new methods take more time and effort to design, the reward is more attractive, affordable, and functional neighborhoods.

    What’s the blueprint for better planning? For starters, two ideas: government aid should be based on a ‘plan’ showing how the resulting development will enhance the living standards, and not be tied only to density levels. And agencies should reward contracts to the consultant with the best solution. This means creating a financial mechanism to increase – not decrease — profitability for sustainable planning and engineering solutions that require the least amount of construction costs.

    Photo by Stripey Anne: “I am an NHS Bureaucrat…These, dear friends, are the tools of my trade: red tape, pen, ink…”

    Rick Harrison is President of Rick Harrison Site Design Studio and Neighborhood Innovations, LLC. He is author of Prefurbia: Reinventing The Suburbs From Disdainable To Sustainable and creator of Performance Planning System. His websites are rhsdplanning.com and pps-vr.com.

  • Census Estimates: Slowing Metropolitan Growth and the Future of the Exurbs

    Recently the Census Bureau released 2011 county and metro area population estimates that showed overall slowing population growth and particularly showing slow to halting growth in exurban counties.

    Someone once said to me about Chicago’s Mayor Daley that if he did something you liked, he was a visionary genius leader, but if he did something you hated, he was a corrupt machine dictator.

    That seems to be how too many urbanists view the Census Bureau.

    I’ll come back to the exurbs in a minute, but first a look at a map of metro area growth last year:


    Metro area percent change in population, July 1, 2010 to July 1, 2011. Source: Census Estimates via Telestrian

    Here’s the county map:


    County percent change in population, July 1, 2010 to July 1, 2011. Source: Census Estimates via Telestrian

    Someone once said to me about Chicago’s Mayor Daley that if he did something you liked, he was a visionary genius leader, but if he did something you hated, he was a corrupt machine dictator.

    That seems to be how too many urbanists view the Census Bureau.

    Back in the 90s when the Census estimates showed cities growing more slowly than boosters believed, they pressured the Census Bureau into adjusting the estimates to provide higher values. As it turned out, in most cases even the original estimates for cities proved inflated. In fact, the 90s were actually better for a lot of major cities than the 2000s were (e.g, New York, Los Angeles, and Chicago). This led to a new narrative that the Census had undercounted cities somehow.

    Now this new data shows slowing exurban growth. All of a sudden, the Census Bureau has become once more a source of Gospel Truth, and I’ve seen many articles suggesting that the exurbs are dead, killed by rising gas prices and new Millennial preferences.

    Let’s not get ahead of ourselves here.

    Yes, exurban growth slowed recently. While cities on the whole fared more poorly than expected in the last census, we did see strong growth in downtowns and adjacent areas. I myself wrote about improving migration trends for core cities. That’s good news worth celebrating for cities. But don’t overstate the case.

    I have a different though admittedly speculative take on the exurbs. I think a chunk of the fringe migration was from very low end home builders skipping out beyond established jurisdictions into unincorporated territory with few buildings restrictions. They threw up dirt cheap homes there and often sold them to people with marginal credit and income who had no business buying homes, using a variety of gimmicks to do so. (I know someone who sold homes for one of these builders, so I heard about some of these). Loose credit policies and government guarantees fueled this. The housing crash killed this market. Now that subsidies for this type of growth aren’t available, so that market is probably never coming back.

    But when the economy improves and the market normalizes, I’d expect some level of suburbanization to resume. Part of the logic is simple math. If you add up the population of the municipalities of New York City, Los Angeles, Chicago, Philadelphia, San Francisco, Boston, Seattle, Washington, Portland, and Miami you only get 20 million people. That’s only about 20% of what the Census Bureau is projecting for just population growth by 2050. With the difficulties of building in urban areas, there’s no way to accommodate just the new growth even if everybody wanted into the city. In other words, there’s just no way there is going to be some massive back to the city movement. I hate to break it to you, but that’s reality.

    Here’s the full list of large metros, sorted by population growth percentage:

    Row Metro Area 2010 2011 Total Change Pct Change
    1 Austin-Round Rock-San Marcos, TX
    1,728,247
    1,783,519
    55,272
    3.20%
    2 Raleigh-Cary, NC
    1,137,297
    1,163,515
    26,218
    2.31%
    3 Dallas-Fort Worth-Arlington, TX
    6,400,511
    6,526,548
    126,037
    1.97%
    4 San Antonio-New Braunfels, TX
    2,153,891
    2,194,927
    41,036
    1.91%
    5 Houston-Sugar Land-Baytown, TX
    5,976,470
    6,086,538
    110,068
    1.84%
    6 Charlotte-Gastonia-Rock Hill, NC-SC
    1,763,969
    1,795,472
    31,503
    1.79%
    7 Denver-Aurora-Broomfield, CO
    2,554,569
    2,599,504
    44,935
    1.76%
    8 Washington-Arlington-Alexandria, DC-VA-MD-WV
    5,609,150
    5,703,948
    94,798
    1.69%
    9 Miami-Fort Lauderdale-Pompano Beach, FL
    5,578,080
    5,670,125
    92,045
    1.65%
    10 Oklahoma City, OK
    1,258,111
    1,278,053
    19,942
    1.59%
    11 Salt Lake City, UT
    1,128,269
    1,145,905
    17,636
    1.56%
    12 Seattle-Tacoma-Bellevue, WA
    3,447,886
    3,500,026
    52,140
    1.51%
    13 New Orleans-Metairie-Kenner, LA
    1,173,572
    1,191,089
    17,517
    1.49%
    14 Orlando-Kissimmee-Sanford, FL
    2,139,615
    2,171,360
    31,745
    1.48%
    15 Riverside-San Bernardino-Ontario, CA
    4,245,005
    4,304,997
    59,992
    1.41%
    16 Nashville-Davidson–Murfreesboro–Franklin, TN
    1,594,885
    1,617,142
    22,257
    1.40%
    17 Atlanta-Sandy Springs-Marietta, GA
    5,286,296
    5,359,205
    72,909
    1.38%
    18 Portland-Vancouver-Hillsboro, OR-WA
    2,232,896
    2,262,605
    29,709
    1.33%
    19 Tampa-St. Petersburg-Clearwater, FL
    2,788,151
    2,824,724
    36,573
    1.31%
    20 Phoenix-Mesa-Glendale, AZ
    4,209,070
    4,263,236
    54,166
    1.29%
    21 San Jose-Sunnyvale-Santa Clara, CA
    1,841,787
    1,865,450
    23,663
    1.28%
    22 San Diego-Carlsbad-San Marcos, CA
    3,105,115
    3,140,069
    34,954
    1.13%
    23 San Francisco-Oakland-Fremont, CA
    4,343,381
    4,391,037
    47,656
    1.10%
    24 Indianapolis-Carmel, IN
    1,760,826
    1,778,568
    17,742
    1.01%
    25 Sacramento–Arden-Arcade–Roseville, CA
    2,154,583
    2,176,235
    21,652
    1.00%
    26 Minneapolis-St. Paul-Bloomington, MN-WI
    3,285,913
    3,318,486
    32,573
    0.99%
    27 Columbus, OH
    1,840,584
    1,858,464
    17,880
    0.97%
    28 Jacksonville, FL
    1,348,702
    1,360,251
    11,549
    0.86%
    29 Las Vegas-Paradise, NV
    1,953,927
    1,969,975
    16,048
    0.82%
    30 Los Angeles-Long Beach-Santa Ana, CA
    12,844,371
    12,944,801
    100,430
    0.78%
    31 Richmond, VA
    1,260,396
    1,269,380
    8,984
    0.71%
    32 Louisville/Jefferson County, KY-IN
    1,285,891
    1,294,849
    8,958
    0.70%
    33 Boston-Cambridge-Quincy, MA-NH
    4,559,372
    4,591,112
    31,740
    0.70%
    34 Kansas City, MO-KS
    2,039,766
    2,052,676
    12,910
    0.63%
    35 Memphis, TN-MS-AR
    1,318,089
    1,325,605
    7,516
    0.57%
    36 Baltimore-Towson, MD
    2,714,546
    2,729,110
    14,564
    0.54%
    37 New York-Northern New Jersey-Long Island, NY-NJ-PA
    18,919,649
    19,015,900
    96,251
    0.51%
    38 Philadelphia-Camden-Wilmington, PA-NJ-DE-MD
    5,971,589
    5,992,414
    20,825
    0.35%
    39 Chicago-Joliet-Naperville, IL-IN-WI
    9,472,584
    9,504,753
    32,169
    0.34%
    40 Milwaukee-Waukesha-West Allis, WI
    1,556,953
    1,562,216
    5,263
    0.34%
    41 Virginia Beach-Norfolk-Newport News, VA-NC
    1,674,502
    1,679,894
    5,392
    0.32%
    42 Birmingham-Hoover, AL
    1,129,068
    1,132,264
    3,196
    0.28%
    43 Cincinnati-Middletown, OH-KY-IN
    2,132,415
    2,138,038
    5,623
    0.26%
    44 St. Louis, MO-IL
    2,814,722
    2,817,355
    2,633
    0.09%
    45 Pittsburgh, PA
    2,357,951
    2,359,746
    1,795
    0.08%
    46 Hartford-West Hartford-East Hartford, CT
    1,212,491
    1,213,255
    764
    0.06%
    47 Rochester, NY
    1,054,723
    1,055,278
    555
    0.05%
    48 Providence-New Bedford-Fall River, RI-MA
    1,601,065
    1,600,224
    -841
    -0.05%
    49 Buffalo-Niagara Falls, NY
    1,135,293
    1,134,039
    -1,254
    -0.11%
    50 Detroit-Warren-Livonia, MI
    4,290,722
    4,285,832
    -4,890
    -0.11%
    51 Cleveland-Elyria-Mentor, OH
    2,075,540
    2,068,283
    -7,257
    -0.35%

    Aaron M. Renn is an independent writer on urban affairs based in the Midwest. His writings appear at The Urbanophile, where this piece originally appeared. Renn is the founder of Telestrian, a data analysis and mapping tool used to create the maps seen here.

  • California Declares War on Suburbia II: The Cost of Radical Densification

    My April 9 Cross Country column commentary in The Wall Street Journal (California Declares War on Suburbia) outlined California’s determination to virtually outlaw new detached housing. The goal is clear:    force most new residents into multi-family buildings at 20 and 30 or more to the acre. California’s overly harsh land use regulations had already driven housing affordability from fairly typical levels to twice and even three times higher than that of much of the nation. California’s more recent tightening of the land use restrictions (under Assembly Bill 32 and Senate Bill 375) has been justified as necessary for reducing greenhouse gas (GHG) emissions.

    It is All Unnecessary: The reality, however, is that all of this is unnecessary and that sufficient GHG emission reductions can be achieved without interfering with how people live their lives. As a report by the McKinsey Company and The Conference Board put it, there would need to be "no downsizing of vehicles, homes or commercial space," while "traveling the same mileage." Nor, as McKinsey and the Conference Board found, would there be a need for a "shift to denser urban housing." All of this has been lost on California’s crusade against the lifestyle most Californians households prefer.

    Pro and Con: As is to be expected, there are opinions on both sides of the issue. PJTV used California Declares War on Suburbia as the basis for a satirical video, Another Pleasant Valley Sunday, Without Cars or Houses? Is California Banning Suburbia?

    California’s Increasing Demand for Detached Housing? A letter to the editor in The Wall Street Journal suggested that there are more than enough single-family homes to accommodate future detached housing demand in California for the next 25 years. That’s irrelevant, because California has no intention of allowing any such demand to be met.

    The data indicates continuing robust demand. In California’s major metropolitan areas, detached houses accounted for 80 percent of the additions to the occupied housing stock between 2000 and 2010, which slightly exceeds the national trend favoring detached housing (Figure 1). If anything, the shift in demand was the opposite predicted by planners, since only 54 percent of growth in occupied housing in the same metropolitan areas was detached in 2000 (Figure 2).


    Watch What they Do, Not What they Say: It does no good to point to stated preference surveys indicating people preferring higher density living. Recently, Ed Braddy noted in newgeography.com (Smart Growth and the New Newspeak) that a widely cited National Association of Realtors had been "spun" to show that people preferred higher density living, from a question on an "unrealistic scenario," and ignoring an overwhelming preference for detached housing – roughly eighty percent – in other questions in the same survey. People’s preferences are not determined by what they say they will do, but rather by what they do.

    Off-Point Criticism: There was also "off-point" criticism, which can be more abundant than criticisms that are "on-point." Perhaps the most curious was by Brookings Institution Metropolitan Policy Program Senior Researcher Jonathan Rothwell (writing in The New Republic) in a piece entitled "Low-Density Suburbs are Are Not Free-Market Capitalism." I was rather taken aback by this, since none of these three words ("free," "market" or "capitalism") appeared in California Declares War on Suburbia. I was even more surprised at the claim that I defend "anti-density zoning and other forms of large lot protectionism." Not so.

    Indeed, I agree with Rothwell on the problems with large lot zoning. However, it is a stretch to suggest, as he does, that the prevalence of detached housing results from large lot zoning. This is particularly true in places like Southern California where lots have historically been small and whose overall density is far higher than that of greater New York, Boston, Seattle and double that of the planning mecca of Portland.

    Rothwell’s own Brookings Institution has compiled perhaps the best inventory of metropolitan land use restrictions, which indicates that the major metropolitan areas of the West have little in large lot zoning. Yet detached housing is about as prevalent in the West as in the rest of the nation (60.4 percent in the West compared to 61.9 percent in the rest of the nation, according to the 2010 American Community Survey). Further, there has been little or no large lot zoning in Canada and Australia, where detached housing is detached, nor in Western Europe and Japan (yes, Japan, see the Note below).  

    On-Point: Urban Growth Boundaries Do Increase House Prices: However, to his credit, Rothwell points out the connection between urban growth boundaries and higher house prices. This is a view not shared by most in the urban planning community, who remain in denial of the economic evidence (or more accurately, the economic principle) that constraining supply leads to higher prices. This can lead to disastrous consequences, as California’s devastating role in triggering the Great Recession indicates.

    The Purpose of Urban Areas: From 1900 to 2010, the urban population increased from 40 percent to 80 percent of the US population. Approximately 95 percent of the population growth over 100 years was in urban areas. People did not move to urban areas the cities for "togetherness" or to become better citizens. Nor did people move out of an insatiable desire for better urban design or planning. The driving force was economic: the desire for higher incomes and better lives. A former World Bank principal urban planner, Alain Bertaud stated the economic justification directly: "large labor markets are the only raison d’être of large cities."

    And for the vast majority of Americans in metropolitan areas, including those in California, those better lives mean living in suburbs and detached houses. All the myth-making in the world won’t change that reality, even if it pushes people out of the Golden State to other, more accommodating pastures.

    The performance of urban areas is appropriately evaluated by results, such as economic outcomes, without regard to inputs, such as the extent to which an area conforms to the latest conventional wisdom in urban planning.

    • Land use policies should not lead to higher housing costs relative to incomes, as they already have in California, Australia, Vancouver, Toronto and elsewhere. If they do, residents are less well served.
    • Transport policies should not be allowed to intensify traffic congestion by disproportionately funding alternatives (such as transit and bicycles) that have little or no potential to improve mobility as seems the likely outcome of radical densification. If they do, residents will be less well served.

    This gets to the very heart of the debate. The “smart growth on steroids” policies now being implemented in California are likely to lead to urban areas with less efficient personal and job mobility, where economic and employment growth is likely to be less than would otherwise be expected. The issue is not urban sprawl. The issue is rather sustaining the middle-income quality of life, which is now endangered by public policy in California, and for no good reason.

    Wendell Cox is a Visiting Professor, Conservatoire National des Arts et Metiers, Paris and the author of “War on the Dream: How Anti-Sprawl Policy Threatens the Quality of Life

    —-

    Note: Despite its reputation for high density living, Japan’s suburbs have many millions of detached houses. In 2010, 47 percent of the occupied housing in Japan’s major metropolitan areas was detached (Tokyo, Osaka-Kobe-Kyoto, Nagoya, Sapporo, Sendai, Hiroshima, Kitakyushu-Fukuoka, Shizuoka and Hamamatsu).

    Photo: An endangered species: Detached houses in Ventura County (Photo by author)

  • Smart Growth: The Maryland Example

    This is Part Two of a two-part series.

    Evidence that people just don’t like Smart Growth is revealed in findings from organizations set up to promote Smart Growth. In 2009, the Washington Post reported, “Scholars at the National Center for Smart Growth Research and Education found that over a decade, smart growth has not made a dent in Maryland’s war on sprawl.”

    Citing the “most comprehensive review to date” from the same Center, the Baltimore Sun in 2011 argued that Maryland had made “little progress with Smart Growth” despite adopting laws and policies hailed across the country as models for growth management.

    One of the innovative policies was the establishment of Priority Funding Areas (PFAs) where development was to be directed and incentivized with money for cash-strapped jurisdictions. Yet the representative bodies closest to the people continued to permit development outside the PFAs.

    Assessing the failure of incentives to concentrate development, the Center concluded: “As the Maryland experience suggests, without statutory requirements, tools that matter to the state are not always those that matter to local governments.”

    The anti-democratic outlook among Smart Growthers was evident in a comment by Gerrit Knapp, the director of the National Center for Smart Growth Research and Education, who said, “What makes incentives so politically attractive is that governments and individuals can choose to ignore them if they wish. Unfortunately, in Maryland over the last decade, that’s exactly what many have been doing.”

    This “unfortunate” behavior by free people is consistent with the conclusion of Robert Bruegmann, author of Sprawl: A Compact History, who found that low density development was “the preferred settlement pattern everywhere in the world where there is a certain measure of affluence and where citizens have some choice in how they live.”

    Deconstructing Density

    Under the new PlanMaryland, Priority Funding Areas essentially become urban growth boundaries. People still can choose to live outside PFAs, but new housing can be built at no greater than one unit per 20 acres, making such dwellings unaffordable to all but the extremely rich. Ninety percent of new development must be inside the PFAs at a minimum density of 3.5 units per acre.

    The impact of increased densities is hard to gauge when presented in this manner, but 3.5 units per acre converts to 2,240 units per square mile. Maryland averages 2.62 people per dwelling unit, so the minimum population density for almost all new development will be on a scale of 5,846 people per square mile, a density higher than Portland or San Francisco, and just shy of Copenhagen, Denmark.

    Furthermore, reviewing previous drafts of PlanMaryland leads one to believe that this minimum density will be the exception to the rule of even higher densities. The earliest draft available for public comment, April 2011, was unapologetic about the need for significantly higher densities, saying this “threshold for new development – a relatively low density of 3.5 units per acre – is not accommodating growth in PFAs as needed to minimize continued impacts on our rural and resource lands and industries.”

    A later draft, September 2011, established ranges for “medium density” (3.5 to 10 units per acre) and “high density” (10+ units per acre) and repeatedly showed a preference for the high density classification, which converts to a scale of at least 16,704 people per square mile.

    For example, on page 18 is the complaint that incentive-based planning “hindered high-density urban development,” and page 35 says there would be dramatic per capita savings “if 25 percent of the low-density development projected to be built from 2000 to 2025 was shifted to high-density development.”

    But a strange thing happened on the road to the final draft: high density was euphemized. The sixteen-page Executive Summary does not once mention density. “Low density” makes numerous appearances in the final draft in the context of wasteful land use patterns, and “high density” appears just once.

    Instead, PlanMaryland relies on the phrase “compact development”. A comparison table, laughably labeled “Low Density versus Compact Development,” steers clear of medium or high density labels even though, when converted to population per square mile, the “compact” living arrangement would be more than seven times Maryland’s current density.

    To discern the density thresholds that Maryland planners have in mind, consider, PlanMaryland claims that “Compact development leads people to drive 20 to 40 percent less, at minimal or reduced cost, while reaping fiscal and health benefits.”

    This appears to be lifted from the influential 2007 Growing Cooler report, sponsored by the National Center for Smart Growth Research and Education, Smart Growth America, and other advocacy organizations. The authors call on “all housing growth” to be built at an average density of 13 units per acre (21,798 people per square mile), in order to increase the overall metropolitan density to 9 units per acre (15,091 people per square mile) by the year 2025. There’s not a lot of room for detached single family homes in this scenario.

    PlanMaryland’s Best Practices section highlights White Flint in North Bethesda for redeveloping “an auto-dominated suburban strip into an environment where people walk to work, shops and transit.” This project puts 1,400 apartments on 32 acres, for a density of 44 units per acre.

    Hyattsville’s Arts District is recognized because “this mixed-use community features row homes, condominiums, live-work units, shops and a new community center,” but there is no room for detached, single family homes among the 500 dwellings crowded onto 25 acres, or 20 units per acre. Also featured is Carroll Creek Park that has 300 residential units, all multi-family, mixed among commercial and office space along a linear 1.3-mile strip.

    As a “Traditional Neighborhood Development,” Kentlands is closer to the norm, and features some single family housing among its mix of shops, apartments, and condos, but the 1,655 residential units on 352 acres is still 35 percent higher than the “minimum” densities mentioned in PlanMaryland, and thirteen times the state’s current density level.

    These places are architecturally striking and aesthetically attractive, but they are unaffordable to most of the state’s population. Furthermore, the dearth of detached single family housing, the predominance of multi-family dwellings mixed with (not nearby) other uses, and dramatically higher densities are not at all what an overwhelming majority of people want in Maryland or anywhere else.

    The emergence of Smart Growth in Maryland is indicative of the movement in general: For successful implementation, it would be necessary to replace incentives with mandates, and continue to rely on euphemistic language to avoid a candid discussion of density.

    In October, I spoke — along with Wendell Cox and a few others — at a technical forum on PlanMaryland, addressing many areas of concern including density. Signed into law by Governor Martin O’Malley in December 2011, PlanMaryland weakens the authority of local governments, eviscerates property rights, and expresses hope for declining interest in the single family home.

    Defenders will argue that most people support Smart Growth; after all, O’Malley and others like him were popularly elected. Yet these politicians never campaign on the specifics of Smart Growth, such as how many people per square mile they believe is necessary, or what kinds of restrictions they will impose on single family housing in the suburbs, or the impacts on affordability.

    The September draft of PlanMaryland said, “PlanMaryland, we believe, is what the public says it wants and deserves in government.” Tellingly, this statement is missing from the final report. That’s because what planners want and what people prefer are starkly different.

    Photo: New residential smart growth, from the state of Maryland’s, “Smart, Green, and Growing” site.

    Ed Braddy is the executive director of the American Dream Coalition, a non-profit organization promoting freedom, mobility and affordable homeownership. Mr. Braddy often speaks on growth management related issues and their impact on local communities or at ed@americandreamcoalition.org