Category: planning

  • How Lower Income Citizens Commute

    One of the most frequently recurring justifications for densification policies (smart growth, growth management, livability, etc.) lies with the assumption that the automobile-based mobility system (Note 1) disadvantages lower income citizens. Much of the solution, according to advocates of densification is to discourage driving and orient both urbanization and the urban transportation system toward transit as well as walking and cycling.

    Of course, there is no question but that lower income citizens are disadvantaged with respect to just about everything economic. However, there are few ways in which lower income citizens are more disadvantaged than in their practical access to work and to amenities by means of transit, walking and cycling. Indeed, the impression that lower income citizens rely on transit to a significantly greater degree than everyone else is just that – an impression.

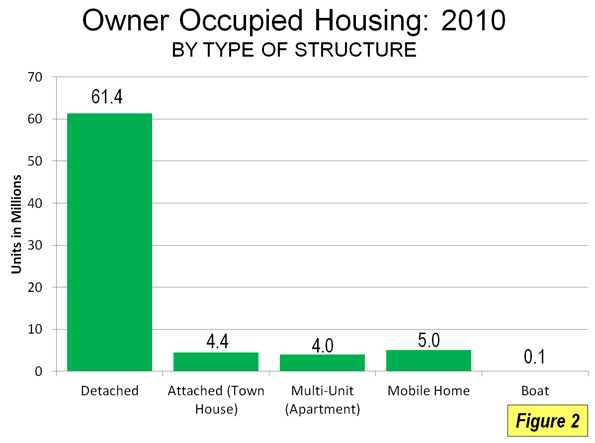
    The Data: This is illustrated by a compilation of work trip data from the five-year American Community Survey for 2006 to 2010. In the nation’s 51 major metropolitan areas (more than 1,000,000 population), 76.3% of lower income employees use cars to get to work, three times that of all other modes combined (Figure 1).

    Admittedly, this is less than the 83.3% of all employees who use cars for the work trip, but a lot more than would be expected, especially among those who believe that transit is the principal means of mobility for low income citizens. Overall, 8 times as many lower income citizens commuted by car as by transit. In this analysis, lower income citizens are defined as employees who earn less than $15,000 per year, which is approximately one-half of the median earnings per employee of $29,701. .

    Perhaps most surprising is the fact that only 9.6% of lower income citizens used transit to get to work. This is not very much higher than the 7.9% of all workers in the metropolitan areas who use transit. (Table 1).  

    Table 1
    Work Trip Market Share: 2006-2010
    Lower Income Employees and All Employees
    Metropolitan Areas Over 1,000,000 Population
      Lower Income Employees
    All Employees Market Share Employees Earning Under $15,000 Annually Market Share
    Car, Truck & Van: Alone 56.72 73.4% 9.56 63.1%
    Car, Truck & Van: Carpool 7.67 9.9% 2.00 13.2%
    Car, Truck & Van: Total 64.38 83.3% 11.56 76.3%
    Transit 6.14 7.9% 1.46 9.6%
    Walk 2.19 2.8% 0.89 5.9%
    Other (Taxi, Motorcyle, Bicycle & Other) 1.34 1.7% 0.39 2.6%
    Work At Home 3.24 4.2% 0.85 5.6%
    Total 77.29 100.0% 15.16 100.0%
    In Millions
    Note: Median Earnings: $29,701
    Source: American Community Survey: 2006-2010


    Transit’s small market share has to do with its inherent impracticality as a means of getting to most employment. According to ground-breaking research by the Brookings Institution, low-income citizens could reach only 35 percent of jobs in the major metropolitan areas by transit in 90 minutes. In other words, you cannot get from here to there, at least for most trips. It is no more reasonable for lower income citizens to spend three hours per day commuting than it is for anyone else. A theoretical 90 minute one-way standard is no indicator of usable mobility. It is likely that only about 8 percent of jobs are accessible by lower income citizens in 45 minutes (Note 2) and 4 percent in 30 minutes.

    Automobility: Among the major metropolitan areas, lower income citizens use automobiles to get to work most in Birmingham (90.6%). Fourteen other metropolitan areas have lower income automobile market shares of 85% or more, including Charlotte, Detroit, Dallas-Fort Worth, Indianapolis, Jacksonville, Kansas City, Louisville, Memphis, Nashville, Oklahoma City, Raleigh, San Antonio, St. Louis and Tampa-St. Petersburg. As in all things having to do with urban transportation, there are two Americas: New York and outside New York. By far the lowest automobile market share for low income citizens is in New York, at 49.3%. The second lowest lower income automobile market share is in San Francisco-Oakland, at 63.1%. Washington and Boston are also below 70% (Table 2).

    Table 2
    Work Trip Market Share: Car, Truck or Van: 2006-2010
    Lower Income Employees and All Employees
    Metropolitan Areas Over 1,000,000 Population
      Lower Income Employees
    Metropolitan Area All Employees Employees Earning Under $10,000 Employees Earning $10,000-$14,999 All Under $15,000 (Combined)
    Atlanta, GA 88.3% 82.1% 83.8% 82.8%
    Austin, TX 87.2% 77.8% 82.3% 79.5%
    Baltimore, MD 85.9% 73.8% 77.7% 75.1%
    Birmingham, AL 94.6% 89.3% 92.6% 90.6%
    Boston, MA-NH 77.2% 66.4% 73.4% 68.5%
    Buffalo, NY 89.7% 79.8% 84.3% 81.3%
    Charlotte, NC-SC 90.9% 85.3% 88.5% 86.4%
    Chicago, IL-IN-WI 80.0% 73.0% 77.0% 74.4%
    Cincinnati, OH-KY-IN 91.2% 82.7% 87.9% 84.4%
    Cleveland, OH 87.3% 78.1% 84.3% 80.3%
    Columbus, OH 90.8% 80.3% 87.1% 82.6%
    Denver, CO 85.3% 76.9% 82.1% 78.9%
    Detroit. MI 93.1% 85.8% 89.9% 87.2%
    Dallas-Fort Worth, TX 91.5% 85.4% 88.7% 86.7%
    Hartford, CT 89.7% 76.8% 83.1% 78.8%
    Houston. TX 90.7% 83.6% 86.4% 84.7%
    Indianapolis, IN 92.6% 85.1% 90.2% 86.9%
    Jacksonville, FL 91.6% 85.4% 88.3% 86.5%
    Kansas City,  MO-KS 90.6% 85.2% 87.6% 86.2%
    Los Angeles, CA 84.7% 70.8% 74.1% 72.2%
    Las Vegas, NV 89.7% 80.0% 82.4% 81.0%
    Louisville, KY-IN 92.4% 85.6% 87.6% 86.3%
    Memphis, TN-MS-AR 93.3% 85.0% 89.6% 86.7%
    Miami, FL 88.3% 79.0% 80.9% 79.9%
    Milwaukee, WI 89.3% 78.0% 83.5% 79.8%
    Minneapolis-St. Paul, MN-WI 86.8% 76.9% 81.1% 78.2%
    Nashville, TN 92.0% 86.8% 89.5% 87.8%
    New Orleans, LA 90.0% 80.9% 83.8% 82.0%
    New York, NY-NJ-PA 57.6% 50.0% 48.1% 49.3%
    Oklahoma City, OK 93.1% 86.8% 90.8% 88.2%
    Orlando, FL 89.6% 79.7% 86.1% 81.8%
    Pittsburgh, PA 86.2% 77.9% 81.8% 79.2%
    Philadelphia, PA-NJ-DE-MD 82.1% 70.6% 76.2% 72.4%
    Phoenix, AZ 88.6% 80.5% 83.9% 81.8%
    Portland, OR-WA 81.6% 69.3% 75.1% 71.3%
    Providence, RI-MA 89.9% 79.9% 87.1% 82.3%
    Raleigh, NC 90.8% 84.0% 88.0% 85.4%
    Rochester, NY 89.9% 76.7% 87.0% 80.0%
    Riverside-San Bernardino, CA 90.6% 83.4% 87.1% 84.8%
    Richmond, VA 91.3% 83.2% 86.2% 84.2%
    Sacramento, CA 90.7% 80.8% 86.3% 82.9%
    San Antonio, TX 92.1% 85.7% 88.2% 86.6%
    San Diego, CA 85.9% 73.6% 79.9% 76.0%
    Seattle, WA 81.3% 72.4% 76.1% 73.7%
    San Francisco-Oakland, CA 72.4% 63.3% 63.4% 63.3%
    San Jose, CA 87.1% 74.3% 80.2% 76.4%
    Salt Lake City, UT 88.1% 79.6% 83.4% 81.0%
    St. Louis, MO-IL 91.1% 83.8% 88.6% 85.4%
    Tampa-St. Petersburg, FL 90.1% 84.1% 87.6% 85.5%
    Virginia Beach-Norfolk, VA-NC 89.8% 81.9% 81.8% 81.9%
    Washington, DC-VA-MD-WV 77.1% 67.8% 71.4% 69.0%
    Total: 51 Metropolitan Areas 83.3% 75.1% 78.3% 76.3%
           New York 57.6% 50.0% 48.1% 49.3%
          Outside New York 86.5% 77.8% 81.8% 79.3%
    Average of Metropolitan Areas 87.7% 78.9% 83.0% 80.4%
    Median 89.7% 80.0% 84.3% 81.8%
    Maximum 94.6% 89.3% 92.6% 90.6%
    Minimum 57.6% 50.0% 48.1% 49.3%
    Note: Median Earnings: $29,701
    Source: American Community Survey: 2006-2010


    Transit: It’s not surprising that New York has by far the highest transit market share among lower income commuters. However, New York’s lower income transit market share is only marginally higher than its market share among all commuters, at 31.5%, compared to 30.0% for the entire workforce. San Francisco-Oakland had the second highest lower income transit market share at 16.8%. Boston, Chicago, Philadelphia and Washington were also above 10%. The lowest transit market share among lower income citizens was 1.1% in Oklahoma City. Six other metropolitan areas had lower income transit market shares under 2.5%, including Birmingham, Indianapolis, Jacksonville, Nashville, Raleigh and San Antonio (Table 3).

    Table 3
    Work Trip Market Share: Transit: 2006-2010
    Lower Income Employees and All Employees
    Metropolitan Areas Over 1,000,000 Population
      Lower Income Employees
    Metropolitan Area All Employees Employees Earning Under $10,000 Employees Earning $10,000-$14,999 All Under $15,000 (Combined)
    Atlanta, GA 3.4% 5.6% 6.2% 5.8%
    Austin, TX 2.6% 5.9% 5.3% 5.6%
    Baltimore, MD 6.3% 9.8% 9.3% 9.6%
    Birmingham, AL 0.7% 1.8% 1.8% 1.8%
    Boston, MA-NH 11.9% 12.3% 13.3% 12.6%
    Buffalo, NY 3.7% 6.9% 5.8% 6.6%
    Charlotte, NC-SC 2.0% 3.5% 3.1% 3.3%
    Chicago, IL-IN-WI 11.4% 11.9% 12.5% 12.1%
    Cincinnati, OH-KY-IN 2.4% 4.3% 3.8% 4.1%
    Cleveland, OH 2.7% 5.3% 3.1% 4.5%
    Columbus, OH 1.7% 3.5% 3.8% 3.6%
    Denver, CO 4.6% 7.2% 7.2% 7.2%
    Detroit. MI 1.5% 3.5% 3.1% 3.3%
    Dallas-Fort Worth, TX 1.6% 2.6% 2.9% 2.7%
    Hartford, CT 2.8% 5.4% 5.0% 5.3%
    Houston. TX 2.6% 4.1% 4.3% 4.1%
    Indianapolis, IN 1.0% 2.6% 1.6% 2.2%
    Jacksonville, FL 1.1% 2.5% 2.4% 2.5%
    Kansas City,  MO-KS 1.7% 3.8% 3.4% 3.6%
    Los Angeles, CA 6.1% 11.7% 13.9% 12.6%
    Las Vegas, NV 3.6% 7.4% 7.6% 7.5%
    Louisville, KY-IN 2.2% 4.7% 3.7% 4.3%
    Memphis, TN-MS-AR 1.3% 3.3% 3.1% 3.3%
    Miami, FL 3.7% 7.9% 8.3% 8.1%
    Milwaukee, WI 3.7% 7.7% 7.4% 7.6%
    Minneapolis-St. Paul, MN-WI 4.6% 6.4% 6.4% 6.4%
    Nashville, TN 1.0% 1.8% 2.0% 1.9%
    New Orleans, LA 2.5% 5.0% 5.3% 5.1%
    New York, NY-NJ-PA 30.5% 30.0% 34.0% 31.5%
    Oklahoma City, OK 0.5% 1.3% 0.8% 1.1%
    Orlando, FL 3.9% 7.4% 5.9% 6.9%
    Pittsburgh, PA 5.8% 6.2% 6.4% 6.3%
    Philadelphia, PA-NJ-DE-MD 9.3% 12.2% 11.8% 12.1%
    Phoenix, AZ 2.2% 4.2% 4.9% 4.5%
    Portland, OR-WA 6.2% 9.3% 8.3% 8.9%
    Providence, RI-MA 2.6% 3.3% 3.2% 3.3%
    Raleigh, NC 0.9% 1.9% 2.1% 2.0%
    Rochester, NY 2.0% 4.8% 3.0% 4.2%
    Riverside-San Bernardino, CA 1.6% 2.7% 2.3% 2.6%
    Richmond, VA 1.9% 3.8% 4.4% 4.0%
    Sacramento, CA 2.2% 5.1% 4.6% 4.9%
    San Antonio, TX 1.3% 2.3% 2.8% 2.5%
    San Diego, CA 3.3% 6.9% 6.1% 6.6%
    Seattle, WA 8.2% 9.9% 10.5% 10.1%
    San Francisco-Oakland, CA 14.6% 15.8% 18.4% 16.8%
    San Jose, CA 3.3% 6.1% 6.0% 6.1%
    Salt Lake City, UT 3.2% 5.2% 4.5% 5.0%
    St. Louis, MO-IL 2.6% 4.8% 3.4% 4.4%
    Tampa-St. Petersburg, FL 1.4% 2.9% 2.3% 2.7%
    Virginia Beach-Norfolk, VA-NC 1.7% 3.8% 4.7% 4.1%
    Washington, DC-VA-MD-WV 13.9% 14.3% 15.8% 14.8%
    Total: 51 Metropolitan Areas 7.9% 9.4% 10.1% 9.7%
           New York 30.5% 30.0% 34.0% 31.5%
          Outside New York 5.1% 7.1% 7.4% 7.2%
    Average of Metropolitan Areas 4.3% 6.3% 6.3% 6.3%
    Median 2.6% 5.1% 4.7% 4.9%
    Maximum 30.5% 30.0% 34.0% 31.5%
    Minimum 0.5% 1.3% 0.8% 1.1%
    Note: Median Earnings: $29,701
    Source: American Community Survey: 2006-2010


    Automobile and Transit Metrics: The difference in automobile commuting between all employees and lower income employees turns out to be surprisingly small. The least variation is in Birmingham, where the automobile market share among lower income commuters is 4.3% below that of all commuters. Charlotte, Kansas City and Nashville also have lower income market share variations of less than 5%. The greatest variation is in Los Angeles, where the automobile market share among lower income commuters is 14.7% less than for all commuters. The lower income automobile market share is also at least 12.5% below that of all commuters in Baltimore, New York and Portland.

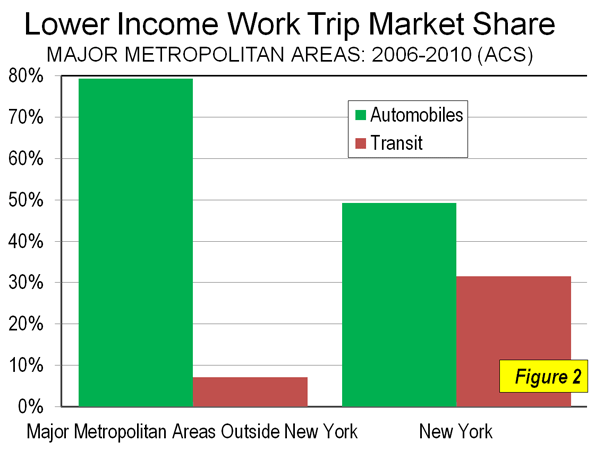
    Oklahoma City has the most lower income automobile commuters in relation to transit commuters, with 81.3 times as many lower income commuters using automobiles as opposed to transit. In Birmingham, Nashville and Raleigh, there are more than 40 lower income automobile commuters per transit commuter.  In contrast, the number of low-income automobile commuters in New York is 1.6 times that of lower income transit commuters. Again, New York is in a class by itself (Figure 2). Outside New York, there are 11.0 times as many lower income automobile commuters as transit commuters. San Francisco-Oakland (3.8) and Washington (4.7) are the only other metropolitan areas with fewer than five lower income automobile commuters per transit commuter (Table 4).

    Table 4
    Work Trip Market Share: 2006-2010
    Lower Income Employees and All Employees
    Metrics: Car, Truck or Van & Transit
    Metropolitan Areas Over 1,000,000 Population
    Lower Income Car, Truck or Van Market Share Compared to All Car Truck or Van Market Share Times Transit
    Metropolitan Area Employees Earning Under $10,000 Employees Earning $10,000-$14,999 All Under $15,000 (Combined)
    Atlanta, GA -7.0% -5.0% -6.3% 14.2
    Austin, TX -10.8% -5.5% -8.8% 14.1
    Baltimore, MD -14.1% -9.6% -12.6% 7.8
    Birmingham, AL -5.6% -2.1% -4.3% 50.7
    Boston, MA-NH -14.1% -5.0% -11.2% 5.4
    Buffalo, NY -11.1% -6.0% -9.4% 12.4
    Charlotte, NC-SC -6.1% -2.6% -4.9% 25.9
    Chicago, IL-IN-WI -8.8% -3.8% -7.0% 6.1
    Cincinnati, OH-KY-IN -9.3% -3.6% -7.4% 20.4
    Cleveland, OH -10.5% -3.3% -8.0% 17.7
    Columbus, OH -11.5% -4.0% -9.0% 23.1
    Denver, CO -9.8% -3.8% -7.5% 10.9
    Detroit. MI -7.8% -3.5% -6.4% 26.2
    Dallas-Fort Worth, TX -6.7% -3.0% -5.2% 31.7
    Hartford, CT -14.4% -7.4% -12.2% 15.0
    Houston. TX -7.9% -4.8% -6.6% 20.5
    Indianapolis, IN -8.1% -2.5% -6.2% 39.1
    Jacksonville, FL -6.8% -3.6% -5.6% 35.1
    Kansas City,  MO-KS -5.9% -3.4% -4.9% 23.7
    Los Angeles, CA -16.4% -12.4% -14.7% 5.7
    Las Vegas, NV -10.8% -8.1% -9.8% 10.8
    Louisville, KY-IN -7.4% -5.3% -6.6% 19.9
    Memphis, TN-MS-AR -9.0% -4.0% -7.1% 26.7
    Miami, FL -10.5% -8.4% -9.6% 9.9
    Milwaukee, WI -12.6% -6.5% -10.6% 10.5
    Minneapolis-St. Paul, MN-WI -11.4% -6.5% -9.8% 12.2
    Nashville, TN -5.7% -2.7% -4.6% 46.1
    New Orleans, LA -10.2% -6.9% -8.9% 15.9
    New York, NY-NJ-PA -13.1% -16.5% -14.4% 1.6
    Oklahoma City, OK -6.8% -2.5% -5.3% 81.3
    Orlando, FL -11.1% -3.9% -8.7% 11.8
    Pittsburgh, PA -9.7% -5.2% -8.2% 12.7
    Philadelphia, PA-NJ-DE-MD -14.0% -7.2% -11.8% 6.0
    Phoenix, AZ -9.1% -5.3% -7.6% 18.1
    Portland, OR-WA -15.1% -7.9% -12.5% 8.0
    Providence, RI-MA -11.1% -3.1% -8.4% 25.3
    Raleigh, NC -7.4% -3.1% -5.9% 42.8
    Rochester, NY -14.7% -3.3% -11.0% 19.1
    Riverside-San Bernardino, CA -8.0% -3.9% -6.5% 32.7
    Richmond, VA -8.9% -5.6% -7.7% 20.9
    Sacramento, CA -10.9% -4.8% -8.6% 17.0
    San Antonio, TX -7.0% -4.2% -6.1% 35.1
    San Diego, CA -14.3% -7.0% -11.5% 11.5
    Seattle, WA -10.9% -6.4% -9.3% 7.3
    San Francisco-Oakland, CA -12.5% -12.4% -12.5% 3.8
    San Jose, CA -14.7% -8.0% -12.3% 12.6
    Salt Lake City, UT -9.6% -5.3% -8.1% 16.3
    St. Louis, MO-IL -8.0% -2.8% -6.3% 19.6
    Tampa-St. Petersburg, FL -6.6% -2.7% -5.1% 31.8
    Virginia Beach-Norfolk, VA-NC -8.7% -8.9% -8.8% 19.8
    Washington, DC-VA-MD-WV -12.0% -7.3% -10.4% 4.7
    Total: 51 Metropolitan Areas -9.8% -6.0% -8.4% 7.9
           New York -13.1% -16.5% -14.4%                   1.6
          Outside New York -10.1% -5.5% -8.4% 11.0
    Average of Metropolitan Areas -10.1% -5.5% -8.5% 12.7
    Median -9.8% -5.0% -8.2%                17.0
    Maximum -5.6% -2.1% -4.3%                81.3
    Minimum -16.4% -16.5% -14.7%                   1.6
    Note: Median Earnings: $29,701
    Source: American Community Survey: 2006-2010


    A Line Driven in a Car: Why is this the case?  The "bottom line" has been perhaps best characterized by Marge Waller and Mark Allen Hughes in a research paper for the Progressive Policy Institute of the Democratic Leadership Council.

    In most cases, the shortest distance between a poor person and a job is along a line driven in a car. Prosperity in America has always been strongly related to mobility and poor people work hard for access to opportunities. For both the rural and inner-city poor, access means being able to reach the prosperous suburbs of our booming metropolitan economies, and mobility means having the private automobile necessary for the trip. The most important response to the policy challenge of job access for those leaving welfare is the continued and expanded use of cars by low-income workers

    Concerns about the automobile based urban transportation system excluding lower income citizens are misplaced. Despite all the hand-wringing, America’s lower income population has considerable access to cars and far greater mobility as a result. It is no more than a figment of planner’s imaginations that lower income citizens would be best served by constraining car use and trying to force them into transit service that more often than not gives circuitous, slower and often impossible for access to work opportunities.

    Wendell Cox is a Visiting Professor, Conservatoire National des Arts et Metiers, Paris and the author of “War on the Dream: How Anti-Sprawl Policy Threatens the Quality of Life

    —–

    Note 1: As used in this article, automobile includes cars, trucks and vans.

    Note 2: This estimate estimates lower income 45 minute access using the ration between 90 minute and 45 minute for all employees (as reported in the Brookings Institution report)

    Photograph: Classic early 1950s Buick, Sinsheim Auto & Technik Museum, Sinsheim, Baden-Württemberg, Germany (by author).

  • New Urbanism vs. Dispersionism

    The Florida real estate developer, unburdened of state regulatory agencies, may now focus his efforts on pleasing the investment community and the local market.  I recently played the role of real estate developer interviewing two consultant teams vying to help me create a new fictional community.  Fortified with readings in both the New Urbanist camp and the Dispersionist camp, each team of students pitched their method of community building to me. 

    The actual debate was very lively, with many rebuttals and some serious emotional engagement.  The premise:  I have a multi-acre greenfield property.   I have shortlisted my planning candidates down to two:  a New Urbanist team, and a Dispersionist team.  Each team must pitch their philosophy, and I will select one team to design it.

    Question 1:  Since I am only able to afford Phase 1, future phases will be left to future developers.  In your approach, can future generations be trusted to keep focus on high-quality development?  How would you guarantee that the property rises in value?  I asked the New Urbanists to go first.

    The New Urbanist team was ready:  As Master Planners, they will create the entire form-based vision for the property and design it around a smart code so that the future developers will obey a plan to keep property values rising.  No future developer will get to ‘cheap out’.  For this team, the Master Plan will guarantee a quality of life for all residents.

    The Dispersionists will plan Phase 1, not as a rigid image of a town, but rather as a response to the natural landscape.  This team said the community would grow organically, from its functional needs, guaranteeing  the freedom of future generations to plan their own destiny. They  scoffed at a Master Plan that determined the urban form.  What good is a guarantee of a quality of life, they asked, if future generations want something different than the Master Planner intended?

    This round, in my mind, went to the Dispersionists.  Their argument that future generations should have the freedom to plan based on their functional needs outweighed the seductive beauty of a Master Plan.  Too many Master Plans are implemented poorly, or abandoned due to their disutility based on changing needs and markets.

    Question 2:  How does your viewpoint deal with the car?  How will residents and visitors get around your community?  I asked the Dispersionists to go first this time.

    “Well,” replied the Dispersionists, “Americans love their cars, and we love the car too.  We’ll plan for sidewalks and bikes, but we know that the car is a necessity.  We know that a 5-minute walk isn’t so realistic in Florida’s hot, humid climate.”  The Dispersionists have a hearty regard for cars, and they spoke of long, sweeping curves and scenic drives.  They pointed out that most residents will need to drive to other parts of the city as well.

    The New Urbanists shuddered.  “We will plan for car-free living,” they stated.  With very clever planning, they intended to keep driving to a minimum, and will design walking trails.  One New Urbanist ventured 4-story parking garages, crowing that their proposal would not be littered with gas stations.  The New Urbanists pointed out the ugly commercial strips dominating our current city, and how little they want that to intrude into the new development.

    I liked this, and challenged the Dispersionists.  Isn’t it better health, and less use of oil, to reduce vehicle dependency?  The Dispersionists asked me why, in this ten-acre community, I thought I could attract residents with 4-story parking garages?  Good point, I thought.

    Both sides had good answers, and the question did not fully go to one side or the other.  Cars do tend to  generate a lot of aesthetic horror.  On the other hand, they are not going away anytime soon, so learning how to deal with them seems like an important task for a developer looking to the future.

    Question 3:  How would you distribute density in your development?  One center, multiple centers, and centered around what?  This time the New Urbanists went first.

    The core, they stated, will be in the center of town, and could go to 8-10 stories, leaving the perimeter a green zone.  In the center will be the government and institutional buildings, carefully matched with proper style.  The point, they said, is predictability. They pledged to learn from the failures of the past, and their Master Plan will account for the full scope of development.

    The Dispersionists suggested multiple centers.  “Phase 1 will be our first density cluster,” they said, “and we’ll see how it goes.”  Unlike the New Urbanists, they didn’t want to introduce all their product at once, in case the market changes.  “We believe in New England-style green space,” they said, and wanted to evolve the community around these.  They saw the vitality of the community coming from diversity.

    I asked the New Urbanists what they would do if the market changes .  When pressed, they insisted their Master Plan had plenty of contingency plans in case the original plan wasn’t workable, but it sounded like they were winging it.

    This is what  the Dispersionists saw as their own strong suit.  “We don’t have all the answers,” they said.  Their first phase would gently nudge the community in a certain direction, but it would leave future developers the choice whether to reinforce the first phase, or strike out and build another phase better suited to a unique need.

    I felt that this round went to the Dispersionists. 

    Question 4:  Do you think your development scheme can promote or discourage social values?  Why or why not?  This time the Dispersionists went first.

    The Dispersionists believed that one cannot engineer social values through urban design.  However, they can be influenced.  Conservation, for example, is a value that they would promote in their plan to conserve open space and not overtake the land with development.  A sense of community, they said, was another, giving people a loyalty to their community out of good design.  These, they felt, led to a sustainable plan.

    The New Urbanists guaranteed that conservation land would always be there, and pointed out the Dispersionists’ flexibility as a negative . The New Urbanists insisted that their sense of place would be stronger, because it would be designed.  People want predictability.  New Urbanists would engage people by walking and having front porches.

    The Dispersionists speculated that neighbors will get to know one another in a cul-de-sac just as well as they would if they all had front porches.  They also felt that the shared experiences of a community would transcend the particular style or form that community took.

    Although I gave this one to the New Urbanists, I was skeptical about  the New Urbanists’ implication that well-behaved buildings produce well-behaved people.  The Dispersionists’ view that a cul-de-sac breeds any neighborly closeness also seemed a bit disingenuous.  It was near the end of class.

    Question 5:  Give me your arguments why your strategy is sustainable.  I let the New Urbanists go first.

    For one thing, they said, they will have more efficient transportation. Vertical buildings save land, they argued, and people who choose this community will value open space more highly and be willing to live densely.  They believed that they will have less gridlock by de-emphasizing the car and will be more stable and socially cohesive.  All this will come from a well-designed Master Plan.

    The Dispersionists said  their community would start small and then grow.  Failures won’t cause dead zones, they claimed, because they are not sentimental about form and want a community that works.  So if a building in their development begets a failed business, the building will need to be reinvented to make it successful.

    “Yes, but,” countered the New Urbanists, “for every successful community like yours, there are 10 that have failed and ultimately decline in value.  What guarantee do you give that you will be the one out of ten?”  They went on to cite their successes – Seaside, Celebration, and so on.

    The Dispersionists noted that Seaside was a resort town and Celebration was heavily subsidized by a local employer, so those weren’t exactly good models.  In any case, they said, their community will appeal to a much broader segment of the population than the New Urbanists, and therefore more likely to sustain growth in the future.

    With that, the debate was concluded.  What lingers, however, are some truths that show both sides need to do some more work.

    The New Urbanists, fresh on the scene, seem overly evangelical in their approach, and demand a great deal of faith in the Master (Planner).  The slow, organically grown towns of which they are so fond were largely planned before the car.  While many of these towns, like Charleston, South Carolina, are sentimental favorites, their practical replication in today’s transportation-intensive, constantly changing real estate market is questionable.

    The Dispersionists, on the other hand, have been around for quite a long time, and are the modus operandi for much of the earth’s population.  They seem uninvolved in the aesthetics of the built environment, preferring to leave this up to individual taste, and the result is a rather shabby, cluttered contemporary American scene.  Some cleaning up is certainly in order.

    While the New Urbanists have a hopeful approach in this regard, they are overreacting to the vast consumer-oriented real estate development world that operated up until 2007, and are missing the fundamentals of how a real community works.  None are built around employers or economic producers in any significant way. None admit the lowest socioeconomic groups.  Content, perhaps, to dabble with shopping districts and farmer’s markets, New Urbanists have yet to offer what contemporary employers need – space, flexibility, and room to grow.  They therefore seem doomed to create peripheral urban designs rather than communities integrated with 21st century employers.

    Dispersionists would do well to pay a bit more attention to the natural environment, for the general public is quite aware of the toll that this strategy has taken.  Developers, having overbuilt in so many markets recently, will face tough opposition to bulldozing another woodland, given the empty real estate that exists in our cities today.

    It seems inevitable that dispersionist strategies will continue; they largely dominate our real estate development world and will continue to do so.  They make the most economic sense, they leave the future choices to the future generations, and they respond to people’s natural density tendencies.  One hopes that the New Urbanists will nudge the market a bit more towards aesthetic continuity and environmental stewardship as the next wave of growth inevitably begins again, and that the debate remains healthy, productive, and positive as citizens get re-engaged about the future of their cities.

    Richard Reep is an Architect and artist living in Winter Park, Florida. His practice has centered around hospitality-driven mixed use, and has contributed in various capacities to urban mixed-use projects, both nationally and internationally, for the last 25 years.

    Photo courtesy of BigStockPhoto.com.

  • Indianapolis: From Naptown to Super City

    I have long touted the sports strategy that Indianapolis used to revitalize its downtown as a model for cities to follow in terms of strategy led economic and community development. I really think it sets the benchmark in terms of how to do it, and it has been very successful.

    Indy is hosting the Super Bowl on Sunday, something that is locally seen as a sort of crowning achievement of the 40 year sports journey. As part of that, the Indianapolis Star and public TV station WFYI produced an hour long documentary on the journey called “Naptown to Super City.” I think it’s a must watch for anyone who is trying to figure out to revitalize their own downtown. An hour isn’t short, but given the billions of dollars cities pour into this, I think it’s worth doing some homework. It tells the story of how Indy went from a deserted downtown where local Jaycees were licensed to take their shotguns and kill pigeons to one where the Super Bowl is being hosted today.

    I’ll talk more about the Indy strategy in a bit, but first the show. If you are in Google Reader this won’t display for you, so click here to watch.


    One thing this brought home for me is the true magnitude of the change. Perhaps I’m being a bit uncharitable, but Indianapolis almost literally started with nothing. It was never a major, important American city. It had no brand in the market. And it had a downtown that was all but dead. Everything they have today was built almost from scratch.

    Why do I think the Indy sports strategy was such a good one? Two reason: it was a good strategic area to go after, and it was backed up with very intelligent execution.

    First, five reasons this was a good strategic goal to pursue:

    1. It just fits the character of the city. Hoosiers love sports. The Indianapolis 500 and high school basketball were long established. It’s something they could behind in a way that they would never have gotten behind being the “vegetarian capital of the world” or something like there. It was authentic to the city. If you watch the video, you’ll note how locals embraced the events that were held that. That goes a long way towards explaining the success of the strategy. You have to be authentic to a place in your development efforts.
    2. It was a whitespace opportunity where Indy could get first mover advantage. Today every city thinks they can make money off sports, but Indy really pioneered the notion that you could use sports as an economic development tool. There were a lot of firsts along the path, and that’s one reason Indy was able to take out a leadership position. Just as one example, Indy was first to do the “build it and they will come” model of building a stadium before having a team. As a result, they were able to grab the Colts, and do it in an era when you didn’t have to mortgage your whole city to make a team relocation happen.
    3. Being America’s top city for sports events was a realistically achievable goal. I know this because the city achieved it. This is in great contrast to the umpteen cities who all claim they’ll be the “best cycling city in America” or some such.
    4. There were huge collateral benefits to sports beyond the direct economic impact of the events and the jobs they support. They bring people to the city to show it off to people who might not otherwise come. They enliven downtown and create events that locals might actually want to attend. They also have been an amazing brand opportunity. Just think of the Colts. How many times a week during football season does the word “Indianapolis” get said on TV? Probably hundreds if not thousands. Imagine if the city had to pay advertising dollars for that exposure? Yes, sports is expensive, but I think it could be justified just as cost-efficient marketing alone. Think about how much companies pay just to put their name on the stadium. How much more is it worth to put your city’s name on the team or the event? Think about how much advertisers will be paying for a 30 second commercial in the Super Bowl? What’s it worth for all those mentions of your city during the Super Bowl again?
    5. It was an initiative that had the possibility of being truly transformative for the city. Again, I know this is true because it was.

    I’m not going to claim these were actually the thoughts going through people’s minds as the sports strategy developed or that it was this calculated. But all of these things were implicitly true all along, and I think clearly the people pushing sports must have gotten it on that at some level. So sports meets the first test of a great strategy in that it set out after a good strategic goal.

    It was also something where there was a level of execution detail that far exceeded what most cities do. In business, it’s one thing to have an idea. It’s another thing to execute on it and achieve market leadership. It’s still another to generate sustainable competitive advantage that keeps you there over the long haul. Indianapolis has managed to do all of these with sports. I’ll highlight eight examples of how it did this:

    1. It invested in world class facilities. A lot of these have remained top rated even long after they opened, like Conseco Fieldhouse, which is still ranked every year as the best arena in the United States.
    2. Two, it laid out an entire district downtown around events hosting, with everything you need in close proximity – venues, the convention center, hotels, shopping, and entertainment. This is something that’s already been widely commented on by Super Bowl visitors who are amazed you don’t have to get shuttled around all over the place and that you can actually walk directly from the media hotel to the hotels where the teams are staying.
    3. Three, because of this Indy is able to effectively “saturation rebrand” downtown for an event and otherwise cater to events in a way that few other cities can or will. In effect, the city has converted its downtown into a giant sound stage. Take a look at the pictures of the city. The whole downtown as been rebranded after the Super Bowl, including, for example, plastering a huge Lombardi Trophy images on the side of the city’s premier hotel. You can debate the value of this to the city, but there’s no denying its value to the NFL. How many cities are willing to do this to the extent Indianapolis is?
    4. Indy created the Indiana Sports Corp. as the first ever non-profit management company for events. Today, everybody has adopted that model.
    5. The city cultivated a large, experienced volunteer base for putting on events that is much more powerful than what others cities have.
    6. Indy has been willing to take calculated risks in support of the strategy. Building the Hoosier Dome with no team to play in it – big risk.
    7. It not only went after the events, it went after the sanctioning bodies that determined where the events would be held. The most important is of course the NCAA, but there are others too. This has resulted in Indy having a “cluster” of these organizations and direct access to the people making decisions that pays incalculable dividends. This is one area where the “face to face” discussions that occur in Indy gives the city a big leg up. It’s not just better for selling, it gives Indy critical advanced intelligence about how these organizations are conceiving of their future events needs.
    8. Last but certainly not least, this has been a sustained, 35 year commitment. It wasn’t a party politics thing. It was a single project thing. It wasn’t a flash in the pan idea. It was something that has been relentlessly pursued over the long haul.

    Add all this up and it is easy to see why still today, three or four decades after it first started and after pretty much every city decided to go after these types of events, Indianapolis is still the best place in America to host a sports event.

    I hope this gives you a flavor why the Indy sports strategy was so good and so successful. It’s certainly something that’s not without its failures and downsides. The fact that sports has consumed disproportionate civic resources is one of them, and one highlighted by the documentary. But on the whole, most people seem very happy with the results.

    Something the video highlights at the end is one essential attribute for success that you can’t plan for or make happen – luck. They ask questions like, what if the “Save the Pacers” telethon had failed back in the 70’s? What if the seats in the Hoosier Dome had been the originally planned variegated colors instead of the Colts blue and white colors when Bob Irsay walked in to check it out? There were many critical turning points where without a lucky break, who knows if the future of downtown Indy might have been radically different in some way. It should give us some humility about the limits of our ability to simply will things into being. On the other hand, it reminds us that if you aren’t in the game, if you aren’t swinging the bat, you don’t have any chance at all of hitting that home run. You have to play if you want to win.

    This piece originally appeared at The Urbanophile.

    Aaron M. Renn is an independent writer on urban affairs based in the Midwest. His writings appear at The Urbanophile, and operates Telestrian, an online tool for economic and demographic data.

    Photo of Lucas Oil Stadium courtesy of BigStockPhoto.com.

  • How Libraries and Bookstores Became the New Community Centers

    Bookstores and libraries have long played a central role in fostering a deeper appreciation of knowledge, and in lifelong learning. Increasingly, these places are also filling another critical need in our communities, by providing a haven for those seeking a communal connection in an ever-more isolated world.

    Ray Oldenburg, author of The Great Good Place, coined the term “third place” to describe any environment outside of the home and the workplace (first and second places, respectively) where people gather for deeper interpersonal connection. Third places include, for example, places of worship, community centers, and even diners or pubs frequented by the “locals.”

    Third places, according to Oldenburg, are vitally important to the social fabric of communities because they facilitate the healthy exchange of ideas and provide a public venue for civil debate and community engagement.

    Libraries and bookstores clearly are long-time ‘third places’ That shouldn’t be a surprise, given that books serve as the lingua franca of new ideas. Notice, though, that these establishments frequently provide coffee bars, meeting rooms, Wi-Fi access, public computer terminals, and other amenities. They serve as accessible retreats for community groups and clubs, offices for transitioning job-seekers or home-based business owners, logical meeting places for children’s literacy organizations, havens for latchkey kids, and bases of operation for homeless men and women as they try to reintegrate into the community. These are the features, probably more so than the rows of books and racks of periodicals, which grant libraries and bookstores their ‘third places’ status.

    Libraries have been hit hard by the proliferation of home-based Internet access and digitized material. The impact is exacerbated by state and local budget cuts that place some libraries in a vicious downward spiral — reduced foot traffic from those with other options often is held out as “evidence” of library irrelevance, leading to more budget and staff cuts and further reduced access for those who need it.

    Large libraries in major urban centers are particularly vulnerable, with their cavernous buildings and row upon row of books that are rarely touched. If libraries are to survive, city leaders and library boards must continue to explore creative solutions for the changing needs of their patrons. As economists would put it, they must “drive demand” for expanded library services.

    A great example of success with this approach is the Martin Luther King, Jr. Library (www.sjlibrary.org) in San Jose, California. It purports to be the only institution of its kind: It serves as the primary library for both a major university and a major city. This joint partnership between the city of San Jose and San Jose State University was announced in 1997, and the primary building opened in 2003. It boasts over 7 floors and 1.6 million books. There are also dedicated rooms for quiet study sessions, teen activities and multimedia access. In effect, SJSU students have access to all the popular features of a typical public library, while the public has access to all the academic resources of a university library. The entire community is well served by this far-sighted collaboration.

    It represents the convergence that is taking place between the traditional role that libraries have long played and the virtual world. According to a study funded by the American Library Association in conjunction with the Bill and Melinda Gates Foundation, the number of U.S. libraries nationwide offering public Internet access has ballooned from under 13% in 1994 to nearly 100% today. What this suggests is that the role of libraries as technology hubs is increasingly supplanting their function as simply a repository of books.

    The use of community space in libraries to access technology is particularly vital for low-income residents and for individuals in small towns where the library may be the only connection point for free Wi-Fi access.

    Bookstores are confronting the dual challenge of staying both vital and profitable. The most successful brick and mortar bookstores have evolved into third places. Once just exclusively retail outlets, they now are quasi-library/community gathering spots with onsite coffee shops and free Wi-Fi access. While bookstores have always attracted those who wish to browse and kill time, they now also draw others, laden with backpacks, to research, write, and study. Bookstore-based reading groups abound.

    But even when a bookstore embraces its role as a third place institution, its viability is not guaranteed. The bankruptcy and closure of more than 600 outlets of Borders Books nationwide is evidence of a shakeout in the retail book industry, amid the proliferation of electronic book portals such as Amazon, Apple and Google. Independent bookstores especially have struggled to maintain their niche in the marketplace (although they may have more flexibility to quickly embrace third place-related amenities).

    The lesson in this case is that capitalism can be harsh. For example, Amazon’s controversial price comparison tool allows shoppers to scan bar codes to check prices at rival brick and mortar and online stores. But capitalism also encourages differentiation. As every good business owner knows, becoming a commodity dealer and competing only on price usually is a recipe for failure.

    Rather, libraries should be more like bookstores, creating an inviting, leisurely environment. Bookstores should be more like libraries, providing community rooms and programs.

    Both should think creatively about how to provide the things that online sellers cannot. That includes, of course, the pleasures of shelf browsing as opposed to web-based browsing. But beyond that, the most successful libraries and bookstores will embrace the opportunities for relevance that their special third place status enables.


    Michael Scott is a speaker and co-host of the Internet radio show Bookmark Radio. He can be reached at michael@bookmarkradio.com. Photo by the author of the Tattered Cover bookstore in Denver, Colorado.

  • Housing Affordability and Public Policy

    Nothing in the world today affects citizens more directly than the home in which they live.  And when it comes to housing no piece of recent research opens more interesting avenues of investigation than the Demographia International Housing Affordability Survey.

    Individuals and families across the economic and social spectrum all over the world are eager to gain as much control as they can over the place where they live.  They wish to make sure it cannot be taken away from them arbitrarily; they wish to control who has access to it and who can benefit from it; and, as much as possible, they wish to protect it against negative influences in the larger community around it.   

    This combination of goals sets up some inherent conflicts in every society.   What is good for a given individual or family is not necessarily good for a society as a whole, and what is good for society as a whole is not necessarily good for any given individual or family.  From this fundamental tension has sprung a bewildering set of arrangements for allocating and regulating land and residential structures on it.   At one end of the political spectrum have been societies in which land is owned in common and is supposed to be allocated to individuals and families on the basis of merit or need.  Such has been the case with many Utopian and Socialist societies.  At the other end of the spectrum have been societies where the individual ownership of land and homes is considered a bedrock condition of a democratic society, where ownership is widely dispersed, and individual rights and preferences have been zealously safeguarded from all but the most necessary intervention.   One of the best examples of this would have been the United States, Canada or Australia in the nineteenth century.  The trend over the last fifty years has been a convergence toward the middle of this spectrum as Socialist countries have abandoned the dream of complete common ownership and societies that traditionally were loath to interfere with individual property rights have adopted layer after layer of regulation intended to secure the health, safety and wellbeing of the larger society.

    Given the fundamental importance of housing in all societies, it is remarkable how little we know about the results of housing policies in various parts of the world.   In my own field of architectural and urban history, for example, if you were to ask even some of the greatest experts to compare what an average house or apartment unit in any two given cities looked like at some date in the past or even the present, what it would cost to buy and to operate them and what regulations would affect them, it is very unlikely that the individual would have more than rudimentary hunches.  Historians can tell you in great detail about the palaces, townhouses and country estates of the powerful and wealthy, then and now, and about some of the efforts at reform housing by the government or charitable organizations, but at least until recently, the lack of information about how and where ordinary individuals live has been remarkable. 

    Part of this neglect is due to a discredited but lingering attitude that history is made overwhelmingly by the rich and famous and not by the decisions of millions of ordinary citizens.  Part of it is simply that real estate ownership is now so dispersed and so intensely affected by local conditions that it is hard to quantify in ways that allow for comparative analysis.  Partly it has been due to a widespread belief that commerce and industry are the driving forces in the world economy and that housing is a by-product of the larger economy. This attitude is, of course, obviously wrong-headed, as the central role of residential real estate in the recent economic downturn has proved.  Residential real estate plays a huge and increasingly important role in the economy of every nation. 

    Given the obvious importance of housing, what should public policy be and the role of the individual, the developer, governmental agencies?  Is there an optimal size for cities, for housing units?  How much land should housing occupy?  Should housing be separated from or integrated with other uses?  Should government promote one kind of residential tenure over another, individual home ownership over rental or various kinds of collective ownership over individual property, for example?   Have the citizens of a given city or nation underinvested or overinvested in housing?  Are housing prices in line or out of line with individual and family incomes?   Unfortunately there has been very little data for anyone trying to find answers to questions like these. 

    It was against this backdrop that the appearance, in 2004, of the first international housing affordability survey by Wendell Cox and Hugh Pavletich was such a revelation.  It provided some of most reliable information ever compiled for those who wished to compare nations around the world with quite different housing policies.   Cox and Pavletich had their own point of view.  It is fair to say that both of them tend to favor market solutions to many of the most difficult questions about housing and how it is allocated and regulated, but their compilation of data, like the data found on Cox’s demographia.com website generally can stand on its own as one of the most impressive and reliable collections of comparative urban statistics to be found anywhere.

    The issue that appears to have been the principle motivation to compile this data was the rise of various forms of “Smart Growth” policies around the world.  Whether these policies were intended to enhance the environment or limit sprawl, they clearly had an effect on the price of housing, but what these effects were was very much in dispute.  In the United States, for example, the question of whether the growth boundary around Portland, Oregon, has had an effect in raising housing prices, as some observers claim, or that the dual focus on development at the center and regulation at the edge has kept housing prices reasonable, has raged for a number of years now.  The same debate has been joined in many other places, for example in Australia where the recent rise in prices has been particularly sharp and, given the vast extent of the country, the urban containment policies particularly contentious.

    Cox and Pavletich went out in search of the data they felt could answer questions of this kind.  Their conclusion, that the land use policies in places like coastal California, Vancouver, Britain and Australia, have dramatically driven up the cost of housing, and that the less intrusive policies of places like Atlanta and Houston has kept prices down has been controversial, but I think it is fair to say that a growing number of people who have looked at the figures have tended to agree that a good many well-meaning policies involving housing may be pushing up prices to such an extent that the negative side-effects are more harmful than the problems the policies were intended to correct.   These observers have also noted that measures that restrict land supply, slow growth in the immediate area where the policies are in place and push up housing prices can be very attractive to individuals who already own their own homes.

    In any case, the figures presented in this survey, like the collection of data on demographia.com more generally, are endlessly fascinating and very important.  They provide some basis for exploring issues that will figure importantly in discussions of housing policy for decades to come.

    Robert Bruegmann is professor emeritus of Art history, Architecture and Urban Planning at the University of Illinois at Chicago.
    ____

    Note: This article appeared as the Introduction of the 8th Annual Demographia International Housing Affordability Survey, released January 22, 2012

  • Britain Fears a Developer’s Charter

    The UK Government’s Department for Communities and Local Government (DCLG) announced that there were only 127,780 new housing completions last year in Britain. British house building activity is down to levels of after the First World War, when reliable industrial records began, and still falling. In 1921 the British population was nearly back up to 43 million following the slaughter of the First World War. In 2011 the population of England, Wales, and Scotland is approaching 61 million people. By 2031 the British population is expected to be closer to 70 million. With such existing unmet and growing demand for new housing the DCLG, the Government department that runs the Planning System should be busy finding ways to allow developers to build.

    Many feared that the National Planning Policy Framework (NPPF), prepared by the DCLG for an expected release in January 2012 would be a developer’s charter. We wish it was a developer’s charter! The NPPF continues planning policies, supported by all Parliamentary political parties, which continue to frustrate volume housebuilding. Developers have to prove that their proposals for house building are not merely about building useful homes at a profit, but are “sustainable development” when measured against disputable social and environmental criteria. No developer is free to build on their own land without first having to obtain planning approval from an array of third party interests all insisting on their interpretation of the moral idealism of sustainability.

    This makes the NPPF an anti-development charter for all those who oppose house building and population growth. Anyone can claim that more house building and more households are unsustainable in their area, in the effort to stop a project which they don’t approve of.

    The NPPF will do nothing to challenge the power of contemporary anti-development campaigners, who are well known. Anne Power, Lord Richard Rogers and other members of New Labour’s Urban Task Force (UTF) have correctly identified themselves as allied to the “Hands off Our Land” campaign run by The Daily Telegraph, the Conservative supporting newspaper.  The UTF favors a continuing commitment to ‘… reclaiming brownfield sites and re-densifying cities.’ To build only on previously developed land is the green ideal of the UTF and the “Hands off Our Land” campaign.

    We all know where these policies lead. Not to a golden age of regeneration for all, but to lucrative property investment for those with access to sufficient capital and the right connections to steer themselves through the planning system to obtain approvals. The volume of Greenfield land developed declined dramatically under New Labour. The present Conservative led Coalition Government continues the practice of obstructing development on Greenfield land.

    Between 2000 and 2006 the total area of land built on for new housing fell by 23%, with a 42% fall in the annual amount of Greenfield land used. In 2010 76% of all housing was built on previously developed Brownfield land, a slight decrease from the 80% in 2009. Only 2% of housing was built on the Green Belts around major cities and towns. The Green Belt in England covers 13% of the land, or twice the area already developed for housing. Small wonder that the price of the shrinking supply of land with a prospect of being approved for sustainable development remains inflated.

    House building was only increased from the low point of 2001 by increasing the density of development in the cities. Average densities rose from 25 dwellings per hectare (dph) in 2000, to 43 dph by 2010. In London the average density for new housing is much higher, at 115 dph in 2010.

    Densification policies considered sustainable have meant that the majority of the working British public can no longer buy a new house with a garden, in ways that previous generations may have taken for granted. Instead the plan has been to squeeze more new households into less space. UTF supporters and the DCLG imagined they were regenerating cities and saving the planet for all of society. Like traditional Conservatives they mean to keep developers and the population off Britain’s ample supply of otherwise redundant farmland.

    The Daily Telegraph’s campaign, best articulated by the conservative anti-growth philosopher Roger Scruton, is clearly the flip side of the UTF’s densification argument. He is happy as long as the population is kept away from the countryside he loves. ‘Thank God for obstacles to economic growth,’ says Scruton.

    Scruton speaks for the comfortable who already enjoy plenty of space. The Daily Telegraph’s campaign is ultimately concerned that existing housing markets are protected, sustained through the division between Town and Country, and moralised as a concern for environment and heritage. New Labour supporters are more likely to read The Guardian, but its more middle-class readership finds nothing to object to in The Daily Telegraph’s campaign, in order to restrict the “sprawl” of suburbia and halt the imagined damage this will do to the environment and urban communities. The Guardian’s readership formed the bed-rock of New Labour’s support, and back Next Labour. The working class may have deserted Labour, but is depoliticized and passive. The Guardian and The Daily Telegraph – still supposed by many to be at opposite ends of the old-fashioned and defunct ideological spectrum of Left and Right – prove closer than either cares to think.

    Labour Members of Parliament have traditionally feared the “flight to the suburbs” lest they lose voters and the associated tax revenue. The planning system has proved very effective in maintaining the political geography of Britain. Labour politicians negotiate their political dependency on urban containment with a Red-Green stance in urban areas, without threatening the Blue-Green interests of those who want to keep development out of the countryside. All depend on the denial of development rights that date from the 1947 Town and Country Planning Act, and which the NPPF reinforces.

    Meanwhile working class families are squeezed into what little Twentieth Century suburbia is still affordable, competing unsuccessfully with the more affluent for ownership of this increasingly scarce and valued commodity. What new housing is built is at higher density, usually on the least attractive sites. That is land previously occupied by factories, old infrastructure, and utilities, or by council housing estates re-developed at higher densities. Yet even these unpopular sites enter the inflated British housing market, sustained through a chronic lack of house building.

    The working class is caught in a political crusher made manifest through the planning system. The Red-Greens, who may imagine themselves on a new Left, gentrify towns and cities with “sustainable redevelopment”, and the Blue-Greens, who persist with being on the Right, protect their landscape for their exclusive enjoyment. Meanwhile the majority of home owners have come to depend on the inflated and unaffordable housing market. New Labour needed this house price inflation to allow the owner occupying majority to supplement inadequate wages by withdrawing equity from their homes. So does the Coalition. Deliberate or not, The Daily Telegraph’s commitment to building fewer new homes will stabilise what we have called the Housing Trilemma.

    Our current predicament may be thought of as a Trilemma, in which house price inflation supports burdensome mortgage lending and private debt, while households in the owner occupied sector accept low quality housing conditions. High rents shadow private sector housing costs, and private rental housing quality is often of the lowest quality. Many in Britain, including the majority of the home owning middle class, are dependent on the Housing Trilemma remaining stable.

    The planning system serves well in protecting the interests of existing home owners. Behind the NPPF’s moral idealism of sustainability, the immediate instrumental objective is to restrict new housing supply to avoid destabilising housing markets.  Appearing as a moral mission to save the planet from developers, the NPPF and the denial of development rights sustains the Housing Trilemma. Debt is secured, but housing remains unaffordable, quality low, and house building activity is at an all time industrial low. This is not a conspiracy. It is a predicament.

    When Britain’s elites talk about wanting to revive economic growth, they don’t mean a massive surge in new house building or an expansion of infrastructure. What they have in mind is a revival of financial services in The City, subject to uncertainties in the fragmenting Euro Zone, and the maintenance of high housing prices in the hope of more inflation to come. Meanwhile the countryside is kept pristine for the few who can afford access to it as a weekend retreat for the wealthy, including the pro-urban intelligentsia, in all their Red-Green-Blue moral plumage.

    The Coalition could have challenged the Housing Trilemma. Instead they have reinforced it.

    The result is predictable. Planning applications are falling in number and ambition. Only 25,000 new homes were approved in the second quarter of 2011 compared to 32,000 in the second quarter of 2010. This will be read by The Daily Telegraph campaign members as “proof” that there is no demand for development, inverting the causality. Money is being made out of an environmentally sanctioned scarcity rather than through increased productivity and innovation in a sector like house building and the wider construction industry. Britain’s already backward construction industry is further retarded, and it is becoming commonplace for social elites, and not only crazed nationalists, to blame immigration for housing shortages.

    Britain’s economy needs growth, but is unlikely to get it from the house building sector. Britain too needs a dose of political reality while the pro-urban intelligentsia preen their green morality.

    The Coalition cannot afford to confront the political problem of the Housing Trilemma if it is to sustain its fragile political base. Increasingly, only the elderly bother to vote and this equity rich group will be mostly satisfied with modest house price inflation as a hedge against general inflation, while savings in banks attract little return. Meanwhile an influential propertied elite still enjoys sustained house price inflation at the top of the market. They are anxious that environmental and heritage designations operate to enhance the exclusivity and enjoyment of their investments. The unelected charities, agencies and Non-Governmental Organisations that were aligned against the draft of the NPPF in July 2011 represent these elite interests. They may now back the redrafted 2012 NPPF with all its demands for sustainability. Their “Hands off Our Land” campaign has worked for them.

    The NPPF means that house builders face a future in which building on Greenfield land is effectively considered an eco-crime. Only those who can develop Town Centre sites, perhaps as rental housing, or as luxury homes for the equity rich will thrive. Basically Britain is no longer building homes with gardens for sale to young working families on modest incomes.

    If you are in a young working family, or hope to start one, the question is: What are you going to do about the housing predicament you and your friends face?

    We have to face a stark reality. Sadly, there is no contemporary habit of young working families organising to demand housing collectively. Meanwhile the 2011 to 2012 production figures look set to be lower again, and the developmental uncertainties about to be articulated in a redraft of the NPPF in pursuit of sustainable development will further the decline in production.

    Anticipating this feature of Britain’s ratcheting austerity does not make for a Happy New Year. Much depends on what the people of Britain, and particularly the young, do to demand that family houses are built at modest prices in places they want to live together. At present Britain fears a developer’s charter, even though the National Planning Policy Framework is nothing of the sort. Parliament might yet instead be in fear of people demanding cheap land on which to build a better place to live.

    James Stevens is Strategic Planner at the Home Builders Federation, www.hbf.co.uk. Email him at james.stevens@hbf.co.uk. The views expressed are his own and not those of Home Builders Federation. Ian Abley is a site architect and runs the pro-development website audacity, www.audacity.org. Email him at abley@audacity.org. Together they organise the 250 New Towns Club, www.audacity.org/250-New-Towns-index.htm.

  • Preserving the “Ideal of a Property Owning Democracy:” Annual Demographia International Housing Affordability Survey

    Demographia and Performanceurbanplanning.org  have just released the 8th Annual Demographia International Housing Affordability Survey, with an introduction by Professor Robert Bruegmann of the University of Illinois at Chicago and author of Sprawl: A Compact History. The Survey is unique in providing cross-national housing affordability comparisons using the median house price data from leading indexes in Australia, Canada, Hong Kong, Ireland, New Zealand, the United Kingdom and the United States.

    The Demographia International Housing Affordability Survey employs the “Median Multiple” (median house price divided by gross annual median household income, before taxes) to rate housing affordability (Table 1). The Median Multiple is widely used for evaluating urban markets, and has been recommended by the World Bank and the United Nations and is used by the Harvard University Joint Center on Housing.

    Table 1

    Demographia Housing Affordability Rating Categories

    Rating

    Median Multiple

    Affordable

    3.0 & Under

    Moderately Unaffordable

    3.1 to 4.0

    Seriously Unaffordable

    4.1 to 5.0

    Severely Unaffordable

    5.1 & Over

    Historically, the Median Multiple has been remarkably similar in Australia, Canada, Ireland, New Zealand, the United Kingdom and the United States, with median house prices having generally been from 2.0 to 3.0 times median household incomes (historical data has not been identified for Hong Kong). This affordability relationship continues in many housing markets of the United States and Canada. However, the Median Multiple has escalated sharply in the past decade in Australia, Ireland, New Zealand, and the United Kingdom and in some markets of Canada and the United States. There has also been a substantial loss in affordability in recent years in Hong Kong.

    Housing Affordability in 2011

    Housing affordability was little changed in 2011, with the most affordable markets being in the United States, Canada and Ireland. The United Kingdom, Australia, New Zealand and Hong Kong continue to experience pervasive unaffordability (Figure 1).

    The Survey covers325 metropolitan markets, including the 81 major markets with more than 1,000,000 population (Table and Chart Attached). There were 24 affordable major markets, 20 moderately unaffordable major markets, 13 seriously unaffordable major markets and 24 severely unaffordable major markets (Table 2). The severely unaffordable major markets were principally in the United Kingdom (8), the United States (6), and Australia (5). Hong Kong was severely unaffordable and there were three severely unaffordable major markets in Canada and one in New Zealand (Table 2). Australia had the highest major market Median Multiple outside Hong Kong (Figure 2).


    Table 2

    Housing Affordability Ratings by Nation: Major Markets (Over 1,000,000 Population)

     Nation

    Affordable (3.0 & Under) 

    Moderately Unaffordable (3.1-4.0)

    Seriously Unaffordable (4.1-5.0)

    Severely Unaffordable (5.1 & Over)

    Total

    National Median

     Australia

    0

    0

    0

    5

    5

    6.7

     Canada

    0

    3

    0

    3

    6

    4.5

     China (Hong Kong)

    0

    0

    0

    1

    1

    12.6

     Ireland

    0

    1

    0

    0

    1

    3.4

     New Zealand

    0

    0

    0

    1

    1

    6.4

     United Kingdom

    0

    0

    8

    8

    16

    5.0

     United States

    24

    16

    5

    6

    51

    3.1

     TOTAL

    24

    20

    13

    24

    81


    The most affordable major market was Detroit, with a Median Multiple of 1.4. This Median Multiple is artificially low, arising from the collapse of housing demand in the most severely depressed major market in the United States. There were another 22 affordable major markets, the most affordable of which were Atlanta, Phoenix, Rochester, Cincinnati, Cleveland and Las Vegas. The strong growth markets of Dallas-Fort Worth, Houston, Orlando, Jacksonville, Nashville, Oklahoma City, Sacramento and Indianapolis also achieved affordable ratings.

    All major markets in Australia and New Zealand, as well as Hong Kong were severely unaffordable.
    Hong Kong was the least affordable major market (ranked 81st), with a median multiple of 12.6. Vancouver was second most unaffordable, at 10.6 (ranked 80th). Sydney was the third most unaffordable, at 9.2 (ranked 79th).  Melbourne and Plymouth & Devon all had Median Multiples above 7.0.

    Among all 325 markets surveyed, there were 128 affordable markets, 117 in the United States, 9 in Canada and 2 in Ireland. There were 71 severely unaffordable markets, principally concentrated in Australia and the United Kingdom (Table 3). Honolulu and Bournemouth & Dorsett (8.7) were the least affordable outside the major markets.

    Table 3

    Housing Affordability Ratings by Nation: All Markets

     Nation

    Affordable (3.0 & Under) 

    Moderately Unaffordable (3.1-4.0)

    Seriously Unaffordable (4.1-5.0)

    Severely Unaffordable (5.1 & Over)

    Total

    National Median

     Australia

    0

    0

    7

    25

    32

    5.6

     Canada

    9

    19

    1

    6

    35

    3.5

     China (Hong Kong)

    0

    0

    0

    1

    1

    12.6

     Ireland

    2

    3

    0

    0

    5

    3.3

     New Zealand

    0

    0

    3

    5

    8

    5.2

     United Kingdom

    0

    1

    12

    20

    33

    5.1

     United States

    117

    64

    16

    14

    211

    3.0

     TOTAL

    128

    87

    39

    71

    325


    Preserving the "Ideal of a Property Owning Democracy"

    One of the principal accomplishments of high-income world societies has been the expansion of property ownership and home ownership to the majority of the population. At the same time, there are dark economic clouds on the horizon. Governments in high income nations are faced with some of the most challenging times in their history. In this environment, the property owning middle class is likely to face significant challenges in the longer run. Since housing is largest element in household budgets, unaffordable housing is a serious threat to the standard of living.

    At the same time, the economic evidence shows that more restrictive land use regulations, such as urban growth boundaries, have been an important factor in the deterioration of housing affordability. On this point, economist Anthony Downs of The Brookings Institution stressed the importance of maintaining the "principle of competitive land supply." The escalation of house prices relative to incomes, from Sydney and Vancouver to London and across California testify to the failure of planning to maintain that principle. The record shows that smart growth (urban consolidation and compact cities policies) is incompatible with housing affordability.

    But there are signs of hope. Florida repealed its growth management law ("smart growth") in 2011. Further, a recent New Zealand government report outlined the importance of a competitive land supply in restoring housing affordability to that nation.

    Four decades ago, urbanologist Peter Hall expressed concern about the threat of such policies to the "ideal of a property owning democracy." The Demographia International Housing Affordability Survey is dedicated to younger generations who have right to expect they will live as well or better than their parents. In large measure due to land use planning that has made housing unaffordable, they may not.

    Wendell Cox is a Visiting Professor, Conservatoire National des Arts et Metiers, Paris and the author of “War on the Dream: How Anti-Sprawl Policy Threatens the Quality of Life

    —-

    Note: The 8th Annual Demographia International Housing Affordability Survey is sponsored in Canada by the Frontier Centre for Public Policy.

    Photo: Suburban Montréal (by author)

  • Why Housing is So Expensive in Metropolitan Washington

    Anyone familiar with housing affordability in the Washington (DC-VA-MD-WV) metropolitan area is aware that prices have risen strongly relative to incomes in the last decade.

    However, a recent Washington Post commentary by Roger K. Lewis both exaggerates the contribution of higher construction costs and misses the principal factor that has driven up the price of housing: more restrictive land-use regulations.

    Lewis compares construction costs in the early 1970s to current costs and finds that they are approximately 6 times as high. However, when the R. S. Means construction cost index for locations in the metropolitan area are adjusted for inflation, the increase is more like 15% (1970 to 2007).

    Lewis also indicates that construction costs have risen faster than the "relatively flat income curve." In contrast, Census Bureau data indicate that median household incomes in the Washington metropolitan area have increased more than 30% since the early 1970s, after adjustment for inflation. House construction costs are the flatter of the two, not incomes.

    While Lewis’ focus is affordable housing, costs in this low income sector are impacted by many of the same factors that drive overall housing affordability (overall house prices relative to incomes).

    Lewis does not consider the huge cost increase in the non-construction costs of housing. In the Washington metropolitan area, we have estimated that the land and the regulatory costs for a new house have been driven to more than 5.5 times the level that would be expected in a normal regulatory environment (see the Demographia Residential Land & Regulation Cost Index). The problem is that the restrictive land-use policies, such as the Montgomery County agricultural reserve, similar regulations in other metropolitan area counties and the large lot building restrictions in Loudoun County have driven the price of land up substantially, and with it, the price of housing. We estimate that more restrictive land use regulations have driven the price of a new house up approximately $75,000.

    Not surprisingly, Washington’s Median Multiple (median house price divided by median household income) remains more than a third above the 3.0 historic norm, at 4.0, even after the burst of the housing bubble. So long as governments in the Washington, DC area continue to strictly ration land for development, higher than necessary costs will continue to plague both housing affordability and affordable housing.

  • Mistaking an Aberration for the End of Home Ownership

    It is well known that home ownership has declined in the United States from the peak of the housing bubble. According to Current Population Survey data, the national home ownership rate fell 2.9 percentage points from the peak of the bubble (4th quarter 2004) to the third quarter of 2011.

    It is less well understood, however, that the spurt in home ownership was, like the housing bubble, an aberration. Looking over the data from the 2010 census, it seems clear that since 2000 the actual decline was a much smaller: 0.8 percentage points from the 2000 census. In fact the current home ownership rate tracks fairly well with that of the post 1960 and the entire pre-bubble period.

    The End of Home Ownership? Analysts such as Richard Florida suggest an end to the preference for home ownership, citing the losses from the bubble, which were, in fact, an aberration. Most recently, Xavier University’s Michael F. Ford wrote in the Washington Postabout home ownership having been driven to 69% by "guarantees" and "tax breaks," such as the mortgage interest deduction. He notes that this "spending spree" led to a loss of $6 trillion in US real estate value.

    Ford does not mention the fact that home ownership had hovered between 60% and 65% for more than three decades before the bubble, without suffering any such losses. Nor does he mention the roles played by Fannie, Freddie and Frank (D-Massachusetts), along with others in Washington, or the related "drunken sailor" mortgage policies concocted by lenders and Wall Street that anyone familiar with credit should have known could only lead to disaster. This was obvious to many observers, although shockingly not to the Federal Reserve Board, as recent reports indicate .

    There is no doubt that the "spending spree" led to the housing bust and triggered the Great Financial Crisis. However it was not the long-standing ownership support programs of the federal government that were primarily to blame. As late as the beginning of the decade, there was no bubble and the median multiple in major metropolitan areas averaged 2.9, within the maximum affordability rating of 3.0. The "spending spree" itself was a rational response to policies that turned housing into the equivalent of a speculative commodities market, with destructive results, in certain large markets. Critically the bubble did not appear in many others.

    Speculation and the "Bubble States:" The extent to which speculation fueled house price increases is the subject of a recent Federal Reserve Bank of New York paper by Andrew Haughwout, Donghoon Lee, Joseph Tracy and Wilbert van der Klaauw. The researchers examine investment, or speculation in real estate markets, during the housing bubble. Investors buy houses that they do not intend to live in for the purpose of making money. In normal times, this investment is principally for rental income or long term capital gains. However, in the highly charged housing markets that developed in some metropolitan areas, prices rose so rapidly, that "flipping" (short term ownership) became very profitable, at least for some.

    Pointing out that "The recent financial crisis—the worst in eighty years—had its origins in the enormous increase and subsequent collapse in housing prices during the 2000s," the New York Fed researchers show that speculative activity was much greater in California, Florida, Arizona and Nevada (which they label the "bubble states") than elsewhere. My analysis indicates that two-thirds of the house value drop in the nation before the Lehman Brothers collapse (September 15, 2008) occurred in the four "bubble states." According to the researchers, this greater speculative activity in these markets made the market more instable because unlike owner-occupiers, investors are far more likely to default on mortgage loans.

    Missing the Geography of Speculation (the Geography of "Smart Growth"): The New York Fed research, however, ignores the geography of speculation. Why was speculation was so much more rampant in the bubble states? There is no reason to believe that residents of California, Florida, Arizona or Nevada are any less interested in making money or, in general, any more greedy. Yet speculators largely stayed out of markets in high demand areas, such as Dallas-Fort Worth, Houston and Indianapolis. In fact, in large parts of the nation, there was little speculative activity. In these markets prices were not rising inordinately so speculators did not bother with them. Instead they focused on more volatile markets where prices were already rising strongly, further swelling local price increases.

    The geography of speculation corresponds largely to the geography of excessive land use restrictions, which created the shortage of land for housing that drove the prices up in the four bubble states (Note). It is a fundamental principle of economics that prices tend to rise where desired goods are in short supply.

    In California and Florida, restrictive land use policies (smart growth or growth management) created a shortage of land for new housing relative to demand. The largest metropolitan areas of Nevada (Las Vegas) and Arizona (Phoenix) are surrounded by government owned land that was auctioned for development at such a slow rate that prices rose by more than five times during the bubble.

    Astonishingly, having missed the geography of speculation, the New York Fed researchers suggest that a solution is to regulate speculation. There is a much simpler answer, which Florida has already implemented which is to repeal the restrictive land use regulations, without which inordinately speculative profits cannot occur.

    Meanwhile, as the speculators have been driven out of the market, and despite federal government efforts to prop-up the artificially high house prices, values have fallen to below 2000 levels for the first time (Figure 1). Based upon Federal Reserve Board and Census Bureau data, it is estimated that the average owner-occupied house value in 2011 (three quarters) has fallen to $211,000, which is down from a peak of approximately $345,000 in 2006 and $222,000 in 2000 (adjusted for inflation).

    So is Ownership now doomed? Yet the home ownership naysayers have little to cheer. Yes, home ownership dropped in the last decade. However, all of the loss was in mobile homes and boats. Even so, the number of mobile home owners remained greater than home owners living in apartments, including condominiums (Figure 2). In fact there was a slight increase in the share of households owning their own homes, if mobile homes and boats are excluded (Figure 3), with a rise from 60.6% in 2000 to 60.9% in 2010.

    There were 5,057,000 more home owners in 2010 than in 2000, and perhaps more surprisingly, 5,119,000 more home owners occupying detached housing. Detached, attached (town house) and apartment ownership each increased over the past decade (Figure 4). Contrary to new urbanist theoreticians, detached housing – not urban condos – overall accounted for the most housing growth, both owner-occupied and rentals.

    Xavier’s Ford calls the American Dream of home ownership a myth and even goes so far as to suggest that home ownership is "more important to special interests than it is to most Americans." In fact, Ford’s interpretation is delusional. That home ownership continued its advance, however modestly, in the face of the worst economic downturn in 80 years, reveals the durability and, indeed the reality of home ownership as an American Dream.

    Photo:  Preventing speculation (New Development, Dallas-Fort Worth suburbs)

    Note: Overall, the bubble states and other restrictively regulated metropolitan areas accounted for more than 90% of the pre-Lehman Brothers loss.

    Wendell Cox is a Visiting Professor, Conservatoire National des Arts et Metiers, Paris and the author of “War on the Dream: How Anti-Sprawl Policy Threatens the Quality of Life

  • Three Cheers for Urban Sprawl

    “Hands off Our Land!” screams the Daily Telegraph, like some shotgun-toting red-faced farmer.  The newspaper, on behalf of the reactionary toffs who form the least pleasant section of its readership, has launched a campaign directed against ‘urban sprawl’ (ie. the rest of us).

    On a good day, the Telegraph serves up enlightened articles by progressive liberals like Janet Daley and Simon Heffer and Jeff Randal (I’m talking about real liberals here, not American Trotskyites).  But then it disappears under the desk, drinks some devilish, bubbling potion and emerges looking like Mr Hyde, all wonky teeth and messy hair.  “Hands off Our Land” is the Telegraph at its worst – a campaign to thwart the government’s all-too-modest suggestions to reform Britain’s vicious planning laws.  

    NIMBY (Not In My Back-Yard) is a misnomer.  As James Heartfield observes in his brilliant book Let’s Build! if it was their back-yard there wouldn’t be a problem.  By “Our Land”, the Telegraph’s Colonel Blimps do not mean “land owned by us”.  They mean “other people’s land”, over which they wish to continue to exercise control via the State. 

    The battle against suburbanisation (which the Greens these days clothe in the jargon of ‘sustainability’) has been going on for decades, and the success of the NIMBYs in keeping the bulk of Britain’s population locked inside towns and cities, has disfigured Britain and blighted the lives of millions of people.  As a result of State planning restrictions, Britons are stuffed into towns and cities like battery-farmed chickens.  We are among the most densely packed people in the world.  In Britain, 90 percent of people live in urban areas.  In Germany (which has a similar population density) only 75 percent of people live in urban areas, while only 68 percent of Italians live in urban areas, and only 62 percent of the Irish (is the Italian or Irish countryside so awful?).  In India only 30 percent of the people live in urban areas. 

    And to make matters much worse for the Brits, our urban areas constitute a mere 9 percent of total land use.  That’s right – 90 percent of the people crammed into 9 percent of Britain.  Compare that to the 13 percent of land devoted to ‘Green Belt’ (the stuff holding us in).  Even in the South East of England, by far the most densely crowded bit of the UK, woodland and farmland, absurdly, accounts for more than three quarters of land use. 

    Britain is not a crowded island – contrary to the frothing rants from the misanthropes at the Telegraph.  Viewers wrote in to express their incredulity when the BBC broadcast a series called ‘Britain from Above’.  The BBC helicopters filmed hour after hour of vast, unending tracts of flat, rectangular fields and giant swathes of green nothingness.  It was astonishing to the naïve urbanites watching to see how empty the place was.  (Just take a look on Google satellite images).  The reason why Britain feels, to most of us, like an overcrowded island, is because all most of us ever see are congested towns and cities (or a fleeting glimpse of industrial farmland out of a car window as we travel along ‘urban corridors’ between towns). 

    Hemming people into towns and cities with ‘Green Belts’, has acted like a pressure-cooker on property prices.  The planning system, by limiting the amount of land available to build on, has created an artificial shortage of living space, forcing up the prices of houses and flats to such astronomical heights that many young couples can only dream of affording one.  The less affluent dare not get a job for fear of losing housing benefit.  There are families in London where the children sleep three and four to a room – a tiny room in a dingy flat.  Children who have outgrown their cots are forced to stay in them, sleeping with their legs bent (I have direct knowledge of such cases).  It is impossible to document the sheer bloody misery caused by the planning system – countless examples of diminished lives.  Even well paid professional couples in London now struggle to afford dark, crumbling Victorian houses, in rough parts of town.  Houses built for costermongers and chimney sweeps in the late 19th Century.

    But it goes far beyond property prices. Soaring urban land values have a knock-on effect, raising the cost of everything, from cinema tickets to shoes.  The land and property shortage (artificially created remember) has pushed all prices up, reducing our quality of lives in a myriad of unseen ways.  Meanwhile, the few remaining patches of green in our towns and cities are fast shrinking and disappearing. Gardens are designated ‘brown-field’ sites to allow more flats and houses to be built.  Houses are horribly divided into tiny disfigured flats.  School fields, parks and squares are shrinking and disappearing at an alarming rate, extra blocks of flats spring up everywhere, like weeds in the cracks.  The shocking effect of Green Belts has been to empty our urban areas of green spaces, and yet, as State planners know fine well, these are the most cherished bits of green in Britain, giving far more people, far more pleasure than ‘the countryside’ (to which so few of us go).  Worryingly, the London Planning Advisory Committee has decided that London has room for 570,000 extra homes.  As James Heartfield pleads, ‘Do we really want every inch of London packed with houses, instead of parks, squares, playgrounds and other amenities?’  And of course transport in our congested urban areas has become a living hell.  They cram us in then prohibit us from parking anywhere and charge us for causing ‘congestion’.

    Nor is the misery confined to the towns. Green Belts have killed the countryside.  Although a gigantic amount of Britain’s land mass is reserved for agriculture, farming accounts for less than one percent of Britain’s economic activity (and even this is massively subsidised).  In the countryside itself, only 3 percent of people actually work in agriculture.  It is argued the countryside must be preserved in order to protect traditional communities and ways of life.  But there is nothing traditional about our countryside.  The vast, boring fields you see today bear no resemblance to the small, labour-intensive agriculture of old.  The landscape has changed, the ‘communities’ have changed, the economics has changed.  Nor should we idealise what went before … grovelling, impoverished tenant small-holders and agricultural labourers (and before them serfs) breaking their backs to maintain the idle gentry.   Life for the rural masses was poor, hard, dull and servile. 

    The NIMBYism of the new gentry (organised, for example, in the Council for the Protection of Rural England) has stunted and thwarted genuine economic development in the countryside.  The vast bulk of Britain is now a wasteland, a poorly attended heritage theme-park, fit for well-heeled second-homers to live out their naff rural fantasy every third weekend.  Ordinary folk in the countryside are reduced to working in National Trust postcard shops, and with their meagre wages, they struggle to afford small nasty-looking houses which face directly onto busy A-roads.  No wonder the young want to get the hell out. 

    But the battle over planning laws has nothing to do with the giant wide open spaces in Northumbria and wherever else, because no-one in their right mind wants to go and live there.   The land in dispute is in truth much smaller.  The desire for planning restrictions is really an expression of upper class disdain for suburbs, and the people who live in them and like them.  Peter Hall, the professor of planning at the Bartlett School of Architecture, in his book Cities of Tomorrow, exposes the motives behind ‘sustainable development’, which in effect means ‘pulling up the drawbridge to stop anyone else entering their well-healed enclaves (save a few select people like themselves, whom it would be quite fun to invite for drinks on Sundays) … pulling up the drawbridge against newcomers, especially if they lack the right income or right accent.’ 

    The snobbery and hatred of the suburbs dates back to the end of the 19th Century.  The railways allowed the first suburbs to flourish as the working and lower-middle-class ‘clerk’ class, experiencing prosperity for the first time, sought to escape the urban slums, to have a little house and a little garden.  The suburbs were considered vile because of the people who inhabited them. In a book called The Suburbans, written in 1905, the poet T.W.H. Crossland launched a vitriolic attack on the ‘low and inferior species’, the ‘soulless’ class of ‘clerks’ who were spreading into the new comfortable houses in the suburbs, eating tinned salmon.  He was disgusted by them, their aspiration to self improvement, offensively self-made and self-assured.

    Professor John Carey, in his magnificent book The Intellectuals and the Masses, describes the widespread upper class loathing of the newly enriched masses and their suburban ways.  In Evelyn Waugh’s Vile Bodies, two characters are leaving England in an airplane. They recall Shakespeare’s description of England, ‘This precious stone set in a silver sea’, but then they look out the window.  They see the ‘straggling’ suburbs, the hills sown with bungalows, the wireless masts and overhead power cables, and ‘men and women, indiscernible except as tiny spots’ who were ‘marrying and shopping and making money and having children.’  Then one of Waugh’s characters says, ‘I think I’m going to be sick.’

    HG Wells contemptuously describes suburbs as a ‘tumorous growth’ … ‘ignoble’ Croydon and ‘tragic’ West Ham.  Betjeman of course pleaded to the Nazis, ‘Come friendly bombs and land on Slough, it isn’t fit for humans now’.  The suburbs were “Bathed in the yellow vomit” of sodium lamps.  Carey describes Betjeman’s horror of the suburbs, ‘harbouring the mixed bag of atrocities with which Betjeman associates with progress – radios, cars, advertisements, labour-saving homes, peroxide blondes, crooked businessmen, litter, painted toenails and people who wear public-school ties to which they are not entitled.’

    The vile lower orders had to be stopped.  It is no accident that one of the key figures in post-war planning was Sir Patrick Abercrombie, founder and head of the Council for the Protection of Rural England.  Planners like Abercrombie knew that ordinary folk were itching to escape the grimy crowded towns.  But instead of the semi-detached houses with nice back gardens, which they craved, they would have to be stacked high in tower blocks.  The planners knew that it wasn’t what people wanted.  They knew that people wanted a little space of their own, with a little back lawn where they could keep an eye on their three-year old playing.  A fairly modest, basic human desire in this day and age, you might think, and yet one they would be deprived of.

    A system of Green Belts was devised to keep the proles locked in.  Professor Hall refers to Green Belts, correctly, as ‘the polite English version of apartheid’ … ‘a system of controlling and regulating the suburban tide to a degree that would have been unthinkable in the United States’.  The Town and Country Planning Act of 1947 effectively nationalised the right to develop land.  Hall describes how the containment of the lower orders in increasingly crowded urban areas, and the resulting inflation of land and property prices, led to distress on a vast scale.  Since land was so scarce and pricey, to build houses which people could actually afford, private builders were forced to build smaller and smaller homes, reducing the quality to make them less expensive.

    As the private housing market was strangled, it was decided that instead the State would build inner-city accommodation for the masses.  They were to be confined to urban areas, forced to live in high densities in high-rise blocks.  Rather than chose their own home in a free market, ordinary people had to apply to the State to be housed and would be allocated one (a very nasty State produced home).  By the 1970s around a third of the British population lived in State housing.  The State thus determined how and where we should live.  Over the years, it has become suffocating.  Green spaces inside towns have shrunk or disappeared as more and more nasty council blocks have been crammed in.  Early ‘leafy suburbs’ like Ealing have become more and more crowded and less and less leafy.  Now, they feel like part of the towns, only without the attractions of the bright lights.  In Britain, the dream of better living stopped in 1947.

    We have had enough of all this crap about ‘protecting the countryside’.  Planning (let us call it what it is: authoritarian State control of our lives) has always been primarily a tool of social prejudice.  Behind the cult of the British countryside, from Wordsworth and Ruskin onwards, has always been contempt for the masses.   Who are we protecting the ‘countryside’ for?   And from whom are we protecting it? 

    Let us be honest about ‘the countryside’.   These days it is largely made up of very big, very flat rectangular fields used for (largely pointless, subsidised) industrial farming … not at all beautiful and frankly the last place you would want to have a picnic. (Ironically most of the green rural fantasists in our midst tend to hang out in relatively crowded places like Southwold and Alderburgh (to enjoy the music festivals) and the ‘Wordsworth-country’ bit of the Lake District where Beatrix Potter lived.)

    Very few bits of the countryside look like it does in Postman Pat, and these bits are enjoyed by very few people indeed.   Let’s have more of them.  Wonderfully landscaped areas – big ones – not far from towns and suburbs, accessible to lots of people, with adjacent toilets and cafes and car-parks.  We do not want Green Belts, we want Green Patches – big parks and broad, lovely town squares, and large chunks of beautifully landscaped green spaces, close to where people live.  We want green everyone can enjoy.  And in between the green bits, we demand the freedom to build what we want, where we want. Three cheers for ‘Urban Sprawl’, the motor car, roads, supermarkets, golf courses and service stations.

    It’s time to get angry with the angry-brigade at the Telegraph.  To get angry with the organic, home-grown TV chefs and their agro-hobbyist friends, with the grungy middle class road protesters (imaging themselves to be radical), with the suburb-hating, supermarket-opposing, free-range chicken loving reactionaries, the metropolitan elite who can afford second-homes, yet who would deny first-homes to others, the heritage bores and bearded ramblers and people who drink cloudy expensive beer from local breweries and write bad guide books and erect plaques everywhere and think Ruskin had a point.  It’s time to get angry with Prince Charles – the Dark Lord, and his toady friend Richard Rogers, who thinks we should all live in shoe-boxes.  This collection of bigots are trying to keep us in our place.  They have damaged the lives of millions of people.  Now they must be stopped.

    Martin Durkin is a documentary film director and TV producer based in the UK.

    Photo from Bigstockphoto.com.