Category: planning

  • Urban Development: Playing Twister With The California Environmental Quality Act

    When it comes to environmental issues, emotions often trump reasoned argument or sensible reform, especially in California. In Sacramento at our state capitol, real world impacts are abstracted into barbed soundbites. It’s the dialogue of the deaf as environmental advocates rally around our landmark California Environmental Quality Act (CEQA) — and economic interests decry it as “a job killer.” Perhaps the polarization can be put aside to ask about a specific example in the real world. Why does an old K-Mart sit vacant on Ventura’s busiest boulevard despite initial City approval for a Walmart store? All the thunder and lightning surrounding whether a Walmart belongs in Ventura is behind us. A vigorous and contentious debate (and a failed citizen initiative) have rendered the verdict that filling an empty discount retail space with a different discount retailer is a function of the market, not government regulation.

    Nor can we directly blame the stalemate directly on the California Environmental Quality Act (CEQA). What keeps the store empty is not the controversial law itself, but the way it has been twisted like a pretzel into a tool to stop urban developments opposed by well-funded interests. Recently, the Los Angeles Times exposed the ironic way it has even been adapted by developers and big corporations to fend off their competition.

    The California Environmental Quality Act is the toughest state environmental protection statute in the nation. Passed more than 40 years ago in the wake of the first Earth Day (and signed by Governor Ronald Reagan), CEQA has spawned an industry of specialist consultants, attorneys and planners. Its original laudable goals for managing natural resources have been obscured by the hard ball tactics of litigators in our state.

    The vast majority of Californians support sensible environmental protections and are suspicious when business interests lobby to weaken them. They remember oil spills and toxic dumps and slash and burn hillside developments. Yet the case law that has grown up around CEQA is so burdensome that virtually any public or private project can be slowed or killed on bogus grounds that really have nothing whatever to do with protecting our natural environment.

    Yes, the law has protected stands of redwood trees from clear-cutting and sensitive habitat from suburban sprawl. And there are David and Goliath stories: a little band of neighbors stop a mega-developer from flooding their neighborhood with traffic (although this is a long stretch from protecting “natural resources”.) But it is now routine for special interests to hire high-powered law firms to exploit the law for their own economic interests.

    Here in Ventura, lawyers for construction unions combed over the Environmental Impact Report done for the new Community Memorial Hospital project with the goal of seizing on any technical errors or ambiguities. They fired off a thirty page “comment letter” which lays the groundwork for a lawsuit. The goal was certainly not “protecting the environment” — it was to pressure the hospital to use union labor for the construction. They were successful.

    The proposed Walmart at the old K-Mart site is stalled after initial city approval because the company knows that even something as simple as changing the facade on the building could trigger a lawsuit alleging inadequate “environmental review.” So the project sits in limbo while Walmart analyzes its legal options. What Walmart fears is exactly what happened to WinnCo grocery, which did see its proposed new signage and facade challenged by a CEQA lawsuit.

    There are lots of things not to like about development in a city. But that’s why we have planning commissions, public hearings and appeals to elected City Councils, along with detailed rules that must meet stringent legal guidelines for adoption and enforcement. But why have an elaborate land use entitlement and permit review process if it can be superseded by anyone with the resources to file a CEQA lawsuit? Democratic due process goes out the window, replaced by months or years of costly legal maneuvering.

    No sensible person advocates repealing CEQA. But after forty years, it is past time to return to its original, laudable purpose and intent: to protect our natural environment and sustainably manage our natural resources.

    Understandably, environmental advocates are skittish about tinkering with the law. There is precedent, however, for consensus reform. When the League of Conservation Voters pushed a bill to curb greenhouse gas emissions and promote sustainable regional planning, they won the support of both the League of California Cities and the Building Industry Association by incorporating a modest relaxation of onerous CEQA burdens on “infill development.” There’s lots more room for common sense consensus to separate environmental protection from a racket for special interest litigation.

    One of the worst ways to proceed is to pick out individual projects for favorable CEQA treatment. That’s what’s happened on a couple of controversial stadium projects that won legislative relief from the typical CEQA procedural hurdles. Having to lobby Sacramento to pass a special law is a brutally stark example of special interest litigation. Football stadiums are not the only or even the most important projects held hostage by CEQA abuse. Comprehensive reform is long overdue.

    In these economic times, the jobs lost to CEQA abuse aren’t offset by the ones created for CEQA experts and CEQA attorneys. California led the nation in protecting our state’s environment. If we can look past the symbolism that CEQA has assumed to both advocates and detractors, we’ll see that it’s urgent to restore the law’s original purpose and keep it from being hijacked for other agendas. That may be unlikely in today’s polarized political climate. That’s why it is crucial to bypass the soundbites and the symbolic posturing, and remember the real world fallout of failing to reform the way CEQA is administered in the Golden State.

    Rick Cole is city manager of Ventura, California, and recipient of the Municipal Management Association of Southern California’s Excellence in Government Award. He can be reached at RCole@ci.ventura.ca.us

    Photo: The vacant K-Mart in Ventura, California

  • The Driving Decline: Not a “Sea Change”

    The latest figures from the United States Department of Transportation indicate that driving volumes remain depressed. In the 12 months ended in September 2011, driving was 1.1 percent below the same  period five years ago. Since 2006, the year that employment peaked, driving has remained fairly steady, rising in two years (the peak was 2007) and falling in three years. At the same time, the population has grown by approximately four percent. As a result, the driving per household has fallen by approximately five percent.

    There are likely a number of reasons for the driving decline, some of which are described below.

    Democratization of Mobility: The leveling off of driving is something analysts have expected for some time. More than ten years ago, Alan Pisarski noted that drivers licenses and automobility had saturated the market among the While-non-Hispanic population. For decades, driving had been increasing at a substantially faster rate than the population, as driving rates for women and minorities converged  upon the rate of White-non-Hispanic males.

    Clearly, the continued, extraordinary increase in driving of recent decades could not be expected to continue, since nearly all were already driving. Pisarski called this the "democratization of mobility" in a 1999 paper. At that time only African-Americans and Hispanics were still behind the curve. The recent economic difficulties have slowed the progress toward equal automobility for minorities. In 2009, American Community Survey data indicates that the share of Hispanic households without access to a car remained 40 percent above White-non-Hispanic Whites. The rate of African-American no-car households was 20 percent above that of White-non-Hispanics. The driving decline reflects in large part the failure of the economy to produce equal mobility opportunities for minority households.

    Higher Gasoline Prices and the Middle Class Squeeze: One of the most important factors has to be the unprecedented increase in gasoline prices. Over the past decade, gasoline prices have doubled (adjusted for inflation) and have remained persistently high. It has worsened in the last five years, with prices having risen more rapidly than in any period relative to the previous decade in the 80 years for which there are records. This has taken a huge toll on households. At average driving rates, budgets have increased by nearly $1,800 annually to pay for the higher gasoline prices. In a time (2000-2010) that median household incomes declined $3,700 (inflation adjusted), it is not surprising that people are driving less.

    Unemployment: Not Driving to Work: Today’s higher unemployment means that fewer people are driving to work. Employment peaked in 2006. Assuming average work trip travel distances, the smaller number of people working now would reduce travel per household by more than one percent (one-fifth of the household reduction).

    Shopping Less Frequently due to Higher Gasoline Prices: According to the Nationwide Household and Transportation Survey (2009), the average household makes 468 shopping trips annually. If shopping trips were reduced by one quarter in response to higher gasoline prices, the reduction in travel per household would be enough, along with the work trip reductions, to account for all of the decline over the past five years.

    Information Technology: Not Driving and Telecommuting Instead: Again, advances in information technology appear to have also added to the decline. Even while employment was falling, working at home (mainly telecommuting) increased almost 10 percent between 2006 and 2010 (latest data available) and telecommuting added six times as many commuters as transit. Working at home eliminates the work trip and is thus the most sustainable mode of access to employment. In just four years, in working at home removed as much automobile travel to work as occurs every day in the Salt Lake City metropolitan area.

    More Information Technology: Not Driving and Texting Instead? Adie Tomer at the Brookings Institution notes a decline in the share of people 19 years and under who have drivers licenses as potentially contributing to the trend. She cites University of Michigan research by Michael Sivak and Brandon Schoettle, who documented the decline. Sivak told The Michigan Daily that "a major reason for the trend is the shift toward electronic communication among America’s youth, reducing the need for ‘actual contact among young people.’"

    Still More Information Technology: Not Driving and Shopping On-Line Instead? And, as with electronic communication and telecommuting, there is also an information technology angle to shopping. The substantial increase in on-line shopping could be reducing shopping trips.

    Not Making Intercity Trips? All of the loss in driving has been in rural areas, rather than urban areas. Since the employment peak in 2006, urban driving has increased 0.4 percent (though driving per household has decreased). By comparison, rural driving has declined 6.0 percent (Note). This much larger rural driving decline could be an indication that people have reduced discretionary travel, such as longer trips that extend beyond the fringes of urban areas (Figure). As with transit, however, it would be a mistake to characterize Amtrak as having attracted much of the reduced rural travel (or for that matter from airlines, see If Wishes were Iron Horses: Amtrak Gaining Airline Riders?). Over the period, Amtrak’s gain (passenger mile) has been approximately one percent of the rural loss.

    Not Driving and not Transferring to Transit: Transit ridership trends have been generally positive over the past decade. Since 2006, transit ridership has risen 3.4 percent. This compares to the 1.1 percent decline in automobile use. However, it would be incorrect to assume attraction to transit as contributing materially to the decline in driving. Because transit has such a small market, even this healthy increase has budged its urban market share (now approximately 1.7 percent) up by barely 0.5 percentage points.

    Besides scale, there is another reason transit has not been the beneficiary of the driving reduction. Automobile competitive transit service is simply not accessible for most trips. For example, it is estimated that less than four percent of metropolitan jobs can be reached in 30 minutes by transit for the average metropolitan area resident. This compares to the more than 65 percent of automobile commuters who do reach their jobs in 30 minutes or less. In short, transit is not an alternative to the car for the vast majority of urban trips.

    It does no good to suggest this can be materially improved by increasing transit service. The most lucrative transit markets are already served, and new ones would be more expensive. This is illustrated by the exorbitant cost of adding ridership. Over the most recent decade, transit ridership increased 21 percent, which required an expenditure increase of 59 percent, nearly three times as much.

    Decentralization of Jobs and Residences: The 2010 census indicated that the American households continue to decentralize, increasingly choosing to live in single-family detached houses in the suburbs. The same trend has been occurring in employment locations, as Brookings Institution research indicates. Between 1998 and 2006, less than one percent of new employment was located within three miles of urban cores. Nearly 70 percent of the new jobs decentralized to outer suburban rings.

    The continuing dispersion of jobs and residences could dampen the increase rate of driving in the years to come, as households have greater opportunities to live in the suburban surroundings they prefer, while also commuting to the more proximate jobs that have moved to the suburbs.

    The Decline in Context: Among the potential causes, certainly the most important is the economic situation,with steeply declining household incomes and the worst economic situation since the 1930s. The longer term driving trends will be more apparent when (and if) prosperity restores healthy growth in employment. Moreover, with only a small part of travel being attracted to transit, a more significant shift could involve substitution of access by information technology (on-line). Even with the decline, however, there has been nothing like a "sea change" in how the nation travels.

    Note: The data on driving is estimated from Federal Highway Administration (FHWA) reports. FHWA produces monthly preliminary estimates, which are subsequently adjusted in annual reports.

    Wendell Cox is a Visiting Professor, Conservatoire National des Arts et Metiers, Paris and the author of “War on the Dream: How Anti-Sprawl Policy Threatens the Quality of Life

    Photograph: Harbor Freeway, Los Angeles

  • Central Florida: On the Cusp of Recovery?

    Central Florida is poised at the cusp of a major turnaround, and its response to this condition will either propel the region forward, or drag it backward.  This cusp condition is brought about by a train and a road; neither of which have begun yet but both of which appear imminent.  Sunrail uses existing 19th century railroad tracks as a commuter spine through Orlando’s disperse, multipolar city.  The Wekiva Parkway completes a beltway around Orlando, placing it with Washington DC, Houston and other ringed cities.  Before either gets built, the region deserves some analysis on their combined effect, and how they can be nudged onto a pathway to make the region better.

    Sunrail brings with it mythology  about how trains affect cities.  In what has now become the standard, tired kabuki dance between developer interests and municipal ones.

    Not surprisingly, heavy regulation has entered the scene, with the avowed goal of creating dense urban pockets along even largely rural  train stops. This has sparked rising property values which may end up  frustrating the dream of transit-oriented development (TOD).  Affordable dwellings and meaningful employment within a half-mile of a train stop must be created in order to make this development work, but unless Central Florida can spark this, the new train will likely suffer from the same fate as the vast majority of its sunbelt counterparts:  low ridership and increasing tax subsidies.

    Inserting TOD into 17 locations in Central Florida is a bold experiment. In order for it to work, the rising costs of housing will need to be addressed, and Central Florida can take advantage of this ambition to succeed.  Orlando home sales are coming back, thanks to the mild climate and desirable lifestyle. That is very different, however, from guaranteeing that the economics of the rail commuter will make it worth discarding the single-family detached American Dream in favor of a relatively new model that has an unproven track record.

    Orlando also seems to be blithely going about the business of creating another ring of traffic around itself, descending into the same level where Atlanta’s Perimeter, the DC Beltway, and other like-kind roads live.  The Wekiva Parkway, long considered unneeded, is now being designed to complete the ring around Orlando, and will cross 25 miles of pristine wetlands that is a vestige of once-vast water resources of the region. 

    The Expressway Authority proposes this ring as an alternative to existing roads to serve the “growth needs of this area,” it conceded recently that this road segment made little economic sense except as a toll road accessing a new suburban single-family home development carved out of the swamps by one of the Governor’s chief fundraisers .  The asset value of this ring road may be more private than in the public interest.

    Traditionally agricultural land interlaced with wetlands, The Wekiva area to the northwest of Orlando has avoided large-scale Florida style bulldozing.  All this will change if the Governor is successful in eliminating water management regulations , freeing up much of Florida, including this corner of Orlando, for speculation.

    The local press, quick to criticize Alaska’s Bridge to Nowhere and always ready to jump on environmental issues, meekly ponders  the need for this $2 billion highway.  Maybe the elevated design, intended to be more ecologically friendly, makes it OK, despite the safety problems and high maintenance associated with this design.  Florida’s history is littered with the drawings of many other elevated highways eventually built on grade to save cost.  Once approved, the Wekiva Parkway may quickly be brought down to earth as well, displacing wetlands and agricultural land.

    The Wekiva Parkway will open up land supply which indeed will allow for more growth.  Done right, the asphalt will make land available that could be useful to the area’s economy.  It will bring traffic to historic, but presently lonely Sanford, potentially infusing the economy of this once-vibrant rail town.  Using principles of scarcity, land values could reflect people’s high desire to live in rural areas with all the services and guarantees that 21st century suburban life offers: fire and police protection, state-of-the-art infrastructure, and free pizza delivery.  It could invigorate neighboring towns that are currently struggling for survival.

    The risk is that such a road will simply allow more investment into Florida real estate without giving Florida much back in exchange.  Florida, already strained to meet its current population needs, should not simply trade another commercial strip for water resources that benefit many species and contribute to the region’s resilience. Rather, development models should emulate the best of America’s conservation development happening in states where water rights are scarce.  Connecting local employers with residential areas will enhance the value of both, and strategically keeping rural agricultural areas intact will preserve the region’s present land use diversity.

    Well managed development that conserves resources and balances broader needs with private interests will elevate the state’s prospects at this critical juncture.  One more bit of the original subtropical wilderness represents an asset for both present and future generations. With the right approach, the Wekiva Parkway can provide an enlightened model of low-density development that respects the value of open space.

    In town, Sunrail presents denser development as an alternative.  The normal pathway, however, seems to pit the profit-seeking real estate developer against ever higher regulatory burdens, which eventually make his product unaffordable to those coming here to escape high costs and regulations in other cities.  Keeping both employment and housing affordable are critical to achieving success with any of these projects.

    Moving product down the value chaindoes not do well current system, which leaves out the very people who Sunrail supposedly will benefit.  Density is one of those characteristics that seems to be about good timing: if you have it today, like San Francisco or New York, this is largely the result of history;  if you do not have it today, like Orlando, it is risky and probably a dubious proposition.

    The road and the train open up land that must be carefully stewarded to create opportunities for meaningful employment and affordable housing, both of which are presently scarce commodities.  The concept of transit-oriented development needs a success story, and Sunrail provides 17 opportunities to find one; meanwhile, the road presents a danger as well as an opportunity for Florida’s wetlands.  As the region slowly recovers from the recession, the two projects together should be carefully considered by the region’s citizens and leadership to truly redefine Central Florida’s identity for the 21st century.

    Richard Reep is an Architect and artist living in Winter Park, Florida. His practice has centered around hospitality-driven mixed use, and has contributed in various capacities to urban mixed-use projects, both nationally and internationally, for the last 25 years.

    Photo courtesy of BigStockPhoto.com.

  • California: Codes, Corruption And Consensus

    We Californians like collaboration. Before we do things here, we consult all of the “stakeholders.” We have hearings, studies, reviews, conferences, charrettes, neighborhood meetings, town halls, and who knows what else. Development in some California cities has become such a maze that some people make a fine living guiding developers through the process, helping them through the minefields and identifying the rings that need kissing.

    Here’s an example. This is a (partial?) list of the groups who will have a say on any proposed project in my city, Ventura:

    • City agencies (Planning, Engineering, Flood Control, Traffic, Building & Safety, Utilities, Police, Fire)
    • Historic Preservation Committee
    • Parks and Recreation Committee
    • Design Review Committee
    • Planning Commission
    • City Council
    • School District
    • Neighborhood and Community Councils
    • No-Growth Citizen Groups
    • Chamber of Commerce
    • Ventura Citizens for Hillside Preservation
    • California Department of Fish and Game
    • United States Department of Fish and Wildlife
    • Ventura County Local Agency Formation Committee (discretionary authority regarding annexations)
    • Los Angeles Regional Water Quality Control Board (new MS4 Stormwater Permit issues)
    • Ventura County Environmental Health
    • California Coastal Commission (for some projects within the Coastal Zone)
    • California Native American Heritage Commission and Designated Most Likely Descendant of local tribe
    • United States Army Corps of Engineers
    • Natural Resources Defense Council, Surfrider Foundation, Heal the Bay, other environmental groups
    • And all parties who have requested to be on notice, as well as the general public and other agencies, will be informed of any California Environmental Quality Act (CEQA) document.

    I didn’t pick Ventura because it is the most difficult. It’s not. I think Ventura is pretty typical for a coastal California city, actually.

    The result of having all these stakeholders is that, in many California communities, particularly those in coastal and upscale locations, everyone has a veto on everything. At the beginning of a project the developer faces a huge amount of uncertainty about what the project will look like once it gets past the gauntlet and about the cost of the development process. Add to that uncertainty about who will demand what, how long the approval process will take, market conditions and the regulatory environment when the project is completed, if it is completed.

    This is where the corruption connection comes in.

    In economics, we teach that there are two types of corruption, centralized and decentralized. Decentralized corruption is the more pernicious of the two.

    Think of a city where organized crime has a successful protection racket. This would be centralized corruption. The mob is going to collect from everyone, but it has an incentive not to collect too much. It doesn’t want to draw too much attention to itself or chase the business out of town.

    By contrast, decentralized corruption consists of a bunch of independent gangs, each trying to collect all they can before the next group of thugs comes along. Each gang of thugs will demand and collect too much, and chase the business out of town.

    Of course, if you want to develop a property in California no one will hold a gun to your head and demand money, and everyone is way too polite to call it extortion. Certainly, no group thinks of itself as a mob of corrupt gangsters. Instead, the members think of themselves as stakeholders, and they hold delays, lawsuits, or project denial to your head. The results are the same.

    First, you have to meet everyone, and everyone wants something in return for support, or for refraining from opposition. Groups will demand “mitigation fees,” delays, studies and more studies, and changes in the project. You will meet their demands, or you will be sued, or the project will be denied.

    Time spent on meetings, studies, and negotiations is expensive. The cost of the local “guide,” necessary to get through the local maze, is expensive. The “mitigation fees” are expensive. Delays are expensive. Studies are expensive. Changes in the project are expensive. Lawsuits are expensive. And risk is expensive.

    Eventually, the project is no longer profitable. No wonder California’s unemployment rate is 30 percent above the United States unemployment rate.

    The current climate provides California’s local governments with their best economic development opportunity: Eliminate the legal extortion by guaranteeing a project’s prompt approval if it meets existing general plans, specific plans, zoning, building codes, and adopted design criteria. Any community that did this would see immediate increased economic activity. To steal a phrase from a famous economist, it is the closest thing to a free lunch.

    A city does outreach before it develops its zoning and community design plans. It only adds to the cost of development to require builders to go through the entire process again, fighting the same battles, every time a project is proposed.

    The best thing about this idea is that it has been tried, and it works. The City of San Diego has seen an amazing-for-California energy since its redevelopment agency implemented such a plan several years ago. In the worst economy in 50 years, San Diego has been building and providing commercial and housing projects for all economic levels in its downtown area. It is time for the rest of California to get on with it.

    Bill Watkins is a professor at California Lutheran University and runs the Center for Economic Research and Forecasting, which can be found at clucerf.org

    Photo: Two Tree Hill, Ventura California by Joseph Liao (Chowee).

  • Durban, Reducing Emissions and the Dimensions of Sustainability

    The Durban climate change conference has come to an end, with the nations of the world approving the "Durban Platform," (Note 1) an agreement to agree later on binding greenhouse gas (GHG) reduction targets by 2020. The New York Times reported: "Observers and delegates said that the actions taken at the meeting, while sufficient to keep the negotiating process alive, would not have a significant impact on climate change."

    Not surprisingly, not all are pleased by the largely toothless agreement. Nnimmo Bassey, chair of Friends of the Earth international, told The Guardian:"Delaying real action till 2020 is a crime of global proportions." Todd Stern, the United States representative, signed on to the deal but noted that "there is plenty the US is not thrilled about."

    There is general agreement that any program to reduce GHG emissions must do so in the most efficient (least expensive) manner. The United Nations Intergovernmental Panel on Climate Change (IPCC) has concluded that sufficient emissions reductions can be achieved for between $20 and $50 per ton. Any cost above that must be considered wasteful and likely to reduce economic growth, while increasing poverty.

    Yet, researchers often leap from identifying a strategy to reduce GHG emissions to recommending its implementation, without ever examining the cost.

    Often  missed for instance, is that reductions in some sectors may prove less expensive than in others. The European Conference of Ministers of Transport has noted that "It is important to achieve the required emissions reductions at the lowest overall cost to avoid damaging welfare and economic growth." Across-the-board targets would misallocate resources, unnecessarily reducing economic growth and increasing poverty. This is particularly important in transport, because IPCC data indicates the potential for cost effectively reducing GHG emissions from this sector is considerably less than its contribution to emissions.

    GHG Emissions from Automobiles: In the United States and other high income nations, however, mandates are being pursued that would impose far higher costs. Our new report, published by the Reason Foundation, Reducing Greenhouse Gas Emissions from Automobiles reviews two general approaches. The first is behavioral approaches, the favorite of policymakers, that would force people to leave the suburbs to live in higher densities ("compact city" or "smart growth" policies) and discourage personal mobility. The second is facilitative approaches, which would reduce GHG emissions through technological advances, minimizing the necessity for command and control mandates over people’s lives.

    Behavioral Approaches: In what passes for the conventional wisdom, current thinking would require densification for virtually all new development, while trying to force people out of cars to travel by transit, bicycle or walking, all characterized as "sustainable" transport modes. Further, these strategies would seriously impede personal mobility by increasing travel times and reducing access to employment. This reduction in accessibility to jobs would be a backward step for any nation interesting in longer term economic growth (Note 2).

    The behavioral strategies are described in two principal US reports: Driving and the Built Environment which was produced by the National Research Council and Moving Cooler, by a consortium of organizations led by the Urban Land Institute and Cambridge Systematics. Each of these reports provides detailed estimates of the GHG emission reductions to be expected from land-use and mass transit strategies by 2050 in the United States.

    The reductions are relatively modest, averaging less than 5% from the early 2000s to 2050 .  Driving and the Built Environment indicates that the drafters did not agree its most aggressive scenario was achievable. Moving Cooler was soundly criticized by the American Association of State Highway and Transportation Officials and on these pages by leading transport consultant Alan E. Pisarski (see: ULI Moving Cooler Report: Greenhouse Gases, Exaggerations and Misdirections).

    These proscriptive policies focus on housing and land use even thought nearly all of the improvement in GHG emissions would result from automobile fuel economy improvements, not compact city policies. Depending upon the scenario, between 89% and 99% of the reduction in GHG emissions from cars by 2050 (Figure 1) would be the result of fuel economy improvements, rather than from compact city policies (based on comparison base year, early 2000s, fuel economy).

    Moreover, even the modest 1% to 11% reduction (5% average) in GHG emissions due to compact city policies are likely high because of greater traffic congestion, which neither report considers. Higher density urban areas, such as compact city policies would require, would spark greater traffic congestion. This means that cars travel slower and in more erratic traffic conditions. This, ironically, increases fuel consumption and GHG emissions per mile or kilometer. Thus, as noted here before, under these policies, GHG emissions from cars could actually increase.

    Neither Driving and the Built Environment nor Moving Cooler report considers the economic impact of compact city land rationing, which drives up housing prices and could thus be expected to impose higher costs on households. The economic literature is virtually unanimous in associating higher land and thus house prices with smart growth type land rationing policies. The increased costs could be many times the IPCC $20 to $50 per ton of GHG emissions removed.

    Even the popular assumption that suburban housing produces materially greater GHG emissions is questionable. Most US research fails to capture the common GHG emissions from elevators, heating, air conditioning, lighting, etc. in larger multi-unit housing, which are costs attributed to the building itself (landlord or condominium building) as opposed to  household energy bills (simply because there are no data). Yet, research in Australia indicates that common GHG emissions render higher density multifamily housing more GHG intensive than either townhouses or detached housing. Also escaping many researchers is the fact that carbon neutral housing is being developed, which could remove any GHG emissions differences between housing types.

    Compact city or smart growth policies have little potential to reduce GHG emissions and would do so at exorbitant costs that are well beyond those identified by the IPCC. This is not surprising, since compact city and smart growth policies have been widely touted long before the general concern over climate change. Denser cities have been pushed as a means to improve “community,” spur economic efficiency,   reduce air pollution and deal with such ephemeral – given recent massive energy finds – notions of “peak oil”.

    Facilitative Approaches: Any achievable program to reduce GHG emissions must be multi-dimensional and focus primarily on achieving that goal in the most economically and socially beneficial manner and not be based upon tired policies designed long ago to serve other agendas. There is no need for expensive and draconian compact city approaches. A report by McKinsey and the Conference Board concluded that substantial and cost effective GHG emission reductions were possible, “while maintaining comparable levels of consumer utility,” which was defined as “no change in thermostat settings or appliance use, no downsizing of vehicles, home or commercial space and traveling the same mileage.” In other words, there is no need to interfere with people’s lives or preferences (Note 3).

    The most promising approaches involve improvements in fuel economy. For example, Volkswagen has developed a two-seater car that achieves 235 miles per gallon (US) of gasoline or petrol (1 liter per 100 kilometers). With current fuel economy averaging little over 20 miles per gallon (12 liters per 100 kilometers) in the United States, the frontiers of fuel economy improvement have barely been approached.

    Moreover, substantial GHG emissions reductions can be achieved at levels far below 235 miles per gallon. The United States Department of Energy, Energy Information Administration (EIA) forecasts that even if driving increases 29% from 2005 to 2025, GHG emissions from cars would be reduced by 7% (Note 4). If, as is demonstrably possible, the EIA forecast fuel efficiency improvements were to continue to 2050, the reduction would be 19%, despite an increase in driving of more than 60%. At a slower driving growth rate more consistent with more recent trends, the reduction could be 33% (Figure 2).

    Further, if the US light vehicle fleet (cars and sport utility vehicles) were to achieve the current fuel economy performance of the best hybrid vehicles, the reduction in GHG emissions would be between 55% and 64% by 2050. Matching European performance forecasts would reduce GHG emissions even more.

    A substantial increase in the fastest growing sector of commuting, working at home (often telecommuting), could also help. Nothing can cut emissions more thoroughly than working at home, which produces zero GHG emissions. Yet, this innovation – which already surpasses transit use in most American metropolitan areas – inexplicably receives little or no attention from planners intent on herding people into higher densities and travel modes that take longer.

    The great advantage of facilitative approaches is that, as the McKinsey-Conference Board report indicates, people are permitted to live their lives as they prefer even as emissions are reduced.

    The Dimensions of Sustainability: Perhaps the greatest problem with behavioral approaches is that they may not be sustainable at all. Sustainability is multi-dimensional. Compact city and smart growth policies lack financial sustainability because they spend far too much per ton of GHG emissions. They lack economic sustainability because they would impose substantially higher costs, especially on housing prices. Ultimately, unless humans radically change their demonstrated preferences, compact city and smart growth policies may not be politically sustainable because people are likely to resist them either at the ballot box, or by moving – as demonstrated in the latest census – even further out from the urban core or to smaller, less regulated and less dense regions. All three dimensions of sustainability, financial, economic and political, must be prerequisites to material GHG emissions reductions.

    Notes:

    (1) Reuters provides an early summary of the Durban Platform.

    (2) The strong connection between economic growth and minimizing urban travel times is identified in research such as by Prud’homme and Lee at the University of Paris and Hartgen and Fields at the University of North Carolina, Charlotte.

    (3) The McKinsey-Conference Board report was co-sponsored by Shell, National Grid, DTE Energy and Honeywell, as well as environmental advocacy organizations, the Environmental Defense Fund, the Natural Resources Defense Council (NRDC),

    (4) Proponents of compact city policies sometimes claim that fuel efficiency improvements cannot reduce GHG emissions because the increase in driving neutralizes their impact. EIA projections indicate otherwise, as is shown here.

    Wendell Cox is a Visiting Professor, Conservatoire National des Arts et Metiers, Paris and the author of “War on the Dream: How Anti-Sprawl Policy Threatens the Quality of Life

    Photograph from BigStockPhoto.com

  • Tilting at (Transit) Windmills in Nashville

    As in other major metropolitan areas in the United States, Nashville public officials are concerned about traffic congestion and the time it takes to get around. There is good reason for this, given the research that demonstrates the strong association between improved economic productivity and shorter travel times to work. As Prudhomme and Lee at the University of Paris and Hartgen and Fields at the University of North Carolina Charlotte have shown, metropolitan areas tend to produce more jobs where employees are able to access a larger share of the jobs in 30 minutes.

    Ahead in Identifying the Problem: Moreover, Nashville officials are somewhat "ahead of the curve," since traffic congestion is far less severe there than in many other metropolitan areas. Among the 100 largest metropolitan areas in the United States, Nashville ranks 39th in the intensity of its traffic congestion, according to data compiled by INRIX, a traffic information firm. Nashville’s traffic congestion is even better compared to large Western European metropolitan areas .

    This favorable traffic situation is despite the fact that Nashville has among the lowest overall transit market shares in the United States or Western Europe (less than 0.5 percent of travel in the metropolitan area). The key to this success, like that of other American metropolitan areas in relation to their international peers is low density and decentralization of employment and other commercial locations.

    Missing the Point on Solutions: Yet, it is clear from an editorial in the Nashville Ledger that officials are inclined to embark on an expensive program of transit expansion. Judging from past experience, this   offers virtually no hope for reducing traffic congestion or for improving economic productivity in the Nashville metropolitan area.

    There are significant misperceptions among local officials about the potential outcomes of proposed commuter rail and bus rapid transit lanes. Perhaps the most important is the assumption that commuter rail and bus rapid transit will reduce travel times. In fact, at the national level, commuting by transit takes approximately twice as long as commuting by single occupant automobile, according to the Census Bureau’s American Community Survey for 2008 to 2010. Rail systems, such as subways (metros) and light rail do little better than transit in general, taking 95% longer than driving alone and two thirds longer than travel by car pools. There is thus virtually no hope that building new transit lines will reduce travel times.

    As often happens when costly new transportation programs are proposed, boosters often resort to erroneous information. The Nashville Ledger cites sources that indicate, for example, that suburban Franklin (in Williamson County, to the south of the Nashville-Davidson County core) has one of the longest work trip travel times in the nation. The reality is quite different. Franklin has an average work trip travel time (23.2 minutes), which is less than national average (25.3 minutes) and little more than Nashville-Davidson County (23.0 minutes).

    Nashville officials need look no further than their own eastern suburbs for evidence of the inability of new rail systems to reduce work trip travel times. In 2006, Nashville began commuter rail service from Lebanon, in Wilson County to downtown Nashville (the Music City Star). Currently, the Music City Star is locked in an intensive (and successful, according to the latest data) competition for last place in the number of riders among the nation’s commuter rail systems, just edging out Austin’s new lightly used system. Despite being the only first ring county with commuter rail service, Wilson County work trip travel times are longer than in the other first ring counties. Door-to-door travel times, which are the only travel times that count, have not been reduced by the rail line.

    Transit is About Downtown: Transit cannot be a comprehensive metropolitan transportation solution remotely competitive with automobile travel times, except to downtown. This is because the quicker, direct transit services from throughout the metropolitan area that are necessary to attract automobile drivers must focus on the most dense and largest employment center, which is downtown. The radial routes that may be capable of serving downtown effectively simply cannot be afforded for other areas of employment. Our research has indicated, the annual cost to provide automobile competitive transit service throughout an urban area in the United States would consume a huge share of the gross domestic product of any such area.

    In Nashville, downtown represents little more than 10% of the metropolitan area employment. Moreover, downtown Nashville represents a declining share of private sector employment in the metropolitan area. According to the Census Bureau’s County Business Patterns, the core Nashville ZIP codes that are served by shuttle buses from the commuter rail station lost 11% of their private sector jobs between 2000 and 2009 (latest data available). At the same time, private sector employment grew 4% in the balance of the Nashville metropolitan area (Note 1).

    Transit to Suburban Destinations: A Non-Starter: There have been proposals to require new suburban office development to be near transit stops. This would accomplish little, because transit access in areas other than downtown is so sparse. Among major metropolitan areas, nearly 65% of major metropolitan area workers are within walking distance of a transit stop, according to research by the Brookings Institution. But being near a transit stop does not mean that transit provides practical mobility to anything like 65% of jobs. The reality, according to the Brookings Institution data,  is that only 6% of jobs in the average metropolitan area of more than 1 million population can be reached by transit  by the average resident  in 45 minutes, a travel time nearly double that of the average commuter in the Nashville metropolitan area (Note 2). It seems likely that 30 minute transit access for commuters would be as low as 3% at the national level. This demonstrates the so frequently repeated fallacy equating access to a transit stop with usable access to the metropolitan area.

    Transit’s Large Downtown Niche Market: There is no question about the effectiveness (though not the cost efficiency) of transit in providing mobility along the most congested corridors to the nation’s largest downtown areas. This transit niche market accounts for nearly 75% of commuting to the Manhattan business core south of 59th Street, and more than 40% to the downtown areas of Brooklyn, Chicago, San Francisco, Boston and Philadelphia. Yet even in these metropolitan areas, where transit mobility is so important to downtown, transit work trip market shares to areas outside downtown are more akin to the national average of 5% (Figure), except in New York.

    Of course, Nashville’s downtown is not among these large transit-oriented cores. In 2000, census data indicated that 4% of employees commuted to downtown by transit. Even if all of the ridership on the Music City Star is made up of new downtown transit commuters, that figure would be little changed.

    The Need for Stewardship: Before Nashville commits hundreds of millions or billions of tax dollars to expensive transit projects transit in hopes of reducing traffic congestion or travel times, local officials should consider reality. Reducing traffic congestion and travel times are objectives generally beyond transit’s capability. Further, new lines can attract only a small share of commuters, because such a small share of jobs are downtown.

    —-

    Note 1: County Business Patterns provides employment information that largely excludes government employment. According to Bureau of Labor Statistics data, 53 percent of metropolitan Nashville’s increase in employment was government jobs between 2000 and 2009.

    Note 2: Calculated from Brookings Institution data.

    Photograph: Downtown Nashville from BigStockPhoto.com

    Wendell Cox is a Visiting Professor, Conservatoire National des Arts et Metiers, Paris and the author of “War on the Dream: How Anti-Sprawl Policy Threatens the Quality of Life

  • Is Suburbia Doomed? Not So Fast.

    This past weekend the New York Times devoted two big op-eds to the decline of the suburb. In one, new urban theorist Chris Leinberger said that Americans were increasingly abandoning “fringe suburbs” for dense, transit-oriented urban areas. In the other, UC Berkeley professor Louise Mozingo called for the demise of the “suburban office building” and the adoption of policies that will drive jobs away from the fringe and back to the urban core.

    Perhaps no theology more grips the nation’s mainstream media — and the planning community — more than the notion of inevitable suburban decline. The Obama administration’s housing secretary, Shaun Donavan, recently claimed, “We’ve reached the limits of suburban development: People are beginning to vote with their feet and come back to the central cities.”

    Yet repeating a mantra incessantly does not make it true. Indeed, any analysis of the 2010 U.S. Census would make perfectly clear that rather than heading for density, Americans are voting with their feet in the opposite direction: toward the outer sections of the metropolis and to smaller, less dense cities. During the 2000s, the Census shows, just 8.6% of the population growth in metropolitan areas with more than 1 million people took place in the core cities; the rest took place in the suburbs. That 8.6% represents a decline from the 1990s, when the figure was 15.4%.

    Nor are Americans abandoning their basic attraction for single-family dwellings or automobile commuting. Over the past decade, single-family houses grew far more than either multifamily or attached homes, accounting for nearly 80% of all the new households in the 51 largest cities. And — contrary to the image of suburban desolation — detached housing retains a significantly lower vacancy rate than the multi-unit sector, which has also suffered a higher growth in vacancies even the crash.

    Similarly, notes demographer Wendell Cox, despite a 45% boost in gas prices, the country gained almost 8 million lone auto commuters in the past 10 years. Transit ridership, while up slightly, is still stuck at the 1990 figure of 5%, while the number of home commuters grew roughly six times as quickly.

    In the past decade, suburbia extended its reach, even around the greatest, densest and most celebrated cities. New York grew faster than most older cities, with 29% of its growth taking place in five boroughs, but that’s still a lot lower than the 46% of growth they accounted for in the 1990s. In Chicago, the suburban trend was even greater. The outer suburbs and exurbs gained over a half million people while the inner suburbs stagnated and the urban core, the Windy City, lost some 200, 000 people.

    Rather than flee to density, the Census showed a population shift from more dense to less dense places. The top ten population gainers among metropolitan areas — growing by 20%, twice the national average, or more — are the low-density Las Vegas, Raleigh, Austin, Charlotte, Riverside–San Bernardino, Orlando, Phoenix, Houston, San Antonio and Atlanta. By contrast, many of the densest metropolitan areas — including San Francisco, Los Angeles, Philadelphia, Boston and New York — grew at rates half the national average or less.

    It turns out that while urban land owners, planners and pundits love density, people for the most part continue to prefer space, if they can afford it. No amount of spinmeistering can change that basic fact, at least according to trends of past decade.

    But what about the future? Some more reasoned new urbanists, like Leinberger, hope that the market will change the dynamic and spur the long-awaited shift into dense, more urban cores.

    Density fans point to the very real high foreclosure rates in some peripheral communities such as those that surround Los Angeles or Las Vegas. Yet these areas also have been hard-hit by recession — in large part they consist of aspiring, working class people who bought late in the cycle. Yet, after every recession in the past, often after being written off for dead, areas like Riverside-San Bernardino, Calif., have tended to recover with the economy.

    Less friendly to the meme of density’s manifest destiny has been a simultaneous meltdown in the urban condo market. Massive reductions in condo prices of as much as 50% or more have particularly hurt the areas around Miami, Portland, Chicago and Atlanta. There are open holes, empty storefronts, and abandoned projects in downtowns across the country that, if laid flat, would appear as desperate as the foreclosure ravaged fringe areas.

    In many other cases, the prices never dropped because the owners gave up selling condos and started renting them, often to a far lower demographic (such as students) than the much anticipated “down-shifting” boomers. Contrary to one of the most oft-cited urban legends by Leinberger and his cohorts, demographics do not necessarily favor density. Most empty-nesters and retirees, notes former Del Webb Vice President of Development Peter Verdoon, prefer not just outer suburbs but increasingly “small towns and rural areas” Dense cities, he notes, are a relatively rare choice for those seeking a new locale for their golden years.

    Verdoon’s assertion is borne out by our own analysis of the 2010 Census. Generally speaking, aging boomers tended to move out of dense urban cores, and to a lesser extent, even the suburbs. If they moved anywhere, they were headed further out in metropolis towards the more rural area. Among cities the biggest beneficiaries have been low-density cities in the Southwest and southern locales such as Charlotte, Raleigh and Austin.

    What about the other big demographic, the millennials? Like previous generations of urbanists, the current crop mistake a totally understandable interest in cities among post-adolescents. Yet when the research firm Frank Magid asked millennials what made up their “ideal” locale, a strong plurality opted for suburbs — far more than was the case in earlier generations.

    Generational analysts Morley Winograd and Mike Hais note that older millennials — those now entering their 30s — are as interested in homeownership as previous generations. This works strongly in favor of suburbs since they tend to be more affordable and, for the most part, offer safer streets, better parks and schools.

    In the short run, suburbia’s future, like that of much of real estate market, depends on the economy. But even here trends may be different than the density lobby suggests. As housing prices fall, the much ballyhooed trend toward a “rentership” society may weaken. Already in many markets such as Atlanta, Las Vegas and Minneapolis and Phoenix it is cheaper to own than rent, something that favors lower-density suburban neighborhoods.

    Longer term, of course, suburbs, even on the fringe, will change as growth restarts. Cities here and around the world tend to expand outward, and over time the definition of the fringe changes. To be sure, some fringe communities, particularly in highly regulated and economically regressive areas, could indeed disappear; but many others, particularly in the faster growing parts of the country, will reboot themselves.

    They will become, as the inner suburbs already have, more diverse with many working at home or taking shorter trips to their place of work They will become less bedrooms of the core city but more self-contained and “village like,” with shopping streets and cultural amenities near what will still be a landscape dominated primarily by single-family houses.

    In fact the media reports about the “death” of fringe suburbs seem to be more a matter of wishful thinking than fact. If the new urbanists want to do something useful, they might apply themselves by helping these peripheral places of aspiration evolve successfully. That’s far more constructive than endlessly insisting on — or trying to legislate — their inevitable demise.

    This piece first appeared at Forbes.com.

    Joel Kotkin is executive editor of NewGeography.com and is a distinguished presidential fellow in urban futures at Chapman University, and an adjunct fellow of the Legatum Institute in London. He is author of The City: A Global History. His newest book is The Next Hundred Million: America in 2050, released in February, 2010.

    Photo courtesy of BigStockPhoto.com.

  • Will You Still House Me When I’m 64?

    In the song by the Beatles, the worry was about being fed and needed at 64. Things have changed. If the Beatles wrote those lyrics today, the worry instead might be about housing.

    Australia’s aging population is an inevitability. As our replacement rate falls (we’re having fewer children per family) and life expectancy extends, the proportion of over 65s will double in 40 years. In raw numbers, there were 2.5 million over 65s in 2002, and this will rise by 6.2 million in 2042. That’s an extra 4 million in this demographic. Have we given enough thought to where they’re going to live, and what styles of housing they might prefer?

    There have been a number of developers who have understood the looming significance of Australia’s aging population, and who have sought to supply the ‘retirement living’ market with product that suits. At one end have been the glitzy apartment style residences in inner city locations, while at the other have been the aged care ‘homes’ provided for those in need of access to nursing care or medical assistance, or at least the reassurance of it being present.

    Running parallel with the provision of retirement living or seniors living projects has been an assumption that, once ready to abandon the family home of many years, seniors will be happy to move across town and relocate to the facilities that are available. Perhaps this is hangover from the days when retirement or aged care living was provided on Stalinist lines: our oldies were forcibly shuffled off to some retirement centre well away from the rest of the community they grew up in. A sort of gulag for grumpies?

    But what if seniors simply want a change of housing style within their community? What if they don’t want to move across town to the only available accommodation because they would prefer to continue to live in the neighbourhood and community they have spent a large part of their lives living in? They may want to continue to shop with ‘their’ local butcher, visit their local supermarket, newsagent, bank branch (if it still exists) and generally remain connected to the people and places that they’re familiar with – including (quite possibly) members of their family, children and grandchildren.

    Meeting that need in the future is going to be close to impossible unless planning schemes (old fashioned zoning laws) adopt a more flexible approach. Flexibility will be needed because most of the existing suburbs of our major population centres are largely built out and will require retrofits and redevelopment of existing stock to accommodate senior’s housing preferences. Generally, the only tracts of undeveloped land capable of meeting seniors housing needs tend to be on the outskirts and while there’s nothing wrong with fringe development, it seems unfair to expect seniors to relocate across town to regions they’re unfamiliar with and to alienate themselves from their community simply because supply side mechanisms (controlled by planning schemes) don’t permit choice.

    Further, the built out status of our ‘established’ suburbs – as they now stand – is something that much planning law seems to want to preserve for time immemorial. It’s a little bit like imagining that someone has declared the existing housing mix and styles a fixture of permanency: let’s put a giant glass dome over it all and call the city a museum – because we don’t (it seems) want anything to change.

    But if we are to allow Australia’s seniors to ‘age in place’ and to ensure our markets provide choice, it’s going to mean some things will need to change, given the likely levels of future demand. The fastest growth of aging populations will be around our ‘middle ring’ suburbs and given the overwhelming preference to ‘age in place’, it is these suburbs that are going to have to change if those needs are to be met.

    What will that change look like? The psychology of seniors in years to come – even today – is going to be different to those of previous generations. They’ll likely be more active rather than sedentary. The family home that’s served them to this point may now be simply too big for their needs, or contain too many stairs (the artificial hip or knee doesn’t like too many stairs). Their future housing needs will vary widely – some will be happy with apartments in high to medium density developments (elevators to their level of living means no stairs) while others (generally the majority) will prefer smaller, detached or semi-detached, single level dwellings. Many may want a small yard or garden (or at least a large balcony or terrace if in a unit), and perhaps want to keep a small pet dog or cat. They may want a spare bedroom for visitors or for babysitting grandchildren. They will probably prefer to be close to shops and near to public transport. And the majority will want to find something of that nature generally within the same community they’ve been living in. It is unlikely they’ll be searching for the ‘retirement home’ style of assisted care living until they’re well into their later years when their choices will be more limited.

    Their problem will be that developers will struggle under current planning schemes to get approval for semi-detached housing designed with seniors in mind, if it means amalgamating some detached residential dwellings near local shops, because that land use is highly protected. They will struggle to gain approval to convert a large single site into medium or high rise in areas near local shops or transport, because the community will likely object – particularly if it’s in a neighbourhood where low density prevails (typical of most of suburban Brisbane). Advocates of Transit Oriented Development (TOD) style development might now be shouting at this article that ‘TODs are the answer.’ That might be so, if only one single TOD had been delivered during the past 15 years we’ve been talking about them.

    Plus, the majority of proposed ‘TOD’ style development areas largely surround inner city transport nodes. Not much use if you’re in Aspley and want to stay there. And of course there’s the reality that multi level apartments are much more costly to develop and construct than the cottage building industry’s approach to single level, small detached housing.

    The changes needed need not be dramatic, and subtle changes to land use surrounding existing retail or service centres in middle ring suburbs ought to be able to be achieved with minimal planning fuss. It is still possible to imagine something being done with minimal planning fuss, but very difficult to point to any actual examples. Still, hope springs eternal.

    The changes could allow (for example) for some amalgamations of larger lot, detached post war homes into higher density cottage-style dwellings on a group title, still single level and with low construction costs. A 2000 square metre amalgamation could in theory provide 10 such cottages, with private garden space and minimal likelihood of community objection. The key would be to keep regulatory costs down, so punitive development levies would be out of order. After all, the infrastructure already exists and seniors tend to be much less demanding on utilities or services than young households. (Have a think about how little garbage they generate, or how little water they use as an illustration. It would surely be unfair to tax seniors in this type of housing for infrastructure upgrades under the circumstances?).

    The traditional ‘retirement home’ or ‘aged care’ model of seniors housing is still going to be needed, especially as people require more frequent or acute care in their later years, and become less and less independent. But there will be a good 10 to 15 year period for people for whom the family home no longer suits, and who aren’t yet ready for ‘God’s waiting room.’ How we accommodate this coming bubble of seniors who want to age in place and continue to live independently, and how planning schemes will allow markets to provide choice and diversity, is something that perhaps should be a policy focus now.

    Ross Elliott has more than 20 years experience in property and public policy. His past roles have included stints in urban economics, national and state roles with the Property Council, and in destination marketing. He has written extensively on a range of public policy issues centering around urban issues, and continues to maintain his recreational interest in public policy through ongoing contributions such as this or via his monthly blog The Pulse.

    Photo by BigStockPhoto.com

  • Social Market Housing for the USA: Dream or Nightmare?

    Imagine a future America where the home ownership rate climbs from the current 65%1 to 87%2.  Libertarians as well as many social democrats would be cheering.  Imagine that this rate was achieved by the state itself acting as the builder of 88%3 of the housing.  Imagine also that the state imposes rules on home purchases to favor first time buyers and young families. “Progressives”, increasingly tilted towards the unmarried and childless, would bristile.  Imagine racial diversity rules that restrict who you can sell your home to. Time for libertarians to shudder.   

    Most Americans would probably say such a concept is “Utopian” but serious policy makers should reflect that the word “Utopia” literally means “nowhere”. But Social Market Housing is alive and well in Singapore. 

    For Americans living in the hottest real estate markets, the USA is very far from the ideal of a Property Owning Democracy.  At the time of the 2010 census three of New York City’s five boroughs had home ownership rates under 30% and in the Bronx it was under 20%4.   Though many US politicians support the concept of home ownership it has been declining since 1980 when it reached a peak of 68%5

    How have the Singaporeans achieved such high ownership rates despite having the richest economy in South East Asia?  Many factors come into play.  Singapore has an aggressive building program achieved through a public body – the Housing Development Board (HDB).   HDB apartments can only be sold to Singapore citizens and those with permanent resident status, so their prices cannot be inflated by foreign speculators. 

    The HDB also has eminent domain powers to claim land if it needs to.  Singapore’s version of social security is not inter-generational (unlike the USA where the current generation of workers pays for the last generation of retirees) but rather an elaborate system of forced saving by both workers and their employers.  Part of the compulsory savings can be used for a deposit on an HDB flat. Finally there is an elaborate system of price discounts on new HDB flats which is not only designed to favor first time buyers, but also young families and newlyweds. 

    There is even a category of ‘Executive Homes’ to retain managers in Singapore.  These may be larger apartments or semi-detached homes with gardens. 
    There is no problem with runaway maintenance fees.  HDB owners do not pay associations dues.  Their elevators are maintained through local real estate taxes so monthly costs are very predictable.  In the year 2010 the average Singaporean household paid $145 USD a month in property tax6
    .  This is less than the $216 average USD American Condo owners paid in condo fees at the time of the 2000 census.

    Some Americans might argue that this can only work because Asians are conformist and are culturally more receptive to rule-based systems.  I do find that South East Asians are reluctant to draw attention to themselves in public.  When I talk in a Starbucks with my normal New York speaking voice I sometimes look up and find myself orating to a group of open-mouthed onlookers (“I’m so sorry it’s the Tourette’s Syndrome – my shrink keeps forgetting to up my dosage.”)

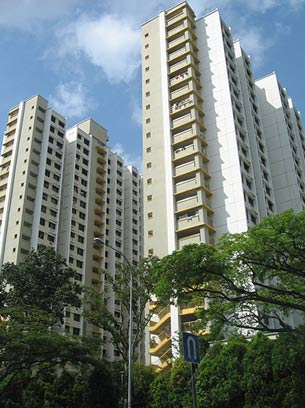
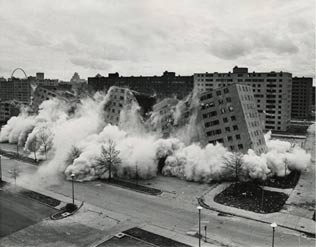
    Many US politicians recoil against the state as a real estate developer largely because tenanted housing projects have been such a magnet for social problems.  The St. Louis public housing scheme, Pruitt-Igoe, was eventually dynamited (see photo right7).  The author of “The Death and Life of Great American Cities”, Jane Jacobs, famously complained that the public housing projects took some mixed income neighborhoods which could have been viable and sealed their doom by concentrating too many low income and unemployed people in the same buildings. 

    Singapore’s HDB does act as a direct landlord for a very small number of people who meet a strict income ceiling (about $1160 USD a month8), however the low income tenants are spread thinly among owner occupiers. Income ghettoization is limited. My realtor tells me that one of the blocks in my own HDB estate is for tenants rather than owners but from the outside I cannot tell which building it is.  Another form of deliberate social mixing takes the form of racial quotas intended to prevent the formation of ethnic enclaves.  If the percentage of people in a given racial group has already met the national quota you can be blocked from selling or renting to a person in that category. Access to the more attractive and less attractive neighborhoods is thus shared out more equally.  This looks like a policy American cities should consider given that the 14th amendment, busing and affirmative action have yet to produce full integration. 

    One aspect of America’s public housing projects that particularly angered Jane Jacobs was the wholesale removal of small retailers.   In theory “The Projects” could have included small commercial spaces at the ground floor but generally public rental buildings in most of the US are considered to be danger zones where retailers fear to tread. 

    Typically the ground floor of HDB buildings is a void space where retailers can create businesses. Often they are left empty but sometimes the policy works well.  Near Singapore’s Clementi MRT train station many dozens of “mom and pop” stores are now sheltering under the HDB apartments; late night street life is vibrant.  When I ask Singaporeans to name a neighborhood that would be dangerous to go at night, nobody can think of one.  The country’s homicide rate would pose an absolute disaster for TV script writers.  You could not have a CSI series or Law and Order because Singapore would not be able to supply the requirement of one murder per week.  The homicide rate is currently about one tenth of the USA’s9.

    If she were alive today Jacobs might also criticize the HDB apartment blocks for excessive architectural uniformity.  She loved communities to have buildings with different age profiles.  But most of Singapore’s buildings are so new the option of preserving the old simply does not exist. Greater architectural variety is an attractive goal.  One Singaporean architect commented that they will really have the styles right with you can build an HDB block next to a private condominium and you cannot tell which is which (a sort of urban planning version of the Turing Test).  Local architects are point to a new HDB building, the Pinnacle at Duxton, as an example of a new look more comparable with private designs (pictured right).

    But would greater variety cause costs to escalate?  Observing new HDB construction it is possible to discern a very advanced form of modular building; entire concrete rooms are hoisted into the air at the end of a crane.  Certainly a wider range of designs could be achieved using the same building blocks.  Kids can make a huge variety of things with Lego.  The same cuboids could also make homes with gardens which are America’s preferred form of housing— a gift of an expansiveness impossible to achieve, except in dreams or by immigration, in Singapore.

    Is Social Market Housing a good model for the USA? Certainly there would be many objections but the ideal of home ownership is too often an American Dream that disappears into a distant future. Are we doing enough to create a Commonwealth with “Liberty and Justice for All?” When they say the Pledge of Allegiance we force or children to use the words “Indivisible” and “One Nation”.  Are we enough to make those words a reality?

    Philip Truscott is a Senior Lecturer at Singapore University of Technology and Design
    Notes:

    Lead photo of HDB flats courtesy of BigStockPhoto.com. Other photo image files from  http://commons.wikimedia.org

    ———————————

     1 US Census Bureau, (2011), “Housing Characteristics: 2010”, Washington DC: Bureau of the Census. Accessed on 19/11/2011 from http://www.census.gov/prod/cen2010/briefs/c2010br-07.pdf

    2 SINGSTAT, (2011), “Statistics Singapore: Key Annual Indicators”, Singapore: Department of Statistics. Accessed on 19/11/2011 from <http://www.singstat.gov.sg/stats/keyind.html#hhld>.

    3 SINGSTAT, (2008), “Key Indicators of Residential Households”, Singapore: Department of Statistics, Accessed on 19/11/2011 from <http://www.singstat.gov.sg/stats/themes/people/hhldindicators.pdf>.

    4 US Census Bureau, (2011), “Housing Characteristics: 2010”, Washington DC: Bureau of the Census. Accessed on 19/11/2011 from <http://www.census.gov/prod/cen2010/briefs/c2010br-07.pdf>

    5 This is based on a cross-tabulation of the variables “ownership” and “year” from the IPUMS online data analysis system at this URL http://sda.usa.ipums.org/cgi-bin/sdaweb/hsda?harcsda+1850-2009

    6 Singapore Gross Property Tax Revenue from SINGSTAT, “Public Finance” at http://www.singstat.gov.sg/pubn/reference/yos11/statsT-publicfinance.pdf  The number of resident households has been taken from the Census of Population 2010 at <http://www.singstat.gov.sg/pubn/popn/c2010sr2/t20-25.pdf>

    7 Photo public domain: http://commons.wikimedia.org/wiki/File:Pruitt-Igoe-collapses.jpg

    8 HDB, (2011), “Homes for All”, Singapore: Housing Development Board.  Accessed on 19/11/2011 from < http://www.hdb.gov.sg/fi10/fi10221p.nsf/Attachment/AR0405/$file/home5_frameset.html>.

    9 UNODC, (2011), “Homicide level for 2010, or latest available year”, Vienna: UN Office on Drugs and Crime, accessed on 17/11/2011 from < www.unodc.org/documents/data-and-analysis/statistics/Homicide/Homicide_level.xlsx >.

  • Is Industrial Strife a Sign of Housing Stress?

    Industrial disputes – including a spate of on and off again strikes at national carrier Qantas – are becoming once again a frequent feature of the Australian media. Unions are pushing for wage rises in the face of the falling buying power of the fixed wage (as costs of living rise). Those wage push pressures are being resisted by businesses trying to stay afloat in a very ordinary domestic economy and amidst rising global competition.  

    But instead of a conflict between labor and business, perhaps we may consider   lower living costs as a solution which benefits both? Fundamentally, this boils down to addressing our biggest cost burden: housing. 

    The rapid escalation of housing costs have occurred under the aegis of Labor dominated state governments. Whether in Queensland, New South Wales or Victoria – Australia’s three largest states – their imposition of artificial growth boundaries that limited land supply, the introduction of upfront taxes on new development, and ever more complex planning and development regulation have driven housing prices to unsustainable levels.

    This is ironic since the worst impacts of those policies have been most felt by the very working class constituency which Labor traditionally sought to represent. Having presided over and championed policy mechanisms which have driven up housing costs for workers, these same governments then resist attempts to recover that standard of living through wage growth.

    Now before you think I’ve gone all Marxian militant on you all (trust me, I haven’t), here’s an example of what I’m driving at.

    Much has been said about housing affordability and what it will mean to lock an entire generation out of the housing market.   Recently this story documents yet another report attesting to falling home ownership and the rise of a renting class.   Particularly hard hit are the people who are trying to buy a first home in which to raise a family. They could typically be around their mid to late 20s, biologically in their prime for having and raising children. At this stage of life, you are probably below the average income for your career or profession so the reality of the affordability problem is most acute.

    In Queensland, this might be a teacher in their mid 20s, with two or three years of training, married to a constable who together earn after tax income around $87,500 per annum. (This combined income would be much less of course if, for example, one of our young couple was a child care or retail worker).

    Now, take a modest new family home in an outer suburb like North Lakes or Springfield. Let’s assume they’ve saved a small deposit, and with a loan of $400,000, they buy something for around $450,000. That’s hardly McMansion territory. But that loan, over 30 years at 7.8%, will cost them close to $35,000 per annum in repayments, or 40% of their combined after tax incomes.

    This, of course, is before they even think about children, and the prospect (despite generous maternity and paternity pay and leave provisions) of enduring a significant household income reduction while one of them isn’t working. Even on returning to work, there would then be child care fees, which quickly erode their pre-child household budget.

    Buying a home and starting a family have become a huge financial consideration, instead of a fairly normal and unremarkable pattern of generational and social growth. And it is now absolutely dependent on a dual income family, with both of them preferably good incomes.

    This is a profound change over the last decade. As a result, fewer people are buying homes, people are postponing children (until they can afford them) and when they do, they’re having fewer children. A countless stream of statistical and demographic reports are now underlining this change on an all too frequent basis. Although some greens may celebrate it, this is very bad news long-term for the economy, for society and the community as a whole. 

    So is it any wonder we’re seeing wage push pressures?

    Consider the cost of the $450,000 modest home they’ve bought. Within that price is roughly a $50,000 up-front ‘developer levy’ (better called a new home buyer tax). There’s probably a similar cost of in inflated land costs, brought on by artificial land supply constraints in a country of abundant land. There would also be a raft of minor additional building costs introduced under the guise of ‘green’ or ‘sustainable’ building guidelines, in order   ‘to prevent the sea from rising’. Plus there’s a hard-to-quantify compliance cost because getting the approval to develop the land for new homes now takes 10 years instead of a few months, engaging teams of town planners, lawyers, and other hangers on.

    The total cost of all of these additions to the price paid by our young couple could easily be well over $100,000. If you don’t believe me, check out this old report which I commissioned some years ago.

    A quick bit of math’s now follows. That extra $100,000 (conservatively) has been funded via our young couple’s mortgage. That’s an extra hundred large they’ve borrowed, to cover the costs of additional taxes, fees and compliance introduced under the watch of a State Labor Government. That $100,000 is worth an extra $8,640 per annum out of their pockets. If their repayments fell by that amount, their mortgage costs would be around $26,000 per annum in total, or just under 30% of their combined household income – not 40% of it.

    There you have it. At 30% of household income, not only the home becomes more affordable, but so do children. But at 40%, it’s proving to be touch and go.

    There are two ways, simply put, to improve the cost of living equation faced by younger workers on largely fixed incomes. You can increase their wages (which the unions want and which businesses and governments resist), or you can reduce their costs of living.

    This has somehow eluded people working in state treasuries and planning departments. I haven’t even commented on the insanity of the carbon tax, which is only going to exacerbate basic costs for energy further and likely weaken Australian exports.

    The simple economics of what we’re talking about was summed up beautifully over 160 years ago, in Charles Dickens’ novel David Copperfield, when Mr Micawber lectured the young Copperfield on the perils of exceeding budgets:

    "Annual income twenty pounds, annual expenditure nineteen nineteen six, result happiness. Annual income twenty pounds, annual expenditure twenty pounds ought and six, result misery."

    Mr Micawber, you’ll note, wasn’t implying the need for more income, he was highlighting the important role played by expenses.

    In the Australia (and Queensland) of 2011, the same still applies. Rather than push for more income, unions could do better to lobby their Labor Parties to reduce their living costs. Reducing the housing infrastructure levies, relaxing the rigidity and ideology of urban growth boundaries, reducing compliance costs, cutting green taxes would drive down the costs of housing.   

    In this era of globalization, fighting pitched industrial battles with employers for a few extra dollars a week in income seems futile compared to pressuring   governments over the induced inflation associated with the providing a family home you can afford and raise a new generation of Australians.

    Ross Elliott has more than 20 years experience in property and public policy. His past roles have included stints in urban economics, national and state roles with the Property Council, and in destination marketing. He has written extensively on a range of public policy issues centering around urban issues, and continues to maintain his recreational interest in public policy through ongoing contributions such as this or via his monthly blog The Pulse.

    Photo courtesy of BigStockPhoto.com.