Category: planning

  • Detroit: A Century On The Smart-Growth Grid

    The following excerpts are from a report that was intended to solve many of the planning issues facing one of America’s largest cities: Detroit. Its conclusions are in many ways counter to the ‘Smart Growth’ principles being promoted by influential decision makers. It was compiled by the city’s highest level planners and engineers:

    “One disadvantage under which Detroit is working is the extremely mixed character of its building – fifty thousand dollar houses, warehouses, saloons, institutions, slums, factories of all sorts, inexpensive dwellings, great apartment houses, and huge billboards follow one another almost in the same block, to the great detriment of practically all classes of occupancy. A zone system, if established, would bring order out of this chaos; and it would so stabilize the character of neighborhoods as to greatly increase land values. Though such control may at present be impossible, much may be done to assist in establishing zones or districts confined to one type of use, such as residential, industrial, and the like.”

    This suggests that the ‘Smart Growth’ goals of mixed uses and mixed incomes may not be so ‘smart’.

    Of course, those who believe in intermixing all sorts of uses and incomes on the same block refer to cities where, a century ago, such a mix was normal, and suggest that the isolation of modern transitional zoning is a far worse option.

    As we read further:

    “In this report, stress will be laid on the less expensive residential development, for which… if the street and lot system is not well adapted to it, there will result serious and at the time wholly unnecessary waste and expense. Moreover, the added cost in land and improvements is apt to cause a deduction in the cost of the building which will lower the standard of living in an entire district.”

    In other words, this report is referring to the importance in lower income residential development to create the most efficient form of streets and infrastructure. This would free up funds that would have otherwise been used for wasteful design to be applied to housing. The results of reducing wasteful construction would enhance living standards, instead of lowering them. The authors of this report understood the importance of efficiency, and how it relates to the welfare of residents outside the gentrified sections of the city. The report goes onto recognize one of the most important financial aspects of development:

    The house should normally represent three fourths of the cost; the improvements, such as sewers, sidewalks, etc. about an eighth; and the raw land an eighth.

    Why is this so critical? Before the current housing market crash and the resulting depletion of American bank accounts, home builders traditionally stood by this model. But after the dot-com bubble, where investors put their money into vapor-ware only to see their investments disappear, the new favorite investment became land and buildings. In many areas of the country developers and national home builders went on a bidding spree, hiking raw land prices into the stratosphere. In the past, the financial rule was that a completed lot could not exceed 1/4th the total home price. The ‘rule’ was now broken, ignored or modified. Financial institutions also turned their heads away. Had the real estate market continued to hold fast to the above formula that served history so well, there may not have been a housing crash.

    The report questions another aspect of ‘smart growth’, too:

    “No Alleys. Alleys are unnecessary and wasteful of room, except where dwellings are in continuous rows or in groups of three or more. For detached and semi-detached cottages the space between adjacent houses necessary for light and air is sufficient also for a walk from the street to the back door.”

    While alleys are fodder for heated discussions from many sides of the planning field, clearly this city’s planners do not like them, yet this particular city is full of alley-laden blocks. Those that blame poor planning on the automobile embrace alleys as a way to hide cars in the rear yards. What this actually does is literally surround the home with pavement and vehicle use-areas. Instead of reducing the connection between home and automobile, it increases the connection. The authors clearly recognize this, and go on to promote common gardens and play areas in the rear yards instead.

    The report is very specific about street design. It suggests that the streets be sized for the traffic count, rather than creating unnecessarily wide streets everywhere, perhaps recognizing that too many cities have one size that is supposed to fit all. Unfortunately, planning and engineering consultants often seem to feel, inexplicably, that a short cul-de-sac in a city serving 10 lots somehow carries the same traffic as a street with ten times or more that number of homes. Many sections of Las Vegas, for example, from the air look like a sea of paving and rooftop – and that’s in the suburbs!

    The report addresses street grids, as well:

    “In rough topography the rectangular and the formal have no place, as they require heavy construction expense otherwise unnecessary. Even in flat country… the depressingly monotonous effect of the rectangular system should be avoided, on economic grounds if no other, for the dead level of mediocrity to which it brings districts depreciates their total value very materially. While to be sure no site is worth very much less than the average, none is worth very much more, whereas with variety in the layout many lots may be created with unusual value, due to location, attractive outlook, and special shape of lot adapted to the needs of the particular resident.”

    Oh my, such harsh words against the very grid pattern that the ‘Smart Growth’ movement promotes. It seems that the authors are suggesting a much more organic design, which can eliminate the monotony that detracts from housing and community values. It would seem that the very rigid relationships that are being promoted by ‘smart code’ proponents would not be embraced in this city, at least not by the top level staff and advisors.

    The details of this report?

    DETROIT
    Published by the Commission
    1915

    It was located in the Cornell University Archives library annex. Called Detroit Suburban Planning, and authored by Arthur Coleman Comey, Landscape Architect, it was based on the preliminary plan for Detroit by Edward H. Bennett, Architect. It included input from the commissioner of parks and boulevards, the commissioner of public works, and the city engineer.

    I grew up just outside the border of Detroit in the 1950s and early 1960s. It seemed that, for the most part, development continued on the same grid patterns, ignoring this report for at least the 40 years that followed its publication.

    Today, to provide a hope for sustainability for Detroit, we need to heed the report and provide better housing for those that cannot live in architectural wonderlands that only the wealthy can afford, or be subsidized by tax dollars that are no longer available. The development process of trying to jam each and every unit allowed by a regulation’s most minimal dimension in order to achieve the highest possible density pretty much guarantees that the development will fall into the very same traps that the report warned us about.

    Rick Harrison is President of Rick Harrison Site Design Studio and Neighborhood Innovations, LLC. He is author of Prefurbia: Reinventing The Suburbs From Disdainable To Sustainable and creator of Performance Planning System. His websites are rhsdplanning.com and performanceplanningsystem.com. To learn more about the kind of communities described in the report, check out Harvard University’s Graduate School of Design’s Landscape Urbanism writings and programs, or, to learn more about Prefurbia as applied specifically to this kind of redevelopment, click http://www.rhsdplanning.com/redev.swf (to request a DVD, contact rharrson@rhsdplanning.com.

  • Will the Last Family Leaving Seattle Please Turn out the Lights?

    New Census data for the Seattle area’s population changes, 2000-2010, permit a preliminary look at age and at types of households in the region. Let’s look at patterns of geographic variation in selected age groups and household types for places in greater Seattle. It provides more evidence for how rapidly Seattle in particular is changing in fundamental ways.

    The data show show a fairly similar geographic pattern — a dramatic gradient from Seattle (and to a degree also the older core cities of Tacoma and Everett) through the older suburbs and out to the urban and exurban fringe. These gradients trace the shares of singles (high in Seattle, low in the far suburbs), those under 18 (low in Seattle, high farther out), husband and wife families with children (low in Seattle, high in the far suburbs), and home ownership (lower in Seattle).

    This pattern is not new. But because of growth management and the concentration of higher-density redevelopment in the core cities, the gradient is perhaps more marked than earlier. Seattle really is exceptional — amazingly high in singles, but low in husband-wife couples with children, proportions under 18, and in home ownership. Conversely, some of the far suburbs are exceptionally low in singles, and high in traditional families, persons under 18, and home ownership.

    Two related variables are young adults, those 20-35, and the share of unmarried partners, but there are some differences from each other and from the preceding variables. The share of persons 20-35 is again exceptionally high in Seattle and Everett but also on military bases, and along the 520 corridor (Kirkland and Redmond). It is unusually low in retirement communities and on islands (e.g., Vashon, Bainbridge). The share of unmarried partner households is also very high in Seattle, but also in less affluent areas, places with high minority shares, and in a few rural communities.

    The shares of population over 65 and of single-parent households also have distinct patterns. The highest shares of the elderly are naturally in retirement communities, followed by island places (Vashon and Bainbridge and Mercer Island) and some older suburbs. Low shares of older folks characterize military bases, areas with many ethnic minorities, and some younger suburbs such as Sammamish and Mill Creek, and (in contrast to many large cities) in Seattle, Tacoma, and Everett.

    High shares of single-parent families occur on Indian reservations, on military bases, and in minority ethnic areas, most notably in south King Ccounty and parts of Pierce County. Low shares of single-parent households occur, as expected, in affluent suburbs, but are surprisingly low in Seattle. These variables, in particular, attest to the continuing gentrification of Seattle, and its changing patterns of ethnicity related to gentrification and high housing costs.

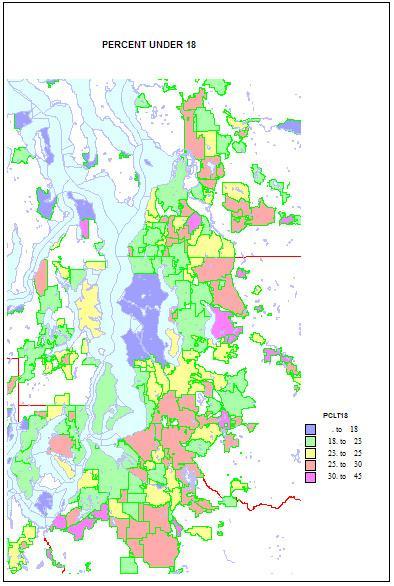
    Higher shares of persons under 5 reveal areas of young families. The highest shares are in military bases and Latino towns in eastern Washington, but are quite high, over 12 percent, in the farthest suburban and exurban places around Seattle such as Duvall and Snoqualmie. They are lowest in retirement towns, on islands such as Vashon and Bainbridge, and in some college towns such as Pullman.

    Shares of persons under 18 show a similar but not identical pattern. Again they are highest in military and Latino places, and in suburban and exurban places in the metropolitan area, and lowest in university towns and in Seattle itself. This implies that while still low Seattle is not as deficient in the very youngest as it is in older children.

    The story is very different for young adults. Not surprisingly, shares 20-25 are very high in university towns, on military bases, and Seattle, and quite low in suburban, mainly residential communities, especially more affluent areas, and on islands. Middle-aged adults, aged 45-64 (the baby boomers and thus the largest age group) are high in some older residential suburbs where younger adults are less common, and low in college towns, Latino areas, and in some areas of very recent growth, as in Snoqualmie and Monroe.

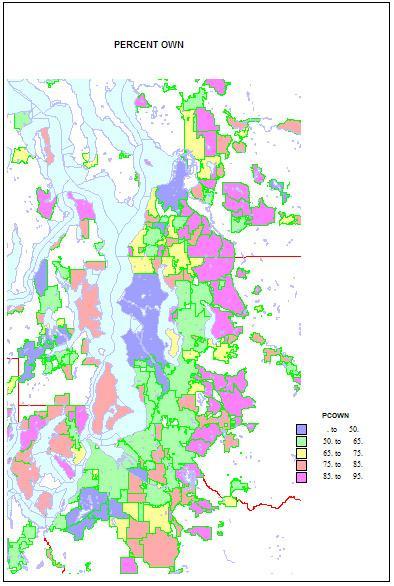
    Home ownership is related to both age and household types. Rates of home ownership are extremely high, in the 90s in newer and more affluent suburbs, with mainly single family homes; the rates are lowest on military bases, college towns, and in a few less affluent suburbs, such as Tukwila. As for the city of Seattle — which has indeed changed its character in a fundamental way — home ownership has dropped to a low of 48 percent. This shift helps us understand the cleavages in Seattle’s body politic, as a formerly very middle class city adjusts to an influx of singles, renters, and young people.

    Finally, as to types of households. Married couple families with children are the historic norm. They remain traditionally high on military bases, and in the farther newer suburbs, such as Snoqualmie, Sammamish, and Maple Valley; they are low as expected in college towns, in retirement communities, and (no surprise) in Seattle—13 percent, which is really low.

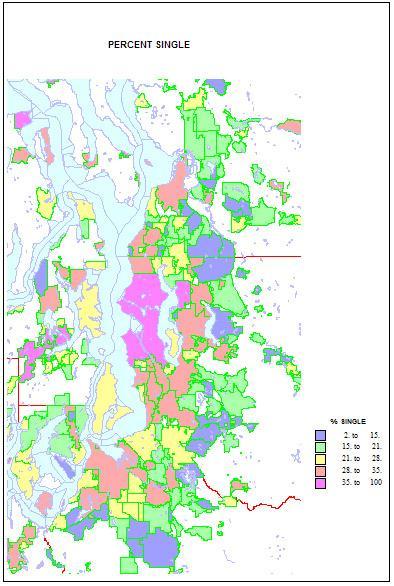
    Conversely, singles are highest in two island towns, Friday Harbor and Langley, but Seattle is an extremely high 41 percent. Shares are lowest in the same new suburbs rich in families, as in Sammamish, at 11 percent. Shares of unmarried partners are a high 10 percent of households in Seattle, but are higher on Indian reservations and the cities of Hoquiam and Aberdeen. The share of single-parent households is also high on Indian reservations, in less affluent and more ethnic suburbs like Parkland and Bryn Mawr and Tukwila. It is lowest in the newer, family-filled far suburbs.

    This piece originally ran at Crosscut.com and was edited by David Brewster.

    Richard Morrill is Professor Emeritus of Geography and Environmental Studies, University of Washington. His research interests include: political geography (voting behavior, redistricting, local governance), population/demography/settlement/migration, urban geography and planning, urban transportation (i.e., old fashioned generalist).

  • Why Compact Cities Aren’t so Smart

    I was interested to read the views of Rick Boven of the New Zealand Institute about central and local government needing to resolve their differences about the future of Auckland.  Well, they have worked on that since the establishment of GUEDO in 2005 (now the Auckland Policy Office). 

    But that’s not what the article was really about.  Under the pretext of calling for “new ways of working together” Rick promotes urban containment and greater train travel for Auckland’s future. Well, we’ve heard all that before.

    What Rick may have noticed by way of differences is not a failure of cooperation, but growing realisation that the old prescription for a compact Auckland is not working.  And while it may pain me to say so, in this instance the centre may be looking ahead, while the city continues to look to the past.  Any differences, Rick, arise from diverging views, not from a failure to work together.

    Fallacies and frailties

    And in this case I’m on the side of the centre.

    One can’t pick away at the frailties of urban consolidation planning in one article, but consider the following propositions about the compact city:

    • A focus on centralisation guarantees congestion;
    • A focus on centralisation reduces green space and concentrates urban pollution;
    • Consolidation prejudices old infrastructure, increasing overload and the risk of failure;
    • A focus on rail transit escalates costs, reduces flexibility, and caters for only a minority of trips among even those (relatively few) households that have ready access to it;
    • A focus on rail transit commits us to developing unattractive brownfield sites with high remediation costs if we intend to increase residential densities nearby;
    • A commitment to centralisation and higher densities increases vulnerability to extreme climatic events, rising sea levels, and other natural disasters;
    • Medium to high density living is socially flawed, as it is associated with transience, increased urban crime, diminished quality of life, and loss of a sense of community, especially for households in middle to lower income brackets (and, ultimately, razing of failed apartment blocks);
    • The market does not favour medium to high density housing unless well located, well appointed, and therefore out of the price range of most households;
    • Refurbishment and restoration of inner city suburbs for higher density living leads to gentrification that displaces lower income households;
    • Mixed use developments reduce the amount and push up the price of land for business while lowering the quality of life of residents;
    • Limiting new business land and expecting to take up new employment by increasing densities on existing sites forces up business costs, reducing the attractiveness of investment and competitiveness of business.

    None of this makes compact city policies look very smart.

    Pushing for alternatives

    The current council vision is for Auckland to be the world’s most liveable city.  Well, we won’t achieve that by “me-too” urban consolidation.  Don’t forget, in the corporate world consolidation is a defensive strategy, associated with stagnation not growth, holding the line, not forging ahead.

    A better answer may be to take advantage of our distinctive physical environment and make sure that our urban form complements and takes advantage of it as we move ahead.

    Here are some very broad ideas:

    Allow decentralisation to continue.  It’s happening, don’t fight it.  Provide for it.  That means ensuring that people can meet most of their needs close to where they live.  A sustainable city won’t work without sustainable suburbs.  These should be at the heart of our plans.  And some of them might just have to spill over the urban limits.  Now there’s a real opportunity to practice some innovative urban design.

    Let the city breathe:   We want a CBD which stands out among cities.  Well, by promoting sustainable suburbs we can lay off simply playing with structures and instead seize the opportunity to restore a green (and blue) heart to our city.  A timid but worthy start was made to Queen Street with the (re)introduction of Nikau palms, but we can go a lot further than that.  Barry Lett had great idea for the radical conversion of mid-Queen Street and Myers Park into an urban garden.  What a great place to visit!

    If we take the pressure off forcing housing into the CBD, among other things, we could do a lot more of that.  We could think seriously about creating a pedestrian precinct the length of Queen Street. I would also push for my hot spots to be green – and forge walkways and cycle ways among them.  We could better Integrate the CBD with the quality areas around it.  On the harbour front we need to find ways to cross Quay Street, for example, to merge water and land.  We might start by taking note of Lambton Harbour in Wellington, and how it blends hard and soft surfaces, restores the harbour edge, and creates a place for all people. 

    Develop Smart Sub-Urbs:  Forget Jane Jacobs’ nostalgia for the lost American city.  Those images belong to another age and another place.  Our life, our cultures, and our communities are in the suburbs.  Let’s ensure that strong communities can develop and thrive around urban villages and suburban centres throughout Auckland. 

    If we are serious about sustainability, the suburbs are where it must happen. Here we can deliver smart urban design, strengthen social relationships, and provide capacity for improving the quality of life at all levels.  It’s also at a sub-regional if not suburban level that labour markets operate most efficiently, and employment opportunities might best be promoted.

    And while we’re at it, we need to make sure that the suburbs are well interconnected by generous arterial corridors. This call for some difficult retrofitting.  It may mean reviewing how we use motor-ways; thinking more creatively about buses and bus-ways; and getting over an all-consuming desire to focus everything on the CBD, turning it into a giant interchange instead of a great destination.

    Launch the Satellites: Some of the best places to live in Auckland are beyond the bounds.  We seem so desperate to cling to urban limits that we ignore the fact that people like Auckland because of what lies beyond them. Let’s see if we can encourage smart growth in places like Warkworth, Bombay, Pokeno, Wellsford and Drury, Beachlands, Pukekohe, and others.  Let our rural villages prosper, too. These are all places where we could do some exciting planning and design.  And let’s make sure that we have wide, green corridors linking them, corridors that can cater for whatever modes of transport the future might throw at them – electric cars, light rail, and the like.

    If nothing else, let’s lift the discourse so that our ideas begin to match our aspirations.  The last thing we need to do, Rick, is to get together to recycle the old stuff.

    Phil McDermott is a Director of CityScope Consultants in Auckland, New Zealand, and Adjunct Professor of Regional and Urban Development at Auckland University of Technology.  He works in urban, economic and transport development throughout New Zealand and in Australia, Asia, and the Pacific.  He was formerly Head of the School of Resource and Environmental Planning at Massey University and General Manager of the Centre for Asia Pacific Aviation in Sydney. This piece originally appeared at is blog: Cities Matter.

    Photo by Mark Benger

  • Inside Sydney’s Central Business District: the Retail Core

    World famous for its beautiful harbour setting, Sydney’s Central Business District is undergoing a resurgence. As the hub of Australia’s finance sector, it stumbled during the global crisis. Office vacancies jumped from 5.7 per cent in early 2008 to 8.8 per cent in mid 2009, despite stable supply. Ultimately, though, Sydney was spared the worst, owing to its rise as a staging post for trade and investment in the Asia-Pacific region, which averted the havoc of Europe and North America. Recovery is now underway, if slowly. White-collar employment is picking up and the vacancy rate is down to 7.3 per cent. Landlords are again celebrating the prospect of rising rents.

    But there’s a bigger story. This revival is happening amid some notable trends. Post-crisis, the CBD’s functional map is being redrawn by a wave of Asian and other visitors and investors, prominently listed property trusts and pension funds looking for a safe haven, the spatial demands of a transformed white-collar workplace, intensive residential development on the CBD fringe and officials pushing flashy “green” projects. There’s no doubting the importance of these developments, or that they will be hyped by inner-city based media.

    In fact, central Sydney has been losing economic clout, in relative terms, to the periphery or suburban hinterland for some time, a polycentric trend observed in other countries. Between the 1981 to 2001 censuses, encompassing the most active period of economic liberalisation in Australia’s history, Sydney’s general population growth was 23 per cent, while outer areas in Greater Western Sydney grew by 38 per cent. The CBD’s share of Sydney’s jobs shrunk from around 30 per cent to 9 per cent during this period. Four of the five strongest growing Local Government Areas (LGAs) in the year to 30 June 2009 were still in the outer west: Blacktown, Parramatta, The Hills Shire and Liverpool.

    The latest wave of change will prove significant and long-lasting, but the CBD isn’t destined for a return to metropolitan supremacy.

    Sydney CBD
    Sydney CBD

    The retail core

    For theorists of the CBD, peak land value intersection (PLVI) is a pivotal concept. This is the centrally-located point, usually at the intersection of two thoroughfares, where land values are highest. Without doubt, Sydney’s PLVI is the intersection of George and Market Streets. George Street is the CBD’s spine, traversing a north-south axis from Circular Quay to Central Station. Historically, Market Street was the critical entry route from the west, extending from the defunct Pyrmont Bridge (over Darling Harbour), and now from a branch of the Western Distributor. Blocks surrounding the PLVI are typically occupied by upscale department stores, absorbing peak land prices with high turnover of quality goods on multiple floors. Thus Myer and Gowings stores occupy the north-east and south-east corners respectively, and David Jones a site further east along Market Street (the Gowings site is earmarked for refurbishment as a boutique hotel). The iconic Queen Victoria Building arcade sits on the south-west corner.

    According to the “core-frame model”, another tool of CBD theory, activities competing for the highest rents, like upmarket retail and superior grade office towers, concentrate in core blocks, while marginal activities disperse to peripheral blocks. In terms of the theory, the latter are a “zone in transition”, at an intermediate stage between lower grade building stock and future redevelopment. Activities like low-end retail, fast-food, novelty shops, pawnbroking, wholesaling, storage, off-street parking, warehousing and light-manufacturing locate there.

    Traditionally, Sydney’s CBD had a retail core around the PLVI bounded by York, Park, Elizabeth and King Streets, south of an office core bounded by King, Clarence and Macquarie Streets and Circular Quay. Judging by the headlines, the retail core is Sydney’s biggest news. Long a feature of suburban life, the CBD is being transformed by the arrival of mall-style shopping, adding to the mix of department stores, arcades and stand-alone shops. In some ways, it’s catching up with the social evolution of shopping as a “complete experience” linked to identity formation.

    The catalyst is Westfield’s $1.2 billion development at the corner of Pitt Street Mall and Market Street, just a block east of the PLVI. A pedestrianised section of Pitt Street between King and Market Streets (not a regular mall), Pitt Street Mall is the retail core’s epicentre. Last year, global real estate firm CB Richard Ellis (CBRE) rated it the second most expensive street for retail rents in the world. The first was New York’s Fifth Avenue.

    With rents so high, investment dollars are pouring in. Fronting the eastern side of Pitt Street Mall, Westfield’s contemporary glazed-glass structure, box-like at street level but topped by Sydney Tower, converts four properties into 93,000 square metres of retail space, distributed over a six-storey shopping mall. The first stage opened last October. On completion, it will house 330 flagship and specialty fashion outlets, and lifestyle stores, most of them international brands, including Sydney firsts Versace, Gap, Zara and Miu Miu, together with several eateries. Two skybridges link the complex to nearby Myer and David Jones department stores.

    Westfield’s opening coincided with a general revamp of Pitt Street Mall, featuring landscaping, paving and tree-planting by Sydney City Council, and reconstruction of the mall-like Mid-City Centre, 52 shops on four-levels fronting the Mall’s western side, almost opposite Westfield, penetrating west to 420 George Street. One Mid-City store, jewellery retailer Diva, is reputedly paying the highest rent in the CBD, $13,500 per square metre a year.

    Pitt Street Mall’s face-lift set off a reshuffle of fashion and luxury goods retailers around the retail core, with knock-on effects all the way up George Street. Burberry is moving to refurbished premises at 343 George Street, Louis Vuitton to a new flagship store on the corner of King and George Streets, Dior to Castlereagh Street, and Zegna and Prada to Westfield, from Martin Place. This follows the 2008 opening of the world’s largest Apple store, at glass-clad 367 George Street (roughly opposite Mid-City at 420).

    Pitt Street Mall
    Pitt Street Mall

    A sign that the retail core may be busting out of its old confines, and creeping north of King Street, major retail developments are planned in the vicinity of Wynyard railway station, at 301, 333 and 383 George Street. Some of these anticipate the most striking proposal yet: a futuristic commercial and residential precinct on the foreshore of East Darling Harbour, or Barangaroo, seeing the retail core spill into the CBD’s rising “western corridor”, which was a "zone in transition" in the days when Darling Harbour and Walsh Bay were working ports. This $6 billion plan includes 30,000 square metres of retail space and a pedestrian walkway to nearby Wynyard, the CBD’s busiest underground station.

    It’s easy to explain such hyperactivity. Sydney is one of a handful of global cities in a developed country which wasn’t flattened by the financial crisis. There’s a clear international dimension to the CBD’s resurgence. According to Cushman & Wakefield’s International Investment Atlas 2011, the Asia-Pacific is dominating global property investment. Ranked eleventh, Sydney joins 6 other Asia-Pacific cities in the top 20. In the 18 months to June 2010, reports CBRE, Sydney ranked fourth in the world in terms of cross-border investment. Foreign investors accounted for 42 per cent of Australia’s property asset acquisitions in the third quarter of 2010, way above the typical level of 10 to 15 per cent. In these conditions, Sydney shot up to ninth out of 65 cities in AT Kearney‘s 2010 Global Cities Index. And a 2010 survey by real estate agents Jones Lang La Salle rated Tokyo and Sydney the most popular Asian cities for investment. At a time when many asset classes carry outsized risks, Australian commercial property is a safe option.

    Of course, there’s nothing new about Asian investment in the retail core. Three of its most fashionable shopping arcades belong to Ipoh Pty Ltd, which is owned by a Singaporean fund manager: the Queen Victoria Building, The Strand Arcade between Pitt Street Mall and 412-414 George Street, and The Galleries, on the corner of George and Park Streets, the core’s southern edge.

    But urban planners would be wrong to overestimate the impact of all this on the wider metropolitan region. Quite clearly, Westfield’s target market embraces a small minority of Sydney’s 4.5 million residents. Commenting on the mall’s opening, the Group’s managing director hoped it would be a “destination for the people of Sydney, and the 26.8 million domestic and international visitors who come to Sydney each year”. The Australian Financial Review, citing Westfield, reported that it will “service not only 240,000 workers in the [CBD], but 1.5 million in the primary trade area across the richest suburbs and the 26 million tourists who visit the city each year”. David Jones’ CEO expressed similar sentiments, saying “my hope is that Sydney’s CBD retail precinct becomes a world-class shopping destination on a par with the world’s best such as Oxford Street, London, and Rodeo Drive in LA”.

    Much of the investment surge is predicated on large numbers of visitors, and the growth of inner-suburbs ringing the CBD. If the travelling patterns of China’s newly cashed-up middle class are any guide, for instance, these hopes won’t be disappointed. The number of Chinese visitors to Australia is forecast to grow by 7.9 per cent a year, reaching 783,000 a year by 2019. Meanwhile, Sydney LGA’s population is ballooning (the CBD and environs). Between 2001 and 2009, it grew by 38 per cent, or 49,000 new residents. Eager to meet the former state government’s target of 55,000 new residential units over the next decade, Sydney Council is presiding over a number high-density projects on derelict industrial or recreational sites. Most of the newcomers will belong to the same demographic as current residents, younger, upper-income professionals with a taste for inner-city living. They are no cross-section of Sydney’s population. Below average in age, their median weekly income is $717, compared to $518 for the whole metropolitan region.

    To an extent, Sydney CBD is exhibiting features of the global city phenomenon, when highly-developed zones “secede” from their hinterland and develop stronger ties to distinct occupational classes and overseas markets. The revitalised retail core is unlikely to lure the vast majority of shoppers — who live and work far from the CBD — away from suburban megacentres like Chatswood Chase, Miranda Fair, Warringah Mall, Castle Towers, Minto Mall, Top Ryde City, Westfield’s other centres at Bondi Junction, Parramatta, Burwood, Hurstville, Hornsby and Penrith, local retail strips, or the growing number of Australians who shop online. Just as suburban malls attract customers from their surrounding feeder population, the same applies to the retail core, but with a higher proportion of domestic and foreign visitors.

    The CBD’s revival shouldn’t be misinterpreted. It doesn’t herald a return to regional primacy. Calls by green-tinged academics and newspaper editors and columnists for billions to be spent on CBD-centric rail networks are wrongheaded. Such plans can only have a distorting and negative effect on economic vitality across the metropolitan region, especially fast growing outer LGAs. Look at the CBD’s story. For all the contemporary rhetoric linking urban success to green amenity, it owes more to plain old capitalism.

    John Muscat is a co-editor of The New City, where this piece originally appeared. 

    Photo by Christopher Schoenbohm.

  • Planning Decisions Must be Based on Facts

    While the misreporting of city population density comparisons commented on by  Wendell Cox was probably inadvertent, it is indicative of a general problem relating to contemporary planning – misrepresentation of facts.

    We are repeatedly told of the wonderful results of infill high density policies in locations such as Portland, USA or Vancouver, Canada which on investigation are found to be non-existent or applicable only to a small locality instead of to the city as a whole.

    Quantitative data is frequently misrepresented. To give one example, a 2008 Canadian study is often quoted as proving high-density reduces greenhouse gas emissions. Inspection and interpretation of the data provided reveals this to be negligible.  Without any evidence to the contrary, it seems reasonable to assume that the Canadian fraction of total household emissions that relate to transport is similar to that shown on the Australian Conservation Foundation’s website, being 10.5%. Applying this value to the data in Chart 2 of this Canadian study one finds that for those living within 5 km of the city centre there would be a transport difference attributable to increased density of only 1% in total annual emissions per person. For people living 20 km or more from the city centre the difference would be much less at 0.2%.

    We are told that high-density imposed on areas originally designed for low density is good for the environment; that it provides greater housing choice, that it reduces housing cost, that it encourages people on to public transport; that it leads to a reduction in motor vehicle use and that it saves on infrastructure costs for government. Not only do none of these claims stand up to scrutiny in any significant way, the contrary mostly prevails.

    Movements advocating high-density show characteristics of an ideology, their members’ enthusiasm resulting in a less than objective approach. The desire by these individuals to be socially and environmentally responsible and to identify with a group marketing these imagined benefits is understandable. Some may even benefit professionally. However the result is policies for which no objective favorable justification can be provided and which are not wanted by the greater community who have to live with the consequences.

  • The Evolving Urban Form: Jakarta (Jabotabek)

    There is probably no large urban area in the world that better illustrates the continuing dispersion of urban population and declining urban population density than Jakarta. Recently released 2010 census data indicates over the past decade that 84 percent of the metropolitan area (Jabotabek) population growth occurred in the suburbs (Note 1). This continues a trend which saw more than 75 percent of growth in the suburbs between 1971 and 2000 (Figure 1).

    Savannah State University (Georgia) Professor Deden Rukmana notes that this trend includes “many moderate and high-income families” who left the central city for better amenities while many poor people moved out to the fringe areas to escape what might be seen in the West as gentrification . 

    The Megacity: Jabotabek: Jakarta is one of only a few world megacities (over 10 million) that have changed their names in recognition of their regional rather than core city focus (this sentence corrected from original). The most recent megacity with a new name is Mexico City, now referred to as the Valley of Mexico (Zona Metropolitana del Valle de México). Other examples are Tokyo-Yokohama (Kanto) and Osaka-Kobe-Kyoto (Keihansh1n).   Jakarta’s changed name, Jabotabek, represents an acronym made up of the beginning letters of the municipality of Jakarta and the three adjacent regencies (subdivisions of provinces), Bogor, Tangerang and Bekasi (Note 3). Jabotabek is one of the fastest growing megacities in the world and is experiencing accelerated growth. This is in contrast to the situation identified by the McKinsey Global Institute, which noted the declining growth rates of most megacities. In 2000, Jabotabek had a population of approximately 20.6 million, which by 2010 had risen to 28.0 million or 36 percent, nearly doubling its rate of population from the 1990s.    Jabotabek’s additional 7.4 million people is nearly equal to that of London (Greater London Authority), nearly as large as the city of New York and more people than live in the entire Greater Toronto area. In 2000, Jabotabek had a population of approximately 20.6 million, which by 2010 had risen to 28.0 million (Figure 2).

    Jabotabek’s unexpectedly high growth was greater than the 6.6 million added in both the Shanghai and Manila regions over the same period and above the 5.8 million increase in the Beijing region. The percentage growth in Shanghai and Beijing was slightly higher than in Jabotabek and slightly lower in Manila. The megacities of the United States, Western Europe and Japan have all fallen back to growth rates of less than five percent per decade (Tokyo-Yokohama, New York, Osaka-Kobe-Kyoto, Los Angeles and Paris).

    Population Trends by Sector: Population growth and rates are indicated in the table for the sectors of Jabotabek and the constituent jurisdictions.

    Jakarta Region (Jabotabek)
    Population by Sector: 2000-2010
    2000
    2010
    Change
    % Change
    Core: Jakarta 8.36 9.59 1.23 15%
    Inner Suburbs (Municipalities) 4.94 7.23 2.30 47%
    Tangerang 1.33 1.80 0.47 36%
    Tangerang Selatan 0.80 1.30 0.50 63%
    Depok 1.14 1.75 0.61 53%
    Bekasi 1.66 2.38 0.71 43%
    Outer Suburbs & Exurbs 7.30 11.20 3.90 53%
    Bogor (Municipality) 0.75 0.95 0.20 27%
    Bogor (Regency) 2.92 4.78 1.86 64%
    Tangerang (Regency) 2.02 2.84 0.82 41%
    Bekasi (Regency) 1.62 2.63 1.01 63%
    Jabotabek: Total 20.60 28.02 7.42 36%
    Population in millions


    City of Jakarta: The core city of Jakarta is the "Special Capital Region" of  Indonesia, similar to the District of Columbia in the United States, the Distrito Federal in Mexico or the Capital Federal in Argentina. This core of Jakarta grew 15 percent and added more than 1.2 million population, rising from 8.36 million in 2000 to 9.59 million in 2010, a turnaround from a loss of nearly 500,000 people between 1995 and 2000. The city of Jakarta captured 16 percent of metropolitan area growth and now accounts for 34 percent of the population of Jabotabek (Figures 3, 4 & 5).

    Inner Suburbs: The inner suburbs, which are made up for the purposes of this article by the municipalities of Bekasi, Tangerang, Depok and Tangerang Selatan (South Tangerang) grew 47 percent during the 2000, from 4.94 million to 7.23 million. These inner suburban municipalities captured 31 percent of the metropolitan area growth and now have 26 percent of the population of Jabotabek (Figures 3, 4 & 5).

    Outer Suburbs and Exurbs: The outer suburbs and exurbs (Note 2) experienced the greatest growth, at 53 percent, rising from 7.30 million to 11.20 million. For the first time, the outer suburbs surpassed the core with the largest population. The outer suburbs and exurbs accounted for 53 percent of the metropolitan area growth and now have 40 percent of the population of Jabotabek (Figures 3, 4 & 5).

    Urban Area:  The substantial growth of Jabotabek occurred principally in the urban area (the area of continuous development or the agglomeration). It appears likely that the urban area population will exceed 24 million (Note 4). It thus seems likely that the Jakarta urban area will again be ranked as the second largest in the world, following Tokyo-Yokohama. Jakarta had been displaced by Delhi (and Seoul-Incheon), for which United Nations 2010 estimates had indicated higher than anticipated population growth as Delhi passed Mumbai to become the largest in India.

    Overall, the Jakarta urban area has a population density of approximately 22,000 per square mile or approximately 8500 per square kilometer. Yet the overall density of the Jakarta urban area has declined as population has moved to the outer suburbs which have a population density only one third that of the city of Jakarta. The inner suburbs have a population density that is only two thirds that of the city of Jakarta (Figures 6 and 7).


    Despite this, the Jakarta urban area is much denser than most large urban areas in the high income world. Overall, the Jakarta urban area is approximately 2.5 times as dense as the Paris urban area, more than three times as dense as the Los Angeles urban area, and approximately seven times as dense as the Portland urban area. Other urban areas in the developing world are even denser:  Delhi is more than 1.5 times as dense as Jakarta, Mumbai more than three times as dense and Dhaka is more than four times.


    Informal housing, city of Jakarta (photo by author)


    A Larger Metropolitan Area?  This continuing population growth could cause Jabotabek to expand even further. Indonesia’s President Susilo Bambang Yudhoyono (SBY) has proposed expanding the metropolitan area to include the regencies of Karawang, Serang, Purwakarta and Sukabumi as well as the municipalities of Serang, Sukabumi and Cilegon. Already, Jakarta’s continuous urbanization nearly reaches the Karawang urban area to the east (population over 600,000) and is nearing Serang regency to the west. SBY’s "Greater Jakarta" has a population approaching 36 million according to the 2010 census. Further pressure on suburban growth could be generated by plans in Jakarta to limit the core city’s population to 12 million.

    Yet even so it may take some decades, before Jakarta, or perhaps Delhi, could pass Tokyo-Yokohama’s nearly 37 million people to become the world’s largest urban area, assuming that they do not experience the reduced population growth so widespread in other megacities.   

    ———

    Notes:

    1. Caution should be used in making comparisons of metropolitan areas, especially between nations. There is virtually no consistency in the delineation of metropolitan areas between nations. In some cases, such as Japan, the United States, France and Canada, Metropolitan areas are based upon commuting patterns, but even between these nations there is no consistency.

    2. For the purposes of this article, suburbs are inside the urban area, but outside the central city (Jakarta). Exurbs are the portions of the metropolitan area (Jabotabek) outside the urban area.

    3. The provinces of Indonesia and the state of Virginia are subdivided similarly. In Virginia, all of the land area is divided into municipalities or counties. In the provinces of Indonesia, all of the land area is divided into municipalities (kota) and regencies (kapupaten). The regencies are further divided into sub-districts (kecamatan). Jabotabek is located in three provincial level jurisdictions, the Special Capital District of Jakarta, and the provinces of West Java (Java Barat) and Bantan. West Java has a population of 43 million, approximately 6,000,000 more than the largest state in the United States, California. Banten is bordered on the west by the Sunda Strait, location of Krakatoa, the volcano.

    Further, the name Jabotabek may not survive. As municipalities (Note 3) were carved out of the regencies in the 1990s and 2000s, the megacity was called Jabodetabek by some and proposed additions to the metropolitan area could bring even more variations. Inconsistent and alternative names probably make likely that sources will continue to call the megacity "Jakarta."

    4. This urban area population is much larger than reported by the United Nations, which for Indonesian urban areas limits its estimates to the jurisdiction of the core city, and thus excludes suburbs. As is generally the case throughout the world, the continuous urbanization of Indonesian urban generally areas extends far beyond core cities.

    —–

    Photograph: Luxury housing in Cileungsi sub-district, Bogor regency (outer suburbs), by author

    Wendell Cox is a Visiting Professor, Conservatoire National des Arts et Metiers, Paris and the author of “War on the Dream: How Anti-Sprawl Policy Threatens the Quality of Life

  • Transit: The 4 Percent Solution

    A new Brookings Institution report provides an unprecedented glimpse into the lack of potential for transit to make a more meaningful contribution to mobility in the nation’s metropolitan areas. The report, entitled Missed Opportunity: Transit and Jobs in Metropolitan America, provides estimates of the percentage of jobs that can be accessed by transit in 45, 60 or 90 minutes, one-way, by residents of the 100 largest US metropolitan areas. The report is unusual in not evaluating the performance of metropolitan transit systems, but rather, as co-author Alan Berube put it, "what they are capable of." Moreover, the Brookings access indicators go well beyond analyses that presume having a bus or rail stop nearby is enough, missing the point the availability of transit does not mean that it can take you where you need to go in a reasonable period of time.

    Transit: Generally Not Accessible: It may come as a surprise that, according to Brookings, only seven percent of jobs in the nation’s largest metropolitan areas can be reached by residents in 45 minutes during the morning peak period (when transit service is the most intense). Among the 29 metropolitan areas with more than 2,000,000 population, the 45 minute job access average was 5.6 percent, ranging from 12.6 percent in Boston to 1.3 percent in Riverside-San Bernardino. The New York’s metropolitan area’s 45 minute job access figure was 9.8 percent (Figure 1).

    Brookings did not examine a 30 minute transit work trip time. However, a bit of triangulation (Note 1) suggests that the 30 minute access figure would be in the range of 3 to 4 percent, at most about 4,000,000 jobs out of the more than 100 million in these metropolitan areas.   At least 96 percent of jobs in the largest metropolitan areas would be inaccessible by transit in 30 minutes for the average resident (Figure 2).

    The Brookings report also indicates that indicates that 13 percent of employment is accessible within 60 minutes by transit and 30 percent within 90 minutes (Note 2). Brookings focuses principally on the 90 minutes job accessibility data. However, the reality is that few people desire a 45 minute commute, much less one of 90 minutes.

    In 2009, in fact, the median one way work trip travel time in the United States was 21 minutes (Note 3). Approximately 68 percent of non-transit commuters (principally driving alone, but also car pools, working at home, walking, bicycles, taxicabs and other modes) were able to reach work in less than 30 minutes. The overwhelming majority, 87 percent, were able to reach work in 45 minutes or less, many times transit’s seven percent. Transit’s overall median work trip travel time was more than double that of driving alone (Figure 3).

    A mode of transport incapable of accessing 96 percent of jobs within a normal commute period simply does not meet the needs of most people. This makes somewhat dubious claims that transit can materially reduce congestion or congestion costs throughout metropolitan areas. The Brookings estimates simply confirm the reality that has been evident in US Census Bureau and US Department of Transportation surveys for decades: that transit is generally not time-competitive with the automobile. It is no wonder that the vast majority of commuters in the United States (and even in Europe) travel to work by car.

    Much of the reason for transit’s diminished effectiveness lies in the fact that downtowns — the usual destination for transit — represent a small share of overall employment. Downtown areas have only 10 percent of urban area employment, yet account for nearly 50 percent of transit commuting in the nation’s largest urban areas (Figure 4).

    Meanwhile, core areas, including downtown areas, represent a decreasing share of the employment market as employment dispersion has continued. Since 2001, metropolitan areas as different as Philadelphia, Portland, Dallas-Fort Worth, Salt Lake City, Denver and St. Louis, saw suburban areas gain employment share. Even in the city of New York, outer borough residents are commuting more to places other than the Manhattan central business district (link to chart).

    Transit: The Long Road Home: Transit problem stems largely from its relative inconvenience.    In 2009, 35 percent of transit commuters had work trips of more than 60 minutes. Only six percent of drivers had one way commutes of more than 60 minutes. For all of the media obsession about long commutes, more than twice as many drivers got to work in less than 10 minutes than the number who took more than an hour. In the case of transit, more than 25 times as many commuters took more than 60 minutes to get to work as those who took less than 10 minutes.

    Economists Peter Gordon and Harry W. Richardson have shown that the continuing dispersion of jobs (along with residences) has kept traffic congestion under control in the United States. Available data indicates that work trips in the United States generally take less time than in similar sized urban areas in Europe, Japan, Canada and Australia.

    Transit Access is Better for Low Income Citizens: The Brookings report also indicated that job accessibility was better for low income citizens than for the populace in general. Approximately 36 percent of jobs were accessible to low-income residents in 90 minutes, compared to the overall average of 30 minutes. This, of course, is because low income citizens are more concentrated in the central areas of metropolitan areas where transit service is better. But even this may be changing. For example, Portland’s aggressive gentrification and transit-oriented development programs are leading to lower income citizens, especially African-Americans, being forced out of better served areas in the core to more dispersed areas where there is less transit. Nikole Hannah Jones of The Oregonian noted:

    "And those who left didn’t move to nicer areas. Pushed out by gentrification, most settled on the city’s eastern edges, according to the census data, where the sidewalks, grocery stores and parks grow sparse, and access to public transit is limited." 

    Realistic Expectations: More money cannot significantly increase transit access to jobs. Since 1980, transit spending (inflation adjusted) has risen five times as fast as transit ridership. A modest goal of doubling 30 minute job access to between 6 and 8 percent would require much more than double the $50 billion being spent on transit today.

    Moreover, there is no point to pretending that traffic will get so bad that people will abandon their cars for transit (they haven’t anywhere) or that high gas prices will force people to switch to transit. No one switches to transit for trips to places transit doesn’t go or where it takes too long.

    Nonetheless, transit performs an important niche role for commuters to some of the nation’s largest downtown areas, such in New York, Chicago, Boston, San Francisco, and Philadelphia. Approximately half or more of commuters to these downtowns travel there by transit and they account for nearly 40 percent of all transit commuters in the 50 largest urban areas.   

    Yet for 90 percent of employment outside downtown areas, transit is generally not the answer, and it cannot be made to be for any conceivable amount of money. If it were otherwise, comprehensive visions would already have been advanced to make transit competitive with cars across most of, not just a small part of metropolitan areas.  

    All of this is particularly important in light of the connection between economic growth and minimizing the time required to travel  to jobs throughout the metropolitan area.

    The new transit job access is important information for a Congress, elected officials, and a political system seeking ways out of an unprecedented fiscal crisis.

    A four percent solution may solve 4 percent of the problem, but is incapable of solving the much larger 96 percent.

    Notes:

    1. For example at difference between transit commuters reaching work in less than 30 minutes and 45 minutes, Brookings employment access estimate of 7 percent at 45 minutes would become 3 percent at 30 minutes.

    2. The Brookings travel time assumptions appear to be generally consistent with data from the Census Bureau’s American Community Survey (ACS) and the US Department of Transportation’s National Household Transportation Survey (NHTS). Brookings, ACS includes the time spent walking to transit in work trip travel times (For example, the ACS questionnaire asks respondents how long it takes to get from home to work and thus includes the time necessary to walk to transit).

    3. Median travel times are estimated from American Community Survey data for 2009 and includes working at home. The "median" is the point at which one half of commuters take more time and one-half of commuters take less time to reach work and is different from the more frequently cited "average" travel time, which was 25.5 minutes in 2008.

    4. Is Transit Better in Smaller Metropolitan Areas? It is generally assumed that transit service is better in larger metropolitan areas than in smaller metropolitan areas. Yet, the Brookings data seems to indicate the opposite. Larger metropolitan areas tended to have less job access by transit than smaller metropolitan areas. In the largest 20 percent (quintile) of metropolitan areas, only 5.5 percent of employment was accessible within 45 minutes. This was the smallest quintile accessibility score, and well below the middle quintile at 9.2 percent and the bottom quintile at 8.3 percent. The top quintile included metropolitan areas with 2.6 million or more people, the middle quintile included metropolitan areas with 825,000 to 1,275,000 population and the bottom quintile included metropolitan areas between 500,000 and 640,000 (Figure 1). This stronger showing by smaller metropolitan areas probably occurs because it is far less expensive for transit to serve a smaller area. Further, smaller metropolitan areas can have more concentration in core employment.  Even so, smaller metropolitan areas tend to have considerably smaller transit market shares than larger metropolitan areas.

    Wendell Cox is a Visiting Professor, Conservatoire National des Arts et Metiers, Paris and the author of “War on the Dream: How Anti-Sprawl Policy Threatens the Quality of Life

    Photo: Suburban employment: St. Louis (by author)

  • The Recipe for Unlivable Cities in New Zealand

    The Auckland Council’s great vision is to make Auckland one of the world’s most livable cities. Yet the outcome of its currently proposed plans will be a city which is second best for most Aucklanders.

    Some 60% to 80% of residents of New World cities state a clear preference for a single family home with its own backyard. In Victoria state, where Melbourne is located, 70% of the population, for example, preferred a single family home according to one government study. There have been similar findings from US based groups like the National Association of Realtors.

    Yet even when this is acknowledged, many in the media, taking their clue from planners and urban theorists, seek to change this reality.  The May 9 issue of the NZ Herald carried a story titled “The Dying Backyard Dream” tells us “Many Auckland suburbs will become home to high-rise apartment blocks with the quarter acre dream (1,000 sq m) reserved for the privileged few.”

    This fairly represents the intended outcomes of Council’s Spatial Plan as outlined in the discussion paper “Auckland Unleashed”.  But if this new vision is realized how can Auckland be a “liveable city” for all those residents who are unable to realize their preference for a low-density suburban home? Instead, they must “learn to accept” life in “terrace houses, duplexes, courtyard houses, maisonettes, and 4 -5 storey apartment buildings”.

    When working-class and middle-class households find they are priced out of the market for the housing of their choice, they will simply move to some other location, here or overseas. This has long been the case with British migrants to places like New Zealand and now people from China and the diaspora countries, currently the largest source of new immigrants.

    Yet these households provide the core labour force for the productive sectors, and for the manufacturing sector in particular. For some reason engineers and scientists tend to place more emphasis on home life and work life balance than financiers, and other members of the “creative classes”. (i.e. those who are creative with other people’s money). Hence, in the Bay Area, engineers and scientists gravitated to suburban Silicon Valley while the “creative classes” gravitated to downtown San Francisco.

    The New Geography team have documented the recent changes in the diverse states of the U.S. using the data from the 2010 U.S. Census. Their findings deserve careful study if we want to provide livable cities for the mass of New Zealanders, rather than for a wealthy elite.  In the U.S., according to the most recent Census, middle class people and companies have moved to Texas and the Southeast, because these areas are business-friendly, have low housing costs, reasonable taxation, and regulatory environments that encourage industrial expansion.

    This suggests it may be time to propose urban visions that are more humane for the vast majority by rejecting intensification and concentration in favor of the more adaptable and resilient environment of more dispersed cities and suburbs.  A key advantage of smaller dispersed cities such as Raleigh, Austin, San Antonio and Indianapolis, is their more affordable housing means up to four out of five households can afford their preference for a suburban house with a backyard.

    The densifiers insist that dispersal increases commuting times and yet the average commute in low-density urban areas like Salt Lake City and Kansas City is slightly above twenty minutes. (Aucklanders should be so lucky).  If the aim is economic growth and job creation, the transport system must provide genuine mobility throughout the entire labour market of the metropolitan area, not just to the central business district.

    Auckland’s Spatial Planners should take note of this recent research, and Christchurch leaders should seize the opportunity to be the Number One City in New Zealand if they don’t.
    A major source of evidence in support of Unleashing Auckland is the ARC’s “Future Housing Demand Study” which assumes that Auckland’s density must increase to develop a healthy and growing urban economy. Unfortunately these assumptions are not supported by any evidence from the rest of the New World. In fact, forced densification is as often as not a   recipe for failure.

    The Auckland urban area is already the second densest in the New World and the street network was never designed to cope with such high densities. Rather than reducing congestion, doubling the density on a given street increases the vehicle trips on that street by at least 70 – 90%. How can such densification reduce congestion?

    These surveys of housing preference also tell us that the growing number of smaller households will not NEED three bedrooms, and hence will not prefer them. Such inferences ignore the growth in the spatial demands of home occupations, home arts and crafts, telecommuting, and the need for spare rooms to accommodate visiting friends and relatives – not to mention a lifetime’s accumulation of stuff. Even single people will buy a three bedroom house to guarantee long term salability and value. The rooms soon fill it up.

    Aging couples are presumed to want to be rid of their backyard “burden”. Yet we are a nation of gardeners, and retirees are some of the keenest gardeners of all. It’s a healthy hobby.

    The Wellington Regional Strategy Report also assumes the need for intensification, and also presumes “need” determines “preference” as in:

    The eventual decrease in two-parent families will have implications in terms of reducing demand for larger dwellings on larger sections, resulting in a surplus of this stock.

    So larger dwellings must be getting cheaper. Sorry, they are not.

    The report also presumes that ordinary folk just don’t know what they are doing when they make their choices. Researchers find that people actually make their trade-offs very well – especially the trade-off between travel times and distances, and price and amenity.

    Evidently, the early development of Silicon Valley was a dreadful error because“ … having centrally located and compact form of residential development provide greater benefits to the city than lower density forms.” But what would those scientists and engineers know? They built the world’s premier technology region in the suburbs, just as had been done a half century earlier in Los Angeles or in scores of other tech belts scattered from Austin, TX to the outer rings of London, Paris and Tokyo.

    The report also claims a “large proportion of retirees are currently moving to Kapiti Coast, which indicates there is an insufficient housing supply in other locations to meet their needs.” Maybe these retirees have actually chosen to live on the Kapiti Coast, an area of smaller, low density development sixty kilometers from Wellington, because they prefer it. Many people would share their choice. Similarly, who speaks for the children who lose the freedom to enjoy spontaneous outdoor play, and to benefit from a free-ranging life?

    There is nothing wrong with medium and high-density living for those who make a free choice within a functioning and affordable market. Councils should be maximizing our freedom to choose by focusing on general affordability. They must start by reducing the cost of land by freeing up supply.

    Owen McShane is Director of the Centre for Resource Management Studies, New Zealand.

    Photo by Pat Scullion

  • Condo Culture: How Florida Became Floridastan

    Welcome to Griftopia. The Florida housing industry needs a karmic rebalancing. Our recent roar of building new structures is echoed today by the squeaks and pops of a different type of construction industry. Invasive testing – the architectural equivalent of a biopsy – seems to be on the rise. Saws, hammers, and cranes can be heard through the quiet suburban developments and subdivisions around Florida, as shingles and stucco are cut off in small patches to reveal serious problems within.

    Like the hidden defects in mortgage-backed securities and other arcane instruments of finance, these flaws are covered up and papered over, but are no less damaging. They are also just as revealing about our collective haste to accommodate growth.

    Few other places saw as much suburban expansion as Florida did, beginning in the 1990s and lasting right up until the bursting of the 2008 real estate bubble. Old hands in the Florida real estate development game see the cycle as never-ending, stretching all the way back to Ponce de Leon, whose “fountain of youth” was perhaps the state’s first marketing gimmick. The most recent bust, however, provides important lessons, should future cycles include speculators and regulators alike feeding at the trough. Rapid growth breeds errors, compromises, and sloppiness which have dire, lasting consequences.

    Pundits are assigning blame for the Millennial Depression up and down the economic ladder, and certainly the Florida housing boom and bust provides many examples of all that went wrong. The largest developers, driven by stockholders and Wall Street to seek rapid growth and high profits, gambled that Florida’s population boom would last forever. With the good addresses already taken, “B” properties close to interstates, under flight paths and adjacent to sensitive wetlands began to see activity. Low density reduced the developers’ risks and reduced construction costs, as well.

    The Florida condominium – outwardly appearing as an apartment complex — was a home ownership product for the masses. As long as the product lasted 30 years (or however long it took to pay off the mortgage), no one much cared about its quality and stability as an asset. Anonymous, stick-built stucco boxes, baking in the Florida sun, seemed the perfect solution to meet the demands of stockholders and investors, and the regulatory pathway was smoothed over to keep the production line rolling.

    Immigrants from abroad and from other parts of the country bought their own piece of the American Dream: gated entries, warrens of tight garages, patches of St. Augustine grass, buggy-whip sized oak trees and tightly wrapped stucco and glass boxes. Balconies are common, although the tiny decks and the heat preclude much enjoyment of the outdoors. Designed to prevent neighbors from meeting or children to freely play, these contemporary cracker box condos sullenly sweat in the heat. Still, they gave a much-needed step-up for the vast service workforce looking for a way out of the rental market and into an ownership position, and buyers can perhaps be forgiven for overlooking the cheapness of construction in favor of a new way to prosperity and success.

    The demand, however, outstripped the ability to deliver. Design and construction delays simply due to over-commitment and lack of manpower meant that corners were cut, compromises were made, and slop was tolerated. It was as if the investment mania on Wall Street – in journalist Matt Taibbi’s words, “griftopia” – had trickled down to the field superintendents, masons, and framing crews. A collective haste gripped much of the state’s growth industry, haste that is cause for regret today.

    A ten-year-old stucco building may look to be in perfectly good shape from the outside. When entering the bland, beige entry hall, however, the tang of mold immediately invades one’s nose. Once water has been trapped in a building it breeds a most sinister fungus.

    Condominium units that suffer this malady are ascending the legal chain one by one across the girth of the state. First, individual owners collect themselves and confront their homeowner’s association. HOAs bombarded with complaints succumb quickly to “condo chaser” attorneys who promise to split the goodly sums they can rake off the insurance companies that covered the contractors and design professionals involved in the mess. And then, discovery begins.

    It takes about a week to vivisect a low-rise building. Ordinarily, the stucco walls are saw-cut down to the bone, and the plaster comes off in a solid sheet, revealing metal strap ties and sheathing tissue within. The sheathing panels themselves are made of glued together wood chips – so-called “oriented strandboard” – only as strong as the glue itself. Removal of the sheathing layer reveals the deep ligaments and structural bones of the building.

    Buildings designed in Texas, Ohio, Georgia, and elsewhere populate the Florida landscape. These buildings have almost no roof eave at all, as if the fierce Florida sun didn’t matter. The skin-tight stucco may not be Portland cement plaster, because dryvit (an acrylic latex substitute for stucco invented after World War II to quickly rebuild Europe) has become a popular substitute. The windows are set at the outside of the wall, with no shading at all on the glass. The effect is that the building looks as stretched tight as a balloon.

    Unfortunately, such a combination frequently admits water into tiny cracks and crevices, and the water has no way to seep out. Revealing the interior guts of a building is the only way to uncork mold and rust horrors that are otherwise invisible. Insidious ants wind their way into the dark spaces between walls and floors where water and food are available.

    Biopsies on sick buildings reflect our collective errors of judgment, and the healing process will be lengthy and expensive. Designs that do not reflect the harsh realities of Florida’s hot, wet climate are certainly responsible for some of the errors. Designs that did not acknowledge the scarcity of experienced construction crews were also responsible, because construction takes teamwork and skill. And contractors, encouraged to cut costs in order to boost their own bottom lines, cut time or cut labor to get the job done faster.

    Designers and contractors may also legitimately point the finger back at clients who pushed hard. A collective irrationality set in towards the end of the last decade. More work had to be done by fewer people, less experience was available to go around, and in the heat of the moment steps could be skipped in the name of innovation. The consequences are being felt only now.

    A huge, sad pile of lost resources, our vanishing wood and raw materials, must be hauled off to clean these errors out of the system. Sadder to see are the homeowners, as they pack up and move out of their mold-infested units. But saddest of all is the apparent inability of the industry to learn from its own mistakes.

    Let’s hope that this time around it can happen differently. Reject growth for growth’s sake. Florida, hooked on this drug for too long, deluded itself into filling up wetlands and paving more and more space.

    Instead, as the tide rolls in once again, Florida can make a pact with itself to invest in development, rather than growth. Redeveloping older, inner cores of cities where services and employment are already in place can go a longer way towards making the state a sustainable, diverse place to live than paving one more tract of raw land mowed down for home lots can.

    Revamp the state’s development culture. Private developers have written Florida’s growth management code, and gradually increased the requirements so that only the largest and most deep-pocketed developers can compete. Protecting neither the environment nor quality of life very well, the development regulations are in dire need of rewriting, with a different set of requirements that favor smaller-scale development and redevelopment, and encourage affordability.

    In the meantime, discovery continues. More leaky roofs, more fungus-infested units, and more attics seething with ants, testimony to our collective haste and greed. As the nation slowly recovers economically, Florida has paused for breath on the pathway to healthy construction. Before the next boom, its development industry would be wise to use this break in the action to consider the alternatives.

    Richard Reep is an Architect and artist living in Winter Park, Florida. His practice has centered around hospitality-driven mixed use, and has contributed in various capacities to urban mixed-use projects, both nationally and internationally, for the last 25 years.

    Photo by the author.

  • Where Do the Children Play?

    Are compact cities healthy cities? One argument for compact cities is that they are good for our health.  The New Zealand Public Health Advisory Committee in 2008, for example, cited four principles for healthy urban planning based on the density of development: urban regeneration, compact growth, focused decentralisation, and linear concentration.  The aim is less time in cars and more use of active transport.

    One objective of Auckland’s Regional Growth Strategy, with its emphasis on CBD and centre-focused residential growth is “safe and healthy communities”.  But how far can that be achieved through residential intensification?  Does regulating for a compact city work for everyone?  Everywhere? 

    Kids and consolidation

    Research by Penelope Carroll and Karen Witten of Massey University, summarised here and in a recent article in The Aucklander, highlights the disadvantages for children in the inner city. 

    Witten and Carroll suggest that traffic volumes, strangers on the street, and lack of outdoor play space mean that children in central city environments are likely to be confined indoors.  And that raises the disadvantages of high density dwellings: insufficient space, internal noise, lack of natural light, lack of privacy, inadequate parking, inadequate indoor play space, and the potentially hazardous nature of balconies.  Poor health outcomes is a major concern.

    A key issue for children in compact parts of the compact city is lack of opportunity for outdoor activity.  Heavily trafficked streets are not good for bike riding, or even walking alone.  Auckland’s centre is devoid of segregated cycleways or play areas.  Getting to school or the park is a major mission, and may well need a car trip. 

    Even the Auckland Domain, a splendid sprawling park on the CBD fringe, is surrounded by high intensity streets, remote from most central apartments, and is hardly child-friendly.  The much smaller Victoria Park is similarly difficult to access, isolated by major arterial roads.  Albert Park is about the only central green space of note, but this is a throughway between university and town, not an ideal area for children to play. 

    Auckland CBD Green Space

    Perhaps the well-being of children is not a major issue here, because only around 600 (aged under 15) lived in the CBD in 2006.  But it was up 130% over a decade.  And they do count.

    Anyway, the limits of central city living for children – and families – flag more general issues:

    • The need to think seriously about how we cater for families in higher density living generally, in the CBD, in other centres, and in suburbs targeted for intensification;
    • How we provide safe, public green space, areas for play, and ease of movement in high density, mixed use environments; and
    • Just how healthy is the inner city residential for living generally?

    CBD living – not so healthy?

    The factors potentially stressing children in the CBD impact on adults too.  Research for Auckland City in 2003 (CBD Metadata Analysis by No Doubt Research) suggested dissatisfaction with inner city apartment living came from a diminished sense of security and safety, noise nuisance, small units, absence of outdoor living spaces, and lack of a sense of community. 

    In the absence of outdoor recreation space adult residents may get some exercise in the burgeoning gymnasium sector (for between $1,000 and $2,500 a year).  But for many recreational and social activities a car is a necessity.  Simply to take advantage of the key benefits cited for living in Auckland – access to outdoor recreation opportunities, organised sports, beaches, bush and countryside – residential Intensification around centres means more time- and fuel-consuming car trips.

    On top of a lack of open useable space the latest State of the Region Report documents the heaviest concentration of air pollutants in and around central Auckland, hardly a healthy living environment.

    Central Auckland Haze
    Source: Auckland Regional Council,
    State of the Region, 2010

    Community in the central city

    Research by Larry Murphy of the University of Auckland (“Third-wave gentrification in New Zealand: the case of Auckland” Urban Studies 2008, Volume 45) described different communities in the CBD: the well-to-do with their spacious harbour edge apartments (and quite possibly a second home – a beach cottage or lifestyle block – outside the city); the student-dominated quarter to the east; and the low income population to the west.  Families may end up in the latter area, in cramped apartments in featureless apartment blocks, simply for reasons of affordability.

    These are transient populations, some 52% of residents in the Central East and Central West Census Area Units had been in their current dwellings for less than a year in 2006.  This compares with 23% in Auckland as a whole.  These particularly high residential mobility figures contradict any suggestion that high density living might create a strong sense of community cohesion.

    Okay for some, for some of the time

    The CBD works for some people.  The proliferation of downtown bars and entertainment caters particularly for the young and well-to-do.  Gentrification of the harbour-edge works for the professional couple, the wealthy, and out-of-towners.  But the central city is not right for middle or low income households, or families. 

    Two key ingredients of a compact city strategy are increasing residential densities and boosting inner city living.  But these raise health and equity issues.  At the least, they call for investment in the quantity and quality of public space in areas targeted for intensification, making potentially big demands on the public purse given the value of land in the CBD and other commercial centres. 

    We may just have to acknowledge the benefits of suburban living for some time to come and seek opportunities for sustainable development that don’t oblige less well-off families to dwell in small apartments and featureless blocks around busy commercial areas for lack of affordable alternatives.

    Phil McDermott is a Director of CityScope Consultants in Auckland, New Zealand, and Adjunct Professor of Regional and Urban Development at Auckland University of Technology.  He works in urban, economic and transport development throughout New Zealand and in Australia, Asia, and the Pacific.  He was formerly Head of the School of Resource and Environmental Planning at Massey University and General Manager of the Centre for Asia Pacific Aviation in Sydney. This piece originally appeared at is blog: Cities Matter.

    Photo by Pat Scullion