Category: planning

  • Time to Hate Those HOAs (again).

    The foreclosure crisis has been devastating for millions of Americans, but it has also impacted many still working as before and holding on to their homes. Even a couple of empty dwellings on a street can very quickly deteriorate and become a negative presence in the neighborhood, at the least driving down prices further, sometimes attracting crime. Untended pools can allow pests to breed. Many animals have been abandoned and shelters report overflowing traffic. The resulting impacts on local governments have been particularly visible, as property tax assessments have fallen and revenues have also gone south.

    Less obvious is the impacts on home owner associations [HOAs], whose revenues have also taken a hit, albeit for rather different reasons. For the most part, HOA dues are not a function of the value of the home but rather the need to cover the costs of maintaining the common interests of the association: landscaping, security and so forth. These tend to be fixed, even if the values of the homes collapse, and may even rise if dwellings are empty and untended.

    Many HOAs, especially in the newer metropolitan areas like Phoenix and Las Vegas where foreclosures have been most concentrated, have taken a beating because the number of households paying into the association has been depleted, quite badly in some instances. The problem seems, from press reports, to cover the economic spectrum. Low-income first-time buyers may stop paying their dues as an economy measure, while more affluent owners are more likely to have pulled cash from their home and are walking away from their debts. There are also thousands of empty homes that were purchased as investments at the height of the boom and may have never even been occupied.

    The foreclosure debacle is now old news, but the HOA situation is receiving attention because association boards are now aggressively trying to recoup their debts, even from those who have walked away from their mortgages. The debt, they argue, is attached to the individual, not to the dwelling, and is being turned over to collection agencies. Now, this is hardly a novelty. Municipalities have been turning household utility debts over to third parties for years, often with some success, and without a murmur of protest. So why is it different if HOAs do it?

    The answer is that HOAs are extremely unpopular with two vocal constituencies. The first is the academic community, and its hostility is part of the professional opprobrium that is heaped on gated communities, privatization and pretty much anything connected with suburban development. Interestingly, while the design aspects of gated communities have caught the attention of planners and urbanists, relatively few have focused on the dimension of governance. Those that have written on the topic have tended to be critical of private clubs that are seen to exist at the expense of the municipal collective. For what its worth, I don’t think I’ve ever known of an academic colleague who lived in an HOA, in contrast to the bulk of my students, who live in one or grew up there.

    The second constituency is more rowdy. Academics just disdain HOAs, but this group is committed to exposing them as a vast conspiracy to subvert the American way of life. This may sound like another version of contemporary “Teamania” but it is has been around for at least the past decade, during which time I’ve been monitoring Internet posts and the like. To this group, any restriction on personal freedom — from the color of one’s drapes or exterior paintwork through the display of the national flag — is clearly anathema.

    Early this year, my research on neighborliness in HOAs was covered in the local paper, and by the end of the day there were dozens of online posts. In response to the basic finding — that there is little fundamental difference between HOA and traditional neighborhoods — we received a torrent of angry responses. With a single exception, they all dismissed the findings out of hand, using an example of someone’s experience (rarely their own) to prove the point, at least to their satisfaction. One reader even tracked down my email address in order to demand an assurance that no public funds were used to promote this nonsense.

    Like much in contemporary American politics, this leaves me confused. I don’t understand why an exclusive residential association, freely entered into, with explicit rules that are presented at the outset, offering services-for-cash, is un-American. After all, this is in contrast to a municipality that levies taxes for services from which one cannot opt out (if one has no children in the schools, for instance) and which may not be available to all (such as public transport), and which could easily be seen as a redistributive institution, an example of that socialism we keep hearing so much about.

    For the record, I am happy to pay my property taxes for services I don’t receive — its just part of the social contract. Nor do I live in an HOA. But I can understand why our research indicates that most people who live in them do prefer them (and, for example, often move from one HOA to another). Rather than displaying the angst of those who seem to get nervous if anyone tries to step on their toes, these residents embrace belonging to a small polity in which they have a voice. And we should remember that rules, like fences, make good neighbors. As these neighborhoods become more diverse, traditional and non-traditional households alike can find reassurance in the behavioral conformity demanded of neighbors by an HOA.

    This brings us back to the recent stories about management boards ‘hounding’ those who have not paid their dues. Similar accounts have shown up for years, and the thrust is always the same: punitive, out-of-control boards attack those already in financial distress. There is clearly a lot of the latter to go round, but it’s hard to see why HOAs are much different than any other organization that is looking at a handful of bad debts. Are the HOAs the victims here? Absolutely not. Many embraced the housing bubble, and permitted speculators to buy in, even though they had no intention of living in the properties. At the height of the madness, up to one third of all housing transactions in Phoenix were initiated by out-of-state buyers who drove up home prices precipitately, and eventually caused the median house price to double. This has since corrected. All CC&Rs (the rules of the HOA) that I have seen dictate however that the purchaser must live in the property and that rental units are not permissible. So, like all the other players, the HOA boards liked the price increases so much that they ignored their own rules and looked the other way, a lapse for which they are now paying the price.

    Still, it would be a mistake compounding a mistake to climb on the anti-HOA bandwagon, now joined by the ACLU, which has recently joined the fray over a fight about a homeowner’s right to fly the Gadsden flag (motto: “Don’t step on me”). Libertarians should recognize that no-one has ever been forced to live in an association and that whipping up the wrath of state legislatures to control HOAs is a bad idea: it encourages even more government intervention, and it messes with the neighborhood, a form of governance that the vast majority rightly supports, even in HOAs.

    Andrew Kirby has written about HOAs on several occasions, including the 2003 edited volume “Spaces of Hate”. He most recently wrote about ‘The Suburban Question’ on this site in February.

    Photo by monkiemag

  • The Livable Communities Act: A Report Card

    With much fanfare, the Banking Committee of the United States Senate approved the Livable Communities Act (S. 1619, introduced by Democratic Senator Dodd of Connecticut). A purpose of the act is expressed as:

    …to make the combined costs of housing and transportation more affordable to families.

    The Livable Communities Act would provide financial incentives for metropolitan areas to adopt “livability” policies, which are otherwise known as “smart growth,” “growth management” or “compact city” polices.

    “Livability” is the latest rallying cry for planners who want to draw lines around urban areas and force people out of their cars and into denser housing. Secretary of Transportation Ray LaHood has defined livability as “if you don’t want an automobile, you don’t have to have one.” This meaningless slogan presumes that people are forced to have cars. If you are rich enough, you can live without a car on the Upper East Side of Manhattan or Chicago’s Gold Coast. If you are poor enough, you cannot afford a car, which means fewer job prospects and higher retail prices from merchants serving a captive market.

    Perhaps someday we will be beamed from place to place as in Star Trek. However, in the interim, a serious alternative to the car – hopefully a far cleaner, more efficient version – does not loom on the horizon. For all but a privileged few, cars and the quality of life and cars will remain “joined at the hip”. This is why research shows a strong correlation between the automobile access in an urban area and economic growth.

    The Report Card

    It is not premature to issue a report card on the Livable Communities Act, since the effect of its favored policy prescriptions are already well known. Metropolitan areas more inclined toward the act’s menu of livability policies (such as Los Angeles, San Francisco, Portland, Washington and others) are compared to other metropolitan areas (such as Dallas-Fort Worth, Atlanta, Indianapolis, Kansas City and others). Our analysis shows that, for most people, livability policies produce less livability, in terms of higher costs and a lesser quality of life, especially in greater traffic congestion, longer travel times and more exposure to air pollution (Note 1). They will therefore be referred to as “so-called” livability policies.

    Housing Affordability: The Livable Communities Act seeks to make housing more affordable. Sadly, the record associated with such policies in terms of affordability is nothing short of dismal.


    The Livable Communities Act receives an “F” for home ownership affordability


    House prices are considerably higher in the metropolitan areas more inclined toward so-called livability policies. The so-called livable metropolitan areas have nearly 50% higher house prices, after adjustment for incomes (Figure 1). If house prices were at the same level relative to incomes as in the other metropolitan areas, the median price would be $80,000 less. This would mean about $5,000 less in annual mortgage payments. In the least affordable so-called livable metropolitan areas, fewer than 40% of households can afford the median priced house (Los Angeles, New York and San Jose). In all the other metropolitan areas, more than 70% of households can afford the median priced house (Note 2). It takes a lot of gasoline to equal that difference.

    The Livable Communities Act receives an “F” for rental affordability.

    Rents are also higher in the so-called livable metropolitan areas (Figure 2). The US Department of Housing and Urban Development “fair market rents,” (estimated at the 40th percentile of the rental market, including utilities) for a two bedroom apartment was 25% higher in the so-called livable metropolitan areas in relation to the fourth household income quintile (top of the bottom 25%).

    Why Housing is More Expensive in Livable Metropolitan Areas: The land use regulations typical of the so-called livable metropolitan areas force house prices up by prohibiting development on most available land (urban growth boundaries), imposing building moratoria or, in some cases, by requiring excessively large suburban lot sizes, making it impossible to build housing that is affordable to middle income households. All things being equal, prices increase where supply is restricted, as indicated by a broad economic literature.

    Transportation

    According to the findings in the Livable Communities Act the nation wastes 4.2 billion hours in traffic congestion and loses $87 billion annually from the costs of congestion. The congestion cost is principally the cost of time.

    Transportation Costs: Since commuting by transit nearly always takes longer than commuting by car (twice as long in 2007), any switch to transit is likely to increase costs (lost time is lost time, whether in a train or in a car). The balance of congestion costs are in excess fuel consumption, which would likely also increase under the so-called livability policies, because higher densities produce greater traffic intensities (this from Sierra Club based research), which means more congestion and slower travel speeds, which reduces fuel economy.

    The Livable Communities Act receives an “F” for transportation affordability

    Transportation Quality of Life: So-called livability policies worsen traffic congestion and air pollution. This is indicated by the latest INRIX traffic scorecard showing that average travel delays during peak travel periods are nearly 75% greater in the so-called livable metropolitan areas (Figure 3). Federal Highway Administration data indicates that the intensity of traffic is more than one-third higher in the so-called livable metropolitan areas (Figure 4)


    The greater traffic intensity also has negative health impacts. The American Heart Association noted that being close to congested roadways increases the likelihood of heart attack and stroke. The American Heart Association cites a study indicating that “a person’s exposure to toxic components of air pollution may vary as much within one city as across different cities.” Obviously, such exposure will be greater where traffic densities are higher.

    The Livable Communities Act receives an “F” on transportation related quality of life issues.

    Consumer Preferences

    In its findings, the Livable Communities Act says that the demand of new housing in dense, walkable (so-called “livable”) areas is 15 times the supply. This misses the extensive overbuilding of dense, walkable communities that ended in the huge condominium bust in Portland, Seattle, Los Angeles, Miami, Atlanta, Chicago and elsewhere. The supply of such housing exceeds the demand, particularly at the current price points.

    Consumer preferences are not revealed by planners’ delusions from surveys people answer in the abstract. For example, most people want shorter commutes, but they vastly prefer single family houses to apartments. In the real context of issues like costs, living space, or schools, people express their priorities.

    The “litmus” test of so-called livability is what people do, not what they say they might do. Households continue to vote with their cars and are moving away from so-called “livable” areas. According to 2009 domestic migration data compiled by the Bureau of the Census:

    • The so-called livable metropolitan areas lost more than a net 3,140,000 residents to other areas of the nation, while other metropolitan areas gained more than 1,000,000 and smaller areas gained nearly 2,000,000 (Figure 5).
    • Nearly 3,500,000 residents left the core counties of the so-called livable metropolitan areas for other parts of the nation, while the suburbs gained 340,000 residents.
    • In the other metropolitan areas, more than 1,000,000 residents left the denser core counties, while the suburbs gained 2,300,000 (Figure 6).


    The Livable Communities Act receives an “F” for consistency with consumer preferences

    The Report Card: Not Livable at All

    The Livable Communities Act report card is shown below. In other words, if enacted, it is likely to produce a failing grade for families even if it wins straights A’s with planners, academics and inner city developers.

                                     Report Card

    Livable Communities Act

    Subject

    Grade

    Home Ownership Affordability

    F

    Rental Affordability

    F

    Transportation Affordability

    F

    Transportation Quality of Life

    F

    Consistency with Consumer Preferences

    F

    Overall Grade

    F

    Additional Comments: The favored policies would reduce mobility to major parts of the metropolitan area, which would reduce access to potential employment opportunities and retail establishments with lower prices.

    Note 1: The analysis covers metropolitan areas with more than 1,000,000 population. The “so-called” livable metropolitan areas are classified as those with “more restrictive” land use regulation by Demographia. The other metropolitan areas have less restrictive land use regulation. See note 7 of http://www.demographia.com/db-overhang.pdf.

    Note 2: Calculated from the National Association of Homebuilders-Wells Fargo Housing Opportunity Index.

    Wendell Cox is a Visiting Professor, Conservatoire National des Arts et Metiers, Paris and the author of “War on the Dream: How Anti-Sprawl Policy Threatens the Quality of Life

    Photo: Overbuilding Dense Walkability in Miami (photograph by author)

  • City of Austin Approves Big Greenfield Development

    Despite its smart growth policies, the city of Austin has approved a new development on the urban fringe that will include new detached housing starting at $115,000.

    Austin is the third fastest growing metropolitan area with more than 1,000,000 residents in the United States, following Raleigh, North Carolina and Las Vegas. The city of Austin accounted for 53% (672,000) of the metropolitan area’s 1.27 million population in 2000, but has seen more than 70% of the growth since that time go to the suburbs. Now the metropolitan area has 1.65 million people, and the city has 785,000.

    The Austin metropolitan area managed to experience only modest house price increases during the housing bubble, though other metropolitan areas in Texas (Dallas-Fort Worth, Houston and San Antonio) did even better (see the Demographia International Housing Affordability Survey). Austin’s Median Multiple (median house price divided by median household income) peaked at 3.3, slightly above the historic maximum norm of 3.0. Like other Texas markets, there has been little price decline during the housing bust, illustrating the lower level of price volatility and speculation identified by Glaeser and Gyourko with less restrictive land use regulation. This stability has helped Texas weather the Great Recession better than its principal competition, the more intensely regulated states of California and Florida.

    The city of Austin, however, is rare in Texas for generally favoring the more restrictive (smart growth) land use policy devices that have been associated with the extreme house price escalation in California, Florida, Portland, and many other metropolitan areas. The city’s freedom, however, to implement the most draconian policies and drive house prices up is severely limited by far less restrictive land use policies in the balance of its home county (Travis), neighboring Williamson County (usually among the fastest growing in the nation), Hayes County and the other counties in the metropolitan area.

    Austin is competing. This is illustrated by the recent Austin city council action to approve a new “mega” development on the urban area’s eastern fringe that could eventually add 5,000 new houses, town houses and apartments. The first phase will be 350 detached houses that the developer indicates will be priced from $115,000 to $120,000 (including land), an amount less than a building lot San Diego, Los Angeles, Vancouver and Australia.

    By comparison with other developments in the Austin area, however, these houses may be expensive. One home builder is currently advertising new detached houses, only 7 miles from downtown Austin for $90,000. These are not the least expensive in Texas. Detached houses in Houston are being advertised for $79,000.

    A case study in the 3rd Annual Demographia International Housing Affordability Survey showed that the median income Austin household could purchase the median priced house for 11 years less income than in Perth, Australia (this includes mortgage interest). While both Austin and Perth have been growing rapidly, Austin’s faster growth is evidence of stronger demand, which, all things being equal, would have been expected to drive house prices up more than in Perth. But, with more restrictive land use regulation, all things are never equal.

  • What’s Behind China’s Big Traffic Jam

    The world press has been fixated on the “Beijing” traffic jam that lasted for nearly two weeks. There is a potential lesson here for the United States, which is that if traffic is allowed to far exceed roadway capacity, unprecedented traffic jams can occur.

    The Inner Mongolia Traffic Jam: First we need to understand that this was not a “Beijing” traffic jam at all,or even on the outskirts of Beijing. The traffic jam came no closer to Beijing than 150 miles (250 kilometers) away, beyond the border of the city/province of Beijing, through the province of Hebei and nearly to the border of Inner Mongolia. The traffic jam then extended for more than 60 miles (100 kilometers) from near the Inner Mongolia border to Jingxi, in the region/city of Ulanqab. In reality this would be like calling a New York City traffic jam something that originated from Springfield, Massachusetts to Boston’s I-495 beltway (Figure 1).

    However, even the New York City example understates the complexity of the Chinese traffic jam. Beijing, China’s national capital, is one of the world’s largest urban areas (with a population of nearly 14 million). The city is situated at the northwestern limit of the densely populated part of China (which is called “China Proper”) that runs from Manchuria in the north to Yunnan in the south.

    Beijing’s urbanization ends at the mountains less than 30 miles from the Forbidden City, Beijing’s core. The area beyond the mountains, through which the Great Wall runs, possesses only intermittent and generally minor urbanization. The area is dominated by grassland, and some rice farming. In this environment, it is not surprising that there were few alternatives for traffic to the G-110 Expressway (freeway), just as there would be few alternatives for traveling between Casper and Cheyenne, Wyoming on Interstate 25.

    Continuing the I-25 comparison, the Inner Mongolian traffic jam more closely resembled traffic destined for Denver, with the congestion stretching from north of Cheyenne for another 60 miles, not far from the south end of the Powder River Basin, America’s largest coal producing region. This is a particularly appropriate comparison, because the type of traffic that caused the Inner Mongolian jam, coal trucks, would similarly jam I-25, were it not for the high-capacity freight rail system that moves most of the coal from the Powder River Basin to the nation’s electricity generation plants in the Midwest, East and South.

    Like Interstate 25, the G-110 Expressway is a high quality divided and grade separated four lane road. As with Wyoming’s I-25, Inner Mongolia has an old 2-lane road (National Route 110) that parallels the G-110 for much of the way. This is not a viable alternative for the truck traffic volumes that are needed to supply the megacity of Beijing with its electric power.

    Beijing’s First World Traffic: The Beijing city commission has announced that traffic flows continue to slow in Beijing. In the first half of 2010, the average speed dropped to 14 miles per hour (24 kilometers per hour). This is despite the fact that the urban area has a world class expressway system, with a fifth ring expressway (beltway) mostly completed (Note 1) and radial expressways feeding the inner areas. The surface arterial system in the inner area consists of a dense network of wide streets, providing capacity that certainly exceeds that of the city of Chicago or the four highly urbanized boroughs of New York, Manhattan, Brooklyn, the Bronx, and Queens (Note 2).

    Beijing’s inner area traffic congestion is like that of New York City. The population density is 30,000 people per square mile (the approximate density also of the four New York boroughs), too high to move the volume of traffic over a freeway and expressway system. Higher population densities are associated with greater traffic congestion, slower speeds, stop and go traffic and more intense pollution. Beijing and New York share all of these conditions.

    There is a perception that the traffic situation could become substantially worse in Beijing, and that could well be the case. However, it is surprising that the Bejing (the city/province) is already well along in private vehicle ownership and use. Beijing has achieved a car ownership rate almost equal to that of New York City’s dense boroughs. In 2008, the dense boroughs of New York City had 0.52 cars per household, while Beijing had achieved a 0.51 rate. One report now places Beijing’s car ownership one third higher than in 2008, which would place Beijing’s car ownership rate 20% above that of New York City.

    By 2008, Beijing already had 1.5 times as many drivers per household as New York City’s dense boroughs (Figure 2). The difference appears to be in commercial drivers licenses, which account for nearly one-half of Beijing’s 9.4 million driver’s licenses. With the coal truck traffic and heavy truck traffic to the port of Tianjin, little more than 100 miles (160 kilometers) away, it is possible that trucks comprise a higher share of the traffic volume in Beijing than in New York City (Note 3).

    Local authorities are seeking to reduce the traffic congestion problem by building one of the world’s largest Metro (subway) systems. By the middle of the decade, nearly 350 miles (561 kilometers) should be open. Some lines will extend to outside of the fifth ring road, where much of the population growth is occurring. The Beijing Metro, like that of Mexico City, has been designed to better serve the contemporary urban area. Both are characterized by a concentration of grid routes and less by radial routes. Beijing also has ring routes. This design is especially appropriate for Beijing, which as is typical for many large Asian urban areas and unlike New York, Chicago or Hong Kong, has a decentralized core. Large office buildings in the center are more sparsely spread around a larger area, larger than these concentrated central business districts. Yet, even with this appropriate route design, the decentralization of retail and office activity necessitates time-consuming transfers that can make cars faster, even in Beijing’s traffic.

    China is also encouraging the use of electric cars, subsidizing buyers willing to switch from cars powered by fossil fuels. This will not ease traffic congestion, but it will reduce air pollution.

    At the same time, a period review of traffic conditions on the Internet will show Beijing’s worst traffic congestion to be concentrated in the high density core while in the much less dense expanding suburbs, traffic conditions are considerably better. Additionally, there is discussion of a seventh ring road and Beijing officials continue to improve their roadway network. As in US urban areas, Beijing’s continued decentralization could allow traffic to eventually be managed. Economists Peter Gordon and Harry W. Richardson have found that “suburbanization has been the dominant and successful mechanism for reducing congestion.”

    Clearing the Traffic: Meanwhile, there are reports that authorities have eased the traffic jam in Inner Mongolia. A longer term solution might be to add a couple of additional lanes in each direction. This should not be too difficult in a nation that by the end of the year will have nearly as many miles of freeway (43,000 or 70,000 kilometers) as the original US interstate system and will probably lead the world early in the next decade. This is a key to improving the competitiveness of Chinese urban areas. Sufficient roadway investment to handle growing travel demand will be just as important to maintain the competitiveness of US urban areas.

    —-

    Note 1: Beijing has six ring roads, however the first is the arterial road surrounding the Forbidden City, which is not an expressway.

    Note 2: Staten Island is excluded because its urban form is principally that of a post-war suburb, with a much lower population density.

    Note 3: This assumes comparability of data, which may not be fully reliable due to incomplete information.

    —-

    Wendell Cox is a Visiting Professor, Conservatoire National des Arts et Metiers, Paris and the author of “War on the Dream: How Anti-Sprawl Policy Threatens the Quality of Life

    Photo of Beijing Fourth Ring Road by archlife

  • Australia 2010: Unstable Politics in a Prosperous Country

    2010 has been something of an annus mirabilis in Australian politics. On 24 June a prime minister was dumped before facing the voters a second time. This was the first time ever for such an early exit. Then the election on 22 August produced a “hung parliament”, an outcome not seen since the 1940s. Having fallen short of enough seats to form government, the major parties are scrambling for the support of four independents and one Green in the House of Representatives.

    If this looks like the politics of a nation mired in economic upheaval, the reality is far different. Australia was one of a handful of advanced countries to avoid recession during the financial crisis. The unemployment rate never rose much above 5 per cent. For some economists, Australia is “the wonder from down under”.

    So why did the Labor government, elected in 2007, fall apart? There was certainly a lack of governing experience after eleven years in opposition. But in a broader sense, the political class is struggling to cope with Australia’s increasingly regionalised economy, and the divergent sources of its new-found prosperity.

    Like many industrialised countries, Australia passed through a seemingly intractable malaise in the 1970s. The country’s predicament appeared worse than that of more diverse and innovative economies like the United States. Relying on agricultural and mineral exports, legacies of a colonial past, Australia’s manufacturing base was inward-looking, outmoded and sclerotic. Disparaging assessments like that of former Singapore Prime Minister Lee Kwan Yew – Australians were destined to be “the poor white trash of Asia” – were common. Some fretted about “the Argentine route”, a country failing to diversify its economy and sliding down world rankings of GDP per capita. As transformed manufactures and high-tech products gobbled up an increasing share of world trade, Australia seemed stuck in the slow lane of commodity exports.

    And then came the 1980s. Protective barriers were slashed, the currency was floated, the financial system was opened up to foreign banks and state-owned agencies were sold off or treated to radical micro-economic reform. By the mid-2000s, the contours of the economy had changed. Activities such as business and property services rose from 10 to almost 15 per cent of GDP over the decade to 2006. Meanwhile manufacturing declined from 15 to 12 per cent. The new economy was dominated by services, now accounting for 68 per cent of GDP. Rather than drag down the economy, however, mining enjoyed parallel growth, from 4.5 to 8 per cent in the same period. China’s explosive arrival on the world scene shifted commodity exports into a very fast lane. These developments set Australia on a growth path that few could have foreseen in the 1970s. A small economy in relative terms to countries like China and the United States, it has evolved into a series of distinct geographic regions.

    The booming commodities export sector, dominated by mining, is concentrated in the northern and western states of Queensland and Western Australia, which account for 74 per cent of onshore mining production. Business and property services are concentrated in the south-eastern states of New South Wales and Victoria, specifically the inner precincts of Sydney and Melbourne, the nation’s emerging global cities. Together, these cities host around 50 per cent of Australia’s finance industry jobs. Public sector services, mostly in health and education, figure prominently in the populous south-east, again skewed towards long-established inner-city localities, where the most prestigious institutions are found. Construction, consumer services, including retail, and light manufacturing, fuelled by demand for household goods and building supplies, thrive in the larger metropolitan regions with high rates of immigration and population growth, like outer Sydney and Melbourne, and increasingly south-east Queensland.

    At the end the true driver of the economy lies with commodities. Today mineral resources make up just under 80 per cent of Australia’s commodity trade and around half of all exports (including services). Australia is the world’s leading exporter of coal and iron ore and ranks high other minerals like zinc and aluminium.

    Reaping the China bounty, former Prime Minister John Howard kept the federal budget in surplus and reduced government debt to zero, while handing out tax cuts and family income supplements. This winning combination delivered Howard eleven years in power. Towards the end of his rule, however, strains in the boom economy began to manifest themselves. Skilled labour shortages and the heated property market began to put pressure on inflation and interest rates, contributing to a sense of policy exhaustion in Howard’s later years.

    By 2007, there was a widespread view that the benefits of the resources boom were not being distributed fairly. The service sector professionals of the south-east, especially in the public sector who dominate the national media, began to shift to Labor as did outer suburban workers, who saw the dream of home ownership slipping beyond their reach. Forced to compete for investment in the open economy, south-eastern state governments, controlled by Labor, were constrained to keep taxes low. An ever larger proportion of their budgets was channelled into health and education services, partly due to close links with powerful public sector unions. There was little left to pay for urban infrastructure on the booming fringes.

    In response, infrastructure costs were shifted onto developers and local government, along with a new set of regulations, and urban consolidation (“smart growth”) was enforced as planning policy, ostensibly to reduce the need for extra resources. These choices reflected the green ideology taking hold in the planning profession, as well as among the professional classes.

    The impact of these measures on housing affordability were disastrous. When the low interest rates of the Howard years began to creep up, the problem turned into a crisis, as the Demographia survey has shown. The property market slowed down, depriving the south-eastern states of even more funds, since property taxes are a significant share of their revenues. This contrasted with conditions in the mining states, prompting the Federal Treasury Secretary to declare Australia a “two speed economy”.

    At the 2007 election, Labor leader Kevin Rudd claimed to have the solutions. Paying lip service to Howard’s fiscal conservatism, he signalled plans to divert mining boom proceeds towards infrastructure and services, including a new deal on health funding and an “education revolution“. Much of this was wrapped up in the rhetoric of climate change, talked up by Rudd as “the greatest moral challenge of our time”. His environmental centrepiece was an Emissions Trading Scheme (cap and trade), a massive revenue raising device for the federal government. In essence it was a mechanism for transferring wealth from the mining states, and their fossil-fuelled economies, to the populous south-east.

    Rudd’s electoral success, and apparent public support for climate action, drove the agenda forward until the crash at Copenhagen. This precipitated a revolt in the opposition Coalition, which replaced ETS supporter Malcolm Turnbull with climate-sceptic Tony Abbott. When Abbott labelled the ETS “a great big new tax on everything“, and blocked its passage in the Senate, public interest in the scheme melted away, particularly in the mining regions. Rudd lost his nerve and shelved it until 2012. For many Australians, he was exposed as a weak leader without the courage of his convictions.

    Rudd refused to give up his dream of redistribution though, turning to Plan B. Having commissioned a review of Australia’s taxation system, he announced a Resource Super Profits Tax, a complex device confiscating up to 40 per cent of mining profits above a threshold. Adopted without consulting the resources industry, it attracted furious opposition from the global mining companies, which launched a powerful advertising campaign against it. Opposition leader Abbott labelled the measure ”a great big new tax on mining”. Opinion polls showed strong opposition to the tax in mining states, and mild support in the south-east. Rudd’s poll ratings fell through the floor. He was soon deposed by his Labor Party colleagues.

    Julia Gillard, the new prime minister, substantially modified the proposal after negotiations with the large miners, but smaller operators remained opposed, along with most of Queensland and Western Australia. Gillard quickly called an election to capitalise on her status as the country’s first female leader. But the legacy of Rudd’s undelivered promises shaped the outcome. Australia’s regional divisions were clearly evident in the voting patterns. Western Australia and Queensland swung to the Coalition, and Queensland proved to be a killing ground, depriving Labor of nine seats. New South Wales also swung to the Coalition, reflecting dissatisfaction with the long-serving state Labor government’s failure to address the infrastructure and housing needs of suburban western Sydney. In contrast, the southern states of Victoria, Tasmania and South Australia swung towards Labor.

    Well over half of Labor’s lost votes moved left to the Greens, who more than doubled their share of the vote, rather than right to the Coalition. Increasing numbers of south-eastern professionals consider the Greens their preferred agent of redistribution. Handing the Greens the balance of power in the Senate, and possibly the House of Representatives (only one seat this time), may prove a better strategy than sticking with a fractured Labor Party. Inevitably though, regional and outer-suburban voters, with their divergent priorities, will react to a green-dominated agenda, which tends to dismiss suburban interests. Over time, and perhaps after the next election, this may mean a shift back to the right and a clear Coalition victory.

    John Muscat is a Sydney lawyer and co-editor of The New City (www.thenewcityjournal.net), a web journal of urban and political affairs.

    Photo by webmink

  • The Housing Bubble: The Economists Should Have Known

    Paul Krugman got it right. But it should not have taken a Nobel Laureate to note that the emperor’s nakedness with respect to the connection between the housing bubble and more restrictive land use regulation.

    A just published piece by the Federal Reserve Bank of Boston, however, shows that much of the economics fraternity still does not “get it.” In Reasonable People Did Disagree: Optimism and Pessimism About the U.S. Housing Market Before the Crash, Kristopher S. Gerardi, Christopher L. Foote and Paul S. Willen conclude that it was reasonable for economists to have missed the bubble.

    Misconstruing Las Vegas and Phoenix: They fault Krugman for making the bubble/land regulation connection by noting that the “places in the United States where the housing market most resembled a bubble were Phoenix and Las Vegas,” noting that both urban areas have “an abundance of surrounding land on which to accommodate new construction” (Note 1).

    An abundance of land is of little use when it cannot be built upon. This is illustrated by Portland, Oregon, which is surrounded by such an “abundance of land.” Yet over a decade planning authorities have been content to preside over a 60 percent increase in house prices relative to incomes, while severely limiting the land that could have been used to maintain housing affordability. The impact is clearly illustrated by the 90 percent drop in unimproved land value that occurs virtually across the street at Portland’s urban growth boundary.

    Building is largely impossible on the “abundance of land” surrounding Las Vegas and Phoenix. Las Vegas and Phoenix have virtual urban growth boundaries, formed by encircling federal and state lands. These are fairly tight boundaries, especially in view of the huge growth these areas have experienced. There are programs to auction off some of this land to developers and the price escalation during the bubble in the two metropolitan areas shows how a scarcity of land from government ownership produces the same higher prices as an urban growth boundary

    Like Paul Krugman, banker Doug French got it right. In a late 2002 article for the Nevada Policy Research Institute, French noted the huge increases auction prices, characterized the federal government as hording its land and suggested that median house prices could reach $280,000 by the end of the decade. Actually, they reached $320,000 well before that (and then collapsed).

    In Las Vegas, house prices escalated approximately 85% relative to incomes between 2002 and 2006. Coincidentally, over the same period, federal government land auctions prices for urban fringe land rose from a modest $50,000 per acre in 2001-2, to $229,000 in 2003-4 and $284,000 at the peak of the housing bubble (2005-6). Similarly, Phoenix house prices rose nearly as much as Las Vegas, while the rate of increase per acre in Phoenix land auctions rose nearly as much as in Las Vegas.

    In both cases, prices per acre rose at approximately the same annual rate as in Beijing, which some consider to have the world’s largest housing bubble. According to Joseph Gyourko of Wharton, along with Jing Wu and Yongheng Deng Beijing prices rose 800 percent from 2003 to 2008 (Figure). This is true even thought we are not experiencing the epochal shift to big urban areas now going on in China.

    The Issue is Land Supply: The escalation of new house prices during the bubble occurred virtually all in non-construction costs such as the costs of land and any additional regulatory costs. It is not sufficient to look at a large supply of new housing (as the Boston Fed researchers do) and conclude that regulation has not taken its toll. The principal damage done by more restrictive land regulation comes from limiting the supply of land, which drives its price up and thereby the price of houses. In some places where there was substantial building, restrictive land use regulations also skewed the market strongly in favor of sellers. This dampening of supply in the face of demand drove land prices up hugely, even before the speculators descended to drive the prices even higher. Florida and interior California metropolitan areas (such as Sacramento and Riverside-San Bernardino) are examples of this.

    Missing Obvious Signs: There are at least two reasons why much of the economics profession missed the bubble.

    (1) Unlike Paul Krugman, many economists failed to look below the national data. As Krugman showed, there were huge variations in house price trends between the nation’s metropolitan areas. National averages mean little unless there is little variation. Yet most of the economists couldn’t be bothered to look below the national averages.

    (2) Most economists failed to note the huge structural imbalances that had occurred in the distorted housing markets relative to historic norms. Since World War II, the Median Multiple, the median house price divided by the median household income, has been 3.0 or less in most US metropolitan markets. Between 1950 and 2000, the Median Multiple reached as high as 6.1 in a single metropolitan area among today’s 50 largest, in a single year (San Jose in 1990, see Note 2). In 2001, however, two metropolitan areas reached that level, a figure that rose to 9 in 2006 and 2007. The Median Multiple reached unprecedented and stratospheric levels in of 10 or more in Los Angeles, San Francisco, San Diego and San Jose- all of which have very restrictive land use and have had relatively little building. This historical anomaly should have been a very large red flag.

    In contrast, the Median Multiple remained at or below 3.0 in a number of high growth markets, such as Atlanta, Dallas-Fort Worth and Houston and other markets throughout the bubble.. Even with strong housing growth, prices remained affordable where there was less restrictive land use regulation.

    Seeing the Signs: Krugman, for his part, takes a well deserved victory lap in a New York Times blog entitled “Wrong to be Right,” deferring to Yves Smith at nakedcapitalism.com who had this to say about the Federal Reserve Bank of Boston research:

    It is truly astonishing to watch how determined the economics orthodoxy is to defend its inexcusable, economy-wrecking performance in the run up to the financial crisis. Most people who preside over disasters, say from a boating accident or the failure of a venture, spend considerable amounts of time in review of what happened and self-recrimination. Yet policy-making economists have not only seemed constitutionally unable to recognize that their programs resulted in widespread damage, but to add insult to injury, they insist that they really didn’t do anything wrong.

    Maybe we should have known better: beware economists bearing the moment’s conventional wisdom.

    ——

    Note 1: The authors cite work by Albert Saiz of Wharton to suggest an association between geographical constraints and house price increases in metropolitan areas. The Saiz constraint, however, looks at a potential development area 50 kilometers from the metropolitan center (7,850 square kilometers). This seems to be a far too large area to have a material price impact in most metropolitan areas. For example, in Portland, the strongly enforced urban growth boundary (which would have a similar theoretical impact on prices) was associated with virtually no increase in house prices until the developable land inside the boundary fell to less than 100 square kilometers (early 1990s). A far more remote geographical barrier, such as the foothills of Mount Hood, can have no meaningful impact in this environment.

    Note 2: William Fischel of Dartmouth has shown how the implementation of land use controls in California metropolitan areas coincided with the rise of house prices beyond historic national levels. As late as 1970, house prices in California were little different than in the rest of the nation.

    Wendell Cox is a Visiting Professor, Conservatoire National des Arts et Metiers, Paris and the author of “War on the Dream: How Anti-Sprawl Policy Threatens the Quality of Life

    Photograph: $575,000 house in Los Angeles (2006), Photograph by author

  • Vancouver: Planner’s Dream, Middle Class Nightmare

    Vancouver is consistently rated among the most desirable places to live in the Economist’s annual ranking of cities. In fact, this year it topped the list. Of course, it also topped another list. Vancouver was ranked as the city with the most unaffordable housing in the English speaking world by Demographia’s annual survey. According to the survey criteria, housing prices in an affordable market should have an “median multiple” of no higher than 3.0 (meaning that median housing price should cost no more than 3 times the median annual gross household income). Vancouver came in at a staggering 9.3. The second most expensive major Canadian city, Toronto, has an index of only 5.2. Even legendarily unaffordable London and New York were significantly lower, coming in at 7.1 and 7.0 respectively. While there are many factors that make Vancouver a naturally expensive market, there are a number of land use regulations that contribute to the high housing costs.

    Vancouver is a unique real estate market: it’s the only major Canadian city that doesn’t experience frigid winters. This makes it a major draw for high skilled, high salary employees. It is also a major destination for wealthy Canadian retirees, who choose to actually spend their winters in Canada. There is little doubt that it is a naturally expensive real estate market. As with coastal California cities, people pay a premium for (in this case relatively) hospitable weather. The proximity to world class skiing, fishing, and hiking are no doubt another factor in the city’s high real estate costs. There is certainly a premium to be paid for living less than two hours away from the world’s best ski resort.

    Moreover, Vancouver has become an appealing real estate market for overseas investors, particularly Chinese nationals. There has been a good deal of news recently about how many of the nouveau riche in China are now looking to Vancouver, rather than Los Angeles or New York as an immigration destination. In absolute dollar terms, Vancouver is still cheaper than either city. This, combined with the more hospitable Canadian immigration system, has made Vancouver so attractive to overseas investors that real estate agents are now organizing house hunting tours for potential Chinese buyers.

    To be sure, geography deserves much of the blame for Vancouver’s high housing costs. But a large chunk of the blame lies with restrictive municipal and provincial land use policies. Since the introduction of the city’s first comprehensive plan in 1929, Vancouver has used various land use regulations to create dense mixed use development in order to protect green space surrounding the city. In 1972, the provincial government passed legislation aimed at protecting BC farmland. This left less than half of the already scarce land in Greater Vancouver off limits to developers. As a result, the city is circled by undeveloped land, referred to as the Green Zone. The Green Zone acts as a de facto urban growth boundary, largely designed to prevent sprawl.

    As a result, Vancouver is one of the few North American cities that have been growing almost exclusively upwards, rather than outwards for the last century. Its narrow streets and lack of a major highway running through the city make it one of the least automobile friendly cities on the continent. Unsurprisingly, Vancouver was ranked the most smart growth oriented city in the Pacific Northwest by the Sightline Institute. Roughly three times more Vancouver residents live in compact neighborhoods as a percentage of the population compared than Portland or Seattle. This arguably makes Vancouver the most smart growth oriented city in North America.

    Smart growth has become a truism for urban planners. Walkable communities with a mix of commercial and residential units combined with strict zoning regulations to encourage transit usage is a formula increasingly prescribed for North American cities. Though many smart growth principles are attractive, there is an strong correlation between heavy land use regulations and housing costs. Using data from the Wharton Residential Land Use Regulation Index (WRLURI), and Demographia’s International Housing Affordability Survey, a simple scatter plot diagram has been included to illustrate this correlation.

    The WRLURI measures the stringency of land use controls imposed on various US jurisdictions by state and local governments. There is a clear correlation between high regulations, and low housing affordability. Though the index does not include Canadian cities, it does include neighboring Seattle. Seattle ranks fifth of 47 cities on the Wharton Index. According to a recent study in Boston College International & Comparative Law Review by David Fox, Vancouver is decades ahead of Seattle in terms of smart growth policies. This means that Vancouver would rank at least fifth in North America on the index, though it is more realistic to assume it would most certainly top the index.

    In addition to smart growth policies, Vancouver also has very stringent inclusionary zoning laws. Inclusionary zoning requires developers to provide a certain number of affordable housing units in any given development. This policy might seem to make the city more affordable, but it functions exactly like rent control. Those fortunate enough to find spaces in the affordable housing units pay less, but the subsidized rent is made up for by higher rent in adjacent units. In a study of inclusionary zoning in California cities, Benjamin Powell and Edward Stringham from the Department of Economics at San Jose State University found that inclusionary zoning imposes an additional $33,000-$66,000 cost on adjacent market rate units.

    There have been some recent policy initiatives that may reduce the cost of housing marginally. In 2004, the city amended its zoning code to permit secondary suites throughout the city. Secondary suites are subdivided units of owner occupied homes that are used as rental units. This zoning change brought tens of thousands of relatively low cost units into the market. There are currently 120,000 secondary suites in the province. The city recently went one step further to allow homeowners to convert laneway garages into rental units. These units have a maximum of 500 square feet. There are 70,000 homes in Vancouver that are eligible for conversion, though it is unclear how many will take up the offer. This will add to the stock of relatively affordable rental housing in the city, but may not significantly reduce housing costs. In fact, by increasing the revenue generating potential of houses, it may actually increase the cost of purchasing a single dwelling home. After all, if the potential rental income of a single dwelling unit increases, the market price of the unit is likely to do the same. This isn’t necessarily an argument against the policy, though it does underscore the fact that housing costs in Vancouver will never decrease without liberalizing municipal and provincial land use policies.

    In short, the City of Vancouver and Province of British Columbia have chosen to favor compact growth over affordable housing costs. This likely makes the city more attractive to affluents from both the rest of Canada and abroad, but increasingly makes it unaffordable for middle class families. There is certainly some substance to the Economist’s claim that Vancouver is the most livable city on earth. It is a very attractive place for those who can afford it. Nevertheless, creating a city fit only for the wealthiest segments of society and non-families is hardly something to be proud of.

    Downtown Vancouver photo by runningclouds

    Steve Lafleur is a public policy analyst and political consultant based out of Calgary, Alberta. For more detail, see his blog.

  • Year 1959

    Get a glass of wine. Then click on this link, which plays a video called Community Growth, created in 1959.

    Once you’ve seen the video, read on…

    You’re probably sitting with a puzzled look – 1959? Aren’t these the exact same issues that are plaguing us today? Don’t those 1959 developments look like many of today’s latest developments? Even the way they bulldozed through the land and stick-built the homes looks just like the methods used today!

    When I was 7 year old, my mother bought a new white 1959 Chevrolet Impala convertible with a red vinyl interior. This was one of the best designs with those wonderful curved wing-like fins and oblong tail lights. I remember sitting in the front when my mother slammed on the brakes as a child ran in front of the car. Since they did not have seat belts back then, my head flew into the steel dashboard (your probably thinking; ah ha! so that’s why he writes for New Geography). That beautiful Chevy was a coffin in a crash, as witnessed by the following video showing 50 years of safety advances between the 1959 Chevy vs. 2009 Chevy.

    Back then, a 1959 Chevy with 50,000 miles on it was on its last legs, just about broken down, whereas today, a 2009 Chevy with 50,000 miles would be considered just about broken in.

    If a 1959 land development subdivision layout were to crash into (OK, be overlayed upon) a 2009 land development subdivision layout there would be little difference.

    We have written about this in the past, but it bears repeating: Designers look to the ordinances for guidance, and these regulations have been stagnant for about 5 decades (1959. Developers hire designers assuming they will get the best possible layout. Designers look to the six decade old ordinances and assume the minimum dimensions are the optimum ones to maximize density (their clients profits). The layout by minimums will result in cookie cutter monotonous designs. The council and planning commissions admonish the developer for submitting plans that lack character and imagination, yet the developer just followed the regulations that promote such development. And the cycle repeats, and repeats, and repeats for generations upon generations.

    You are reading this article on a computer that is more powerful than any that existed in 1959, or 1969, or possibly even in 1979. If you are older than 60 years old, chances are if this was 1959, you would be dead by now. Advances in health as well as an awareness of what we eat and how we live allow us to live longer happier and more productive lives.

    Technological advancements have touched virtually every product and aspect of our lives – except the neighborhoods we live, work and play within.

    There is something very wrong with this situation, and solving these problems through over densification and forcing a nation into public transportation is taking giant leaps backwards, not towards 1959, but more towards 1859. We posses innovation and technology for the design and building of sustainable future cities without sacrificing the desire for space and personal transportation freedom. This however takes more effort. But isn’t about time we leave 1959 behind?

  • Urban Legends: Why Suburbs, Not Dense Cities, are the Future

    The human world is fast becoming an urban world — and according to many, the faster that happens and the bigger the cities get, the better off we all will be. The old suburban model, with families enjoying their own space in detached houses, is increasingly behind us; we’re heading toward heavier reliance on public transit, greater density, and far less personal space. Global cities, even colossal ones like Mumbai and Mexico City, represent our cosmopolitan future, we’re now told; they will be nerve centers of international commerce and technological innovation just like the great metropolises of the past — only with the Internet and smart phones.

    According to Columbia University’s Saskia Sassen, megacities will inevitably occupy what Vladimir Lenin called the “commanding heights” of the global economy, though instead of making things they’ll apparently be specializing in high-end “producer services” — advertising, law, accounting, and so forth — for worldwide clients. Other scholars, such as Harvard University’s Edward Glaeser, envision universities helping to power the new “skilled city,” where high wages and social amenities attract enough talent to enable even higher-cost urban meccas to compete.

    The theory goes beyond established Western cities. A recent World Bank report on global megacities insists that when it comes to spurring economic growth, denser is better: “To try to spread out economic activity,” the report argues, is to snuff it. Historian Peter Hall seems to be speaking for a whole generation of urbanists when he argues that we are on the cusp of a “coming golden age” of great cities.

    The only problem is, these predictions may not be accurate. Yes, the percentage of people living in cities is clearly growing. In 1975, Tokyo was the largest city in the world, with over 26 million residents, and there were only two other cities worldwide with more than 10 million residents. By 2025, the U.N. projects that there may be 27 cities of that size. The proportion of the world’s population living in cities, which has already shot up from 14 percent in 1900 to about 50 percent in 2008, could be 70 percent by 2050. But here’s what the boosters don’t tell you: It’s far less clear whether the extreme centralization and concentration advocated by these new urban utopians is inevitable — and it’s not at all clear that it’s desirable.

    Not all Global Cities are created equal. We can hope the developing-world metropolises of the future will look a lot like the developed-world cities of today, just much, much larger — but that’s not likely to be the case. Today’s Third World megacities face basic challenges in feeding their people, getting them to and from work, and maintaining a minimum level of health. In some, like Mumbai, life expectancy is now at least seven years less than the country as a whole. And many of the world’s largest advanced cities are nestled in relatively declining economies — London, Los Angeles, New York, Tokyo. All suffer growing income inequality and outward migration of middle-class families. Even in the best of circumstances, the new age of the megacity might well be an era of unparalleled human congestion and gross inequality.

    Perhaps we need to consider another approach. As unfashionable as it might sound, what if we thought less about the benefits of urban density and more about the many possibilities for proliferating more human-scaled urban centers; what if healthy growth turns out to be best achieved through dispersion, not concentration? Instead of overcrowded cities rimmed by hellish new slums, imagine a world filled with vibrant smaller cities, suburbs, and towns: Which do you think is likelier to produce a higher quality of life, a cleaner environment, and a lifestyle conducive to creative thinking?

    So how do we get there? First, we need to dismantle some common urban legends.

    Perhaps the most damaging misconception of all is the idea that concentration by its very nature creates wealth. Many writers, led by popular theorist Richard Florida, argue that centralized urban areas provide broader cultural opportunities and better access to technology, attracting more innovative, plugged-in people (Florida’s “creative class“) who will in the long term produce greater economic vibrancy. The hipper the city, the mantra goes, the richer and more successful it will be — and a number of declining American industrial hubs have tried to rebrand themselves as “creative class” hot spots accordingly.

    But this argument, or at least many applications of it, gets things backward. Arts and culture generally do not fuel economic growth by themselves; rather, economic growth tends to create the preconditions for their development. Ancient Athens and Rome didn’t start out as undiscovered artist neighborhoods. They were metropolises built on imperial wealth — largely collected by force from their colonies — that funded a new class of patrons and consumers of the arts. Renaissance Florence and Amsterdam established themselves as trade centers first and only then began to nurture great artists from their own middle classes and the surrounding regions.

    Even modern Los Angeles owes its initial ascendancy as much to agriculture and oil as to Hollywood. Today, its port and related industries employ far more people than the entertainment business does. (In any case, the men who built Hollywood were hardly cultured aesthetes by middle-class American standards; they were furriers, butchers, and petty traders, mostly from hardscrabble backgrounds in the czarist shtetls and back streets of America’s tough ethnic ghettos.) New York, now arguably the world’s cultural capital, was once dismissed as a boorish, money-obsessed town, much like the contemporary urban critique of Dallas, Houston, or Phoenix.

    Sadly, cities desperate to reverse their slides have been quick to buy into the simplistic idea that by merely branding themselves “creative” they can renew their dying economies; think of Cleveland’s Rock and Roll Hall of Fame, Michigan’s bid to market Detroit as a “cool city,” and similar efforts in the washed-up industrial towns of the British north. Being told you live in a “European Capital of Culture,” as Liverpool was in 2008, means little when your city has no jobs and people are leaving by the busload.

    Even legitimate cultural meccas aren’t insulated from economic turmoil. Berlin — beloved by writers, artists, tourists, and romantic expatriates — has cultural institutions that would put any wannabe European Capital of Culture to shame, as well as a thriving underground art and music scene. Yet for all its bohemian spirit, Berlin is also deeply in debt and suffers from unemployment far higher than Germany’s national average, with rates reaching 14 percent. A full quarter of its workers, many of them living in wretched immigrant ghettos, earn less than 900 euros a month; compare that with Frankfurt, a smaller city more known for its skyscrapers and airport terminals than for any major cultural output, but which boasts one of Germany’s lowest unemployment rates and by some estimates the highest per capita income of any European city. No wonder Berlin Mayor Klaus Wowereit once described his city as “poor but sexy.”

    Culture, media, and other “creative” industries, important as they are for a city’s continued prosperity, simply do not spark an economy on their own. It turns out to be the comparatively boring, old-fashioned industries, such as trade in goods, manufacturing, energy, and agriculture, that drive the world’s fastest-rising cities. In the 1960s and 1970s, the industrial capitals of Seoul and Tokyo developed their economies far faster than Cairo and Jakarta, which never created advanced industrial bases. China’s great coastal urban centers, notably Guangzhou, Shanghai, and Shenzhen, are replicating this pattern with big business in steel, textiles, garments, and electronics, and the country’s vast interior is now poised to repeat it once again. Fossil fuels — not art galleries — have powered the growth of several of the world’s fastest-rising urban areas, including Abu Dhabi, Houston, Moscow, and Perth.

    It’s only after urban centers achieve economic success that they tend to look toward the higher-end amenities the creative-classers love. When Abu Dhabi decided to import its fancy Guggenheim and Louvre satellite museums, it was already, according to Fortune magazine, the world’s richest city. Beijing, Houston, Shanghai, and Singapore are opening or expanding schools for the arts, museums, and gallery districts. But they paid for them the old-fashioned way.

    Nor is the much-vaunted “urban core” the only game in town. Innovators of all kinds seek to avoid the high property prices, overcrowding, and often harsh anti-business climates of the city center. Britain’s recent strides in technology and design-led manufacturing have been concentrated not in London, but along the outer reaches of the Thames Valley and the areas around Cambridge. It’s the same story in continental Europe, from the exurban Grand-Couronne outside of Paris to the “edge cities” that have sprung up around Amsterdam and Rotterdam. In India, the bulk of new tech companies cluster in campus-like developments around — but not necessarily in — Bangalore, Hyderabad, and New Delhi. And let’s not forget that Silicon Valley, the granddaddy of global tech centers and still home to the world’s largest concentration of high-tech workers, remains essentially a vast suburb. Apple, Google, and Intel don’t seem to mind. Those relative few who choose to live in San Francisco can always take the company-provided bus.

    In fact, the suburbs are not as terrible as urban boosters frequently insist.

    Consider the environment. We tend to associate suburbia with carbon dioxide-producing sprawl and urban areas with sustainability and green living. But though it’s true that urban residents use less gas to get to work than their suburban or rural counterparts, when it comes to overall energy use the picture gets more complicated. Studies in Australia and Spain have found that when you factor in apartment common areas, second residences, consumption, and air travel, urban residents can easily use more energy than their less densely packed neighbors. Moreover, studies around the world — from Beijing and Rome to London and Vancouver — have found that packed concentrations of concrete, asphalt, steel, and glass produce what are known as “heat islands,” generating 6 to 10 degrees Celsius more heat than surrounding areas and extending as far as twice a city’s political boundaries.

    When it comes to inequality, cities might even be the problem. In the West, the largest cities today also tend to suffer the most extreme polarization of incomes. In 1980, Manhattan ranked 17th among U.S. counties for income disparity; by 2007 it was first, with the top fifth of wage earners earning 52 times what the bottom fifth earned. In Toronto between 1970 and 2001, according to one recent study, middle-income neighborhoods shrank by half, dropping from two-thirds of the city to one-third, while poor districts more than doubled to 40 percent. By 2020, middle-class neighborhoods could fall to about 10 percent.

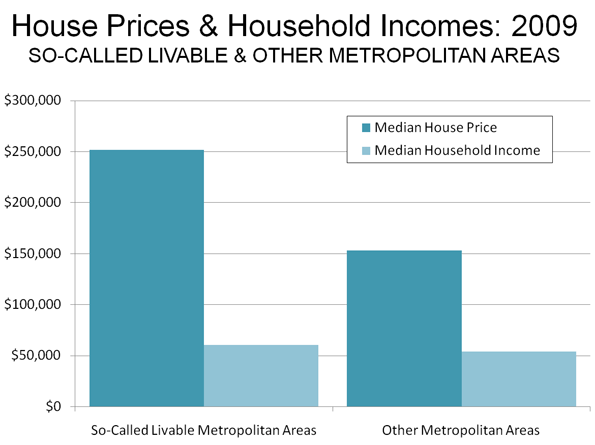
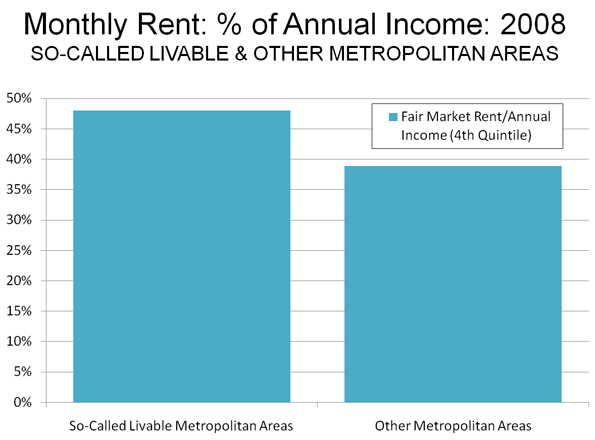
    Cities often offer a raw deal for the working class, which ends up squeezed by a lethal combination of chronically high housing costs and chronically low opportunity in economies dominated by finance and other elite industries. Once the cost of living is factored in, more than half the children in inner London live in poverty, the highest level in Britain, according to a Greater London Authority study. More than 1 million Londoners were on public support in 2002, in a city of roughly 8 million.

    The disparities are even starker in Asia. Shenzhen and Hong Kong, for instance, have among the most skewed income distributions in the region. A relatively small number of skilled professionals and investors are doing very well, yet millions are migrating to urban slums in places like Mumbai not because they’ve all suddenly become “knowledge workers,” but because of the changing economics of farming. And by the way, Mumbai’s slums are still expanding as a proportion of the city’s overall population — even as India’s nationwide poverty rate has fallen from one in three Indians to one in five over the last two decades. Forty years ago, slum dwellers accounted for one in six Mumbaikars. Now they are a majority.

    To their credit, talented new urbanists have had moderate success in turning smaller cities like Chattanooga and Hamburg into marginally more pleasant places to live. But grandiose theorists, with their focus on footloose elites and telecommuting technogeniuses, have no practical answers for the real problems that plague places like Mumbai, let alone Cairo, Jakarta, Manila, Nairobi, or any other 21st-century megacity: rampant crime, crushing poverty, choking pollution. It’s time for a completely different approach, one that abandons the long-held assumption that scale and growth go hand in hand.

    Throughout the long history of urban development, the size of a city roughly correlated with its wealth, standard of living, and political strength. The greatest and most powerful cities were almost always the largest in population: Babylon, Rome, Alexandria, Baghdad, Delhi, London, or New York.

    But bigger might no longer mean better. The most advantaged city of the future could well turn out to be a much smaller one. Cities today are expanding at an unparalleled rate when it comes to size, but wealth, power, and general well-being lag behind. With the exception of Los Angeles, New York, and Tokyo, most cities of 10 million or more are relatively poor, with a low standard of living and little strategic influence. The cities that do have influence, modern infrastructure, and relatively high per capita income, by contrast, are often wealthy small cities like Abu Dhabi or hard-charging up-and-comers such as Singapore. Their efficient, agile economies can outpace lumbering megacities financially, while also maintaining a high quality of life. With almost 5 million residents, for example, Singapore isn’t at the top of the list in terms of population. But its GDP is much higher than that of larger cities like Cairo, Lagos, and Manila. Singapore boasts a per capita income of almost $50,000, one of the highest in the world, roughly the same as America’s or Norway’s. With one of the world’s three largest ports, a zippy and safe subway system, and an impressive skyline, Singapore is easily the cleanest, most efficient big city in all of Asia. Other smaller-scaled cities like Austin, Monterrey, and Tel Aviv have enjoyed similar success.

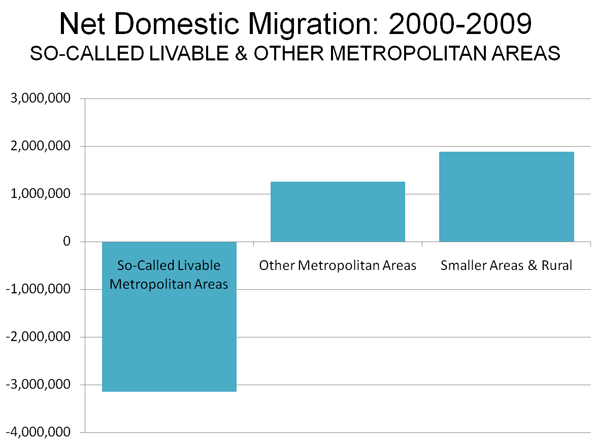
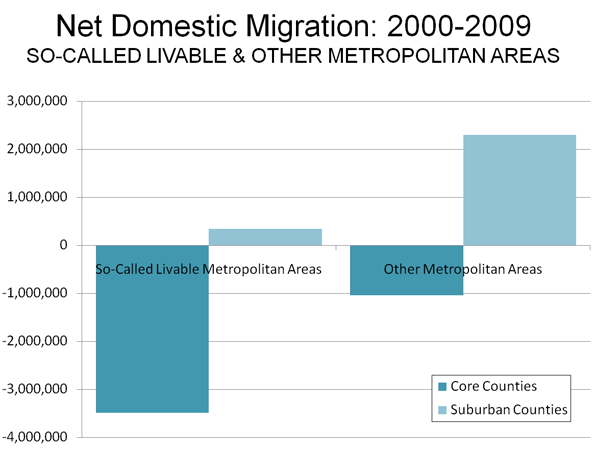
    It turns out that the rise of the megacity is by no means inevitable — and it might not even be happening. Shlomo Angel, an adjunct professor at New York University’s Wagner School, has demonstrated that as the world’s urban population exploded from 1960 to 2000, the percentage living in the 100 largest megacities actually declined from nearly 30 percent to closer to 25 percent. Even the widely cited 2009 World Bank report on megacities, a staunchly pro-urban document, acknowledges that as societies become wealthier, they inevitably begin to deconcentrate, with the middle classes moving to the periphery. Urban population densities have been on the decline since the 19th century, Angel notes, as people have sought out cheaper and more appealing homes beyond city limits. In fact, despite all the “back to the city” hype of the past decade, more than 80 percent of new metropolitan growth in the United States since 2000 has been in suburbs.

    And that’s not such a bad thing. Ultimately, dispersion — both city to suburb and megacity to small city — holds out some intriguing solutions to current urban problems. The idea took hold during the initial golden age of industrial growth — the English 19th century — when suburban “garden cities” were established around London’s borders. The great early 20th-century visionary Ebenezer Howard saw this as a means to create a “new civilization” superior to the crowded, dirty, and congested cities of his day. It was an ideal that attracted a wide range of thinkers, including Friedrich Engels and H.G. Wells.

    More recently, a network of smaller cities in the Netherlands has helped create a smartly distributed national economy. Amsterdam, for example, has low-density areas between its core and its corporate centers. It has kept the great Dutch city both livable and competitive. American urbanists are trying to bring the same thinking to the United States. Delore Zimmerman, of the North Dakota-based Praxis Strategy Group, has helped foster high-tech-oriented development in small towns and cities from the Red River Valley in North Dakota and Minnesota to the Wenatchee region in Washington State. The outcome has been promising: Both areas are reviving from periods of economic and demographic decline.

    But the dispersion model holds out even more hope for the developing world, where an alternative to megacities is an even more urgent necessity. Ashok R. Datar, chairman of the Mumbai Environmental Social Network and a longtime advisor to the Ambani corporate group, suggests that slowing migration to urban slums represents the most practical strategy for relieving Mumbai’s relentless poverty. His plan is similar to Zimmerman’s: By bolstering local industries, you can stanch the flow of job seekers to major city centers, maintaining a greater balance between rural areas and cities and avoiding the severe overcrowding that plagues Mumbai right now.

    Between the 19th century, when Charles Dickens described London as a “sooty spectre” that haunted and deformed its inhabitants, and the present, something has been lost from our discussion of cities: the human element. The goal of urban planners should not be to fulfill their own grandiose visions of megacities on a hill, but to meet the needs of the people living in them, particularly those people suffering from overcrowding, environmental misery, and social inequality. When it comes to exporting our notions to the rest of the globe, we must be aware of our own susceptibility to fashionable theories in urban design — because while the West may be able to live with its mistakes, the developing world doesn’t enjoy that luxury.

    This article originally appeared at Foreign Policy

    Joel Kotkin is executive editor of NewGeography.com and is a distinguished presidential fellow in urban futures at Chapman University. He is author of The City: A Global History. His newest book is The Next Hundred Million: America in 2050, released in February, 2010.

    Photo: Mugley

  • New York Commuting Profile: From Monocentrism to Edgeless City

    The US Bureau of the Census has just released detailed county to county and place (municipality) to place work trip flow tables. This new data is the most comprehensive since the 2000 census and covers 2006 to 2008.

    The county to county data is particularly useful for analysis in the nation’s largest metropolitan area (Note 1), New York. The New York metropolitan area has more than 19 million people and stretches across 6,700 square miles of land area, one half of it in the urban area, which is the urban footprint that includes all areas, including suburbs, in the continuous urbanization (3,350 square miles) and the other half rural (Note 2). This area is composed of 23 counties, which makes far finer grain analysis possible than in Los Angeles, with just two counties or San Diego, where its single county precludes any county based metropolitan area analysis.

    The New York metropolitan area’s counties extend east to west from Suffolk on Long Island to Pike in Pennsylvania and north to south from Putnam in the Hudson Valley to Ocean on the New Jersey shore. Surprisingly, it does not include Fairfield and New Haven counties in Connecticut, which have strong economic ties to the urban area (and which are a part of the larger, Census designated “combined statistical area”). Indeed, major parts of these two counties can be considered part of the New York urban area (Note #3).

    Median house age is a useful indicator of the urban form in segments of a metropolitan area. This examination breaks the New York metropolitan area into rings. The core is New York County (Manhattan, where the median construction date of owned dwellings is 1942). The first ring is the other four boroughs of New York City. The inner ring includes counties outside the city in which the median aged house was built in the 1950s, while the outer ring includes counties in which the median aged house was built in the 1960s or later. The one anomaly is Staten Island (Richmond County) which although politically part of the city of New York, demonstrates a mean housing age closer to that of the outer ring (median construction date 1971). Visually it resembles late suburban New Jersey much more than it does the rest of the city. However, Staten Island’s strong ties to the city justify its classification with the other boroughs.

    Comparatively Centralized: New York is one of the most centralized large urban areas in the high income world,with only Tokyo ranking higher among areas over 5 million population. The Manhattan business district, located to the south of 59th Street is the world’s second largest (following Tokyo’s Yamanote Loop). But in terms of employment density Manhattan has more than double the employment density. What was, at least until recently, indisputably the world’s most spectacular skyline leads many to conclude that nearly everyone works in Manhattan.

    A Highly Decentralized Metropolitan Area: Yet in reality, New York is a highly decentralized metropolitan area. Approximately 74% of employment is outside Manhattan and the jobs are comparatively evenly dispersed among the sectors. There is more employment in the inner ring suburbs than in Manhattan (28%). Even the outer ring is competitive has nearly as many jobs, at 24%. Finally, the balance of the city, the four boroughs, has 22% of the employment (Figure 1).

    Wide Variations in the Jobs-Housing Balance: It is hard to understate the intensity of Manhattan’s central business district employment. Manhattan has 2.71 jobs for every resident worker. An important tenet of modern urban planning theory is to achieve a balance of jobs and housing. Manhattan’s jobs/housing imbalance is certainly the most acute of any county in the United States, yet it is to Manhattan that purveyors of smart growth densification policies are routinely drawn.

    Manhattan’s huge excess of jobs contrasts with employment the rest of the the city, where the jobs-housing balance at the county level is 0.67, the lowest in the metropolitan area. The inner ring suburbs have the highest jobs-housing balance at 0.93, while the outer suburbs have a jobs-housing balance of 0.87 (Figure 2), nearly one-third higher than the non-Manhattan boroughs (three of which are more dense than any major municipal jurisdiction in the nation). The city’s strongest jobs-housing balance is in Brooklyn (Kings County), at 0.72, which is lower than all of the suburban counties except for the most remote (Pike, Putnam and Sussex).

    Manhattan’s Impact: Diminishing Rapidly with Distance: There is no doubt that Manhattan remains the core of the New York economy, but that is less true the further you go out. While nearly 70% of the core’s workers commute from outside Manhattan, the employment influence of Manhattan drops off like the temperature falls the further you get away from a fireplace.

    86% of Manhattan’s resident workers have jobs in Manhattan, but only 35% of workers living in the city’s other boroughs work in Manhattan. This falls off to 14% in the inner suburban counties and 6% in the outer suburban counties (Figure 3). In Sussex County and Ocean County, New Jersey, only 2% of resident workers commute to Manhattan.

    Working Close to Home: At the same time a larger number of resident workers outside Manhattan work in their home counties than work in Manhattan. In the balance of the city, 46% of workers have jobs in the same counties. The inner suburban counties employ 56% of their resident workers, while the outer suburban counties employ 63%. Overall, 58% of New Yorkers work in their county of residence, more than double the share that work in Manhattan (Figure 4). In Richmond County (Staten Island), Suffolk County and Rockland counties in New York and Pike County, Pennsylvania, more than 80% of jobs are filled by local residents.

    Local Workers Generally Come from the Same Counties: A review of the residential location of workers by job location reinforces the dominantly local nature of commuting in New York. Overall, 56% of jobs are filled by residents of the same county. The figure is the highest in the outer ring suburban counties, at 73%. The inner ring suburban areas draw 60% of their workers from the same county, while the balance of the city draws 69%. In Manhattan, with its seriously out of balance jobs and housing, just 32% of the jobs are filled by it residents (Figure 5).

    Dispersion: Past and Present. All of this is a huge change from a half-century ago. In 1956 (according to data in the classic Anatomy of A Metropolitan Area, by Edgar M. Hoover and Raymond Vernon), Manhattan accounted for 43% of the metropolitan area’s employment (1950 metropolitan definition). Since that time, employment has fallen substantially in Manhattan and risen elsewhere. There have been gains in the outer boroughs, related principally to the strong population growth Queens and Staten Island. There were also gains in the inner suburban counties. The strongest gains were in the outer suburban counties (Figure 6).

    The dispersion is continuing. As Ed McMahon and I showed in Empire State Exodus, there is considerable migration from New York to Pennsylvania, as people are moving to metropolitan areas such as Allentown and Wilkes-Barre. Obviously, as the modest level of commuting from the outer counties of metropolitan New York indicates, relatively few of these people are commuting to Manhattan. This impression may be more a product of the fact the Manhattan-based media only recognizes workers when they actually make it into town; those who stay in the periphery, it seems, might as well live on another planet.

    New York, with as by far the strongest central business district in the nation, still has moved from virtual monocentrism, to the Edge Cities polycentrism of Joel Garreau and increasingly even to the amorphous Edgeless Cities employment dispersion of Robert Lang. The strong core continues to regenerate, but no longer exerts anything like its former dominant influence.

    ——-

    Note 1: For complete data.

    Note 2: For a description of urban terms (metropolitan area, urban area, etc).

    Note 3: Demographia World Urban Areas includes the continuous urbanization of southwestern Connecticut as a part of the New York urban area.

    ——-

    Table 1
    COMMUTING IN THE NEW YORK METROPOLITAN AREA (2006-2008): SUMMARY BY GEOGRAPHIC RING
    RINGS Ring Jobs/Housing Balance (Jobs per Resident Worker) Workers Employed in Residence County Share of Jobs Filled by County Residents Workers Employed in New York County (Manhattan) Average One-Way Work Trip Time (Minutes): Residence Average One-Way Work Trip Time (Minutes): Workplace Median Year Owned Housing Built
    NYC: Manhattan 1 2.719 86.3% 31.7% 86.3%                30.3                49.1 1942
    NYC: Balance 2 0.674 46.4% 68.8% 35.6%                42.0                37.3 1939-1971
    Inner Ring 3 0.927 56.0% 60.4% 14.4%                30.5                29.1 1950-1956
    Outer Ring 4 0.870 63.1% 72.5% 6.2%                31.3                26.0 1967-1983
    New York MSA 1.000 57.6% 57.6% 26.1%                34.5                35.5 1955
    Derived from American Community Survey data (2006-2008)
    Note: MSA work trip times (residence and work location) differ because commuters from outside the MSA are included


    Table 2
    COMMUTING IN THE NEW YORK METROPOLITAN AREA (2006-2008): SUMMARY BY COUNTY
    COUNTIES Ring Jobs/Housing Balance (Jobs per Resident Worker) Workers Employed in Residence County Share of Jobs Filled by County Residents Workers Employed in New York County (Manhattan) Average One-Way Work Trip Time (Minutes): Residence Average One-Way Work Trip Time (Minutes): Workplace Median Year Owned Housing Built
    New York Co., NY 1 2.719 86.3% 31.7% 86.3%                30.3                49.1 1942
    Bronx Co., NY 2 0.676 44.3% 65.6% 36.8%                41.1                35.7 1950
    Kings Co., NY 2 0.721 51.2% 71.0% 36.7%                42.3                39.0 1939
    Queens Co., NY 2 0.645 42.4% 65.7% 36.0%                42.0                37.5 1949
    Richmond Co., NY 2 0.585 47.3% 80.8% 26.3%                42.7                29.8 1971
    Bergen Co., NJ 3 0.960 56.7% 59.1% 15.0%                29.3                27.2 1956
    Essex Co., NJ 3 1.052 53.6% 50.9% 9.7%                30.8                31.8 1953
    Hudson Co., NJ 3 0.892 47.1% 52.8% 23.6%                32.4                35.1 1950
    Passaic Co., NJ 3 0.797 45.3% 56.8% 4.3%                27.0                28.0 1954
    Union Co., NJ 3 0.969 50.7% 52.3% 7.1%                33.0                27.6 1954
    Nassau Co., NY 3 0.884 59.1% 66.8% 14.8%                31.6                30.0 1954
    Westchester Co., NY 3 0.928 67.3% 72.6% 19.9%                33.6                27.7 1955
    Hunterdon Co., NJ 4 0.736 49.5% 67.2% 3.7%                31.4                28.2 1978
    Middlesex Co., NJ 4 0.943 58.5% 62.0% 7.7%                26.9                25.8 1968
    Monmouth Co., NJ 4 0.880 63.4% 72.0% 8.2%                33.2                23.8 1970
    Morris Co., NJ 4 1.097 58.7% 53.5% 5.4%                29.4                31.2 1967
    Ocean Co., NJ 4 0.723 63.4% 87.7% 2.0%                31.1                21.3 1977
    Somerset Co., NJ 4 0.988 46.7% 47.3% 5.6%                31.0                31.1 1978
    Sussex Co., NJ 4 0.565 44.5% 78.8% 2.3%                38.2                23.7 1972
    Putnam Co., NY 4 0.441 30.9% 70.1% 8.0%                37.0                24.4 1967
    Rockland Co., NY 4 0.763 61.2% 80.1% 12.0%                29.8                25.1 1969
    Suffolk Co., NY 4 0.872 76.2% 87.4% 5.7%                29.8                23.5 1967
    Pike Co., PA 4 0.574 45.9% 80.0% 4.6%                44.1                25.2 1983
    New York MSA 1.000 57.6% 57.6% 26.1%                34.5                35.5 1955

    ——-

    Wendell Cox is a Visiting Professor, Conservatoire National des Arts et Metiers, Paris and the author of “War on the Dream: How Anti-Sprawl Policy Threatens the Quality of Life

    Photo: Levittown (Nassau County): Inner Suburban (photo by author)