Category: planning

  • The Urbanist’s Guide to Kevin Rudd’s Downfall

    The political execution of Prime Minister Kevin Rudd by his own Australian Labor Party colleagues was extraordinary, the first time a prime minister has been denied a second chance to face the voters.

    According to the consensus in Australia’s mostly progressive media establishment, Rudd fell victim to his “poor communication skills”, a somewhat Orwellian take since until recently he was hailed as a brilliant communicator. What went wrong?

    Certainly, Rudd’s style of communication was a factor. Yet the media’s disjointed interpretations avoid what, for them, is an inconvenient truth. As much as any defects in the man himself, Rudd’s linguistic meltdown can be traced to deep socio-economic divisions wracking today’s Australian Labor Party.

    Australia has its own version of the American red and blue state dichotomy. But with a much smaller, highly urbanised population, and only six states, the social fault line runs through major metropolitan regions rather than state boundaries. Left with a fractured support base, federal Labor often struggles to hold onto majority support. Rudd clearly underestimated the persisting social divide, and his obsession with a media driven solution was disastrous.

    In Australia, post-war suburbanisation and gentrification played out differently than in the US. Since in the 1970s, Australian cities have experienced a broad geographic sorting along class lines. On the one hand, rising land values and car ownership dispersed the old industrial core, and its working class population, to the middle and outer suburbs. On the other, a booming generation of university graduates, many immersed in the counter-culture, and employed in expanding government agencies, flooded into inner-city tenements.

    Lacking the racial frictions of some American cities, and typically adjacent to attractive harbour foreshores (Australia’s major cities are all coastal), these nineteenth century streetscapes were ripe for gentrification. Before long, all remnants of the old working class gave way to restaurants, upscale bars, coffee shops, cinemas, bookshops, art galleries and other favourite amenities of a new upper middle class.

    Over time, urban polarisation has far-reaching political consequences. While the new professional class voted Labor, and transformed the Labor Party in their own image, they dominated only a handful of electorates (electoral districts). Most of these are in the inner precincts of Sydney and Melbourne. The overwhelming majority of electorates are suburban or regional, populated by blue-collar, routine white-collar and self-employed private sector workers. Whether former inner-city residents, or newly arrived migrants, they embraced the suburban ideal of reward for work, free-standing homes on a quarter acre block and the prospect of upward mobility, particularly for their children. Later, social commentators labelled them “aspirationals”.

    Increasingly, inner-city elites and suburban aspirationals inhabited different worlds. By 1996, many aspirationals felt Labor had lost touch with their priorities. Apart from his poor record on inflation and interest rates, sensitive issues in the mortgage-belt, then Prime Minister Paul Keating became a champion of the elite’s obsession with race and gender. Having infiltrated Labor’s apparatus, progressives now seized control of the party’s policy agenda.

    Ultimately, Labor’s historic bond with working people was severed at the 1996 election, when masses of aspirational voters defected to the conservative John Howard. Howard retained their support over four terms in office. During this time they acquired another label – “Howard Battlers” (an antipodean variant of Reagan Democrats).

    Labor spent these years wavering between elite and aspirational programs, failing to reconcile their deep-seated differences. Successive leadership changes were a flop. Not until 2006, when Howard showed signs of running out of steam, was victory finally in sight. Leaving nothing to chance, the popular Rudd was installed as leader, and handed the task of herding both progressive and aspirational voters into Labor’s camp. Rudd’s strategy may have won him the election, but it bore the seeds of his destruction.

    On sensitive issues, Rudd resorted to an elaborate form of doublespeak: headline rhetoric crafted for aspirationals with policy small print pitched at progressives. He was confident enough in his mastery over the media cycle to pull this off. And he assumed aspirationals were too unsophisticated to catch on. He was proved wrong on both counts, but only after winning office.

    Take his handling of housing, transport and urban development. Housing affordability and traffic congestion loomed as hot topics in the 2007 election. Before the late 1990s, Australian cities had generally liberal approaches to land release and suburbanisation, and the motor vehicle was supreme. Urban planning was the province of state governments, which had long considered motorways the wave of the future, given the country’s increasingly dispersed patterns of residential, commercial and industrial development.

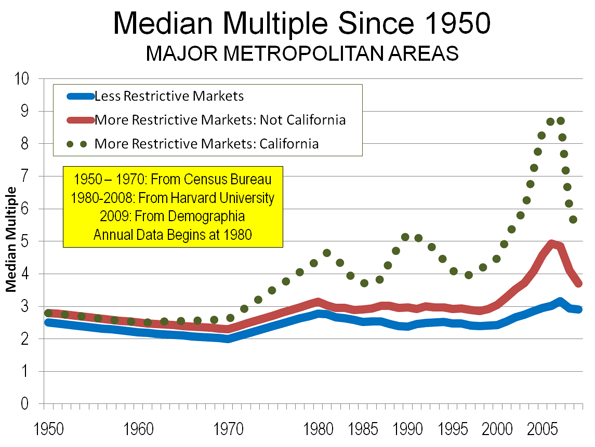
    As the century drew to a close, however, sentiment in the planning profession, including state officials, many now religiously green, shifted from growth to consolidation (“smart growth“) and the revival of rail transport. More recently, the climate panic accelerated this trend. On the whole, state governments, mostly Labor in the decade to 2007, proved compliant. Considering that Australian cities were experiencing high rates of population growth, in part due to very high levels of immigration, land values and house prices soared and roads, particularly in the middle to outer suburbs, couldn’t cope with traffic volumes. These problems were especially bad in Sydney. For the first time, many Australians feared that their children would never achieve the dream of home ownership.

    Leading up to the election, Rudd took to calling housing affordability “the ultimate barbeque stopper”, a subject on everyone’s lips. He convened a Housing Affordability Summit, and released a strategy paper. His campaign launch speech, weeks out from polling day, reminded voters that Labor had “put forward a national housing affordability strategy – so that we can keep alive the great Australian dream of one day owning your own home”. Rudd’s rhetoric on “infrastructure bottlenecks” was just as high-blown. “For 11 years”, he said repeatedly, “Mr Howard’s government has failed to provide leadership in developing our nation’s infrastructure”. References to traffic congestion were made in this context.

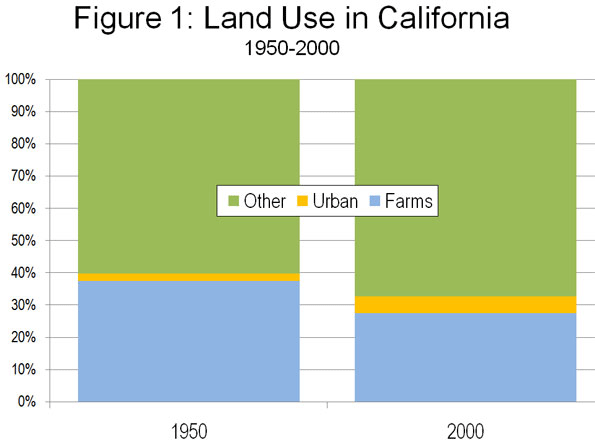
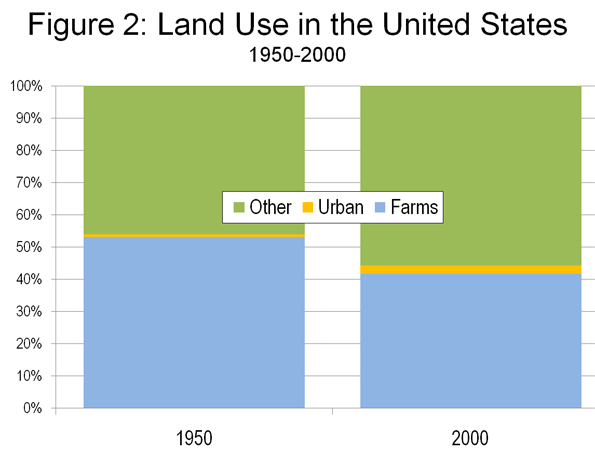
    But the policies didn’t match the rhetoric. Since elite sentiment was, by this stage, in the grip of climate alarmism, there was little way Rudd would address the root causes of these problems. Restricted land supply and urban growth boundaries, to contain Australia’s “ecological footprint”, combined with population growth, were driving up land values and inducing developers to bank their land holdings rather than release them. Rudd’s plan just tinkered around the edges. There were to be tax breaks on capped home saver bank accounts, subsidised rental accommodation for low income earners, and a massive boost in social housing stock. Conceived by activists who saw housing as a welfare issue, these measures did little for the mass of aspirationals or their children. A later boost to the existing “first home buyer grant” probably inflated prices further. Far from saving the great Australian dream, Rudd cast it into the dustbin.

    After the election, the small number of infrastructure projects selected for funding had limited potential to ease traffic congestion. In his landmark October 2009 speech on urban policy, Rudd had more to say on shifting motorists out of cars and onto trains than upgrading roads to improve traffic flows. For Sydney’s long-suffering commuters, there was no sign that “missing links” in the Orbital Motorway Network ring road would be completed.

    Well into 2010, house prices had been escalating for over a year, and mortgage interest rates began to creep up again, having been slashed during the financial crisis. More and more Australians thought Rudd’s performance, on a broad range of policy fronts, was falling short of his elevated rhetoric. He was “all talk and no action”. When his opinion poll ratings plummeted, with no revival in sight, Labor Party power-brokers feared their government would be thrown out after just one term, a first since 1932. Either Rudd or the Labor government had to go. They chose Rudd.

    John Muscat is a Sydney lawyer and co-editor of The New City (www.thenewcityjournal.net), a web journal of urban and political affairs.

    Photo by London Summit

  • Planning’s Cultural Cringe?

    First it was Portland, Oregon, touted as a poster child for urban planning in Australia. Now, Vancouver, Canada, is the comparison, and are we seeing another incarnation of Australia’s infamous cultural cringe?

    Advocates of higher density and the “brawl against sprawl” in Australia frequently cite overseas cities as model case studies. Portland, Oregon, was for a long time cited as a good example of pro-density housing strategies which sought to limit ‘sprawl’, to promote public transport by investing in things like light rail, and to promote cycling and a range of other planning ‘solutions’ that would sound remarkably familiar in Australia.

    The truth about Portland, however, didn’t match the hype of its city planners. Much of the boosterism focused on the mostly downtown area of Portland. Like Melbourne, or Sydney, this is its own municipality, with its own Mayor and its own planning officials. As they aggressively sold a story about the virtues of their planning strategy for the city core, they omitted the inconvenient broader metropolitan facts as they went.

    The story of the real Portland, including the surrounding suburban areas, is different than what these policy promoters would have you believe. Portland today, despite hundreds of millions invested in a new light rail system and the promotion of inner city housing density, has fewer public transport trips as a percentage of total travel than in 1980. Urban Growth Boundaries introduced by Oregon State in the 1970s led to housing price pressures which eventually excluded the middle and working class. Leading US city demographer Joel Kotkin describes it as an ‘elite city’ which is ‘remarkably white, young and childless.’ And as international housing market expert Wendell Cox has pointed out, the suggestion that Portland has much to crow about in terms of urban consolidation doesn’t match the official statistics. Portland is as guilty of ‘sprawl’ as Los Angeles.

    The same can be said of Vancouver. Touted by its city officials as a paragon of virtue in planning policy, the Vancouver story is almost entirely limited to its geographically confined downtown. Here, in the wake of overbuilding of office properties in the downtown core, city officials rezoned excess commercial capacity to permit high density residential housing in what we would call the CBD. This ‘living first’ strategy produced a wave of new residential development which saw the core population grow by 20,000 people to around 60,000, and to potentially 90,000 by 2015. Redundant waterside areas have been coverted into residential precincts, and commuting by public transport, cycling or walking are favoured over private vehicles.

    Taken in isolation, the Vancouver story could start to sound convincing. But there are some glaring omissions. The City of Vancouver is home to around 600,000 people. The downtown area – the subject of much of the planning hype – is home to 60,000 people. The broader metro region, based on the same sorts of urban definitions we might use for Brisbane, or Sydney or Melbourne, is home to 2 million people. There is precious little said about the lives of the 1.4 million people who aren’t residents of the City of Vancouver, or the more than 1.9 million who don’t live in the revitalized urban core.

    For these Vancouverites, life isn’t a rosy as the planning hype would have you believe. The most glaring omission about life in Vancouver is that it also happens to be one of the world’s least affordable cities in which to live. According to both the Reserve Bank of Canada and Demographia, Vancouver’s housing rates as severely unaffordable, eating up some three quarters of the region’s median pre-tax household incomes. The problem is so chronic that it has prompted an online game “Crack Shack or Mansion” where visitors are asked: “Can you tell the difference between a crack shack and a Vancouver, BC mansion, listed for one or two million dollars?” Play the game yourself, it’s an eye opener. [A Crack Shack, for the uninitiated, is a den of inequity where illegal drugs are produced].

    That’s hardly the sort of model city you’d want to tout as a planning example we could learn from. The other glaring omission from the planning fairy tale of Vancouver is that life in the city core is vastly different from the overwhelmingly suburban conditions of the vast majority. To the south of Vancouver’s downtown lies an endless suburban grid of detached housing, with limited parklands or open space. Check it out for yourself on Google Maps or Google Earth. Jump into Google Street View and take a walk down a typical Vancouver street. Do that with a housing price list from “Crack Shack or Mansion” in hand and then convince me this is a model for any Australian city.

    A final glaring omission is the climate. This from the official Living in Canada website: “Snow depths of greater than 1 cm are seen on about 10 days each year in Vancouver compared with about 65 days in Toronto. Vancouver has one of the wettest and foggiest climates of Canada’s cities. At times, in winter, it can seem that the rain will never stop.” Summers aren’t so bad though: for two months of the year, the average daily maximum even exceeds 20’c!

    So Vancouver as the next poster child of planning for any Australian city is looking shaky. It’s hopelessly unaffordable (and we have enough problems of our own in that regard), the quality of its majority suburban environment is lower than the standards we already enjoy, and the climate could not be less similar.

    The same can be said of other city-regions often described as examples of how Australian cities could develop. Copenhagen, Paris, or Venice have all in their time been selectively extolled as models for Australian urban planning.

    Maybe this fascination with irrelevant urban models stems from a form of cultural cringe? Whatever the reason, the analogies can be dangerous, especially when they omit the more essential economic or lifestyle based criteria such as housing affordability, share of economic wealth amongst a city/region’s residents, or climate and lifestyle factors.

    It might instead be more helpful if Australian planners referring to overseas examples also kept in mind some of these pragmatic metrics. For example, benchmarking cities with more affordable housing markets than ours and with strong local economies where wealth and standards of living are enjoyed across a wide spectrum of society would produce some very different case studies. Factor in similar climate patterns (which largely dictate recreational and lifestyle behavior) to our own and the choice of comparable cities reduces further.

    We might even start to find that our own cities offer plenty of examples of ‘getting it right.’ Instead of this cultural groveling we could start to define the things we like most about our own existence and plan ways of replicating that, rather than imposing on our cities forms of existence that, appealing as elements might be, are incapable of replication in the Australian context.

    Ross Elliott is a 20 year veteran of property and real estate in Australia, and has held leading roles with national advocacy organizations. He was written and spoken extensively on housing and urban growth issues in Australia and maintains a blog devoted to public policy discussion: The Pulse.

    Photo by ecstaticist

  • Time to Dismantle the American Dream?

    For some time, theorists have been suggesting that it is time to redefine the American Dream of home ownership. Households, we are told, should live in smaller houses, in more crowded neighborhoods and more should rent. This thinking has been heightened by the mortgage crisis in some parts of the country, particularly in areas where prices rose most extravagantly in the past decade. And to be sure, many of the irrational attempts – many of them government sponsored – to expand ownership to those not financially prepared to bear the costs need to curbed.

    But now the anti-homeowner interests have expanded beyond reigning in dodgy practices and expanded into an argument essentially against the very idea of widespread dispersion of property ownership. Social theorist Richard Florida recently took on this argument, in a Wall Street Journal article entitled “Home Ownership is Overvalued.”

    In particular, he notes that:

    The cities and regions with the lowest levels of homeownership—in the range of 55% to 60% like L.A., N.Y., San Francisco and Boulder—had healthier economies and higher incomes. They also had more highly skilled and professional work forces, more high-tech industry, and according to Gallup surveys, higher levels of happiness and well-being. (Note)

    Florida expresses concern that today’s economy requires a more mobile work force and is worried that people may be unable to sell their houses to move to where jobs can be found. Those who would reduce home ownership to ensure mobility need lose little sleep.

    The Relationship Between Household Incomes and House Prices

    It is true, as Florida indicates, that house prices are generally higher where household incomes are higher. But, all things being equal, there are limits to that relationship, as a comparison of median house prices to median house prices (the Median Multiple) indicates. From 1950 to 1970 the Median Multiple averaged three times median household incomes in the nation’s largest metropolitan areas. In the 1950, 1960 and 1970 censuses, the most unaffordable major metropolitan areas reached no higher than a multiple of 3.6 (Figure).

    This changed, however, in some areas after 1970, spurred by higher Median Multiples occuring in California.

    William Fischel of Dartmouth has shown how the implementation of land use controls in California metropolitan areas coincided with the rise of house prices beyond historic national levels. The more restrictive land use regulations rationed land for development, placed substantial fees on new housing, lengthened the time required for project approval and made the approval process more expensive. At the same time, smaller developers and house builders were forced out of the market. All of these factors (generally associated with “smart growth”) propelled housing costs higher in California and in the areas that subsequently adopted more restrictive regulations (see summary of economic research).

    During the bubble years, house prices rose far more strongly in the more highly regulated metropolitan areas than in those with more traditional land use regulation. Ironically many of the more regulated regions experienced both slower job and income growth compared to more liberally regulated areas, notably in the Midwest, the southeast, and Texas.

    Home Ownership and Metropolitan Economies

    The major metropolitan areas Florida uses to demonstrate a relationship between higher house prices and “healthier economies” are, in fact, reflective of the opposite. Between August 2001 and August 2008 (chosen as the last month before 911 and the last month before the Lehman Brothers collapse), Bureau of Labor Statistics data indicates that in the New York and Los Angeles metropolitan areas, the net job creation rate trailed the national average by one percent. The San Francisco area did even worse, trailing the national net job creation rate by 6 percent, and losing jobs faster than Rust Belt Pittsburgh, St. Louis, and Milwaukee.

    Further, pre-housing bubble Bureau of Economic Analysis data from the 1990s suggests little or no relationship between stronger economies and housing affordability as measured by net job creation. The bottom 10 out of the 50 largest metropolitan areas had slightly less than average home ownership (this bottom 10 included “healthy” New York and Los Angeles). The highest growth 10 had slightly above average home ownership (measured by net job creation). Incidentally, “healthy” San Francisco also experienced below average net job creation, ranking in the fourth 10.

    Moreover, housing affordability varied little across the categories of economic growth (Table).

    Net Job Creation, Housing Affordability & Home Ownership
    Pre-Housing Bubble Decade: Top 50 Metropolitan Areas (2000)
    Net Job Creation: 1990-2000 Housing Affordability: Median Multiple (2000) Home Ownership: Rate 2000
    Lowest Growth 10  7.4%                                2.8 62%
    Lower Growth 10 14.9%                                3.1 63%
    Middle 10 22.8%                                3.2 64%
    Higher Growth 10 30.9%                                2.6 61%
    Highest Growth 10 46.9%                                2.9 63%
    Average 24.7%                                2.9 62%
    Calculated from Bureau of the Census, Bureau of Economic Analysis and Harvard Joint Housing Center data.
    Metropolitan areas as defined in 2003
    Home ownership from urbanized areas within the metropolitan areas.

    Home Ownership and Happiness

    If Gallup Polls on happiness were reliable, it would be expected that the metropolitan areas with happier people would be attracting people from elsewhere. In fact, people are fleeing with a vengeance. During this decade alone, approximately one in every 10 residents have left for other areas.

    • The New York metropolitan area lost nearly 2,000,000 domestic migrants (people who moved out of the metropolitan area to other parts of the nation). This is nearly as many people as live in the city of Paris.
    • The Los Angeles metropolitan area has lost a net 1.35 million domestic migrants. This is more people than live in the city of Dallas.
    • The San Francisco metropolitan area lost 350,000 domestic migrants. Overall, the Bay Area (including San Jose) lost 650,000, more people than live in the cities of Portland or Seattle.

    Why have all of these happy people left these “healthy economies?” One reason may be that so many middle income people find home ownership unattainable is due to the house prices that rose so much during the bubble and still remain well above the historic Median Multiple. People have been moving away from the more costly metropolitan areas. Between 2000 and 2007:

    • 2.6 million net domestic migrants left the major metropolitan areas (over 1,000,000 population) with higher housing costs (Median Multiple over 4.0).
    • 1.1 net domestic migrants moved to the major metropolitan areas with lower house prices (Median Multiple of 4.0 or below).
    • 1.6 million domestic migrants moved to small metropolitan areas and non-metropolitan areas (where house prices are generally lower).

    An Immobile Society?

    Florida’s perceived immobility of metropolitan residents is curious. Home ownership was not a material barrier to moving when tens of millions of households moved from the Frost Belt to the Sun Belt in the last half of the 20th century. During the 2000s, as shown above, millions of people moved to more affordable areas, at least in part to afford their own homes.

    Under normal circumstances (which will return), virtually any well-kept house can be sold in a reasonable period of time. More than 750,000 realtors stand ready to assist in that regard.

    Of course, one of the enduring legacies of the bubble is that many households owe more on their houses than they are worth (“under water”). This situation, fully the result of “drunken sailor” lending policies, is most severe in the overly regulated housing markets in which prices were driven up the most. Federal Reserve Bank of New York research indicates that the extent of home owners “under water” is far greater in the metropolitan markets that are more highly restricted (such as San Diego and Miami) and is generally modest where there is more traditional regulation, such as Charlotte and Dallas (the exception is Detroit, caught up in a virtual local recession, and where housing prices never rose above historic norms, even in the height of the housing bubble). Doubtless many of these home owners will find it difficult to move to other areas and buy homes, especially where excessive land use regulations drove prices to astronomical levels.

    Restoring the Dream

    There is no need to convince people that they should settle for less in the future, or that the American Dream should be redefined downward. Housing affordability has remained generally within historic norms in places that still welcome growth and foster aspiration, like Atlanta, Dallas-Fort Worth, Houston, Indianapolis, Kansas City, Columbus and elsewhere for the last 60 years, including every year of the housing bubble. Rather than taking away the dream, it would be more appropriate to roll back the regulations that are diluting the purchasing power and which promise a less livable and less affluent future for altogether too many households.

    Note. Among these examples, New York is the largest metropolitan area in the nation. Los Angeles ranks number 2 and San Francisco ranks number 13. The inclusion of Boulder, ranked 151st in 2009 seems a bit curious, not only because of its small size, but also because its advantage of being home to the main campus of the University of Colorado. Smaller metropolitan areas that host their principal state university campuses (such as Boulder, Eugene, Madison or Champaign-Urbana) will generally do well economically.

    Photograph: New house currently priced at $138,990 in suburban Indianapolis (4 bedroom, 2,760 square feet). From http://www.newhomesource.com/homedetail/market-112/planid-823343

    Wendell Cox is a Visiting Professor, Conservatoire National des Arts et Metiers, Paris. He was born in Los Angeles and was appointed to three terms on the Los Angeles County Transportation Commission by Mayor Tom Bradley. He is the author of “War on the Dream: How Anti-Sprawl Policy Threatens the Quality of Life.

  • Florida: Amendment 4 Pushes the Reset Button on Development

    by Richard Reep

    Like a heroin addict going cold turkey, Florida appears poised to get off the growth drug this coming fall. If massive overbuilding, unemployment, depopulation, and a tourist-chasing oil slick weren’t enough, Florida’s voters are in the mood to vote yes on a referendum called Amendment 4, which would make every future change to the state’s comprehensive plan subject to voter approval, rather than be reviewed through a representative public process. The referendum capitalizes on short-term voter outrage over everything. But in the long term, Florida will likely languish in the twilight of missed opportunities as businesses relocate elsewhere to avoid risky, lengthy public campaigns to build their presence in this state.

    Between 1845 and 2009 Florida became the fourth most populous state in the nation. Because of its immense desirability, land developers have become legitimate partners in Florida politics, and have dictated much of its growth management legislation in the modern era. A byproduct of this process, however, has been increasing resentment among those who came for affordability and a low-density lifestyle, as cow pastures and orange groves got mowed down for subdivisions and malls.

    Traffic and congestion, which many migrants thought they would magically leave behind up north, came with them. Since before the 1980s, the popular press has published article after article about citizens who came for the good life, only to see nature replaced by concrete. Many who came seemed genuinely puzzled about this transformation, as if they expected that human activity would have no noticeable impact.

    Laissez-faire politicians kept the debate from becoming a serious topic, for the land seemed limitless, and the state’s leadership preferred not to dignify this seeming selfishness with a response. The response to those who wanted to lock the door after they had arrived was silence. This time around, emotions have acquired a larger momentum in the form of Amendment 4. Those who support it, such as writer Dori Sutter of the Orlando Sentinel, claim that Florida is overbuilt and has the ability “to create jobs and revenue and to accommodate population growth of more than 80 million people.”. In other words, Sutter’s point is that the current growth management model will accommodate an additional 60 million people over Florida’s current population – if the future immigrants are content to use this model exactly as it is drawn today, with no exceptions.

    Right now is an opportune moment for Florida to clean up its act. Voters might be more likely to approve housekeeping moves to repurpose abandoned properties and improve the aesthetics of the built environment. This kind of activity, however, depends upon businesses moving in, and most business owners handle enough risk without adding a political campaign to their plates. If Florida resembled, say, Europe in its sense of place, then Amendment 4 would be a stroke of genius.

    As it is, Amendment 4 would be the mother of all reset buttons, and voters who push this button in November would freeze the state’s built environment at its worst, not its best. This pause would bifurcate the state’s economic pathway away from the previous course of growth for growth’s sake, and set the stage to diversify the economy and allow Floridians to discover their own destiny through direct democracy. As such, it represents a grand experiment in process, replicating New England-style town hall debates over the nature and the future of the community.

    In the long term, however, this new pathway is far from guaranteed to make for a better process. For one thing, rational facts and figures hold little stock compared to emotional appeals during an election campaign, and every change to the built environment will face as many detractors as it will supporters. Decision-making will likely result in as many bad calls as the process does now.
    Property development is a complex, high-stakes game involving many public and private players. Emotional appeals to voters will tend to reduce this process to matters of style and aesthetic appeal, glossing over technical issues. And, when these matters are put to broad votes, safe pathways will likely win over innovative pathways and inventive ideas, further miring the state in the past. This is why property development has historically been left to the government to handle, with representative democracy in the form of public development commissions, and limited participation by way of public hearings.

    Those who want to put every 7-11 and office building to the vote recognize the change that it would make to Florida’s growth management process, as well as to the state itself. This season of voter outrage seems to be the moment to punish Florida’s favorite villain, the evil developer, as well. Florida seems to have hit an impasse where the current process has yielded an unfavorable product. While citizen input has largely gotten the state where it is today, the results are widely viewed as unsatisfactory.
    Currently, no compelling argument has been put forth against Amendment 4. Homebuilders and developers protest that the process is fine as it stands. Citizen boards, administrative review boards, and public hearing stakeholders are made up of Floridians who approve a Comprehensive Plan every five years, and then review changes to the Comprehensive Plan when landowners request these changes to suit their needs. Sophisticated and complex, this process already involves environmental protection, detailed technical work, and deep pockets.

    Those put in charge of growth management find it hard to say “no” when the state’s property tax coffers, (along with sales taxes) fund much of the public realm. Since growth — development — funds much of the state government’s activities, growth management acts as a financial conduit, one hardly likely to be restricted by those in charge of it. Saying “no” is just not part of the process.

    If the process represents a public conversation about how a city or a region should grow, disgust with the conversation has risen to new levels. Floridians are in the mood for grand solutions: witness last October’s vote in Miami for Miami 21, a form-based zoning code that replaces the zoning process with a product, a Master Plan, of sorts, for the city. Miami 21 appears to be stopping the conversation by limiting future generations’ ability to influence the pathways on which the city may economically develop.

    Amendment 4, rather than reforming the process, also tries for a grand solution. Public debate will be characterized by posturing and politicizing, hardly conducive to rational discussion of complex, technical issues. Where growth is already been well-managed, this might be acceptable, as these regions will organically fine-tune their infrastructure. Where growth has been poorly managed, however, lack of services, traffic congestion, and patchwork development patterns will punish residents and governments alike with declining property values and reduced quality of life.
    The long-term consequences will inexorably reshape Florida’s future, and income from activities other than real estate development will have to be considered for the very first time in Florida’s history. Gaming – already looming large in Florida’s future – is one possibility. A state income tax is a distant possibility, although a state with a large, low-wage service population will likely be unsatisfied with this kind of shot in the arm.

    Thomas Jefferson said, “The government you elect is the government you deserve,” and Florida’s government managed growth in a way that Floridians deserve. Today, with profound disgust at the result, voters appear poised to start over, this time without the government’s help. If growth is no longer Florida’s favorite drug, then with Amendment 4 the state will suffer through cold turkey as businesses relocate elsewhere. A diverse, robust economy may or may not result from this dramatic change. If it does, then Florida will truly get the state that it deserves, and emerge stronger from the depths to which it has sunk. If, however, this move cripples the state’s recovery, then politicians will have some hard work ahead to reestablish trust among voters, and adapt the state’s revenue system and growth management system to a new, no-growth public mentality.

    Flickr photo of a vintage Florida postcard by Mary-Lynn

    Richard Reep is an Architect and artist living in Winter Park, Florida. His practice has centered around hospitality-driven mixed use, and has contributed in various capacities to urban mixed-use projects, both nationally and internationally, for the last 25 years.

  • The Declining Human Footprint

    There are few more bankrupt arguments against suburbanization than the claim that it consumes too much agricultural land. The data is so compelling that even the United States Department of Agriculture says that “our Nation’s ability to produce food and fiber is not threatened” by urbanization. There is no doubt that agricultural production takes up less of the country’s land than it did before. But urban “sprawl” is not the primary cause. The real reason lies in the growing productivity of American farms.

    Since 1950, an area the size of Texas plus Oklahoma (or an area almost as large as France plus Great Britain) has been taken out of agricultural production in the United States, not including any agricultural land taken by new urbanization (Note 1). That is enough land to house all of the world’s urban population at the urban density level of the United Kingdom.

    America’s Spectacular Agricultural Productivity

    Even with less land, agriculture’s performance has been stunning. According to US Department of Agriculture data, US farm output rose 160% between 1950 and 2008. Productivity per acre rose 260%. In particular , California’s farms – often cited as victims of sprawl – have done quite well. Between 1960 and 2004 (Note 2), the state’s agricultural productivity rose 2.3% annually and 3.0% per acre. By comparison national agricultural productivity rose less over the same period at 1.7% overall and 2.2% per acre.

    According to the United States Department of Agriculture, from 1990 to 2004 (latest data), California’s agricultural production rose 32% and on less farm land.

    Of course, there has been substantial reduction of farmland close to some metropolitan areas, but overall the impact of urbanization nationally has not been substantial. For example, since 1950:

    In addition, the nation’s agriculture is subsidized to the tune of more than $15 billion annually, which is strong evidence that more land is being farmed than is required. Subsidies increase the supply of virtually anything beyond its underlying demand. This can be illustrated by imagining how much less transit service there would be if it were not 80% subsidized. Suffice it to say, America is not threatened by “disappearing farmland.”

    America has less farmland because it has not needed as much as before to serve its customers. Thus, considerable farmland has been returned to a more natural state. Generally, this has got to be good for the environment. Land that is left to nature does not require fertilization, for example. The same interests that have frequently claimed that farmland has been disappearing also decry the loss of open space. In fact, the withdrawal of redundant farmland has produced considerable open space – call it open space sprawl.

    Repeat it Often Enough….

    None of this has kept “disappearing farmland” from being a rallying cry among those who would construct Berlin Walls around the nation’s urban areas. Yet the extent to which Bonnie Erbe of Politics Daily and National Public Radio embraced the fiction was surprising. Her “Vanishing Farmland: How It’s Destabilizing America’s Food Supply,” was accompanied by “meant to indict” photograph of farm equipment next to new suburban housing.

    Ms. Erbe’s principal source was a web page from the American Farmland Trust, which seeks to conserve farm land. In its California Agricultural Land Loss & Conservation: The Basic Facts, the American Farmland Trust argues for more “efficient” (i.e. denser) urbanization and claims that, “One-sixth…” (17%) “… of the land urbanized since the Gold Rush … has been developed since 1990.” That might be an impressive figure, if it were not that the state has added 7 million urban residents since 1990, which is one-fourth (25%) of all the urban population added since the Gold Rush and equal to the 1990 population of New York City.

    It is worth noting that California has agricultural preservation measures already in place for farm owners and, finally, that no one can compel an unwilling farm owner to sell their land to a developer or anyone else (except perhaps a government agency through eminent domain).

    In California, as elsewhere in the nation, urbanization has not been the principal cause of farm land reduction. According to the US Census of Agriculture, farmland declined in California from 2002 to 2007 by 2.2 million acres. That 5 year reduction in farmland is approximately equal to the expansion of all California urban areas over the 50 years between 1950 and 2000.

    Most Development is Not Urban

    In the same document, the American Farmland Trust indicates support for the radical urban land regulations. Policies such as in Sacramento’s Blueprint that raise significantly inflate the price of land, make housing less affordable. The agricultural, property and urban planning interests who would ration land for people and their houses have missed a larger targets such as ultra-low density “ranchettes” favored by a small wealthy minority who live in the country, but are not farmers.
    According to the US Department of Agriculture, rural, large lot residential development (non-agricultural) covered 40% more land than all of the nation’s urbanization in 2000. These parcels represent “scattered single houses on large parcels, often 10 or more acres in size.” Further, since 1980, the increase in this rural residential development has been one-third greater than the land area occupied by all of the urban areas in the nation with more than 1,000,000 population.

    Finally, if there is a serious threat to agriculture, it is from over-zealous regulation that has put farmers at risk. Water reductions in the San Joaquin Valley – mostly the result of environmental demands – likely have taken more land out of production than any sprawl-happy developer.

    Declining Human Footprint: An International Phenomenon

    The human footprint, as measured by the total urban and agricultural land has been declining for decades, both in the nation and California, where the greatest growth has occurred (Figure 1 & 2). The same is also true of Europe (EU-15), Canada and Australia, where all of the urbanization since the beginning of time does not equal the agricultural land recently taken out of production. Even in Japan, the human footprint has been reduced. It may be surprising, but human habitation and food production has returned considerable amounts of land to a more natural state in recent decades, while America’s urban areas were welcoming 99% of all growth since 1950.


    Note 1: This assumption represents the worst case, since not all land on which new urbanization was developed had previously been farmed.

    Note 2: State data is available only between 1960 and 2004.

    Photograph: Metropolitan Chicago, 2007 (Grundy County)

    Wendell Cox is a Visiting Professor, Conservatoire National des Arts et Metiers, Paris. He was born in Los Angeles and was appointed to three terms on the Los Angeles County Transportation Commission by Mayor Tom Bradley. He is the author of “War on the Dream: How Anti-Sprawl Policy Threatens the Quality of Life.

  • The Suburban Exodus: Are We There Yet?

    For many years, critics of the suburban lifestyles that most Americans (not to mention Europeans, Japanese, Canadians and Australians) prefer have claimed that high-density housing is under-supplied by the market. This based on an implication that the people increasingly seek to abandon detached suburban housing for higher density multi-family housing.

    The Suburbs: Slums of the Future?

    The University of Utah’s Arthur C. (Chris) Nelson, indicated in an article (entitled “Leadership in a New Era“) in the Journal of the American Planning Association. that in 2003, 75% of the housing stock was detached and 25% was attached, including townhouses, apartments, and condominiums. By 2025 he predicts that only 62% of consumer will favor detached homes, (Note 1). He also predicts a major shift in consumer preferences from housing on large lots (defined as greater than 1/6th of an acre) to smaller lots (Note 2). This, he suggests, would create a surplus of 22 million detached houses on large lots.

    This predication is largely made on the basis of “stated preference” surveys which the author, Dr. Emil Malizia of the University of North Carolina (commenting on the article in the same issue), and others indicate may not accurately reflect the choices that consumers will actually make. Dr. Nelson’s article has been widely quoted, both in the popular press and in academic circles. It has led some well-respected figures such as urbanist and developer Christopher Leinberger to suggest in an Atlantic Monthly article that “many low-density suburbs and McMansion subdivisions, including some that are lovely and affluent today, may become what inner cities became in the 1960s and ’70s—slums characterized by poverty, crime, and decay.”

    The Condo Market Goes Crazy

    Misleading ideas sometimes have bad consequences. The notion that suburbanites were afflicted with urban envy led many developers to throw up high-rise condominiums in urban districts across the country. Sadly for these developers, the Suburban Exodus never materialized, never occurred. As a result, developers have lost hundreds of millions, if not billions of dollars and taxpayers or holders of publicly issued bonds could be left “holding the bag” (see discussion of Portland, below).

    This weakness has been seen even in the nation’s strongest condominium market, New York City, where one developer offered to pay purchaser’s mortgages, condominium fees and real estate taxes for a year as well as closing costs.

    But the damage is arguably worse in other major markets which lack the amenities and advantages of New York.

    Take, for example, Raleigh (North Carolina), where low density living is the rule (the Raleigh urban area is less dense than Atlanta). The News and Observer reports that the largest downtown condominium building (the Hue) “considered a bold symbol of downtown Raleigh’s revitalization,” has closed its sales office and halted all marketing efforts. The development’s offer of a free washing machine, dryer, refrigerator, and parking space were not enough to entice suburbanites away from the neighborhoods they were said to be so eager to leave.

    This is not an isolated instance. Around the nation, condominium prices have been reduced steeply to attract buyers. New buildings have gone rental, because no one wanted to buy them. Other buildings have been foreclosed upon by banks; and units have been auctioned. Planned developments have been put on indefinite hold or cancelled.

    Miami: Of Little Dubai and Cadavers

    Miami’s core neighborhood (downtown and Brickell, immediately to the south) has experienced one of the nation’s most robust condominium building booms. More than 22,000 condominium high rise units were built between 2003 and 2008. Miami could well have more 50-plus story condominium towers than any place outside Dubai.

    As a result, Miami has suffered perhaps the most severe condominium bust in the nation. According to National Association of Realtors data, the median condominium price in the Miami metropolitan area has dropped 75% from peak levels (2007, 2nd Quarter). By comparison, the detached housing decline in the metropolitan area was 50%; the greatest detached housing price decreases among major metropolitan areas were from 52% to 58% (Riverside-San Bernardino, Sacramento, San Francisco and Phoenix).

    The most recent report by the Miami Downtown Development Authority indicates that 7,000 units still remain unsold. The Brickell area is home to the greatest concentration and largest buildings and has the highest ratio of unsold units at 40%.

    Icon Brickell (see photograph above) may be the largest development in the core. Icon Brickell consists of three towers, at 58, 58 and 50 floors and a total of nearly 1,800 units. Despite opening in 2008 and offering discounts of up to 50%, barely one-third (approximately 620) of the units have been sold, according to the Daily Business Review, which also reported on May 13 that the developer had transferred control of two of the towers to construction lenders.

    One building, Paramount Bay, was referred to by The New York Times as a “47-story steel and glass cadaver” with a lobby “like a mortuary.” A real estate site indicates that only one of the buildings 350 units has been sold.

    More recently sales have inched up in the core but due not to any suburban exodus. According to The Miami Herald, huge discounts that have lured Europeans, Canadians, and Latin Americans to the core. The real estate and consulting firm Condo Vultures notes that more than 1,000 of the sales are to a few bulk buyers, a market segment some might refer to as “speculators.”

    The latest data from the US Bureau of the Census confirms that there is no fundamental shift away from detached housing in the Miami area, as housing trends point toward more detached housing. In 2000, 48.1% of residents in the Miami metropolitan area lived in detached housing. By 2008, the figure had risen to 49.2% (Figure 1). Essentially, the Suburban Exodus remains a mirage.

    Portland: Gift Certificates for Distressed Developers

    If developer greed was the motive in Miami, government subsidies have been the driving force in Portland. The city of Portland will soon have issued nearly $450 million in urban renewal bonds, provides 10-year tax property tax forgiveness, and reduced development fees, which the Portland Development Commission (PDC) has called “gift certificates” for developers (Note 3).

    Gift certificates have not been enough to cure Portland’s sickly downtown condominium market. The Oregonian reported that prices were down, on average, 30% over the year ended the first quarter of 2010. Remarkably prices in the much ballyhooed Pearl District are plummeting even more than those in the rest of the Portland area. According to DQ News, the median sale price of a house in the Pearl District dropped four times the average in Multnomah County and an even greater six times decline relative to suburban counties over the past year.

    There is more. Just this year, the Pearl District has seen its Eddie Bauer, Adidas, and Puma stores close.

    One condominium building the Encore, is reported to have sold only 17 of 177 units. A recent auction of units at the largest building in the city, the John Ross brought prices “far below the replacement cost” according to The Oregonian’s Ryan Frank, who noted that “it will likely be years before there’s a new high-rise condo built.” Late last year, the Pearl District’s Waterfront Pearl was reported to have sold only 31% of its units and had not sold a unit for a year.

    The Portland Development Commission itself has become part of the condominium bust story. PDC had indicated it was considering relocating its offices to a new 32-story mixed use tower (Park Avenue West), which was to have included condominiums, offices, and retail stores. For more than a year, the proposed 32-story tower has been an unsightly hole in the ground, with construction suspended. PDC decided to stay put in its older, less expensive offices. Even before PDC decided not to locate in Park Avenue West, the developers eliminated the plans for 10 floors of condominiums, doubtless because it made no economic sense to add to an already flooded market.

    In Portland, like in Miami, the fact remains that suburbia has not been abandoned. Despite the high density over-building in the Pearl District and elsewhere in the core, detached housing has become even more popular in the region. According to data from the Bureau of the Census, the share of households living in detached housing in the Portland metropolitan area rose from 63.7% in 2000 to 64.5% in 2008 (Figure 2).

    High-Rise Condos: Slums of the Future?

    To say that the high-rise condominium market has fallen on hard times would be an understatement. The condo bust in New York has become so acute that Right to the City, a coalition of community organizations has called upon “the City to acquire the tax delinquent buildings through tax foreclosure and convert vacant units into permanently affordable housing for low-income New Yorkers.” In a report entitled People without Homes and Homes without People: A Count of Vacant Condos in Select NYC Neighborhoods, Right to the City points out that there are more than 4,000 empty condo units in 138 buildings, with owners delinquent on nearly $4 million in taxes to the city.

    Owners of new condominiums around the nation who paid pre-bust prices for their units may not be inclined to stay around if they are surrounded by less affluent renters who have been attracted by desperate building owners and lenders.

    Are these dark towers of discounting the slums of tomorrow? Only the data and time will tell and it’s too early to know, but preliminary findings show little of the predicted shift toward higher density living (Figure 3). Certainly national data indicates, if anything, a slightly strengthening market for detached, rather than attached housing (Figure 4).

    • Between 2000 and 2008, the share of households living in detached housing rose from 61.4% to 63.5%.

    • A similar trend is shown by the national building permits data. Between 2000 and 2009, 75.2% of residential building permits in the United States were for detached housing. This is up strongly from 69.6% in the 1990s and nearly equals the highest on record (the 1960s), when 77.7% of residential building permits (housing units) were detached houses.


    Looking at the data, there remains little evidence that the stated preferences on which the predictions relied have been translated into the reality of a shift in preferences toward smaller lots in cores or inner ring suburbs. Domestic migration continues to be strongly away from core counties to more suburban counties. Core cities are growing less quickly than suburban areas. Exurban areas are growing faster than central areas, including inner suburbs.

    Clearly, the Suburban Exodus has not begun and there is little reason to believe that it will anytime soon.


    Note 1: In estimating the 2003 share of detached housing (75%), Dr. Nelson uses “one-unit structures” data from the 2003 American Housing Survey Table 2-3. US Bureau of the Census American Housing Survey personnel responded to my request for clarification, indicating that “one-unit structures” includes … single detached housing units, mobile homes, and single attached housing units (such as a townhouse).” Thus the 75% detached estimate is high because it includes mobile homes and single attached housing. As is indicated above, data from the US Bureau of the Census data indicates that the share of detached housing of detached plus attached housing in 2000 was 61.4%. This figure, coincidentally, is virtually the same as the 62% Dr. Nelson predicts for 2025.

    Note 2: The assumption that consumers prefer small lot detached housing may not be sufficiently robust and may even be exaggerated. Dr. Nelson appears to principally rely on research by Myers and Gearin (2001) (in the journal Housing Policy Debate) for concluding that consumers prefer small lot rather than larger lot detached housing, defining small lot development as 1/6th of an acre or less or less than 7,000 square feet. Yet neither figure appears in Myers and Gearin. Moreover, a National Association of Home Builders commenter (also in Housing Policy Debate) questions how its data was characterized by Myers and Gearin in justifying a finding of preference for smaller lots (the survey is unpublished). Without access to the original surveys referenced in Myers and Gearin, it is impossible to judge what respondents may have had in mind as the dividing line between large lots and small lots.

    Note 3: This characterization was on the Portland Development Commission website (accessed January 2, 2007). It was cited in our report, Zero Sum Game: The Austin Streetcar and Development and subsequently removed from the website. A large share of Portland’s urban renewal bonds are insured by Ambac Financial Corporation, which has reported losses exceeding $1 billion in the last two quarters. Ambac indicated that it has “insufficient capital to finance its debt service and operating expense requirements beyond the second quarter of 2011 and may need to seek bankruptcy protection.” Ambac was the insurer of State of Nevada bonds to build the Las Vegas Monorail, which has already entered bankruptcy and is unable to pay its bonds.

    Wendell Cox is a Visiting Professor, Conservatoire National des Arts et Metiers, Paris. He was born in Los Angeles and was appointed to three terms on the Los Angeles County Transportation Commission by Mayor Tom Bradley. He is the author of “War on the Dream: How Anti-Sprawl Policy Threatens the Quality of Life.

    Photo: Icon Brickell, Miami

  • Subdivisions: The Lots-Per-Minute Race

    When you get that morning cup of Java, do you desire the minimal flavor? How about your career, do you desire the most minimal pay check or profits or the most mundane of positions? Let’s assume for some reason that you said ‘No, you would always want to strive for something better than the minimum’.

    You now have three hats in front of you, one says “planner” on it, one says “engineer,” and the last one says “developer”. When you put on the “planner” hat, your job is to develop and enforce a set of rules that will guide the development of a city. You suggest to the council a set of standards that recommend the minimum dimensions and areas for residential or commercial projects that are brought in for approvals. Council and planning commission members will argue a bit, but eventually they will decide on what the minimum controls will be within the regulations you will be writing…

    Under the “developer” hat, you just bought 100 acres from the bank at a steal, yet it still cost over two million dollars, and that monthly interest payment is going to be painful. You cannot begin to sell any lots until you get preliminary plat approval, so until then, money bleeds out, not in. You cannot form a business plan until someone lays out your site. You look at the local engineering firm and see they offer “land planning” as one of their areas of expertise. They have a large impressive office with lots of computer screens flickering away. Obviously, they must be experts on land planning who can deliver a unique land development that will provide a market edge that makes your development as successful as possible. So you just sign here on their contract for services…

    Wearing that “engineer” hat, you look over your production floor. It was once bustling with activity, but now those screens are flickering with employees trying to look busy in fear that a layoff is coming. Luckily, you have a developer coming in with that 100 acre project. You really like laying out subdivisions, and you look forward to using that new software you just bought to automate the process. Next week, you’re scheduled to meet with the developer, who is going to present a sketch plan on the site. You’re ready, with your new software that promises an LPM (lots per minute) ratio of up to 250 lots per minute. With this new tool you can easily lay out that new development in just an hour. Since this is only a sketch plan meeting, you just need a quick picture to get things started.

    To make sure you are up to date on the latest regulations, you check the web site of the city for the latest minimums to enter into the software. You use Google Earth to trace in the boundary of the site, because you do not have the time to survey the land, nor does the developer want to spend any money at this point until he knows the city will give him sketch plan approvals. Besides, you threw the initial planning in for free to lure in the developer and get those lucrative engineering fees.

    After obtaining a rough estimation of the site from Google Earth, you use your latest technology to generate streets and lots almost as fast as you can move the mouse across the screen. Something that used to take days is now virtually instant. Each lot appears at the exact minimum setback, with the exact minimum side yard, and at the exact minimum square footage. Wow! You are quite happy to tell the developer that he’s got 400 lots on his site.

    Slapping on the developer’s hat you use the sketch plan to create your financial projections, cautiously of course, because you have not been given sketch plan approval yet. But clearly you are about to make a ton of money.

    Wearing the planner’s hat, at the planning commission meeting you present “Oak Ridge”, the proposal for the 100 acres. After hearing complaints about the monotonous design, you explain that Oak Ridge follows the regulations that the planning commission had agreed upon: every minimum has been met. Reluctantly they approve the sketch plan for Oak Ridge.

    Wearing the developer hat you could not be more pleased. Imagine the profits that the lot sales will bring, especially because you got the land so cheap! Never in your wildest dreams had you thought you could get 400 lots approved. The next day you put down a deposit to order that Bentley you always dreamed about.

    A few weeks later— wearing the engineer’s hat — you sit down with the actual boundary survey, which is much more accurate than the Google Earth data you used for the sketch plan. You find that the boundary was not even close to what you traced. The surveyor points out the wetlands that will take up about a quarter of the land. He also explains that there is evidence of the pipeline easement. What the ^%$#… ? What pipeline easement? Oh, yes, you remember that Google Earth does not show easements, an honest mistake.

    You explain to your staff that the developer wants to explore a low impact development with surface flow. They tell you that the software only automates pipe networks; surface flow calculations are not automated. You direct them to forget the low impact stuff, too much liability and it will add too much manual labor time.

    Wearing the developer’s hat you sit down, ready to be presented with the preliminary plat of Oak Ridge. It is a wise choice to be sitting down, because the 240 lot preliminary plat comes as a bit of a shock! What happened to the 160 extra lots we got approved? The engineer explains that was just a quick sketch. By the time the actual boundary was provided, and what with the wetlands and the steep slopes, well, it just had to be made to work.

    The engineers explain to you they held every lot to the absolute allowed minimum and that 240 lots is not bad at all. Your vision of the plan blurs and an image of your financial partners and lenders appear, along with thoughts how you are going to pay for that Bentley you picked up last week.

    No more need of hats. You now have a picture of a scenario that repeats itself all too often in the land development process. We live in a world dictated solely by minimums. The new buzz-phrase is “a forms based regulatory process”. Is this not just another way to assure that there is a minimum relationship between manmade structures? Notice how architecture did not enter this story… That will not be a factor until later on, as the lots are sold – why worry at the onset of the development?

    There are a variety of software packages that automate land development and are used by virtually every engineer in the world. These packages have been developed by firms whose main purpose is to automate engineering. It is so simple to throw in automation for lot geometry. Some of the firms that provide this automation are quite large – billion dollar corporations, that earn profits by using those minimum dimensions allowed by regulations and providing tools that cut the process of producing land developments and engineering drawings from months to minutes.

    In this process of progress, we got lost. To have the concept of an LPM ratio of 250 lots per minute is like saying we will layout 250 homes at $200,000 each in 60 seconds. This equates to $833,333 in housing for each second. The development is likely to sit for a few centuries or more, and each home is likely to have 3 people living in it. The average home sells every 6 years, so the living standards of 25,000 people will be set in those 60 precious seconds. How much thought do you think someone laying out 4.16 homes per second will give towards reducing housing costs, eliminating monotony, views from the homes, curb appeal, low impact drainage, long term values, ecology, preserving natural contours and vegetation?

    If you want to speed towards a completely unsustainable world, join virtually everyone involved in the land development process. They are already doing that quite well, thank you. We need a complete overhaul of the land development process. Smart Growth is a solution for a limited envelope of development. It will make an impact, but the impact will only be a small ripple in a very large pond. A prescribed set of stringent rules cannot apply to every development situation, thus a monolithic strict set of rules is not a fix for both urban and suburban living.

    If you do not seek minimum taste, nor minimum income potential or a minimum position in life, then why would you be remotely satisfied living in the minimal development pattern that creates a minimal city?

    When we lay out and build new cities and rebuild existing ones, let’s take the time, thought, and consideration to maximize living standards and assure the successful placement of all businesses that will thrive in the developed future. Perhaps then, we could call this maximized future “sustainable”.

    Rick Harrison is President of Rick Harrison Site Design Studio and Neighborhood Innovations, LLC. He is author of Prefurbia: Reinventing The Suburbs From Disdainable To Sustainable and creator of Performance Planning System. His websites are rhsdplanning.com and performanceplanningsystem.com.

  • The Limits Of The Green Machine

    Environmentalism is strangely detached from the public’s economic goals.

    The awful oil spill in the Gulf–as well as the recent coal mine disaster in West Virginia–has added spring to the step of America’s hugely influential environmental lobby. After years of hand-wringing over global warming (aka climate change), the greens now have an issue that will play to legitimate public concerns for weeks and months ahead.

    This is as it should be. Strong support for environmental regulation–starting particularly under our original “green president,” Richard Nixon–has been based on the protection of public health and safety, as well as the preservation of America’s wild spaces. In this respect, environmentalists enjoy widespread support from the public and even more so from the emerging millennial generation.

    Conservatives who fail to address this concern will pay a price, even more so in the future. The Bush administration’s apparent clubbiness with conventional energy interests has undermined the GOP’s once-proud legacy on environmental causes. The oil spill could prove a great campaign issue for Democrats assigning blame for the disaster on lax Republican regulators and their oil company chums.

    But there’s also a danger for Democrats who tilt uncritically toward “green” policies. Instead of following the environmentalists’ party line, they should adopt a balanced approach adding both economic and social needs to their concept of “sustainability.”

    Sadly, many in the administration seem anxious to extend environmental regulation into virtually every aspect of life. Legitimate concerns over pollution and open space preservation, for example, have now been conflated with a renewed drive to strangle suburbia in favor of forced densification.

    The administration’s “livability” agenda, as suggested by Transportation Secretary Ray LaHood, for example, proposes policies that favor dense urban development over the dispersed living preferred by most Americans. This, notes analyst Ken Orski, represents an unprecedented federal intrusion over traditional local zoning and local decisions.

    This centralizing tendency supports a wide array of interests, notably big city mayors and urban land speculators, and also is eagerly promoted by many architects, the media and planning professors. Not surprisingly, less intrusive ways to reduce energy use, such as telecommuting or the dispersion of worksites closer to people’s homes, have elicited very little administration support.

    Herein lies the Achilles heel of environmentalism–its profound disconnect from public preferences and aspirations. By embracing such a radical social engineering agenda, the greens may end up undermining their own long-term effectiveness.

    The first sign of this pushback, notes analyst Walter Russell Mead, can be seen in growing skepticism about climate change policies both here and in Europe. At a time of severe economic challenges, greens and their political allies need to consider how specific environmental costs threaten an already beleaguered middle and working class.

    Voters, for example, may support strong penalties and stricter controls of energy giants such as British Petroleum or Massey Energy, but roughly six in 10, according to a post-spill NBC/Wall Street Journal poll, continue to back the idea of expanded offshore oil drilling. Voters may embrace new environmental improvements but they also want to keep their jobs.

    This conflict will be on display in the coming struggle over the “cap and trade” proposals in the Senate. Strongest opposition comes from those states and regions most adversely impacted by strict limits on carbon, clustered in the south and Midwest.

    Mitch Daniels, governor of coal-dependent Indiana, even has denounced such proposals as Washington “imperialism.” But Daniels’ opposition also is shared by many Democrats from fossil-fuel-rich states such as North Dakota, West Virginia and Louisiana. Cap and trade even manages to offend many on the left, who see it as yet another opportunity for Wall Street to profit from complex federal regulation.

    On the state level, more draconian mandates on shifting to renewable fuels, such as those in place in California, could also cause future power shortages, as the state auditor warned recently. Such concerns are routinely brushed aside by environmentalist and their prodigious PR machines who prattle on about our coming economic salvation through the creation of “green jobs.”

    In reality, given their dependence on massive subsidies from both taxpayers and rate-payer, it’s unlikely that renewables, as opposed to relatively clean alternatives such as plentiful natural gas, will produce a net positive impact on the economy for years or even decades. Certainly highly aggressive subsidies for wind and solar have not proved any kind of elixir in countries like Spain, where such policies have been long in place but now are being scaled back due to their drain on both the economy and the public budget.

    To some extent, the hype over “green jobs” sometimes appears as something of a PR smokescreen. Prominent greens have long been opposed to the very idea of economic growth and wealth creation, particularly in advanced industrial countries. For decades John Holdren, President Obama’s science advisor, has favored what he calls “de-development” of Western countries in order to preserve natural resources and reduce pollution.

    This approach appears to be gaining support even as the pain of economic dislocation has devastated the advanced countries of the West. Boston University sociologist Juliet Schor, writing in the influential left-leaning The Nation, even attacks “progressive economists”- such as those calling for a second New Deal- for focusing on “climate destabilizing growth” as a way to create new jobs and raise middle class incomes.

    In the Huffington Post one-time investment banker Ann Lee, now an economics professor at NYU, has called for “a new economic ideology” that focuses on “human dignity, creative and degrees of freedom” instead of following traditional measurements of material well-being. This “new” economy, she argues, would provide greater returns to favored groups like artists and, of course, teachers, who she considers severely underpaid.

    This kind of low-carbon academic “esteem” economy appeals to people who already enjoy considerable material wealth and can count on the support of the state. It is not so promising on the West’s aspirational middle and working classes, particularly those employed in the private sector, whose individual strivings would now be compensated by a deadly combination of high taxes and slow growth.

    Until the issues of growth are tackled honestly, the green movement will continue to depend on tragic events such as the Gulf oil spill to maintain its public support. But in the long run, environmentalism will not remain politically “sustainable” if it fails to balance a green future with the economic aspirations of current and future generations.

    This article originally appeared in Forbes.com.

    Joel Kotkin is executive editor of NewGeography.com and is a distinguished presidential fellow in urban futures at Chapman University. He is author of The City: A Global History. His newest book is The Next Hundred Million: America in 2050, released in Febuary, 2010.

    Photo by just.Luc

  • Santa Fe-ing of the World

    This is part one of a two-part piece. Read Part two.

    Human settlements are always shaped by whatever is the state of the art transportation device of the time. Shoe-leather and donkeys enabled the Jerusalem known by Jesus. Sixteen centuries later, when critical transportation has become horse-drawn wagons and ocean-going sail, you get places like Boston. Railroads yield Chicago – both the area around the “L” (intraurban rail) and the area that processed wealth from the hinterlands (the stockyards). The automobile results in places with multiple urban cores like Los Angeles. The jet passenger plane allows more places with such “edge cities” to rise in such hitherto inconvenient locations as Dallas, Houston, Seattle and Atlanta and now Sydney, Lagos, Cairo, Bangkok, Djakarta, and Kuala Lumpur.

    The dominant forms of transportation today are the automobile, the jet plane, and the networked computer. What does adding the networked computer get you? I think the answer is “the Santa-Fe-ing of the World.” This means the rise of places where the entire point of which is face-to-face contact. These places are concentrated and walkable, like villages. Some are embedded in the old downtowns – such as Adams Morgan in Washington, or The Left Bank of Paris, or the charming portions of what in London is referred to, somewhat narcissistically, as “The City.” Some are part of what have traditionally been regarded as suburbs or edge cities, such as Reston, Virginia, or Emeryville/Berkeley, California.

    Santa Fe, New Mexico, is a remarkable example of this trend. Home to a world-renowned opera, charming architecture, distinguished restaurants, great places to buy used boots, quirky bookstores, sensational desert and mountain vistas and major diversity, it is also little more than a village of 62,000, far from the nearest major metropolis.

    This “Santa-Fe-ing” means urbane well beyond the current definition of urban. It means aggregation and dispersal. As with all innovation, its impact is first seen among people with enough money to have choices.

    The logic of this hypothesis starts with the question: “In the 21st century, is there any future for cities of any kind?”

    After all, some would have us believe that with enough bandwidth, each of us can wind up on his or her own personal mountaintop in Montana, being lured down into the flatlands only to breed.

    That’s a preposterous view of human nature, of course. There’s a reason solitary confinement is a punishment. We are social animals. But still, many of the historic reasons for human concentration are gone. It’s been a century since you’ve had to live within walking distance of your factory. Today, you often don’t even need be within driving distance of your office – as anyone with a cell phone knows. You certainly don’t need a metropolis to acquire anything a dot-com is willing to sell – which is a very big deal now and growing exponentially.

    Absent a cataclysm of biblical proportions, I think this means the one and only reason for congregation in the near future is face-to-face contact. Period. Full stop. The places that are good at providing this will thrive – think Oxford, England. The ones that are not will die. Cities are not forever. You have not heard much lately from the Babylon chamber of commerce.

    There are nearly 100 classes of real estate out of which you build cities, according to William J. Mitchell, the former head of the architecture and planning department at MIT. They are all being transfigured. The classic example is bookstores. If all you want to do is exchange money for a commodity, the path with least friction is often Amazon. In backwaters where, just ten years ago, buying or even borrowing a non-best-seller was a chore that took weeks, hundreds of thousands of titles are now within one click. Does this mean bookstores have disappeared? Of course not. The half of them that have survived and even grown since the ‘90s, however, have morphed. The critical elements are no longer the shelves. They are the couches, cappuccino machines, and cafes. Bookstores have become places to loiter, face-to-face, among like-minded people.

    What about grocery stores? What happens when it becomes cheaper for the supermarket to deliver your toilet paper to you than it is to heat, light and pay rent and taxes on its store? Under what circumstances would you ever again get in your car to drive to market again? For me, the answer is that I want to have face-to-face contact with my tomatoes – or anything else you might find in a social setting like a farmers’ market. I’m not sure I’d trust the kid at the dot com to pick out my spare ribs. If the grocer wants to ship me my barbecue sauce, however, I won’t mind. Ninety-five percent of everything one finds in a supermarket is flash-frozen, shrink-wrapped, and nationally advertised. We are in the midst of a burgeoning freight revolution, in which the stuff is coming to us, rather than us going to the stuff – as anybody who has Christmas shopped lately may have noted. In fact, I can’t think of anything in an entire Wal-Mart that I would regret having delivered to me in a big brown van. Visiting a Wal-Mart doesn’t give me enough of a psychic boost to justify a drive now. Of course, if big-box retail migrates into the digital ether tomorrow, we’ll have an enormous challenge figuring out the adaptive re-use of their buildings. What will we make of them? Roller skating rinks? Greenhouses? Non-denominational evangelical churches? Artists lofts? Whatever the answer, I doubt their passing will be mourned.

    What about college campuses? Is there any future for those? After all, the University of Phoenix, the online learning establishment, became one of the hottest growth stocks of the early 21st century. Internet MBAs abound from some of the world’s most distinguished schools. Why bother ever getting out of your pajamas to learn?

    Again, the answer is face-to-face contact. After all, distance learning is nothing new. Benjamin Franklin engaged in correspondence classes. The United States military is awash in senior officers with advanced degrees from the University of Maryland, which has pioneered its outreach programs to people in remote locations.

    However, distance learning will always be everyone’s second choice. It works best for people who do not have the time or money for the conventional academic experience. First choice remains the traditional universities. Getting into them has become insanely competitive and expensive. Why are they so desirable? Because sitting in class absorbing information from a lecturer is only a tiny part of the college experience. College is where many people meet their first spouse. It’s where they develop a network of friends that they’ll likely maintain for life. It’s an entertainment center and an athletic center. Oh, and as for learning – most of the stuff that has stuck with me came out of dorm sessions at one in the morning, engaging in face-to-face contact with smart people.

    As we shall see, the impact of face-to-face on urban calculations includes office space, and even home locations. But why is this transformation occurring now?

    It all starts with Moore’s Law, first stated by Intel co-founder Gordon Moore As the core faith of the entire global computer industry, it has come to be stated this way: The power of a dollar’s worth of information technology will double every 18 months, for as far as the eye can see. Sure enough, in 2002, with a billion-transistor chip, the 27th doubling occurred right on schedule. The 30 consecutive doublings of anything man-made that we have achieved at this writing – an increase of well over 500 million times in so short a time — is unprecedented in human history. This is exponential change. It’s a curve that goes straight up.

    For sure, railroads also changed everything they touched. They transformed Europe. North America was converted from being a struggling, backward, rural civilization mostly hugging the East Coast into a continent-spanning, world-challenging, urban behemoth. New York went from a collection of villages to a world capital. Chicago went from a frontier outpost to a brawny goliath. The trip to San Francisco went from four months to six days. Distance was marked in minutes. Suddenly, every farm boy needed a pocket watch. For many of them, catching the train meant riding the crest of a new era that was mobile and national. A voyage to a new life cost 25 cents.

    Of course, as railroad expansion ran out of critical fuel – including money and demand for the services – things leveled off, and society tried to adjust to the astounding changes seen during the rise of this curve. The last transcontinental railroad completed in the United States was the Milwaukee Road in 1909. In part, that was because of the rise of a new transformative technology: The one millionth Model T rolled off the assembly line in 1915.

    In contrast, the curve predicted by Moore’s Law did not stop. The computer industry still regularly beats its clockwork-like 18-month schedule for price-performance doubling.

    The effect of Moore’s Law on the built environment is and will become ever more profound.

    For example, will we ever need offices outside our homes? After all, haven’t we all heard plenty about telecommuting?

    Sure, but how many of us have discovered with some chagrin that the most productive five minutes of our work day has occurred around the shared printer? Somebody asks what we’re working on. Conversations ensue. “Oh really? Did you know that Jane was working on something like that?” “There’s this guy you’ve got to talk to; I’ll send you his phone number as soon as I get back to my desk.” “I was just reading about that very subject; I’ll ship you the name of the book.”

    This kind of casual face-to-face contact is irreplaceable no matter how cheap or immersive video technology gets. Humans always default to the highest available bandwidth that does the job, and face-to-face is the gold standard. Some tasks require maximum connection to all senses. When you’re trying to build trust, or engage in high-stress, high-value negotiation, or determine intent, or fall in love, or even have fun, face-to-face is hard to beat.

    This would seem to argue that some old patterns endure, and that’s true. But think of the twists suggested by this new premium on human basics. Suppose you decided that you could get all the face-to-face you needed two days a week. Would that influence where you lived? Would the mountains or the shore start looking good to you? Suppose you decided that you could get all the face-to-face you needed three days a month. Would the Caribbean start looking good to you?

    Residential real estate is being transformed for these reasons. In the U.S., the explosive growth is in places far beyond any metropolitan area, like the Big Sky Country of Montana, the Gold Country of the California Sierras, the Piedmont of Virginia and the mountains and coasts of New England. For eons, when we’ve visited a nice place on vacation, we’ve asked ourselves, “Why am I going back?” Now, however, we have a new question: “Why am I going back?” Santa Fe is more than 800 miles from Los Angeles, yet it is only semi-jokingly referred to as L.A.’s easternmost suburb. To find out why, check out the nearest airport – in this case Albuquerque – any Monday morning.

    Joel Garreau is Lincoln Professor of Law, Culture and Values at the Sandra Day O’Connor College of Law and the Lincoln Center for Applied Ethics at Arizona State University. He is a fellow at The New America Foundation in Washington, D.C., and author of several best-selling books including Radical Evolution, Edge City and The Nine Nations of North America.

  • $300,000-$400,000 for a Levittowner?

    An article in The Wall Street Journal details the difficulties that were faced by home owners caught in the Goldman Sachs/John Paulson finance scheme (“The Busted Homes Behind a Big Bet“). The article calls the situation a “dizzyingly complex transaction, involving 90 bonds and a 65-page deal sheet. But it all boiled down to whether people … could pay their mortgages.” There is plenty of blame to go around, but surely there were both big winners and big losers is these deals. The big winners were Goldman Sachs and John Paulson. The big losers were the homeowners, though they were not without blame, since they were not forced to take out the excessively large mortgages.

    The striking thing about this story, however, is the photograph of a Levittown style house in Aberdeen township, New Jersey, a distant suburb nearly 40 miles from New York City. The picture in the article cannot be directly linked, and the best view is on an interactive slide show linked to the article. We have provided a photograph of a near somewhat smaller house in Levittown (see photo).

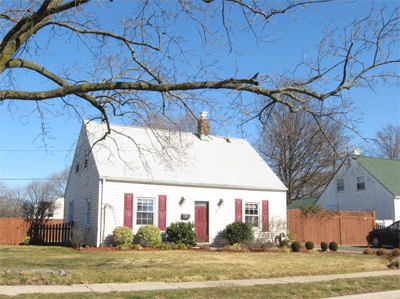
    In 2006, the owner had refinanced the house with a $308,750 loan, indicating a value more than triple that of comparable housing in much of metropolitan America.

    Levittown, of course, was the late 1940s housing development on Long Island that set the stage for the automobile oriented suburban expansion that did so much to create the largest and most affluent middle class in the world. The Levittown houses were very small, starting at about 750 square feet, though many have been expanded. It was not long before suburban housing became larger, eventually rising to the present 2,250 square foot median. The Wall Street Journal’s Aberdeen township house is under 1,500 square feet, according to Zillow and was built in 1953.

    The Wall Street Journal article misses a significant point. How could such a modest (and doubtless comfortable) house have become so valuable that it could justify refinancing for more than $300,000? The answer is simple. During the real estate bubble, house prices in New Jersey exploded. The state’s restrictive land use regulation largely prohibit new housing on the suburban fringe, leaving prices nowhere to go but up and up strongly. Between 2000 and 2006, the median house value in Monmouth County, where Aberdeen Township is located, rose 125% (according to US Bureau of the Census data). 2006 data for Aberdeen township is not readily available.

    By the peak of the bubble, the median value house in Monmouth County was 5.8 times the median household income, up from 3.0 times in 2000. In 2000, prices were even lower in Aberdeen township, at 2.3 times incomes – well within the 3.0 standard that defined housing affordability for at least one-half century.

    While owners were borrowing $300,000 or more on their modest early 1950s houses in Aberdeen township, households were buying brand new houses of the same size for under $120,000 in Dallas-Fort Worth, Atlanta, Houston, Indianapolis and a host of other metropolitan areas where the American Dream had not been outlawed. Expansion of the housing supply was allowed, and prices stayed within historic norms. For example, in Indianapolis, house prices were less than one-half that of Monmouth County, after adjusting for income levels.

    Meanwhile, a judgment of $370,000 has been entered against the owner of the Aberdeen township Levittowner. The auction in late April by the Monmouth County Sheriff for a price that is probably closer to its real value if it had been in a rationally regulated jurisdiction: $100.