Category: planning

  • When Granny Comes Marching Home Again… Multi-Generational Housing

    During the first ten days of October 2008, the Dow Jones dropped 2,399.47 points, losing 22.11% of its value and trillions of investor equity. The Federal Government pushed a $700 billion bail-out through Congress to rescue the beleaguered financial institutions. The collapse of the financial system in the fall of 2008 was likened to an earthquake. In reality, what happened was more like a shift of tectonic plates.

    *******************************************

    The driveway tells the story. The traditional two-story 2,200 square foot suburban home has a two-car attached garage. Today’s multi-generational families fill the garage, the driveway and often also occupy the curb in front of the home. The economic crisis that is transforming America is also changing the way we live. The outcome will change the way America views its housing needs for the balance of the 21st Century.

    As is often the case, we can more clearly see the future by looking into our past. That is because time and time again America has reverted to its roots when confronted with a challenge. The root of the American family is the home. A century ago, America was an agrarian nation. Most Americans grew up on the farm or in a small town often tied to agriculture. A century ago, our census was 92,000,000, less than one-third of today’s population. Los Angeles was a city of 319,000. Cleveland was the fifth largest city with 560,000. The tenth largest city in 1910 was Buffalo NY with 423,000 souls.

    A century ago, parents, children, grown children, and grandparents lived together in America’s homes. In 1910, the vast majority of kids did not go off to college. They stayed home and worked the farm. Mom certainly did not drive and usually she did not work outside the home. Grandma – who then as now usually outlived grandpa – did not go off to an active senior housing project or nursing home at age 55. With the average life expectancy at just 49 years, there was little market for such facilities. A young Grandma lived in the family home and helped with the cooking, the sewing and the child rearing.

    Along the way, we fought in two world wars, America industrialized and the great Middle Class exploded. Our children went off to college and did not return. Our cities exploded. By the end of the century, Los Angeles grew to 3,700,000. The tenth largest city was Detroit with 1,000,000. Children were expected to leave the home shortly after high school and never come back, except to visit.

    Big changes occurred on the other end of the demographic curve. As life expectancy grew to 75. Grandma had her choice of active senior living, congregate care or a skilled nursing facility when she hit 70 and slowed down.

    The expectations of greater family dispersion – with young people leaving home early and grandparents on their own – drove much of real estate thinking at the end of the 20th Century. With empty-nesters and young people both heading back to the city, urban planners were focusing on high-rise apartments and condominiums in dense urban areas. Many eagerly anticipated the death of the suburbs since the number of young families declined. Across the country, and even in suburban areas like the City of Irvine, CA brilliant urban planners began rezoning industrial land into high density housing. The face of America was thought to be changing in predictable ways.

    Then, along came 2008 and the economic crisis. The plates under our feet began to shift. The mass migration to dense urban living evaporated as people stayed put and speculating in condos lost all economic logic. The shiny new urban corridor in Irvine now lined with high rise housing sits empty, with many units vacant and foreclosed. In nearby Santa Ana, twin 25-story residential towers sit eerily vacant with not a single unit sold or occupied. Central Park, a giant new urban project in Irvine that boasted dense high-rise, townhouse and mid-rise units, sits vacant behind green security fences.

    Where did the buyers go? Many young people moved back home with their parents when their high paying jobs in real estate or mortgage brokerage disappeared. With their jobs and income gone, they sought refuge in the safety of their childhood homes. Their parents ended any speculation of selling and down-sizing when their children returned. With job creation non-existent, they do not plan on leaving anytime soon. In one recent Pew study, 13 percent of parents with grown children reported one of their adult offspring had moved back home in the past year. Roughly half of the population 18 to 24 still lives with their parents.

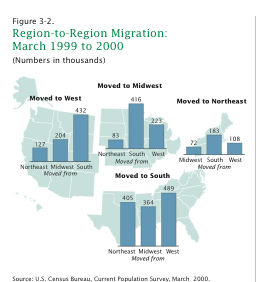
    This stay-at-home trend predates even the recession. According to the U.S. Census Bureau, the national relocation rate in 2008 was the lowest since the agency started tracking the data in 1948. The rate was 11.9 percent in 2008, a decline from 13.2 percent in 2007. The 2008 figure represents 35.2 million people, which is the smallest number of residents to move since 1962. The number was 38.7 million in 2007.

    What about Grandma and, increasingly, even Grandpa? Our parents, thanks to the miracle of modern medicine, are living longer than ever. If she has reached age 65, she can expect to live another 20 years. Unfortunately, her retirement account and savings plan may not. Many Americans are living well into their 90s and we will see the first wave of centurions in our lifetime. No one expected this to happen and we are unprepared for it. Grandma will not be able to afford the $3,000 to $4,000 a month expense of a quality retirement facility – for 20 years.

    This changing dynamic will alter movement of Americans, which has now been slowing down for a generation. In 1970, nearly 20 percent of Americans changed their place of residence every year. But by 2004, that figure had dropped to 14 percent, the lowest level since 1950. The tough economy and aging demographics will slow migration down even more. Mom and Dad will not find it easy to take that new position in another city with the kids at home and now Grandma, and even Grandpa, too.

    This will have profound impact on the kind of housing Americans will want. Homebuilders may find lower demand for single family houses as America doubles up but it will be the much ballyhooed drive to urbanize America with dense high-rise units that is most in danger.

    Extended families will want larger – not smaller – houses. They may not be able to afford McMansions, but conventional suburban houses will be changed to meet the demands of extended families. Granny flats, consisting of self contained ground floor units, will be in demand as the baby boomer generation moves into retirement. Smaller single floor homes called Casitas will need to be mixed into planned developments so that the Grandparents can live closer to the children.

    City staff and urban planners, already grappling with a mandate to accommodate global warming and carbon footprints, will have to rethink existing zoning rules which have not yet responded to the new reality. This reality will be driven by aging demographics, diminished capital and the shifting plates of our economy. The baby boomer “bubble” that is now beginning to retire is a well established fact. Lesser known is the impact of the financial crisis on young workers who simply have been priced out of the housing market. Along the pricier coasts and Northeastern cities, they will need the down payment from their parents – who in exchange will live with their kids – to purchase their own home.

    The kids have already come home. Like the financial downturn, they will not be leaving anytime soon. Grandma is next in line. When she comes home, the circle will be complete, with consequences few in the real estate industry have yet to contemplate seriously.

    **********************************
    This is the sixth in a series on The Changing Landscape of America. Future articles will discuss real estate, politics, and other aspects of our economy and our society.

    Robert J. Cristiano PhD is a successful real estate developer and the Real Estate Professional in Residence at Chapman University in Orange, CA.

    PART ONE – THE AUTOMOBILE INDUSTRY (May 2009)
    PART TWO – THE HOME BUILDING INDUSTRY (June 2009)
    PART THREE – THE ENERGY INDUSTRY (July 2009)
    PART FOUR – THE ROLLER COASTER RECESSION (September 2009)
    PART FIVE – THE STATE OF COMMERCIAL REAL ESTATE (October 2009)

  • A Threat To Home Owners Associations

    In the 1990s, just about the only site amenity that most suburban developments offered was a fancy entrance monument. Usually, there were no other additions beyond ordinance minimums and even those weren’t generally elaborate. Some of these monuments did cost millions, but once past the gilded gates, the seduction ended, and residents were greeted by familiar monotonous cookie cutter subdivisions.

    As neighborhood planners, we educate our developer clients regarding the virtues of building site amenities that improve Quality of Life (trails, gazebos, decorative ponds and fountains, etc). You would think these amenities were an easy sell to the cities approving the developments. After all, great developments create a great city, right? It’s not that simple, because all of these amenities require maintenance, and that places a burden on tax payers. No city wants to create a tax burden for all, when the likely benefit accrues to the few within the development.

    The solution to that problem was simple: The Home Owners Association. We are not talking about the type of Stepford-like association where lifestyles and flower plantings are strictly dictated, but the more limited type that adds a small monthly fee to service the common outdoor site amenities. In other words, only those extra amenities are cared for. Private yards still remain the financial burden of the individual homeowners. In the North, with snow removal, these neighborhood association fees are likely to be higher if the trails and walks are cleared. Since these Associations do not have to maintain private yards or address maintenance of buildings typical of townhome projects, the monthly fees are minimal. Some associations were formed in the North that did give options for snow removal on private driveways, at a very reasonable cost (after all, why not clear a few extra driveways while you are out clearing the trails?).

    The developer could now offer a much higher living standard and create more valuable lots that would be easier to sell. The majority of the neighborhoods we designed in the late 1990s through 2006 (the recession) offered the advantages that these minimal cost Associations could provide. We encouraged developers to spend less on elaborate entrance monuments and instead spread real value through the development where people lived.

    How HOAs May Be At Risk The recession has not just brought about massive foreclosures and reduced home prices. It has escalated real-estate taxes (the home value may be 40% less but the tax remains at pre-recession rates) and put the very idea of a Home Owners Association at risk. With failed development, there are often also failed Associations. With little or no maintenance of a development that was once cared for by private funding, cities may have to take over the burden until the economy recovers, and in some areas, if it recovers. Comprehensive associations that maintain all of the grounds (where there are no privately maintained yards),including the building exteriors and rooftops, as well as the streets, are at the greatest risk. The limited Associations that were typical of the neighborhoods we designed are not as much of a problem, but could easily be lumped into “all Associations are bad news” category in the minds of those approving future developments, after the economy returns.

    This affects all types of residential development.

    Developments that exceed minimum standards typically offer site amenities to make the development more enticing. Someone must maintain these extras. Fear of HOA failures will certainly be more on the minds of cities after the recession, but without HOAs, who will maintain the amenities? A two million dollar entrance monument does not make a neighborhood sustainable. Spreading value through the neighborhood with features that enhance quality of life, is a better investment. The Homeowners Association must not fall victim to the recession.

  • A Return to the City or a New Divide in the Nation’s Capital Region?

    Census data continue to suggest that fringe areas still grow faster than cities, but some have continued to argue that the flight to the suburbs has ended, or at least slowed, and that we are experiencing a resurgence of urban living. In a 2005 article for the Journal of the American Planning Association, Robert Fishman predicts a new pattern of migration – a so-called Fifth Migration – that will revitalize inner core neighborhoods that were depopulated through decades of suburbanization. In a 2004 study of the New York region, James W. Hughes and Joseph J. Seneca contemplate the beginning of a “third transformation,” or a post-suburban regional geography, characterized by the end of population dispersion and the beginning of recentralization.

    Anecdotes, rather than hard data, have tended to drive the back to the city case. Data brought to bear on the issue usually shows the suburbs are still going strong. Yet it also appears that all suburbs are not created equal and population data may be missing subtle population shifts within a metropolitan area. The flow of households within a metropolitan area can show early signs of a change in a region.

    This analysis considers the extent to which there is the beginning of a back to the city movement in the Washington DC metropolitan area using county-to-county migration data from the Internal Revenue Service. We must start with the assumption that the Washington area is unique among American metropolitan areas. The presence of the national government largely shapes the structure and geography of the regional economy. A large share of the region’s jobs is concentrated in the core, due to the role of the Federal government in the region. However, in addition to being the seat of the Federal government, the Washington DC metropolitan area also serves a varied set of private sector employers, and is home to a diverse population with growing suburban and city neighborhoods.

    The metro area is defined by 22 counties and cities in the states of Maryland, Virginia and West Virginia and has at its center city the District of Columbia. For this analysis, the Washington DC metropolitan area is divided into five sub regions: Center City, Inner Core, Inner Suburbs, Outer Suburbs and Far Flung Suburbs (see Map 1). According to Census Bureau population estimates, between 1987 and 2007 the population of the Washington DC metropolitan area grew from 3.92 million to 5.31 million people, an increase of about 35.5 percent. The population growth rates over this period varied considerably within the metropolitan area. The Center City experienced a 7.6 percent population decline between 1987 and 2007 while all of the other subregions in the metropolitan area grew. The fastest growing subregion was the Outer Suburbs, where the population grew by 109.6 percent over the 20-year period, followed by the Far Flung Suburbs (80.0%), Inner Suburbs (27.4%) and Inner Core (23.7%).

    Figure 1 shows that the subregions furthest from the region’s core, the Outer Suburbs and Far Flung Suburbs, consistently have the highest rates of net migration, which indicate that they have been net gainers of households from other parts of the metropolitan area over the past 20 years. For the Inner Suburbs, net migration is positive (but small) until 1998 when it becomes negative. Both the Inner Core and Center City have negative net migration over the entire period, reflecting losses of households to the rest (i.e. the suburban portions) of the metropolitan area.

    Looking at the entire 20-year period suggests that the suburbs of the Washington DC metropolitan area have gained population at the expense of the closer-in jurisdictions. However, in the last few years, since 2005, the net migration rates for the Outer Suburbs and Far Flung Suburbs have declined while the rates for the Inner Core and Center City have become less negative. These three years of data suggest that the more distant suburbs have started gaining households more slowly while the closer-in jurisdictions have lost households more slowly with net migration rates moving towards zero. While three years do not necessarily constitute a trend, this analysis suggests the possible beginning of a modest back to the city movement in the Washington DC area.

    However, household gains (or a slowdown in losses) in the inner jurisdictions may be coming more at the expense of the Inner Suburbs as opposed to the more distant suburban jurisdictions. The Inner Suburbs subregion is continuing the downward trend in net migration rates that began in the late 1990s, losing households to both the outer suburban and core jurisdictions. If this trend continues, the Washington DC metropolitan area may experience a relative population decline of its Inner Suburbs, while the more far flung suburbs continue to grow (albeit more slowly) and the population of the inner jurisdictions stabilizes or even grows slowly.

    Despite the beginning of a small back to the core movement, the suburbs of the national capital region will continue to gather most future growth, and that suburban growth will be even further out. Over the last three decades, jobs have followed people into suburban communities; a place like Tyson’s Corner in Fairfax County now has almost as many jobs as Washington’s downtown business district. Workers can live in the Outer Suburbs and Far Flung Suburbs, benefiting from the relatively lower housing costs and commute with relative ease to jobs in these suburban employment centers. Some share of the population will choose to move back to the city, but there will always be demand for suburban life.

    The Inner Suburbs are caught in the middle of population moving in and moving out. The Inner Suburbs have become more urban and congested, as well as more racially and ethnically diverse. These changes may cause some households – including both native born persons and upwardly mobile immigrants — to look even further out for a traditional suburban lifestyle. A younger metropolitan area, the result of the large millennial or “echo boom” generation, may lead to more people moving out of the congested Inner Suburbs to a “real” urban neighborhood in the core, which is also crowded, but has public transit and walkable communities. This trend, however, may well be short-lived if, when this generation hits their mid-30s by 2015, it acts like previous generations, starting to raise families and move again to suburbs, most likely in the further periphery.

    All this suggests, for the short run at least, a possibility that this new pattern of household redistribution could create a new divide in the national capital region. Different from the well-documented east-west divide, the emerging divide will be between the “urbanites” and the “far flungs.” The divide will be demographic, economic and political and will characterize the future challenges to forming transportation, housing and other regional policies.

    Lisa Sturtevant is an Assistant Research Professor at George Mason University School of Public Policy, Center for Regional Analysis.

  • The Infrastructure Canard

    One of the principal arguments used against suburbanization is that its infrastructure is too expensive to provide. As a result, planners around the high income world have sought to draw boundaries around growing urban areas, claiming that this approach is less costly and that it allows current infrastructure to be more efficiently used.

    Like so many of the arguments (a more appropriate term would be “excuse”) used to frustrate the clear preferences about where people want to live and work, the infrastructure canard holds little water upon examination.

    Becoming Less Affordable as Demand Declines: Within the new world high-income nations, there was considerable urban growth between World War II and 1980. Nearly all of this growth was in the suburbs, where infrastructure was provided through borrowing, taxation and utility user fees. Yet, even as population growth has slowed, the diminished bill has been declared beyond the capability of governments which have often opted for what is seen as more affordable compact development (smart growth).

    Estimating the Cost of Suburban Infrastructure: The seminal volume Costs of Sprawl – 2000 projected a need for $225 billion more in costs from 2000 to 2025 for expanding suburban infrastructure than would be required for more compact development. This superficially large number melts down to $30 per capita on an annual basis. This is hardly the kind of expenditure increase that brings bankruptcy to local governments, even if it were not disputable.

    Higher Cost Infill Infrastructure: Costs of Sprawl – 2000 and other analyses generally rely upon a “build up” of infrastructure costs, which is then extrapolated to develop overall estimates. These estimates are rarely, if ever, calibrated for consistency with actual experience as reported in government financial sources. Moreover, they generally assume that the cost of building comparable lengths of sewer, water or roads are equal throughout the urban area. They are not. Generally, costs are far higher in infill areas, for a variety of reasons, especially higher labor costs.

    Public and Private Costs: Further, many of the infrastructure costs decried in Costs of Sprawl – 2000 and other sources, are not government costs at all but incurred by private companies. Virtually all local roads and some arterials are built and paid for by developers, with the costs passed on to homeowners. Sewer and water expenditures are usually financed by user fees, either paid to private companies or municipally owned utilities.

    Cost Differences are Minimal: Moreover, my analysis with Joshua Utt of municipal water and sewer user fees from all reporting jurisdictions in 2000 indicated a 1,000 increase in population per square mile is associated with a $10 reduction per capita, a figure that does not justify strong-armed land use regulation.

    The High Cost of Infill Infrastructure: Proponents fail to account for the fact that infill development also requires more infrastructure. The existing water and sewer systems in densifying areas are likely to require upgrades, now or later. In many older cities, these systems are older, even obsolete and may not have the capacity to meet the increased demand. Constructing these upgrades will generally be far more expensive in an already developed area than building new, state of the art facilities in greenfield areas.

    Building Gridlock: The proponents virtually never propose expansion of roads to deal with the increased traffic that occurs in densifying conditions. Yet, the national and international evidence is clear: higher densities produce more traffic. Without more capacity, this means slower speeds, more intense pollution and more greenhouse gas emissions.

    There is no point in imagining that it can be any different. For example, the most dense part of the nation is New York’s Manhattan. It is served by a rail system that is far more comprehensive than any other place in the nation. Yet, traffic volumes (total vehicle miles) per square mile in Manhattan are more than 3.5 times that of the nation’s most congested urban area, Los Angeles, and 12 times that of the nation’s least dense major urban area, Atlanta.

    Thus, any savings that might be obtained from not expanding roads to meet demand is achieved by retarding service levels. Further, the longer travel times would stunt economic growth.

    The Transit Infrastructure Canard in Australia: One of the more ludicrous features of the infrastructure canard in Australia is the fixation with rail transit, which planners frequently justify to ban or limit suburban expansion. This is a Neanderthal view that fails to recognize that only a small portion of urban fringe dwellers work in the downtown areas, which are the only employment centers effectively served by rail. The minute roads are opened, the infrastructure for transit is in place. Bus service can quickly and efficiently be established to downtown, local employment poles, or the nearest rail station for those few outer suburbanites who can get to work more conveniently by transit than by their cars. Overall, less than 20% of commuters work downtown in Australian urban areas, and the farther out they live, the less likely they are to commute downtown.

    Operating Costs are the Problem: Moreover, the focus on construction of new facilities is misplaced, because, construction costs are not the principal driver of public expenditures. Less than 20% of local government expenditures are for construction, while more than 80% covers day to day operations. New population, or the same population in a larger area will require similar government operating expenditures. It is likely that compact development will require just as many teachers and just as many public servants. Moreover, they will probably be paid more, since older, more dense communities have significantly higher government employee wages and salaries per capita than average.

    Cost Consequences of the Infrastructure Canard: More importantly, the infrastructure canard imposes far greater costs on society than any savings even its most ardent proponents can imagine. This is because compact development materially increases housing costs.

    Destroying Housing Affordability in Australia: There’s ample evidence of this down under. Planners have tied a noose around all Australian urban areas which virtually outlaws development on or beyond the urban fringe. As economics would predict, land for development has become scarce, which in turn has increased its price. Once known for its affordable housing, most Australian areas have seen the price of homes relative to incomes double or triple since the new policies were enacted. Nearly all of this increase has been in the price of the land, not in the house construction (inflation adjusted). Land for development is so scarce in this less than 0.5% developed nation that its urban areas are likely to be buried by blizzards before housing affordability returns.

    Destroying Housing Affordability in the United States: In the United States, compact development polices have also increased house prices. For example, even after hitting bottom earlier this year, house prices in compact development markets such as California, Seattle and Portland remained as much as twice as expensive related to income than in less strongly regulated markets. The annual US infrastructure savings suggested in the Costs of Sprawl – 2000 are so small that they would pay less than one-third of the excess higher annual mortgage payments in California attributable to compact development (Note).

    Fastest Growing Metropolitan Areas: Doing the Impossible: While planners in California, Portland, Seattle and elsewhere delude the public and elected officials into believing that suburban infrastructure is unaffordable, faster growing metropolitan areas found the opposite. Atlanta, Dallas-Fort Worth and Houston are the three fastest growing metropolitan areas with more than 5,000,000 population in the high income world. Rather than restraining suburbanization, these metropolitan areas allowed it to continue. Their reward was not only delightful communities (despite their being despised by the planners), but also the retention of housing affordability. None of this has slowed some positive inner-ring development, particularly in Houston, to meet that niche demand.

    A Matter of Will: The fast growing metropolitan areas demonstrate that suburban infrastructure can still be provided without a material financial burden to the community. Indeed, given the house price escalating effects of compact development, the cost of living will be lower where suburban expansion is allowed. It is not a matter of suburban infrastructure being too expensive but the resistance of planners and urban land autocrats to crafting policies that actually reflect the desires of the vast majority of people in most advanced countries.


    Note: Estimated based upon the approximate 50% house price premium compared to metropolitan areas without compact development, assuming the average house price, a mortgage of 90% of the house value, amortized over 30 years at 5% and applied to the approximately 75% of houses that are mortgaged.

    Wendell Cox is a Visiting Professor, Conservatoire National des Arts et Metiers, Paris. He was born in Los Angeles and was appointed to three terms on the Los Angeles County Transportation Commission by Mayor Tom Bradley. He is the author of “War on the Dream: How Anti-Sprawl Policy Threatens the Quality of Life.

  • So Much for Evidence-Based Planning

    Has evidence-based planning fallen from grace in favour of catchy slogans and untested assumptions? In the case of urban planning, arguably that is just what’s happened. The evidence, in Australia at least, is worrying.

    “We must get people out of cars and onto public transport.” “We must stop urban sprawl and the consumption of valuable land.” “We must build higher density communities to achieve sustainable environmental outcomes.” Phrases like this are now de rigueur across many discussions about urban planning in the media, in politics and in regulatory circles in Australia. They are rarely challenged on the basis of what the actual social, economic or scientific evidence is really saying. It’s produced an Animal Farm like dogma: ‘Four legs good, two legs bad.’ Or ‘Napoleon is always right.’ Denial, followed by ‘pass the buck’ and ultimately ‘shoot the messenger’ are responses to legitimate questions.

    But given the far reaching social and economic changes which will invariably flow from some of the regulatory planning schemes now being legislated, we should at least ask whether the various policies will actually achieve their stated goals. After all, these regulatory planning schemes are intended to govern our urban growth over the next 20 years. It would be a shame to get it badly wrong, simply because assumptions weren’t tested.

    The rise of the big plan

    Since the late 1990s, there has been a raft of Australian regional planning schemes dealing with urban growth in our major centres. The common theme has been the creation of urban growth boundaries and increased density in established urban areas, with an emphasis on public transport as opposed to the private vehicle.

    Typical of these schemes is the recently released ‘South East Queensland Regional Plan 2009-2031’ (SEQRP) which aims to ‘manage growth and protect the region’s lifestyle and environment.’ The plan, like others of its type, is influenced by a desire to contain urban growth and implicitly assumes that we are at risk of reckless growth if we don’t. But Australia’s total population is currently around 24 million people, in a land mass roughly the size of continental USA. This puts us below Nepal and Uzbekistan but ahead of Madagascar in population rankings. Reports that Australia’s population may reach 35 million in another 40 years (the current population of Canada) have raised domestic fears that we might become over populated. (See my blog post ‘Australia Explodes’ for more on this).

    The State of Queensland is the second largest state by area, but contains only 4.4 million people in total. Its population growth rates have in the past been amongst the highest of any region in Australia, growing at up to 1500 people per week (close to 80,000 per annum). Much of this growth has occurred in the south east corner of the state, surrounding the capital city – Brisbane. While modest by global standards, this rate of growth has thrown governments and some sections of the community into apoplexy. How will we ever cope? The region of southeast Queensland (population 3 million) has even been compared to California (population 38 million) in terms of its growth rates and population pressures.

    Against this context, the SEQRP identifies the need to provide a further 750,000 dwellings in the period to 2031, with roughly 50% to be developed in established urban areas via infill, and the balance through new detached housing development on land within an urban growth boundary. The challenge for infill is greater in Brisbane, where 138,000 new dwellings are expected to be developed in established urban areas, especially around transit centres (typically rail).

    One of the many assumptions that underpin the core strategy of the SEQRP have to do with
    the risk of sprawl. This suggests that modest and manageable growth rates of 1500 people per week are somehow tipping the big end of the global scale. The region’s current population of 3 million shows obvious signs of urban expansion as a result of growth to date, yet, with some notable exceptions in recent years, infrastructure has generally kept pace with the growth. Even at the urban fringe, new housing development has been at higher rates of dwelling density than in years past (lot sizes are shrinking).

    There is also an assumption that we are running out of land. But South east Queensland has vast tracts of land suitable for urban expansion and has several established regional centres readily capable of servicing new expansion with infrastructure and town centres already in place and capable of upscaling. The urban growth boundary imposed by the SEQRP is approximately 300 kilometres in length as it curtains the urban area. An expansion of this boundary by as little as a kilometer (under a mile) would create a notional land supply suitable for an additional 500,000 detached homes at 15 to the hectare (or six to the acre).

    Behind the plan lies an accepted wisdom that demand for ‘the quarter acre block’ is driving excessive expansion. The evidence, however, suggests this is now ancient history: lot sizes have not been anywhere near a quarter acre since the 1960s. The typical lot size now is 400 square metres, or around one tenth of an acre, hardly an irresponsible over-consumption of land for housing.

    It is also assumed that all this growth imperils quality farm land. This assumption can only come from those with a vague understanding of farming practices. In the south east corner of Queensland, typically two types of land have been conserved for this reason. The first is land devoted to growing sugar cane which is no longer economically efficient. This agriculture produces a biodiversity desert and is far better suited to the more tropical north.

    The second type of land conserved under this rationale is land historically devoted to cattle grazing. This was always marginal grazing land in the main – dry, shallow soils that struggle to hold moisture or grow pasture. As technology improved and transport economics developed, more efficient grazing country has been opened up further from city markets. But as farmers are prevented from selling their land for housing, despite its logical location for that purpose, herds of bony cattle continue to roam the urban fringes of the metropolis.

    This assumption also seems to hold dear the notion that, for sustainability reasons, regions should source their food needs from within a nearby catchment, minimizing transport costs. Were this true, Queenslanders would not enjoy apples (grown in southern temperate zones) and neither would Tasmanians (our cool climate southern state residents) ever enjoy bananas (two thirds of Australia’s crop of which are grown in Queensland). It would also mean our agricultural industries, which rely heavily on export, would fail.

    The cost of infrastructure provision is a subject that preoccupies governments in growth regions. Perhaps for this reason, the suggestion that infrastructure is more economically deployed in established urban areas, as opposed to newly provided in outer growth areas, found much support in treasury corridors. However, the evidence suggests otherwise: established urban areas‘ essential services (electricity, water, sewerage, stormwater) are ageing and incapable of serving significantly higher demand loads. The replacement and upgrade cost of retrofitting these services is demonstrably higher than the cost of installing new services in new growth areas.

    It is also assumed outer suburban growth will mean worsening urban congestion. Yet relatively few residents of new outer suburban growth areas are employed in inner city areas: according to the Census and other official government data, most jobs are in suburban locations – 90% of all jobs in fact. The CBD (our downtown) is a high density focus area for many headquarter operations, but at 2 million square metres of office space, it cannot by any stretch of the imagination provide sufficient space for the majority of the region’s workers.

    There is the assumption that infill and higher density will get more people using public transport. Current public transport usage represents under 15% of all trips. With higher density housing in established areas, especially in and around transit nodes (TODs), that figure could theoretically increase. But even the most heroic of assumptions would put the future rate at little more than 30%. Meaning 70% of new residents will still be auto dependent. There is also an unanswered question on the capacity of existing rail and bus services to cope with additional demand (frequent reports mention chronic overcrowding) combined with the high level of public transit subsidies per passenger, which will somehow have to be funded.

    Finally, it’s assumed that high density housing is more ‘sustainable.’ But according to several Australian University studies, unit and townhouse dwellings actually consume more energy than equivalent detached dwellings. Common area lighting, lifts, clothes driers and airconditioning are all more commonplace in high density dwellings than detached (where natural light, cross flow ventilation and solar power for drying clothes are the norm). Factor in the higher number of persons per dwelling in detached housing, and the per person energy consumption of inner city, high density housing looks ordinary. No less an authority than the Australian Conservation Foundation actually proved this in their Consumption Atlas which revealed that inner city high density residents had much larger carbon footprints than their suburban cousins.

    On balance, many of the assumptions that underpin the central strategic intent of regulatory planning schemes such as The South East Queensland Regional Plan, just don’t stand the test of evidence. Indeed in many cases, the evidence suggests the opposite of what is assumed. But evidence, it seems, is out of favour and slogans are in.

    Four legs good, two legs bad. Napoleon is always right. Why consult the facts when the mantra will do?

    About the author: Ross Elliott has 20 years experience in the property and development field, including stints in research, advocacy and urban economics. He writes an occasional blog, which you can find here and works as a consultant in marketing, strategy and business development, specializing in the property sector.

  • Housing Bubbles: Why are Americans Ignoring Reality?

    Dr. Housing Bubble (based in California), in “The comprehensive state of the US housing market”, asserts that of the 129 million residential units in the United States, some 15,950,000 are vacant, resulting in a huge oversupply of residential stock across the country.

    Other United States commentators are making the same assertions, such as Colin Barr of Fortune magazine with “Housing market still faces a big glut”.

    However – after a close read of the “US Census Residential Vacancies and Homeownership Report” released October 29, 2009, the figures are hardly cause for alarm.

    As of the 3rd Quarter 2009, Table 3 illustrates that there are an estimated 130.302 million housing units in the United States, of which 111.459 million (85.5%) are occupied, with 75.339 million (57.8%) owned and 36.119 million (27.7%) rented. The balance, being some 18.843 million (14.5%), is described as “vacant” (with a revised 3rd Qtr 2008 18.448 million units alongside). The “vacant” are loosely broken out in to year round, for rent, for sale only and seasonal. There has been no dramatic shift in these figures over the past 12 months.

    The US Census Population Clock states that the present US population is 308 million.

    The Census Bureau Residential Report illustrates that in the 3rd Quarter 2009, the estimated vacancy rate for usually occupied rentals was 11.1% (9.9% 3rd Quarter 2008) and 2.6% (2.8% 3rd Quarter 2008) for homeowner housing. There is nothing much to get excited about there, and in fact the somewhat elevated “rental vacancy” could prove a boon to the poor, particularly in regions with grossly excessive rents.

    The importance of “vacancy cushions” cannot be over emphasized, as they provide the necessary time for the construction industries to gear up, so that unnecessary property inflation does not occur.

    The US Census Quickfacts (Texas page – with US figures alongside) states that the 2008 US population for persons per occupied household in 2000 was 2.59.

    As societies become more affluent, people per household should fall (note: Texas persons per household is slightly higher on these 2000 figures at 2.74 per household, likely due to the higher Hispanic population with larger families).

    Conversely – through these economic downturns, it is likely that household sizes would also increase somewhat.

    For example, in using the US Population Clock as a rough guide with the 308 million population figure (and deliberately ignoring, for the purpose of this discussion, those in institutional care etc), if the people per household overall increased from, say, 2.59 per household requiring 118.53 million residential units – to, say, 2.79 people per household (as economic conditions worsen), just 110.03 million residential units would be required for occupation. Around 8.5 million less were occupied during the peak of the boom.

    Furthermore, significant numbers of second/vacation homes would no longer be required, as households struggle to lower their expenses through this economic phase.

    As an example, during the decade of the 1990s in Australia – as people became more affluent and family sizes decreased – household sizes moved from around 2.8 per household to approximately 2.6 per household, which was a big driver of the residential construction industry in that country. As they became more affluent, they bought or built more second/vacation homes as well. Australia’s population increased by about 12% through this period, as its housing stock increased by in excess of 22% (access Australian Bureau of Statistics for further information).

    Property commentators’ “estimates” are always interesting of course, but as with my own, should be treated with greatest caution. The critical issue in terms of housing is not necessarily demographics but THE ONLY TRUE MEASURE OF SCARCITY AND ABUNDANCE: PRICE.

    Over the years, Dr. Housing Bubble and many other American commentators have persisted in ignoring the glaring contrasts of the California and Texas housing markets. They have treated all markets as the same, without looking into profound regional differences.

    The latest “Houston Association of Realtors Sept 09 Monthly Report” makes very interesting reading indeed. For the months of September 2008 and September 2009, the numbers are as follows: property sales from 4,336 to 5,654 (+30.4%), dollar volume from $0.877 billion to $1.102 billion (+25.7%) and median single family sales price $155,920 to $156,200 (+0.2%).

    This performance reflects the reality that Houston (as with Texas and most of American heartland) is a “normal market” where supply is not purposely constrained and politicized. I touched on these matters in an article in February this year.

    Now let’s turn to discussing some numbers about “abnormal markets” and what is accurately referred to as the “Failed State of California” (“Failed states: Washington Examiner”), where it appears the politicians are determined to wipe the residential construction industry off the map.

    The state of the residential construction market in California can only be described as “horrific”.

    On October 26 2009, the California Building Industry Association released its report on the residential construction permit activity for the month of September 2009, stating that there were just 2,920 permits issued for the month, and that they have lowered their permit estimates for 2009 to an appalling 37,700 units.

    These are unbelievable figures when one considers that the estimated population of this State is 37 million.

    The internationally recognized measure for housing production and permitting is the build/permit rate per thousand population. The California residential permit rate for 2009 is therefore a shocking one unit per thousand population. I cannot recall a permit rate this low in recorded history anywhere in the world.

    Yes – it’s that bad.

    If Texas was permitting at the same rate for 2009, just 24,000 permits would be issued (Houston 5,600). On an international basis at 1/1000 population the figures would be: the United States overall 307,000, Canada 37,000, Australia 21,000, the United Kingdom 61,000 and New Zealand and Ireland around 4,400 each.

    The reason of course for these unbelievably low California permit rates, is because the Governments at all levels in the State have essentially banned the construction of affordable housing. Essentially the planners have erected a Berlin Wall around the state, all but stopping the building of housing, particularly single family units vastly preferred by the population.

    Meanwhile, back in the normal market of Houston, they are merrily building starter homes of 235 square meters (2,529 square feet) for $140,000 on the fringes ($30,000 for the lot, $110,000 for actual house construction).

    The Annual Demographia Surveys (5th Annual Edition), the Harvard Median Multiples and many other income-to-house price studies (e.g. Randal O’Toole of Cato’s extensive work), clearly illustrate that when house prices exceed three times annual household income it causes inevitable supply constraint issues.

    It appears too that Dr. Housing Bubble is “baffled” why California had such an inordinate share of sub-prime, Option ARMs and other grossly distorted mortgage structures, and delights in blaming the Bankers (banksters as he sometimes refers to them) for the unholy mess that is California (the epicenter of the Global Financial Crisis).

    Households should not spend any more than three times their gross annual household income to house themselves, and importantly, not load themselves up with any more than two and a half times their gross annual household income in mortgage debt. As the California bubble inflated, financial institutions simply had to increasingly lend outside these historic norms, if they wished to maintain market share.

    The financial institutions – not all dumb, and no doubt acutely aware of the risks – were very keen to securitize it and off load the risks to others.

    The only mistake they made was not offloading the risks adequately or fast enough! Herb Greenberg outlines this financial circus in Straight Talk on the Mortgage Mess from an Insider on his MarketWatch blog. Professor Robert Shiller of Yale University noted he was “terribly conflicted” about what is happening in his recent extraordinary Fox Business television interview (Shiller on Housing: ‘I am Terribly Conflicted’ (Glick Report))

    What is really needed here is the understanding – as is being developed in Australia and New Zealand – that structural changes need to be put in place to ensure that these disastrous housing bubbles don’t get underway again (refer to Performance Urban Planning for access to New Zealand Government statements. For recent Australian news and reports: Bottlenecks choking recovery | The Australian, More houses, not taxes | The Australian, AdelaideNow… Home ownership dream fading, say Flinders University researchers).

    These issues are not “ideological” or “environmental”, but have much more to do with deliberately misleading information being generated by professionals in collusion often with political and commercial elites, who are keen to promote housing bubbles for their own ends.

    Yet most Americans seem to persist in ignoring the real structural issues – and instead are choosing to “paper over the cracks” by financially bailing out everything in sight. This is an exercise in futility if ever there was one, as the Japanese have learned to their cost, following the collapse of their property bubble in 1989.

    It is to be hoped that the Americans belatedly start getting the public conversation underway, in working together exploring real solutions – like unnecessary supply constraints – to these unnecessary housing bubbles. We have done this in Australia and New Zealand these past five years and it is beginning to work.

    Hugh Pavletich is a New Zealander with thirty years experience as a commercial property development practitioner. He served as President of the South Island Division of the Property Council during the early 1990’s. In 2004 he was elected a fellow with the Unban Development Institute of Australia for services to the property industry. He has been involved with changes to local government financial management, heritage and land supply. During 2004 he teamed up with Wendell Cox of Demographia to develop and co author the Annual Demographia International Housing Affordability Survey. The 5th Annual Edition of this Survey was released January this year. His website is www.PerformanceUrbanPlanning.org.

  • It’s A Mall World After All

    If Indian Prime Minister Manmohan Singh wants a taste of home during his visit to Washington this week, he might consider a trip to McLean, Va., home to the region’s largest indoor mall, Tysons Corner Center. After all, there are few groups more mall-crazy than India’s expanding affluent class.

    Back here in the U.S., urban boosters and planners like to predict that malls are “vanishing.” But while consumer-deflated America may suffer from mall fatigue and a hangover from overbuilding, much of the developing world has experienced no such malaise. In 2000, for example, India was virtually mall-less. Today it has several hundred, with scores of new ones on the drawing boards.

    Malls are particularly attractive to India’s “aspiring” middle class, including those who have returned from work, study or travel abroad, suggests Vatsala Pant, director of client solutions at AC Neilson in Mumbai. Indian novelist and Mumbai blogger Amit Varma suggests that these folks like malls “because they are relatively clean and sanitized” as opposed to the city’s pollution-choked, beggar-ridden and often foul-smelling streets.

    Malls such as those built by mall developer Inorbit in suburban Malad or the new Paladium closer to the center of Mumbai boast many brands familiar to the suburban malls of the West–from Pizza Hut and Reeboks to Marks & Spencer. But they also contain scores of swanky shops selling saris and other Indian-made merchandise as well as trendy restaurants like the vegetarian thali palace Rajdahni. All cater almost exclusively to locals.

    This mall mania extends well beyond India. Today Asia is the site of seven of the world’s 10 largest malls, mainly in places like Beijing, Dongguan, China, Dubai and Kuala Lumpur, Malaysia. By 2010, China alone may be home to seven of the biggest shopping arcades on the planet.

    The rapid growth of mall culture in Asia and elsewhere reflects the rising incomes and expectations taking place across the globe. So while many malls struggle in North America, they are thriving in Asia due in part to suburbanization and automobiles. In the first 10 months of 2009, Chinese consumers alone purchased more cars than their American counterparts. India is also going through an automotive revolution, with sales up 20% since April and local firms like Tata, developer of the $2,500 minicar, Nano, gearing up for long-term growth.

    It’s not just growing affluence, car culture and suburbanization that are driving people into malls in India and other developing nations. Many of these places–like the American south and southwest–suffer hot, inhospitable climates. In Dubai, where the temperatures even in November hover well into the 90s, malls provide both a diverse shopping experience and relief from the heat.

    These malls also play a surprisingly democratic function often under-appreciated by urban theorists, planners and purveyors of architectural nostalgia. While Mumbai’s malls may not host the city’s scores of beggars, they can not be described as the exclusive province of the rich. The affluent may be there, of course, but so would their drivers, the factory workers and others of India’s growing aspirational population.

    “You get to see a massive cross-section of people, there for different reasons, all breathing the same [air conditioning],” Varma observes. “And really, these people only come together in the malls.”

    This oddly democratic phenomenon is also evident in the nearly 6 million square foot Dubai Mall. Of course, there are the evidently wealthy local Arabs in their traditional white flowing robes, but you also can spot the Filipino maids, British bankers, American and Korean engineers and a diverse array of Indians all shopping, eating and conversing in the air-cooled commercial oasis.

    “It’s the one place where people share a common culture,” observes Tabitha Decker, a Yale Ph.D. candidate working at the Dubai School of Government. “In a place like this, these are the boulevards.”

    This mall-ization of the developing world predictably offends many American and European critics who wish that the Third World remain “authentic.” The widely read Mexico City-based blogger Daniel Hernandez thinks places like Mexico’s swank Centro Santa Fe, on la capital’s southern edge, represents “all that is wrong with the rapid commercialization and privatization of urban development.”

    I wonder if he has tried making that case to the shoppers who flock west to the Santa Fe mall or the more middle-income Centro Comercial Perisur. These commercialized Mexicans look, dress and act remarkably like, well, Texans at the Houston Galleria rather than denizens of the traditional marketplaces so beloved by tourists and writers.

    Mexico-born developer Jose de Jesus Legaspi suggests that Mexicans come to malls because they find them more appealing than the somewhat grimy, and sometimes crime-ridden, traditional downtowns. “Some second- and third-generation Latinos may feel Mexicans should be dressing in huaraches, but really these places are like the traditional zocolo, a place to gather on Sunday,” Legaspi says.

    This social role, Legaspi believes, may prove critical to the future of the malls in America as well. Like many things in post-crash America, shopping is changing. But even though they’ve cut their purchases, Americans are hardly deserting malls any more than they are traditional urban downtown shopping districts. Just look at the dismal condition of Chicago’s State Street.

    Yet despite their travails, most malls likely won’t be stripped down in favor of dense urban neighborhoods or green fantasy zones for vegetable hothouses or bio-fuel production. Instead their future will depend on evolving from a purely consumptive palace to a “gathering place” that is safe and friendly, particularly for working- and middle-class families. In this sense, India, China, Dubai and Mexico may be not imitators as much as harbingers.

    Not surprisingly, in America the ethnic market is setting the new tone. The Latino-oriented mall Plaza Mexico in Lynwood, Calif., a 400,000 sq. foot open-air commercial center, consciously recreates the old zocolo through historic architecture, music and family-oriented fun. Even more ambitious is the enormous 1.2 million square foot La Gran Plaza in Fort Worth, Texas, which features such family-friendly fare as mariachis, Mayan dance, horse shows and even a Sunday Mass presided over by a local bishop.

    Equally revealing, both these centers also accommodate smaller, independent businesses in an adjacent mercado, in La Gran Plaza’s case one that extends 120,000 sq. feet. And you don’t have to have an ethnic focus for this formula to work. The Grove, a highly successful Los Angeles Mall, has emphasized family entertainment and a nearby link to the Farmer’s Market, a long-standing bastion of small, independently run businesses.

    Rick Caruso, the developer of the Grove, which now ranks among Southern California’s top tourist destinations, sees future American malls focusing on their social role, with closer links to local cultural events and celebrations. This is one way, Caruso believes, malls can compete with both big-box stores–stand alone centers built around a Wal-Mart, Target or Costco–and the rising force of Internet marketing.

    “The discussion of retail in America is really about community,” Caruso notes. “Lots of communities want to preserve something of Main Street and to keep the organic retailers who grew up in the area and are one of a kind. I think it works best in the long run. The key for a developer is how to keep both that feeling and the newer developments. You want to be seen as part of the future of the community.”

    Despite the predictions of their demise, the mall, both at home and abroad, appears far from finished. Like all urban forms, they must adjust to changing conditions but will likely thrive well after most of their critics are enjoying their university pensions. It looks like our increasingly small, globalized world will also be a malled one.

    This article originally appeared at Forbes.com.

    Joel Kotkin is executive editor of NewGeography.com and is a distinguished presidential fellow in urban futures at Chapman University. He is author of The City: A Global History. His next book, The Next Hundred Million: America in 2050, will be published by Penguin Press early next year.

    Photo by Rohtak8

  • Think Globally, Regulate Locally

    It was during a recent tour of a sun-baked Los Angeles schoolyard that theories on state regulations developed by the latest Nobel Prize-winning economist came into focus. The Da Vinci Design Charter School is an oasis in an asphalt desert. Opened this year by the appropriately named Matt Wunder, the school draws 9th and 10th graders from some of the most difficult and dangerous learning environments in the country, and introduces them to a demanding, creative atmosphere.

    The school is located just south of Los Angeles Airport. Wunder is taking advantage of the area’s proliferation of aerospace companies, and is building relationships with the likes of Boeing and Northrop Grumman, which offer financial and educational assistance. This is not the standard thinking one finds in the mammoth Los Angeles Unified School District.

    As we walked the playground we came upon two dirt-spewing holes in the blacktop, spaced about 50-feet apart. We discovered an actual human being with a shovel digging what looked like the beginnings of a mine shaft. The reason?

    California State regulations, as established by the California Architects Board, require all basketball hoops on public school campuses to be cemented into 50-inch deep holes. That’s four-feet-two inches for a basketball hoop!

    Now I am sure some scientifically sound earthquake testing at a California university found that such precautions are necessary if we are ever struck with a 9.9-Richter scale disaster. Of course, if such a thing happened we would have bigger problems than basketball rims keeling over. But a larger point became clear: In a school where creative leadership is making life-long impacts on the lives of children, the “long arm” of Sacramento has reached into the very soil, regulating how deep to dig ditches for recreational equipment. In so doing the State not only increases “construction” costs, but also incurs our disenchantment, as we consider a government that “trusts” local decision-making on curriculum, but not on hole digging.

    The theories of Elinor Ostrom, one of this year’s two Nobel Prize-winners in economics, tie in here with stunning irony. Ostrom, a political scientist at Indiana University, won the prize for her historical and economic analysis concerning the “tragedy of the commons”: the theory that, without some form of regulation, when people fish or farm “common” (non-private) property they will tend to abuse the privilege and hurt all interests in the end.

    A major underpinning of this theory is how these rule sets are most effectively developed. Ostrom found, in studies dating back centuries, that local parties –- sometimes non-governmental ones — almost always determine the best regulations, based on deliberated self-interest as opposed to centralized (and, often, distant) institutions.

    As Vernon Smith, a past economics Nobel laureate himself, recently commented on Ostrom’s work, “A fatal source of disintegration is the inappropriate application of uninformed external authority, including intervention to prevent application of efficacious rules to political favorites.” As rule-making becomes more removed from the actual location of execution, there’s a loss of “local knowledge” regarding conditions. And “interests” that tend to gather around centralized institutions have a disproportionate influence on legislation.

    At a recent conference on sustainable planning at Pepperdine University, I sat in on a discussion of “natural resource management” and heard a relevant story of competing, predominantly left-leaning interests. In one corner were the “green” energy folks who had attempted to build a massive solar “farm” in the Mojave Desert. In the same, uh, other corner, were the defenders of the desert tortoise. Not wanting to get anyone in trouble, I will just say that officials from several State and Federal departments were present to talk about how, once again, centralized decision-making had sunk an impressive project.

    Apparently, when alerted to the possibility of frying turtles under the heat of these huge solar mirrors, local park authorities provided a proposal to mitigate the loss of these reptiles through a variety of measures from fencing along the highways to moving the turtles to non-developed areas. This was not good enough for State decision-makers who, from the exalted heights of Sacramento, determined that the only legitimate course of conservation would be to land-swap the entire 8,000+-acre land parcel for another similar and suitable section for these animals. As one local official recounted, “If the goal of the policy is to save tortoises, we had that plan, which also kept the solar project alive. But the goal of the policy was to do a land exchange, which is stopping the project, and not doing all that much better for the tortoises.”

    My point in raising these two of what could be thousands of examples of overreach by the administrative state is not to dismiss government’s central and important role in advising, and, at points, regulating the actions of citizens in areas ranging from public safety to sustainable planning. Rather, it’s to demonstrate what happens when policy goals are subsumed by prescriptive policy created at levels (such as Sacramento in a state the size of California) which cannot possibly allow for unique local conditions. The goal is not just child safety, or saving tortoises, but to accomplish these in a certain way that may, in fact, prevent these greater benefits to the public good.

    This style of governance exasperates the well-intentioned in both the private and public sector, as it prevents the liberty necessary for creative and customized policy-making. This common sense approach to policy-making is, apparently, what they give out Nobel Prizes for these days.

    It was Alexis De Tocqueville who most famously realized that the genius in American governance was decentralized administration , an aspect directly contrary to the European bureaucratic experience. In words that could have appeared in Professor Ostrom’s classic, Governing the Commons, De Tocqueville wrote over 150 years ago, “When the central administration claims to replace completely the free cooperation of those primarily interested, it deceives itself or wants to deceive you. A central power, however enlightened… cannot gather to itself alone all the details of the life of a great people.”

    Let us not be so deceived.

    Pete Peterson is Executive Director of Common Sense California, a multi-partisan non-profit organization that supports civic engagement in local/regional decision-making. His views here are not meant to represent CSC. Pete also teaches a course on civic participation at Pepperdine University’s School of Public Policy.

  • California: The Housing Bubble Returns?

    To read the periodic house price reports out of California, it would be easy to form the impression that house prices are continuing to decline. Most press reports highlight the fact that house prices are lower this year than they were at the same time last year. This masks the reality of robust house price increases that have been underway for nearly half a year. The state may have forfeited seven years of artificially induced house price escalation in just two years but has recovered about one-fifth of it since March.

    California Housing Market Since 2000: In 2000, the average median house price among California markets with more than 1,000,000 population was $291,000. The Median Multiple (median house price divided by median household income) was 4.5, making houses in California approximately 50% more costly relative to incomes than in the rest of the nation.

    According to the California Association of Realtors, the average median price peaked at $644,000 between 2005 and 2007, depending upon the particular market. This nearly 140% price increase translated into a more than doubling of the Median Multiple, to 9.2.

    Median prices fell rapidly from the peak, dropping at their low point to an average of $315,000. The average Median Multiple fell to 4.4, slightly below the 2000 level, but still well above the national level. All markets reached their low points in the first part of 2009.

    It is at this point that the business press lost track of what was going on. Of course, year on year price declines continued, but only because the price declines had been so severe early 2008. Since the bottoming out of house prices, there have been strong gains. As of September, the average median house price among the major metropolitan areas was $383,000, a nearly 20% increase from the low point. Moreover, in dollar terms, median house prices recovered nearly 20% of their loss from the peak to the low point.

    Major California Markets: Median House Prices: 2000 to Present
    Metropolitan Area (MSA) 2000 Peak Low Point 2009/09 Loss: Peak to Low Pt Change from Low-Pt
    Los Angeles: Los Ang. County  $ 215,900  $ 605,300  $  295,100  $  351,700 -51.2% 19.2%
    Los Angeles: Orange County  $ 316,200  $ 747,300  $  423,100  $  496,800 -43.4% 17.4%
    Riverside-San Bernardino  $ 144,000  $ 415,200  $  156,800  $  172,400 -62.2% 9.9%
    Sacramento  $ 172,000  $ 394,500  $  167,300  $  184,200 -57.6% 10.1%
    San Diego  $ 231,000  $ 622,400  $  321,000  $  386,100 -48.4% 20.3%
    San Francisco  $ 508,000  $ 853,900  $  399,000  $  536,100 -53.3% 34.3%
    San Jose  $ 448,000  $ 868,400  $  445,000  $  553,000 -48.8% 24.3%
    Average  $ 290,700  $ 643,800  $  315,300  $  382,900 -52.1% 19.4%
    Exhibit: Median Multiple            4.5            9.2            4.4            5.2
    Above Historic Norm (3.0) 50% 208% 46% 73%
    Derived from California Association of Realtors and National Association of Realtors data
    Note: California Association of Realtors divides the Los Angeles MSA into Los Angeles and Orange counties

    Profligate Lending: It is critical to note that the inflated house prices that existed two to three years ago were wholly artificial. Prices had been driven up by the special and hopefully never to be repeated conditions of profligate lending, which increased demand.

    California: Regulating Away Housing Affordability: But the increase in demand alone would not have been enough to produce the unprecedented house price increases had public officials and voters not established a veritable mish-mash of housing supply regulations. The house price increases were driven ever higher by these severe land use restrictions, which prevented housing markets state from meeting demand.

    Supply restrictions, which go under various names, such as compact development, urban containment and “smart growth,” have been a feature of California housing for some time. Examples of such policies are urban growth boundaries, building moratoria and expensive development impact fees which disproportionately tax new homes for the expanded community infrastructure a rising population requires.

    As more loose lending practices increased the demand for home ownership, the inability (and unwillingness) of the state’s land use regulations prevented the housing supply from increasing in a corresponding manner. With demand for housing far outstripping supply, prices had nowhere to go but up. The result was short term house price escalation that may have never occurred before in a first-world nation.

    Contrast with Healthy Housing Supply Markets: There was a stark contrast with house price increases in the liberally regulated markets around the nation. For example, in Atlanta, Dallas-Fort Worth and Houston, house prices remained near or below the historic Median Multiple norm of 3.0, as the supply vent was allowed to operate. This is despite the fact that there was a strong underlying increase in demand for home ownership (measured by domestic migration) in these and other liberally regulated markets. In the California markets, on the other hand, there was overall negative underlying demand, with significant domestic out-migration. Of course, speculation ran rampant in California, as could be expected in any market where asset values are responding to a severe shortage of supply relative to demand.

    By the 1990s, Dartmouth’s William Fischel had associated California’s high house prices relative to the nation with the intensity of its land use regulation. In 1970, as the more severe regulations were beginning, house prices in California were at approximately the same level relative to incomes as in metropolitan areas in the rest of the nation.

    California’s disproportionate losses are illustrated by the fact that its major metropolitan areas have less than twice as many total owned houses as those in Texas (Dallas-Fort Worth, Houston, San Antonio and Austin), yet experienced gross value losses 85 times as great as the Texas metropolitan areas by Meltdown Monday (September 15, 2008, when Lehman Brothers failed).

    Recent Price Increase Rate Exceeds the Bubble: While widely unnoticed, the post-bottom median house price has increased 20%. In six months or less, the average median price increase among California metropolitan areas exceeded the annual price increase for all of the bubble years except one, which was 22% in 2004. The 2009 price increase rate, annualized, is nearly double that. As a result, despite the widely reported bubble collapse, California’s housing affordability now is worsening relative to the rest of the nation. The prospect could be for further inflation of the bubble, with the passage of Senate Bill 375, which is likely to lead to even more intensive land use restrictions, on the false premise that higher densities will materially reduce greenhouse emissions. As governments increasingly force development to occur only where it prefers, the property owning winners can extract much higher prices than would occur if there were more competition.

    This of course will mean that the more dense housing units built will be even more expensive, even as the market is prohibited from supplying the larger detached homes that households overwhelmingly prefer. All this will make California less competitive, something the increasingly uncompetitive Golden State could do without.

    Another View: The recent price escalation, however, may be illusory. The widely read California real estate blog, Dr. Housing Bubble suggests that the first wave of “sub-prime” loan failures that constituted the bubble burst could be followed by a second wave over the next few years, driven by “option arm” mortgage resets. The Doctor notes that these loans are concentrated in California and other ground zero states (Florida, Arizona and Nevada), unlike the previous wave, which was more evenly spread around the nation.

    In the End: Regulation Will Lose the Day: Thus, the “jury is still out.” The bubble may be re-inflating in California, or another bust could be on the horizon. However, in a state that has given new meaning to regulatory excess, the longer run prospects call for artificially higher housing prices, unaffordable to much of the state’s middle class. This means that California will continue to become an ever-more bifurcated state, between an aging, largely affluent coastal homeowning population and, well, just about everyone else.

    Photograph: Los Angeles (Porter Ranch in the San Fernando Valley)

    Wendell Cox is a Visiting Professor, Conservatoire National des Arts et Metiers, Paris. He was born in Los Angeles and was appointed to three terms on the Los Angeles County Transportation Commission by Mayor Tom Bradley. He is the author of “War on the Dream: How Anti-Sprawl Policy Threatens the Quality of Life.

  • Predicting the Future of British House Building

    People are expecting British house building to pick up. Sadly they will be disappointed, even as the housing market inflates into another bubble.

    There have been declines and recoveries in British house building before the 2007 collapse in construction activity. Data is in abundance. The total number of homes built annually has more than halved since the late 1960s, as successive governments withdrew from publicly funding the post-war welfare programme of council house building. There have been ups and downs in the volume of private housing built. After building 175,000 private homes in 2007 many expected that the market for new private housing would eventually recover from the financial crisis. The pent up demographic demand for new private housing would surely lead to a recovery of building if financing were made available. It seems irrational to suggest that the supply of housing will not recover to meet demand.

    In July 2008 audacity argued that British house builders would be collectively reduced in the planning regulated market to building 100,000 homes in 2009. They would shift from aspiring to build in “volume” to making their money from planning approved “eco-homes” for a luxury market. This has already occurred and there will be no necessary recovery of volume in a few years. Production may even decline from that level of inactivity.

    There seems little demand for new housing from the Public. Instead, we seem to be most concerned that housing continues to inflate in value as an asset. Most see obvious advantages in housing asset inflation, while complaining of the unaffordability of better housing. Britain is experiencing house price inflation again, but home owners know that the worsening gap between household income and the cost of buying a home, even on very low rates of interest, is frustrating new buyers, and the young in particular.

    Gordon Brown knows that playing the housing market is a mainstream activity for the electoral majority. New Labour is doing what is necessary to revive housing asset inflation. Some had hoped that the bursting of the bubble in 2007 would reconnect house prices with household income. Young people were understandably most hopeful of that prospect. Now prices are drifting upwards again to unaffordable highs. This is happening nationally, but is particularly true in greater London, where average house prices have recovered to nearly £270,000, which is where they were before the collapse of Lehman Brothers in September 2008. This makes an average house “affordable” to those earning more than £90,000 a year. That is a very small percentage of the region’s home buying public.

    Here’s what the restoration of higher prices means nationally, and in London in particular. There will be greater social immobility, expressed in more commuting, an extension of families, and several households living in the same home. Overcrowding will be more likely. Homelessness may slightly increase, but most housing difficulty will be accommodated within the existing stock.

    The mainstream majority of the electorate – those already owning homes – is likely to be grateful that the burst bubble did not turn into a crash. New Labour will try to take the credit for averting any further financial disaster. What will be ignored is that house price inflation suits Britain’s politicians, and the lending institutions in The City. The British economy is too weak to pay higher wages, and the mainstream majority are too politically weak to challenge that predicament. What other future is there for Britain except another asset inflation bubble?

    The problem then with restoring the Brown bubble is it solves none of our fundamental problems: notably a weak economy, low wages and lack of decent housing. David Cameron’s Conservative opposition will not make any difference to that predicament. They want to get rid of regional tiers of planners and to return control to local authorities, as was the intention of the 1947 Town and Country Planning Act. That is the legislation that stops the British public from building housing on cheap farmland.

    But it’s doubtful they will try to break the back of housing inflation and our country’s dependence on it. The British economy depends greatly on The City, which needs to expand the £1.2 trillion of mortgage lending in a secure way for lenders in the global financial system. This only happens when existing house prices are maintained well above the cost of constructing new ones, and best in a period of asset inflation. The trickle of new homes onto the market could reduce, and while any demographic demands of a growing population for the utility of housing would not be met, the political and economic demand for asset inflation and loan security will be satisfied.

    The way in which existing homes are made more expensive than the cost of building new ones is to inflate the price of land and keep it inflated. It is the high price of land approved for development within the 1947 legislation that is unaffordable. That is why government and house builders recognise there is “planning gain” to be negotiated over, as the uplift in land value that follows an approval to develop.

    Yet this stands in the way of a clear public interest. Government housing experts argue we need at least 240,000 new homes a year to meet demographic demand. Our inability, or even unwillingness, to tackle this issue would have shocked either the Conservatives or the Socialists of the last Century.

    What matters is to make materialist sense of the future. Society can’t live off asset inflation and debt. We must build new housing.

    We face a serious predicament today. Small quantities of highly subsidised and high density “eco-homes” are to be built by socially motivated architects, some working with the former “volume” house builders. How can building an insufficient number of homes be called “sustainable”? Instead of building new replacement homes Britain is also looking to finance a greener and endlessly refurbished housing stock, while producing too few “eco-homes” even to accommodate yearly household growth.

    The finance obsessed Green Capitalists of today are worse than their counterparts from a century ago. At least the Capitalists of the past were materialists, who believed in building more, and developing a construction industry based on materials manufacture and the skills of the workers they exploited. Those Capitalists were progressive materialists.

    The new capitalists in housing are not even interested in meeting the needs of the working and middle classes, but in pleasing environmentalists. Unsurprisingly, they also will not have to hire too many workers to build their meagre product. Today Capitalists are abandoning industrial production in favour of finance, and this is nowhere more evident than in housing. Hiding behind the moral claims of environmentalism the Capitalists of twenty-first century Britain have clearly abandoned any idea of social progress, when once they could claim to be materialists. What is noticeable is that they have so many moralistic Greens cheering them on.

    Sadly, there is no political association today to oppose Green Capitalists operating a nationalised planning system, in their effort to realise asset inflation in the form of a housing market. New Labour under Gordon Brown will not change this – indeed he clearly favours housing inflation and the City over the needs of aspiring families. So do the Conservatives under David Cameron. At the same time, they can play to a green constituency, which now dominates the media.

    Given the current planning regime and the moral imperative for building “eco-homes”, British house builders will be reduced to building around 100,000 homes for a very long time. They will aspire not to build in “volume” but instead take pride that their homes are “sustainable”.

    Only a political challenge will improve the situation. Gordon Brown faces no political challenge from David Cameron. He never will. Under New Labour or the Conservatives the only future for house builders will be to offer highly differentiated luxury “eco-homes” for the equity rich, or the top quintile of earners, supported with high subsidies in some form to build affordable “eco-homes”. Architects will particularly benefit from this shift in the market.

    New Labour will build a few council homes more as a publicity stunt to keep their middle class Old Labour supporters amused. Conservatives will not bother about such nonsense. They will both insist on “zero carbon” new housing by 2016. Both will focus on refurbishment of the existing stock, not replacement. Both will exclude more land from the planning system.

    The only people who will challenge this predicament, this retreat of Capitalism from population growth and industrial productivity, will be the working mainstream middle. Brown thinks he has bought off the majority of home owners with asset inflation, and temporarily he might have relieved many. Cameron thinks he can further mobilise established local residents attempting to extract more “gain” from the planning system. He imagines local opposition to development aggregating to a general protection of house price inflation nationally.

    These Red/Green and Blue/Green political leaders might be proved wrong. The construction industry matters, and with argumentative organisation materialists might push for house building against the greens of Britain. Most of all there is the new generation of British people – those entering their 20s and 30s – who will demand something other than over-priced, undersized and often miserably maintained housing for themselves and their families.

    A longer version of this article originally appeared at www.audacity.org/IA-07-11-09.htm

    Ian Abley, Project Manager for audacity, an experienced site Architect, and a Research Engineer at the Centre for Innovative and Collaborative Engineering, Loughborough University. He is co-author of Why is construction so backward? (2004) and co-editor of Manmade Modular Megastructures. (2006) He is planning 250 new British towns.