Category: Policy

  • Outer California: Sacramento Sends Jobs (and People) to Nashville

    A reader comment on a feature by John Sanphillipo (“Finally! Great New Affordable Bay Area Housing! Caught my eye.”). The comment ("You shouldn’t have to go to Nashville") expressed an understandable frustration about the sad reality that firms leaving coastal California often skip right over the Central Valley “where the housing costs are reasonable, there are some lovely old homes on tree lined streets, the humidity is less, the mountains are nearby, and you can drive there in 2-3 hours rather than fly.”

    Would that it were true. In fact, as this article will show, housing costs are anything but reasonable, given the median income, in the Central Valley, which along with the rest of the non-coastal portion of the state, will be referred to as Outer California in this article.

    California Housing Affordability: Into the Abyss

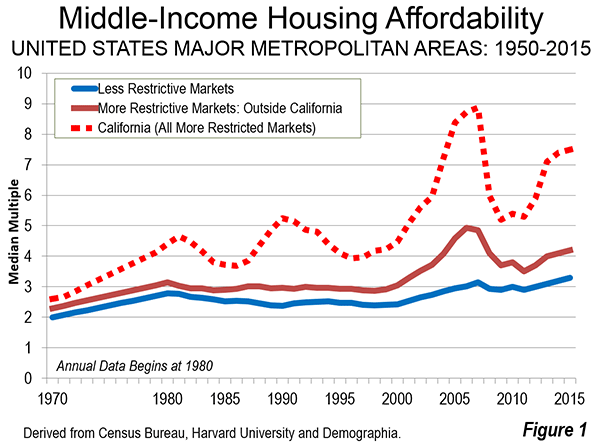
    California’s severely unaffordable housing is legendary, having escalated from approximately the average national price to income ratio in 1970. This is most evident in the four largest coastal metropolitan areas, Los Angeles, San Francisco, San Diego and San Jose. Out of the 87 major markets (over 1 million population) in nine nations, these markets ranked fourth, seventh and in a ninth place tie for the least affordable 8n the 12th Annual Demographia International Housing Affordability Survey. Their median multiples (median house price divided by median household income) required from 8.1 to 9.8 years income to purchase the median priced house. This compares to the affordability of these and other California markets which had median multiples of approximately 3.0 or less in 1970 and in prior years (Figure 1).

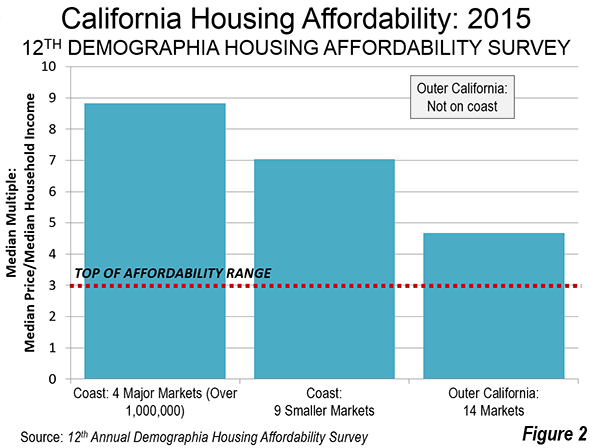
    The housing unaffordability of these markets, with an average median multiple of 8.8 is rivaled by the smaller coastal markets (such as Monterey County, San Luis Obispo, Santa Barbara and Ventura County), with their median multiple of 7.0. Both market categories are rated as severely unaffordable. But housing has become seriously unaffordable even in Outer California, where the average median multiple is 4.7(Figure 2). House prices have been escalating relative to incomes in Outer California since the housing bust, before which their housing affordability was even worse than now (below).

    Housing Affordability in Outer California

    A few examples will make the point. Riverside-San Bernardino, and exurban metropolitan area adjacent to Los Angeles had a severely unaffordable median multiple of 5.2 in 2015. Sacramento, had a seriously unaffordable median multiple of 4.7. Both of these major metropolitan areas reached far higher median multiples in the run-up to the housing bust, with Riverside San Bernardino reaching 7.6 and Sacramento reaching 6.6.

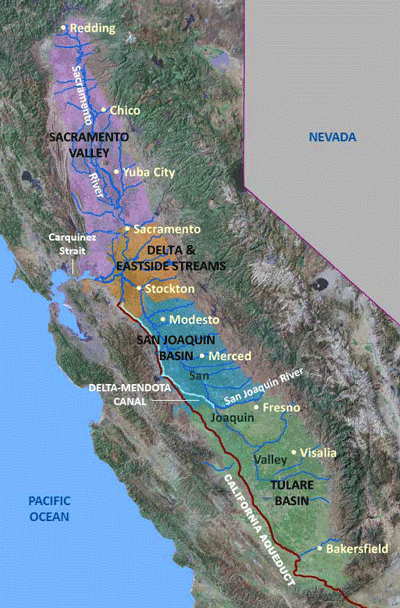
    But the problem is by no means limited to the largest metropolitan areas. Stockton, now officially a part of the larger San Jose-San Francisco combined statistical area as a result of a housing cost driven exodus of commuters from the Bay Area has a severely unaffordable median multiple of 5.3. Things were much worse in the run-up to the bust, at 8.6. Even long depressed Fresno, far from either the Bay Area or Los Angeles, is nearing severe unaffordability, with a median multiple of 5.0 and reached 7.2 during the bubble. More remote Chico, one of the smallest US markets in the Demographia survey also has a median multiple of 5.0 (see Central Valley map at the top).

    Modesto, a 2020 candidate for addition to the San Jose – San Francisco combined statistical area due to the overspill of households seeking houses they can afford, also has a seriously unaffordable median multiple of 4.5. Modesto reached 7.6 during the bubble.

    Among the 29 markets rated in California, the most affordable was Bakersfield, which in a few years is likely to follow Fresno into the over 1 million category. During the bubble, Bakersfield reached a median multiple of 6.6. Small town Visalia, nestled against the Sierra foothills, tied Bakersfield’s most affordable 4.3 median multiple, and reached an astounding 5.8 during the bubble. Hanford also tied for the most affordable.

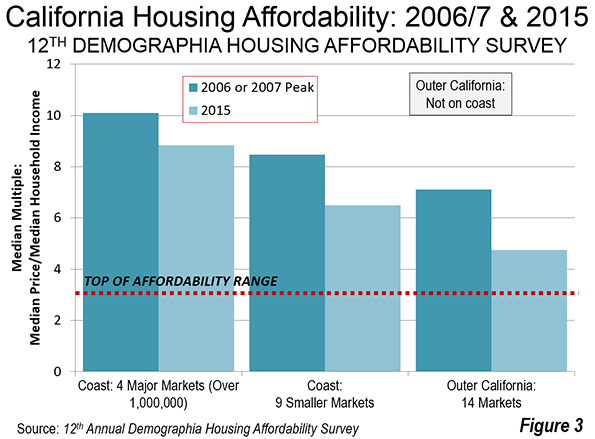
    The comparison to the bubble peaks is particularly important because it illustrates the volatility of housing markets. Even in small markets, house prices are prone to explode when demand exceeds supply, due in large part to land use regulatory and environmental law structure that restricts housing even in more remote areas,   driving prices up (See William A. Fischel, Regulatory Takings). Figure 3 shows that California house prices in each of the three geographic categories were even more unaffordable during the bubble than today.

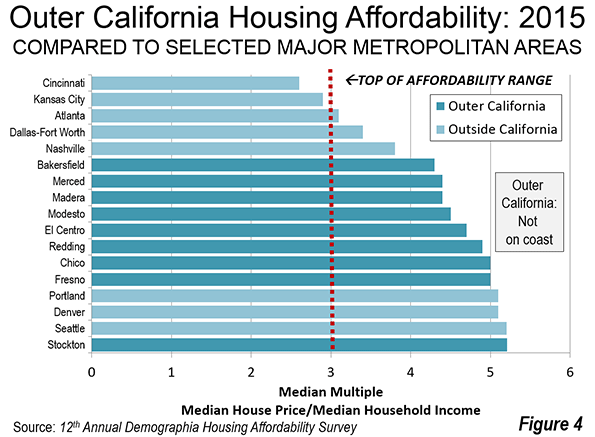
    Even at their current housing affordability levels, the housing markets of Outer California are considerably overpriced. This is indicated by Figure 2, which compares the median multiples in Stockton, Fresno, Bakersfield, Modesto, Redding, Chico, Merced, Madera and the Imperial Valley’s El Centro with severely unaffordable and overregulated Portland, Seattle and Denver, as well as Nashville and other major markets that are more affordable than any in California (Figure 4).

    Indeed, out of the 231 US markets in the Demographia International Housing Affordability Survey, the 27 California markets represent nearly half of the 58 most expensive.

    Meanwhile, a recent report by Zumper indicated among the 50 largest municipalities in the nation, four of the most expensive seven are also in California, with the city of San Francisco ranked number one, followed   San Jose at third, the city of Oakland at fifth and the city of Los Angeles at seventh. Eight of the most expensive municipalities out of the 100 largest are also in California, such as Palo Alto in the Bay Area, Coronado in the San Diego area and Santa Monica in the Los Angeles area.

    As if the regulatory and legal structure that combined with the artificially higher demand from loose lending policies were not enough, barely a decade later California is in the process of implementing one of the most radical land-use regulatory structure in a liberal democracy. It will be far more difficult in many areas to build the detached housing that is been the mainstay of the state, which already has the highest urban population density in the nation (see: “California declares war on suburbia"). This suggests that housing affordability is likely to worsen further.

    There is good reason for a both companies and middle income households to stay away from or leave California.

    More than Housing Affordability

    But people and businesses are moving to places like Nashville for reasons other than housing affordability. The state could hardly make it more clear that most business is not welcome. For at least 10 years, CEO Magazine has rated California as having the least favorable business climate. With competition like Illinois, Connecticut and New Jersey, to be ranked 50th with such regularity is a notable underachievement.

    Data recently released by the California Manufacturers & Technology Association (CMTA) indicated that California ranked last among the states in per capita attraction of manufacturing investments in 2015. Corporate relocation specialist Joseph Vranich continues to add to a long but for California unfortunate list of companies and jobs that have recently left the state (see: "California companies had for greatness – out of California).

    Of course, California is a beautiful place with one of the best climates in the world. But   millions of people and many companies have found greener pastures in Nashville, Austin, Dallas-Fort Worth, Houston, Charlotte, Atlanta and elsewhere. People will continue to visit, but the exodus is likely to continue.

    Wendell Cox is principal of Demographia, an international pubilc policy and demographics firm. He is a Senior Fellow of the Center for Opportunity Urbanism (US), Senior Fellow for Housing Affordability and Municipal Policy for the Frontier Centre for Public Policy (Canada), and a member of the Board of Advisors of the Center for Demographics and Policy at Chapman University (California). He is co-author of the “Demographia International Housing Affordability Survey” and author of “Demographia World Urban Areas” and “War on the Dream: How Anti-Sprawl Policy Threatens the Quality of Life.” He was appointed to three terms on the Los Angeles County Transportation Commission, where he served with the leading city and county leadership as the only non-elected member. He served as a visiting professor at the Conservatoire National des Arts et Metiers, a national university in Paris.

    Photo: Map of Central Valley (Sacramento Valley to the north, San Joaquin Valley to the south) courtesy of the U.S. Geological Survey

  • California’s State Religion

    In a state ruled by a former Jesuit, perhaps we should not be shocked to find ourselves in the grip of an incipient state religion. Of course, this religion is not actually Christianity, or even anything close to the dogma of Catholicism, but something that increasingly resembles the former Soviet Union, or present-day Iran and Saudi Arabia, than the supposed world center of free, untrammeled expression.

    Two pieces of legislation introduced in the Legislature last session, but not yet enacted, show the power of the new religion. One is Senate Bill 1146, which seeks to limit the historically broad exemptions the state and federal governments have provided religious schools to, well, be religious.

    Under the rubric of official “tolerance,” the bill would only allow religiously focused schools to deviate from the secular orthodoxy required at nonreligious schools, including support for transgender bathrooms or limitations on expressions of faith by students and even Christian university presidents, in a much narrower range of educational activity than ever before. Many schools believe the bill would needlessly risk their mission and funding to “solve” gender and social equity problems on their campuses that currently don’t exist.

    The second piece of legislation, thankfully temporarily tabled, Senate Bill 1161, the Orwellian-named “California Climate Science Truth and Accountability Act of 2016,” would have dramatically extended the period of time that state officials could prosecute anyone who dared challenge the climate orthodoxy, including statements made decades ago. It would have sought “redress for unfair competition practices committed by entities that have deceived, confused or misled the public on the risks of climate change or financially supported activities that have deceived, confused or misled the public on those risks.”

    Although advocates tended to focus on the hated energy companies, the law could conceivably also extend to skeptics who may either reject the prevailing notions of man-made climate change, or might believe that policies concocted to “arrest” the phenomena may be themselves less than cost-effective or even not effective at all. So, fellow Californians, sign onto Gov. Torquemada’s program or face possible prosecution and the fires of hell.

    Read the entire piece at The Orange County Register.

    Joel Kotkin is executive editor of NewGeography.com. He is the Roger Hobbs Distinguished Fellow in Urban Studies at Chapman University and executive director of the Houston-based Center for Opportunity Urbanism. His newest book, The Human City: Urbanism for the rest of us, will be published in April by Agate. He is also author of The New Class ConflictThe City: A Global History, and The Next Hundred Million: America in 2050. He lives in Orange County, CA.

    Photo: Troy Holden

  • Health and Class

    Late last year, economists Anne Case and Angus Deaton published a paper in the Proceedings of the National Academy of Science documenting the rising morbidity and mortality in mid-life white men and women in America, especially for those with a high school degree or less.  They attributed this increase, a reversal of historic trends, to an epidemic of alcoholism, other drug use disorders, and suicide. Their findings are a wake up call for the US. Not only is something seriously wrong — it’s getting worse.

    As a community psychiatrist (that is, one who works in the community providing publicly funded care) in Pittsburgh, I was not at all shocked to read the paper and the several others that followed and found essentially the same thing.  Working both in inner city black Pittsburgh and the more racially mixed Mon Valley, the primary site of Pittsburgh’s once vaunted steel mills, I have seen twenty years of increasing psychiatric burden and disability with what seemed to be a marked increase in mortality — all linked to increasingly fragmented, chaotic families, extraordinary work instability, trauma, violence, and alcohol and substance use.  While human services and health care were clearly in the picture in the lives of many (health care increasingly so with the Affordable Care Act), other critical institutions — steady work, solid education, high qualify day care, stable housing, organized communities – seemed to be less present, casualties of deindustrialization and neighborhood decline.  With the economic collapse of 2008 and the rise of the opiate epidemic, conditions have felt like they are in free fall, with tattered individuals and the remnants of families struggling to hang on.

    My day-to-day job is to do what I can to help people find ways to overcome their distress and rediscover their capacities and capabilities to find a way forward. Of course, I don’t do this alone. It requires a team effort to help suffering people recover and manage their illnesses and organize the resources they need to put a life together.  We have some resources to do this, such as the ACA’s expansion of Medicaid in Pennsylvania.  But still the observation of Julian Tudor Hart, a renowned British physician working among the miners in Wales, rings true: the people with the greatest need generally have the least access to resources. Hart called this the “Inverse Care Law.”

    For a long time and to this day, this has been the American approach to health care, though the ACA does a bit to address it.  Given this, some Americans may assume that the recent increase in mortality among white folks reflects a lack of access to needed care.

    The work of two other Brits, Thomas McKeown and Michael Marmot reveals the inadequacy of this belief.  McKeown made the trenchant observation that it wasn’t health care that made people healthy, but rather the conditions in which they lived. Marmot pressed this observation and, in a series of famous studies of civil servants in the British Government, found that health status was tied in a step-wise fashion with class.  Poor working-class people had worse health then their middle-class colleagues who in turn were less healthy than the highly paid executives.  These findings created a fire storm around the world, but some thirty years later, the idea has finally begun to find its way to the US in the form a focus on the “social determinants of health.” Where people live, their income, the resources available to them, the web of social relationships they experience, all come under this rubric. Health isn’t just about people’s lifestyle — whether they smoke or drink — or about their access to health care. It is fundamentally about the kinds of lives people live and how they are socially structured. Health is profoundly ecological– it reflects the social habitat and physical environment people live in.

    This new focus permits us to say that what’s happening to the health and well-being of poor white folks is clear evidence that the life worlds and social circumstances of their lives are falling apart.  Their social habitat is strained, and the strain is showing up in a looming body count.

    We could do more to make it easier for people to access the resources they need beyond health care and by tapping into their capabilities and capacities to find ways to flourish.  Steps in this direction include concepts like the “medical home”, an expanded version of accessible team- based primary health care that focuses on people’s well-being over the life course, providing preventive and clinical services, promoting health and connecting people to the resources needed for healthy living. In psychiatry, the recognition that people with psychiatric challenges have untapped capacities to recover — to find meaningful ways to live — is reshaping clinical approaches so they connect with and build on those capabilities. These innovations are all good, but they are woefully insufficient given the scale and scope of what the nation faces.

    To achieve what we need to achieve, our society needs to move the conversation about health and well-being upstream, away from a focus on health care alone, and link health and health care with general social policy.  The moves towards “the social determinants and processes of health,” “health in all policy,” “population health,” and “health impact assessments,” backed by a politics of social inclusion, are the ways forward to achieve health and social equity.

    The country we create determines the patterns of life and death of the people who live here. It’s not a job just for doctors and other health care providers. We are all stewards of the health of the people of this country. Increasing numbers of people won’t thrive and will die young until we fully embrace this responsibility.

    This piece first appeared in Working Class Perspectives.

    Kenneth S. Thompson MD is a public service community psychiatrist in Pittsburgh whose career has been focused on improving psychiatric care and achieving health equity.

    Ambulance photo CC BY-SA 2.5, https://commons.wikimedia.org/w/index.php?curid=678067

  • The End of Job Growth

    Pew Charitable Trusts recently posted an analysis of population projections that show several states with stagnant to declining workforces.

    This means that for nearly 20 states, it’s basically impossible to add jobs in the future. How can you add more jobs with fewer workers?

    That doesn’t mean there won’t be cyclical ups or downs or that some slack in the system might be taken up with some growth, but overall, stagnation to decline in jobs is going to follow.

    Pew’s article mentions states fighting to retain a high skill labor force, but this doesn’t seem very likely. Most of these places are in the north and northeast and have been stagnant for a long time.

    What’s going to change the migration of population to the South and West? While change is always possible, it’s not obvious what might cause it.

    Cities and states need to think hard about what this means for them. It seems to me is that one effect will be to fuel intrastate divergence, as success pools into islands in an era of overall shrinkage. You can argue we’re already seeing this.

    For most localities who aren’t among the favored winners, the reality is that they need to do what I advocated for Buffalo, and find a new psychology of civic improvement that isn’t rooted in growth – in population, jobs, or building stock. (I should add, Buffalo is in a far better position than most and could enjoy a relatively bright future – but it probably won’t be a big growth story)

    This won’t be easy.

    One of the great assumptions of the American worldview is the equating growth with success in our communities. Communities that are adding people, adding jobs, building new things, etc. are seen to be succeeding, whereas shrinking or stagnant ones must be failing.

    Everybody believes this. Even those who talk about “growth without growth” or tout increasing per capita income as the real measure of economic development invariably tout growth if there’s a figure that shows it.

    Lots of urbanists like to pooh-pooh Texas growth, but when 60,000 people move into downtown Chicago, or transit ridership soars in New York, or tech jobs explode in the Bay Area, they immediately tout and trumpet those figures as signs of success.

    And good for them. The point is that we all view growth as the measure of success.

    What would a new psychology look like?

    One example would be the boutique model. Rather than trying to be bigger, you become more exclusive. This isn’t a model that’s applicable to these stagnant places however.

    More realistically, these places need to focus on healing from or managing their problems (including managing decline in some places like rural communities).  Some areas of focus:

    • Pension and debt issues
    • Environmental remediation
    • Segregation
    • Raising educational attainment (to high school at least), even if that means the people subsequently leave
    • Infrastructure
    • Restructuring core services to be sustainable

    Not easy, and realistically requiring outside financial and technical assistance.

    What’s more, this is a to do list, not a psychology of success. How can one begin to articulate a positive, affirmational view of a place’s future that captures some program like this?

    Perhaps there are other ways to think about this too. Please share thoughts in the comments if you have them.

    The key is that with a shrinking working age population, there’s little prospect of job growth. So any governor in one of these places who has that as a long term economic objective is bound to be frustrated. This is a reality that will have to be faced.

    Aaron M. Renn is a senior fellow at the Manhattan Institute, a contributing editor of City Journal, and an economic development columnist for Governing magazine. He focuses on ways to help America’s cities thrive in an ever more complex, competitive, globalized, and diverse twenty-first century. During Renn’s 15-year career in management and technology consulting, he was a partner at Accenture and held several technology strategy roles and directed multimillion-dollar global technology implementations. He has contributed to The Guardian, Forbes.com, and numerous other publications. Renn holds a B.S. from Indiana University, where he coauthored an early social-networking platform in 1991.

    Top map image via Pew Stateline

  • SF Vs LA: Different Strokes In Urban Development

    Book Review: “The Rise and Fall of Urban Economies: Lessons from San Francisco and Los Angeles.” Michael Storper, Thomas Kemeny, Naji P. Makarem and Taner Osman; Stanford University Press, 2015.

    How and why do places differ in their pace of economic development? Why do some flourish while others lag? These are among the most profound questions in economics and related fields. Are explanations found in geography, culture, institutions, or fortune?

    In “The Rise and Fall of Urban Economies: Lessons from San Francisco and Los Angeles,” Michael Storper, Thomas Kemeny, Naji P. Makarem and Taner Osman consider these questions for two great cities. Storper, Kemeny, Makarem and Osman (hereafter SKMO) direct their attention to the Los Angeles and San Francisco “extended metropolitan regions” — the Census Bureau’s Consolidated Statistical Areas (CSAs) — in the post-1970 years. SKMO claim to have a plausible story about LA/SF divergence, which they do a fine job of presenting in this clearly written and well documented volume.

    Both areas were established centers in high-amenity coastal California settings with similar levels of economic success in base-year 1970. But their fortunes have diverged ever since, with San Francisco taking a significant lead.

    What happened?

    Much of SKMO’s story springs from employment trends summarized in their table, below, which shows jobs data by major sector for their beginning and ending years for each region. Looking at employment shares, both areas had a similarly sized IT sector in 1970, but the Bay Area’s grew spectacularly while LA’s stayed about where it was. LA was specialized in aerospace and defense but, as is well known, that sector declined as the Cold War ended. Both geographic areas started almost equally in share of logistics jobs, but SF’s specialization in that sector subsided, while LA’s grew. LA’s lead in entertainment grew. Both areas lost jobs in apparel, but this hit LA harder, as the region had been more specialized in that sector.

    The LA area was long recognized for its leadership in the entertainment industry, just as the San Francisco area was for its leadership in tech. Yet “Hollywood” has been emulated in many places, including India, South Korea, China, and several European countries, while Silicon Valley’s would-be emulators, though numerous, have been far less auspicious.

    The post-1970s success of the SF region owes much to Silicon Valley, and SKMO note that, on average, SF’s tech sector salaries were higher than those in LA’s entertainment sector. Lots has been written about the unique culture of innovation and entrepreneurialism found in The Valley. There are real and aspiring ‘techno-hubs” practically all over the world. But the Holy Grail — to identify and bottle some kind of formula to spawn another Silicon culture — has not been discovered.

    SKMO note various Silicon Valley pre-1970s events: how the electronics industry had its roots in radio hobbyists, and the 1960s convergence of hippies and techies. The authors identify eleven historical “critical turning points.” Some are private business choices (“Hollywood’s creation of a new project-based organizational structure in the 1950s and 1960s”); some are more in the realm of public policy (“Los Angeles’ Alameda Corridor Project in the 1980s and 1990s”). Others (Steve Jobs liked The Whole Earth Catalog) also make the list, but without any clear direction for today’s planners.

    The authors devote a chapter to what local governments in each of the two regions spent and prioritized. Bay Area government spending was greater in the 1990s, as well as in the first decade of the 2000s. While Bay Area public transit spending was much greater, SKMO admit that both areas suffer bad traffic congestion, and back away from concluding the extra Bay Area public spending had payoffs. They end up concluding that we simply do not know enough about the programs that were funded to make strong statements about how spending might have (or should have) been re-allocated among programs.

    The key chapter of the book addresses what the authors call ‘Beliefs and Worldviews in Economic Development’: “We will see … how the Los Angeles Economic Roundtable and Chamber of Commerce generated very different narratives from those of the Bay Area Council and Joint Venture Silicon Valley… Bay Area leadership has had a more focused and time-consistent perception of its regional economy as a new knowledge economy. Greater Los Angeles leadership beliefs and worldviews have been inconsistent over time, with fleeting conceptions of the New Economy subsequently crowded out by the perception of Greater Los Angeles mainly as a gateway to international trade and logistics and specialized manufacturing.”

    We have to be careful here. The sequence of events is significant: Did important policy choices pre-date the good (SF) or the bad (LA) events the authors document? The unique entrepreneurial and innovative culture bred in Silicon Valley has no discernible starting date. Did the view of Bay Area elites of a new knowledge economy lead the way, or simply acknowledge facts on the ground?

    In their study of LA and SF, SKMO say little about how both areas have failed to reign in housing costs. By failing to contain the rising costs of most households’ single largest expenditure, both regions have failed. Labor markets cannot do their job when many people’s location choices are restricted. In all of their talk of the best regional development strategy, this essential one is not touched on in the study.

    But, caveats aside, “The Rise and Fall of Urban Economies” is data-rich, wide-ranging and provocative. Anyone interested in the American West’s two premier cities should read this important book.

    Peter Gordon is an Emeritus Professor, Price School of Public Policy at the University of Southern California. He now teaches each summer at Zhejian University in Hangzhou, China, and is currently at work on a book that explores how modern cities contribute to economic growth. He blogs at petergordonsblog.com.

  • Focus on Cost-Effective GHG Emissions: Report

    The Reason Foundation has published my new research reviewing the potential for urban containment (or other restrictive policies that are sometimes called “smart growth”) to reduce greenhouse gas (GHG) emissions. Principal reports cited by advocates of urban containment are reviewed. The conclusion is that only minimal reductions if the gains from improved automobile fuel economy are excluded. Of course, fuel economy improvements have nothing to do with urban containment policy, but are unrelated policy options that allow people to avoid draconian lifestyle changes that probably are impossible anyway.

    The report, "Urban Containment: The Social and Economic Consequences of Limiting Housing and Travel Options" expresses concern that the use of costly GHG reduction strategies, such as urban containment, has the potential to create significant economic disruption and unemployment. The report concludes that sufficient GHG emission reductions can be achieved without urban containment policy and its attendant economic problems: "The key is focusing on the most cost-effective strategy, without unnecessarily interfering with the dynamics that have produced the nation’s affluence."

    Read more and download the full report at Reason.com

    Photograph: BMW i3. 124 miles per gallon equivalent electric car (currently available)
    by TTTNISOwn work, CC0, https://commons.wikimedia.org/w/index.php?curid=34818839

  • America’s Subway: America’s Embarrassment?

    Washington’s Metro (subway), often called "America’s subway," may well be America’s embarrassment. As a feature article by Robert McCartney and Paul Duggan in the Washington Post put it: “’America’s subway,’ which opened in 1976 to great acclaim — promoted as a marvel of modern transit technology and design — has been reduced to an embarrassment, scorned and ridiculed from station platforms to the halls of Congress. Balky and unreliable on its best days, and hazardous, even deadly, on its worst, Metrorail is in crisis, losing riders and revenue and exhausting public confidence." (emphasis by author.)

    The Post article started out by saying: "Metro’s failure-prone subway — once considered a transportation jewel — is mired in disrepair because the transit agency neglected to heed warnings that its aging equipment and poor safety culture would someday lead to chronic breakdowns and calamities." Moreover, according to the Post, there had been plenty of warnings over the nearly half-century the trains have been operated that maintenance and safety were not receiving sufficient attention. The article notes that the transit agency has lacked a robust safety culture and "it is maintenance regime was close to negligent."

    Indeed, things have gotten so bad that the new general manager Paul J. Wiedefeld ordered a one day system shutdown to make emergency repairs out of fear that a fault that killed one passenger a year ago might have recurred. The problem was considered so serious by Mr. Weidefeld that little more than 12 hours notice was provided: "Scores of passengers were sickened, one fatally, in a smoke-filled tunnel; a fire in a Metro power plant slowed and canceled trains for weeks; major stretches of the system were paralyzed for hours by a derailment stemming from a track defect that should have been fixed long before; and, on March 16, in an unprecedented workday aggravation for every Metro straphanger, the entire subway was shut down for 24 hours for urgent safety repairs."

    Things are so bad that Metro officials have warned it may be necessary to shut entire subway lines for up to six months to perform necessary maintenance.

    The feature length article, at nearly 5000 words, could well add to the Washington Post’s impressive list of Pulitzer Prizes.

    If there were an anti-Pulitzer Prize, it might well go to James Surowiecki of The New Yorkerwho opined: "Today, the Metro is in such a state that fixing it may require shutting whole lines for months at a time. It’s yet again an example for the nation, but now it’s an example of how underinvestment and political dysfunction have left America with infrastructure that’s failing and often downright dangerous."

    It is hard to imagine a more inappropriate characterization. Metro’s problem has nothing to do with any national infrastructure crisis. It is a crisis of competence — the failure of its governance system to competently manage the system.

    When is the last time that the entire New York subway was closed with 12 hours notice to make repairs critical to the safety of the system? Or when was the last such shutdown of the London Underground, the Paris Metro, or for that matter the Kolkata Metro or the Caracas Metro, much less the threat of closing lines for months at a time?

    How many of America’s many light rail systems have shut down as a result of their having failed to sufficiently maintain their safety? There is plenty to criticize about the many new urban rail systems in the United States. They may not carry the number of passengers projected, and often have cost far more than taxpayers were told and they may not have reduced traffic congestion. But they have managed to provide safe transportation to their riders. Only one of America’s rail systems has failed so abjectly in the most fundamental of its responsibilities: America’s subway in Washington.

    My one criticism of the Washington Post story is its preoccupation with finding new sources of funding. Funding levels do not excuse this failure. No one was forcing the powers that be in the Washington area to continue to expand a subway well into the hinterlands while the core was deteriorating. It was the responsibility of the governance structure of the Washington Metropolitan Area Transportation Authority (WMATA), which owns and operates Metro to put the safety of its customers first. If the priorities had been right and the system had not been built out faster than the funding would have prudently permitted, we would not be having this discussion.

    Perhaps the most important lesson to be learned from the Washington Metro failure is that we need to learn the lessons. As the Post article indicates, there are multiple reasons that have contributed to Metro’s failure over decades and a number of WMATA administrations. Certainly no single board of directors or manager bears principal responsibility. It is important to learn exactly what went wrong, and examinations by organizations such as the Government Accountability Office, the Congressional Research Service, the Department of Transportation Inspector General and others would be appropriate. It is important to recognize that Metro is not the typical transit agency that has fallen into financial difficulties. This is a very special case and needs to be treated as the serious governance and management failure that it is. Answers are needed before any new money should be allowed to flow for Metro. For its part, WMATA needs to figure out what it can competently do with the money that is available.

    Wendell Cox is principal of Demographia, an international pubilc policy and demographics firm. He is a Senior Fellow of the Center for Opportunity Urbanism (US), Senior Fellow for Housing Affordability and Municipal Policy for the Frontier Centre for Public Policy (Canada), and a member of the Board of Advisors of the Center for Demographics and Policy at Chapman University (California). He is co-author of the “Demographia International Housing Affordability Survey” and author of “Demographia World Urban Areas” and “War on the Dream: How Anti-Sprawl Policy Threatens the Quality of Life.” He was appointed to three terms on the Los Angeles County Transportation Commission, where he served with the leading city and county leadership as the only non-elected member. He served as a visiting professor at the Conservatoire National des Arts et Metiers, a national university in Paris.

    Washington Metro photo by Ben Schumin. SchuminWeb assumed (based on copyright claims). Own work assumed (based on copyright claims)., April 28, 2016

  • Would Reaganomics Work Today?

    The key drivers that propelled the Reagan economy are now tapped out or out of favor.

    The name of Ronald Reagan is frequently evoked by the current contenders to the GOP nomination. Donald Trump speaks admiringly of the 40th President of the United States and uses a truncated version of his 1980 campaign slogan “Let’s Make America Great Again”. Ted Cruz promises to implement Reagan’s solution of lower taxes, lower regulation and a stronger military. Before he bowed out recently, Marco Rubio was equal in his praise. And John Kasich stakes an even more tangible claim by reminding us that he is the only candidate who actually worked with Reagan.

    But if Reagan’s economy is something we can reproduce, we should first understand the most important drivers of that economy. Arthur Laffer, the father of supply-side economics, said in 2006 that the four pillars of Reaganomics were sound money, low taxes, low regulation and free trade. In addition to these four, we add our own two which are more contextual enablers than proactive policies: demographics and innovation. It is our contention that the first four would not have succeeded without the last two.

    Demographics: Reagan’s time in office coincided with powerful demographic tailwinds, namely a strong decline in the dependency ratio (DR), an accelerated rise in the American work force, and a rich demographic dividend. The dependency ratio (red line in the first chart below) is the ratio of dependents to workers, calculated as the sum of people aged less than 20 and over 64 divided by the number of people aged 20-64. When the US total fertility rate (TFR, the average number of children per woman) declined from 3.5 children per woman in 1960 to less than 2 in 1975, the dependency ratio followed with a lag, falling from 0.9 in 1970 to 0.76 in 1980, 0.70 in 1990 and 0.66 in 2010.

    Under the right conditions when the dependency ratio falls, the economy can reap a demographic dividend. With fewer dependents, households are able to divert more of their income toward discretionary spending, savings and investments, helping create more innovative companies that in turn boost the incomes of households. That is more or less the dynamic that propelled the US economy during the 1980s and 1990s.

    Screen Shot 2016-03-10 at 2.58.14 PM

    Looking at the future now, the dependency ratio bottomed in 2010 and is set to rise again from 0.66 in 2010 to 0.71 in 2020 to 0.83 in 2035. This increase is due mainly to the aging of the population and the increased number of dependents aged 65 or over. It is essentially a reversal of the powerful dynamic that benefited the economy in the 1980s and 1990s. The demographic tailwinds seen during the Reagan presidency have turned into headwinds.

    Screen Shot 2016-03-10 at 2.58.14 PM (1)

    In the second chart, we can see that the size of the US population aged 20-64 (red line) rose strongly from 1970 to 2015 and will level off and rise more slowly from here on. The population aged 30-59 (blue line), arguably the most productive and highest-earning and highest-spending segment, rose strongly starting in 1980 and flattened out around 2010. So here again, the two Reagan terms benefited from a rapid increase in the size of the work force. Clearly the most favorable period, the one with the highest acceleration, was from around 1983 to 2000, matching the economic boom of the Reagan to Clinton years.

    Note in passing that a similar chart for Europe, America’s top trading partner, shows an even more troubling picture. Excluding eastern Europe and Russia (red line below), the population aged 20-64 will fall from a peak of 267 million in 2010 to an estimated 232 million in 2050. Including eastern Europe and Russia, it will fall from 459 million to 370 million.

    Screen Shot 2016-03-14 at 4.57.43 PM

    (the charts above were derived by populyst from data produced by the UN Population Division).

    Innovation: Reagan came to office at a time of great innovations in computer technology. Innovation was then and remains now one of the most potent drivers of the economy. We have every reason to hope that America will remain as innovative as it was in the past. But the rate of innovation will certainly suffer if skilled foreign professionals are unable or unwilling to come and work in the United States because of more restrictive visa or residency policies.

    Interest Rates: Reagan started his first term with very high inflation and interest rates. Both started to decline during his presidency, helping stabilize and grow the economy and boosting the stock market. But we now face the risk of deflation. And interest rates are at rock bottom. As shown in the chart below from Goldman Sachs, the 10-year US Treasury yield was near 16% when Reagan took office and it is now at 2%, near all-time historic lows. Real rates are still negative and the Federal Reserve has few options left in its efforts to stimulate the economy through monetary policy.

    Screen Shot 2016-03-13 at 7.46.05 AM
    (click image to enlarge)

    Taxes: It is true that President Reagan enacted important tax cuts but these cuts came at a time when the marginal income tax rate was much higher than it is today. The chart below from the Tax Foundation shows that the top rate in 1980 was 70% and is now 39.6%.

    Screen Shot 2016-03-13 at 7.26.58 AM

    The top corporate income tax rate was 46% in 1981 vs. 35% today. And the top rate for long-term capital gains was 28% vs. 20% today (plus a 3.8% Medicare tax since 2013).

    Reagan’s tax cuts came at a time when spending on entitlement was relatively small compared to what it will be in the years ahead. Even at current levels of taxation, the federal budget deficit is expected to start rising again due to additional spending on old-age entitlements. The Congressional Budget Office predicts an expansion in the deficit from $439 billion in 2015 to $810 billion in 2020 and $1,226 billion in 2025. (see pages 147-149 of this CBO publication.)

    And as shown in the chart below from the St. Louis Fed, the federal debt is now much higher at over 100% of GDP, vs. 31% when Reagan took office.

    Screen Shot 2016-03-14 at 10.43.38 AM (2)

    It seems clear therefore that there is not as much scope for cutting taxes in the current environment as there was in the early 1980s. Unless accompanied by other changes, implementation of a flat tax or general cuts in tax rates are likely to increase the debt and deficit beyond the already high projections.

    Free Trade: Opening new markets and lowering trade barriers were cornerstones of US policy in the 1980s and 1990s. If today European demand is slackening and China is entering a slower period, there could be new markets for US exports in the Asian and African frontier markets that are experiencing a demographic boom. Expanding trade to these new markets would spur new demand for American goods.

    But free trade is now under attack from parties who argue that too many American jobs have gone abroad to China, Mexico and others. The presidential primaries have shown so far that a non negligible segment of the American electorate has been receptive to this argument. This means that the openness of free trade could in coming years be slowed or indeed reversed.

    Adding it all up, the table summarizes the scope for success of Reaganomics today vs. in 1981.

    Screen Shot 2016-03-15 at 10.55.18 AM

    Hoping for a replay of the Reagan years through action on the same economic levers will most likely result in disappointment. Leading 2016 candidates have expressed hostility towards free trade and have called for restrictions on all forms of immigration. In addition, the underlying context is now less conducive to growth than it was in 1981.

    Nonetheless, another component of the Reagan formula was a healthy dose of optimism. Economic prospects seemed insurmountable in 1981 but the ensuing boom surpassed expectations. The US economy remains flexible and innovative and will find a way to muddle through until contextual factors improve and higher growth returns.

    Sami Karam is the founder and editor of populyst.net and the creator of the populyst index™. populyst is about innovation, demography and society. Before populyst, he was the founder and manager of the Seven Global funds and a fund manager at leading asset managers in Boston and New York. In addition to a finance MBA from the Wharton School, he holds a Master’s in Civil Engineering from Cornell and a Bachelor of Architecture from UT Austin.

    Photo by White House Photographic Office – National Archives and Records Administration

  • Geography and the Minimum Wage

    Most commentary on California’s decision to increase the state minimum wage to $15 over time is either along the lines of it being a boon to minimum-wage workers and their families or a disaster for California’s economy.  Neither is accurate.  Different regions sill see different outcomes.  Central California, the great valley that runs from Bakersfield to Redding, once again, will bear a disproportionate burden. 

    Some workers’ income will increase, but hardly enough to afford a standard of living that most readers would find acceptable.  At 40 hours a week and working 52 weeks a year, the minimum-wage worker will earn $31,200 a year before taxes.  Try living on that in San Francisco or Santa Barbara.

    Then, there are the workers who will lose their job, or never get one in the first place.

    A $15 an hour wage would devastate some economies, but California is different.  Individuals and families may be devastated.  Regions may be devastated.  Coastal California, with the possible exception of Los Angeles and the far northern counties, will do just fine.  You will probably not be able to see an effect in their data.

    Central California is another story.

    California is in transition from a tradable goods and services producing economy to a consumption and non-tradable services producing economy.  Tradable goods and services are goods and services that can be consumed far from where they are produced.  Manufacturing is the classic example of tradable products, but thanks to the internet, services are also increasingly tradable. 

    These days, many services that were once non-tradable are tradable.  Tax preparation, legal research, accounting, and term-paper writing are examples of tradable services that were once non-tradable.  As a friend of mine says, anything done at a computer can be done anywhere in the world.

    Non-tradable services are those that must be consumed where they are produced.  Lawn care, haircuts, and home maintenance are some examples.

    The distinction is important because a minimum wage increase affects each differently.

    The initial impact of a minimum wage increase is to increase the cost of the goods or services, tradable or non-tradable.  It’s what happens after the increase in cost that makes the difference.

    Consider a minimum wage increase on one side of a street and not the other side.  You might consider walking across the street for a burrito, cup of coffee, or haircut, if the price is cheaper there.  This is the substitution effect.  It will be almost non-existent for non-tradable services with a statewide minimum wage increase.  No one will drive to Arizona for a haircut or cup of coffee. 

    Non-tradable services are left with only a price effect, to be discussed in a bit.

    Tradable producers, though, face a formidable substitution effect.  They are competing with producers worldwide.  If they raise their prices, it is likely that enough customers will switch to other producers that tradable producers will be forced to relocate for lower-wage workers of go out of business.  If they lack monopoly power, they are unlikely to be able to absorb the cost increase.

    One impact of California’s minimum-wage increase, then, will be an acceleration of California’s transformation to non-tradable services production and the permanent loss of tradable sector jobs, outside of fields like software.

    It is fundamental to economics that the higher the cost of any good or service, the less that will be consumed.  This is the price effect, and it affects tradable producers differently than non-tradable producers.

    Unless they have monopoly power, tradable producers will not see a price effect.  The world price will remain the same.  Total world consumption will stay the same.  The distribution of sellers, however, will change.  Agriculture is an excellent example of competitive world markets.  California will likely provide a smaller share of the world’s agricultural output.

    If the tradable producer has monopoly power, the price effect may be large or small.  If it is small, they will see a small decline in sales.  If it is large, they may have to absorb the increase, sacrificing some of their monopoly profits.

    Non-tradable producers will face a price effect.  How big that price effect is depends on the wealth of their customers and how essential the service is to the consumer.  A wealthy person will probably not change their behavior because of, say, a ten percent increase in the cost of haircuts.  A poor person may reduce the frequency of haircuts.

    Tradable sector and non-tradable sector businesses will attempt to minimize the cost increase of a minimum wage hike.  This is most easily achieved by replacing some labor with capital.  This is the production function effect.  Assembly line workers may be replaced with robots.  Waiters may be replaced with tablets at the table, as we’ve already seen in some restaurants.

    Some would argue that there is another effect, an income effect.  The idea is that the increased income, and spending of minimum-wage workers will more than offset the price and substitution effects.  This violates another fundamental economic principle, the one that asserts that there are no free lunches.  The minimum wage earner’s new income is not new wealth miraculously provided by the minimum-wage fairy.  For every new dollar the minimum-wage worker has to spend, someone else has one less dollar to spend. In fact, due to inefficiencies (distortions in product mix and markets resulting from non-market prices) created by the transfer, someone else must forego more than one dollar in order to create the dollar provided by wage increase.

    Analysis of price and substitution effects implies that different California regions will be affected differently by the minimum wage increase.

    Because wages are generally lower in Central California than in Coastal California, the minimum wage increase will be more impactful in Central California, amplifying both price and substitution effects relative to Coastal California.  Central California’s economy is also more dependent on tradable-goods production than is Coastal California, it will, therefore, be hurt more by the decline in tradable-goods producers.  Similarly, because Central California’s income is less than Coastal California’s, it will also see a greater price effect on its non-tradable producers.

    Central California is seemingly in perpetual recession.  Even in good times, many Central California counties see double-digit unemployment.  Colusa County’s unemployment rate was over 20 percent in the most recent data release.  The region also sees disparate impacts from California’s high energy costs, water policies, and regulatory infrastructure, all of which hit them much harder.

    Coastal Californians underestimate the economic differences between California’s regions.  They are huge.  California simultaneously has some of America’s wealthiest communities and some of its poorest.  It’s important that we remember that California, with about 12 percent of America’s population, has 35 percent of the nation’s welfare recipients.

    Most of California’s wealthy coastal citizens never see California’s poor inland communities.  Yet, wealthy Coastal Californians — particularly from San Francisco — dominate state policy.  They implement policy as if the entire state were as wealthy as the communities they live in.  The minimum wage increase is just the latest example.

    Decency would seem to require that California find ways to accommodate the circumstances and needs of our least advantaged citizens and regions.  We don’t though.  Instead we create policy that hurts our least advantaged and makes their challenging lives even more so.

    Bill Watkins is a professor at California Lutheran University and runs the Center for Economic Research and Forecasting, which can be found at clucerf.org.

    Unemployed woman photo by BigStockPhoto.com.

  • Liberals — Except When it Comes Home

    My old boss, Bruce Brugmann, who ran the Bay Guardian, told me early on in my career that you could tell the real politics of a big-city newspaper by the person they endorse for mayor.

    Nice liberal outfits like the New York Times support Democrats for president and (typically) governor and US Senate. The SF Chronicle doesn’t endorse many Republicans any more. But when it comes to the local stuff, the decisions on who should run the city where they live and operate and connect with the power structure, the truth comes out.

    The Times loved Ed Koch and backed Michael Bloomberg. The paper didn’t endorse Bill DeBlasio in the Democratic primary. The Chron backed Dianne Feinstein, John Molinari, Willie Brown, Gavin Newsom, and Ed Lee.

    There’s a perception that cities like SF, because they tend to vote overwhelmingly for Democrats, and send Democrats to the state Legislature and Congress, are by nature progressive communities. And that all breaks down when it comes to local issues, particularly when they involve real estate.

    The biggest Democratic Party donors in SF in the 1980 and 1990s were the members of the Shorenstein family, who hosted Bill Clinton at their home. They were also big downtown developers who spent that same Democratic money blocking any attempts to development limits.

    Our Democratic member of Congress, Nancy Pelosi, is either missing or on the wrong side on pretty much every land-use and development issue back at home.

    Gavin Newsom, who wants to be the next governor of California, got his start in local politics attacking homeless people.

    In other words, the gentrification and displacement in San Francisco is happening despite, and I could argue with the concurrence of, some of those “liberal” Democrats who, from a distance, seem much more progressive than they are when you look at their records right here at home.

    So we get what I call the David Chiu phenomenon – a person who pushed and promoted legislation backed by and in part written by Airbnb, which has driven thousands of housing units off the market, gets seen as a San Francisco progressive when he’s away in Sacramento.

    You can tell what a newspaper really thinks by its endorsement for mayor. And you can tell what a politician really thinks by what they do on the local issues that pit the power structure (in this case, tech, real estate, and the mayor) against the rest of the community.

    Which brings me, more or less, to Paul Krugman, the great liberal economist of the New York Times.

    Krugman is great on a lot of big national economic issues. He’s terrible when it comes to cities.

    The guy famously came out against rent control years ago, when any urban economist with any sense knows that rent control is one of the most powerful tools agaist displacement. It’s what makes an urban middle class possible in a city like San Francisco.

    And now he’s saying that cities need to reduce zoning rules and allow more housing, or any height, pretty much anywhere. He praises the idea that NY Mayor DeBlasio is pushing, which is similar to what SF Mayor Lee is pushing, which in essence cedes to the private market the responsibility to provide affordable housing and assumes that some modest percentage of “affordable” units in luxury towers that are geared to the same crooks and despots now in the news will be a real solution to the urban housing crisis.

    I shouldn’t have to keep saying this, but I will: You need to build at least 30 percent affordable housing in every luxury project just to stay even, and not make things worse. Which means if you want to add to the stock of affordable housing, you have to force developers to build 40, 50, 60 percent of the units for people of more modest means.

    That’s not even on the agenda in SF or NYC.

    If we took Krugman’s national approach – the rich ought to pay more taxes to pay for investment in the nation’s service and infrastructure – and applied it to cities, you’d get a very different approach. Urban developer profits have created great fortunes (Shorenstein, Trump); to a great extent, local governments have failed to tax those profits at a level that’s necessary to mitigate the impacts of their projects.

    Krugman ought to know that the middle class in an American city is not a natural consequence of capitalism. It requires strict regulations and controls. It means, sometimes, slowing down the booms that make a few rich so that the rest of us have a chance, too.

    That’s perfect liberalism, in the old school. Except that these great scholars and writers (and politicians) don’t seem to want to bring those policies back home.

    Author Tim Redmond, the former longtime editor of the San Francisco Bay Guardian, edits the online San Francisco publication 48 hills.

    This piece originally appeared at 48hills.org.

    By Prolineserver (Own work) [GFDL 1.2], via Wikimedia Commons