Category: Policy

  • California Environmental Quality Act, Greenhouse Gas Regulation and Climate Change

    This is the introduction to a new report, California’s Social Priorties, from Chapman University’s Center for Demographics and Policy. The report is authored by David Friedman and Jennifer Hernandez. Read the full report (pdf).

    California has adopted the most significant climate change policies in the United States, including landmark legislation (AB 32)2 to lower state green- house gas (GHG) emissions to 1990 levels by 2020. Proposed new laws, and recent judicial decisions concerning the analysis of GHG impacts under the California Environmental Quality Act (CEQA), may soon increase the state’s legally mandat- ed GHG reduction target to 80% below 1990 levels by 2050.3 The purpose of California’s GHG policies is to reduce the concentration of human-generated GHGs in the atmosphere. The United Nations Intergovernmental Panel on Climate Change (IPCC) and many other scient.c organizations have predicted that higher GHG atmospheric concentra- tions generated by human activity could cause catastrophic climate changes.

    This paper demonstrates that even the complete elimination of state GHG emissions will have no measurable effect on climate change risks unless Cali- fornia-style policies are widely adopted throughout the United States, and particularly in other countries that now generate much larger GHG emissions. As California Governor Jerry Brown, a staunch proponent of climate change policies, recently observed, “We can do things in California, but if others don’t follow, it will be futile.”4 Similarly, the California legislature recognized at the time that AB 32 was enacted that at- mospheric GHG concentrations could only be stabilized through national and international actions, and that the state’s “far-reaching effects” would result from “encouraging other states, the federal government, and other countries to act.”5 Nevertheless, the extent to which California’s GHG policies have and may be likely to inspire similar measures in
    other locations, is rarely, if ever seri- ously evaluated by state lawmakers or the California judiciary. Absent such considerations, imposing much more substantial GHG mandates may not only fail to inspire complementary actions in other locations, but could even result in a net increase in GHG emissions should population and economic activity move to locations with much higher GHG emission rates than California.

    Key findings include the following:

    1. Most scientists agree that climate change risks are associated with the atmospheric accumulation of gases with high global warming potential includ- ing carbon dioxide and other gases attributed to human activity (collectively “carbon dioxide equivalent” or “CO2e” emissions). In 2011 California accounted for less than 1% of global CO2e emissions, and less than 0.065% of the worldwide annual CO2e emissions increase that occurred during 1990-2011. The state’s per capita CO2e emissions are much lower than in the rest of the United States, and comparable with relatively efficient advanced industrial countries like Germany and Japan.

    2. Despite its sizable population and economy, California generates a relatively minute, and falling, share of global CO2e emissions. The amount of global CO2e emissions and atmospheric concentrations would have been virtually unchanged, even if California’s GHG emissions were zero from 1990-2011, and remained at that level and assuming cur- rent emission trends in other locations continued through 2050.

    3. As recognized in AB 32 and by other state leaders, California’s ability to reduce climate change risks is not primarily a function of reducing state emissions. To have any measurable effect on global CO2e levels, the state must show that CO2e emissions can be reduced in a manner that also allows societies, such  as China and India, to improve the prospects for the vast majority of the population now living in or near poverty conditions. Over the last several decades, and especially since the mid-2000s, when climate change emerged as the state’s dominant environmental policy focus, California has failed to demonstrate that it can sustain a thriving middle and working class in addition to its most affluent  population.

    4. As sharply illustrated by Tesla’s recent decision to locate a $5 billion electric car facility, and 6,500 green jobs, in Nevada, California continues to suffer from a relatively poor global economic reputation as a place to do businesses outside high-end services and technology development. This drives even green energy manufacturing, let alone more traditional industries, from the state. State policies also reduce middle and working class employment opportunities, and increase housing and other key living expenses, such as energy costs.

    5. Ironically this has resulted in a mas- sive displacement of former state businesses and residents to other locations with higher per-capita CO2e emission levels. Since 1990, 3.8 million former residents, approximately the population of Oregon or Oklahoma, relocated to other states. Billions of dollars of  economic activity which might have remained in California have now been relocated to states and foreign countries with much higher emissions and weaker regulations. The cumulative net CO2e emission increases generated by the unprecedented movement of the state’s former residents and continuing loss of economic activity to higher GHG generating locations nearly offsets the GHG reductions that would  be achieved in California under AB 32.

    Section I of this paper provides background information about historical CO2e atmospheric concentrations, the extent of global CO2e emissions over time, climate change risks associated with these trends, and California’s relative contribution to worldwide CO2e emissions. This section demonstrates that California accounts for a minute and falling share of global GHG emissions.

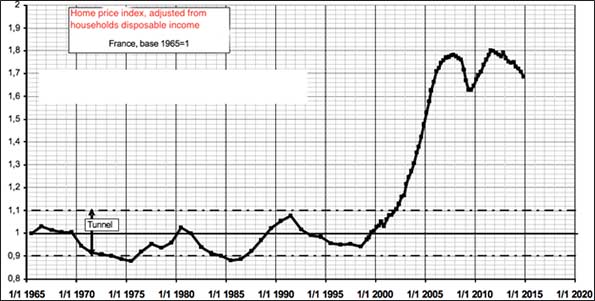
    Section II discusses the development of California’s current climate change policies and shows that, in the past, California consistently recognized that CO2e emission reduction goals must be adopted in a measured, balanced man- ner to facilitate the concurrent need for economic growth and other important social objectives. Despite recent increases in corporate earnings by Silicon Valley corporations, increased home prices to pre-recession levels, and a decrease in reported unemployment rates, California also includes the nation’s largest number and highest percentage of people living in poverty. Nearly 24% of the state’s population is impoverished according to recently released U.S. Census Bureau statistics and faces enormous economic and social challenges.

    The state’s ability to meet its pressing social and economic challenges could be worsened by proposed legislation and judicial interpretations of CEQA mandating much more substantial GHG reductions than even sympathetic scientific assessments have found to be unachievable using any current technology.

    Sections III and IV show that, even assuming that California had zero CO2e emissions during 1990-2011, and for an additional four decades projected to 2050, global CO2e emission levels and atmospheric CO2e concentration would be virtually unaffected. In fact, unrealistic unilateral GHG reduction mandates can actually increase global CO2e levels and associated climate change risks by discouraging states and countries from adopting similar policies, and by displacing people and industries to locations with higher emissions.

    The achievement of significant, but more realistic GHG objectives and broad-based economic and social growth would have an immeasurably greater effect on atmospheric CO2e concentration levels if the state’s economic vitality proved a workable model that also allows for the achievement of critical social aims, such as reducing poverty and improving the standard of living for the middle class and those aspiring to join the middle class.

    Read the full report (pdf).

  • Land Use Regulations and “Social Engineering”

    All forms of land use regulation are explicitly “social engineering”. Full stop. Let’s acknowledge that reality as we move forward. The question is never whether we’ll be engaging in manipulating society through land use regulations, but how and why.

     Screen Shot 2015-03-30 at 1.59.06 AM


    The typical pejorative reference to “social engineering” includes things like government built subsidized low income housing or rent control imposed on private property. There are large numbers of people who find this sort of thing distasteful. I understand the objections, particularly since so much public housing has been so bad and rent control distorts the rental market. Then again, lots of for-profit housing is really bad and all sorts of other things distort rental markets.

    Screen Shot 2015-04-26 at 3.22.22 AM
    Screen Shot 2015-04-26 at 3.20.47 AM

    How about a municipality that dictates all new construction must be single family detached homes with a minimum 2,800 square feet on a lot that’s at least a quarter acre? What exactly is the logic behind that kind of land use control? Well… a particular town might want to “socially engineer” a middle class demographic in and a lower class demographic out. If only large expensive homes are available then the “wrong” kinds of people can’t live there. And their “undesirable” children can’t attend the local schools, etc.

    It’s also possible to “socially engineer” a private community so that it only includes people of a certain age… say, 55 and over. Municipal governments love retirement communities because they pay property tax, but don’t burden the town’s budget with school aged children. And most of the social services for retirement age folks are paid for by federal and state programs rather than local government. This sort of thing certainly distorts the local property market as well. So let’s be honest and say that some people like certain kinds of “social engineering” but not others.

    Screen Shot 2015-04-26 at 2.23.01 AM screen-shot-2014-10-08-at-11-12-33-am

    Screen Shot 2015-04-26 at 3.39.35 PM

    Voters in some areas value the rural agricultural quality of the landscape and don’t want to see the place paved over with new subdivisions, gas stations, and strip malls. Land use regulations are put in place with restrictions like zoning that requires new homes to be built on no less than forty acres. In addition, there are procedures that restrict new construction based on water availability, flood hazards, soil percolation, and so on. These policies work together to keep most of the land unavailable for development. These policies do in fact preserve the beauty of the open landscape, but they also restrict the supply of buildings and drive up the cost of property in the area. “Social engineering.”

    Screen Shot 2015-03-28 at 4.28.34 PM

    Screen Shot 2015-03-28 at 6.14.03 PM

    Screen Shot 2015-03-28 at 8.22.21 PM

    Screen Shot 2015-03-28 at 4.26.34 PM

    Screen Shot 2015-03-28 at 4.25.28 PM

    Other areas have pro growth policies that encourage development. Each new shopping mall, housing tract, and car dealership represents tax revenue and progress. There are a host of professional organizations that relentlessly lobby for new growth in order to promote full employment, affordable middle class homes, and a continuation of the suburban lifestyle. As property taxes rise the cost of having land sit idle becomes prohibitive just as potential profits rise. Owners are pressured into selling or developing whether they necessarily want to or not. Individual buildings sell well and bring many immediate benefits, but the long term consequences often destroy the landscape and reduce the quality of life. “Social engineering.”

    Screen Shot 2015-04-28 at 2.52.11 AM

    Screen Shot 2015-04-28 at 2.54.35 AM

    Screen Shot 2015-04-14 at 6.50.45 PM

    Screen Shot 2015-04-15 at 12.12.45 AM

    These photos show a form of development that is illegal almost everywhere in North America. The buildings all touch. That’s illegal. Some buildings have both commercial and residential uses. That’s illegal. All of these buildings have little or no parking. That’s illegal. Even at just three or four stories there’s still far too much density. That’s illegal. There’s a long list of handicap accessibility inadequacies in these buildings. That’s illegal. The streets between these buildings are much too narrow. That’s illegal. And yet these are highly desirable places to live and command premium prices on the open market in large part because they are so rare. So much so, in fact, that voters introduced rent control and other measures to help keep at least some working class people in the neighborhood. “Social engineering.”

    “Social engineering.” Use the term if you wish. But apply it evenly across the physical and political landscape.

    John Sanphillippo lives in San Francisco and blogs about urbanism, adaptation, and resilience at granolashotgun.com. He’s a member of the Congress for New Urbanism, films videos for faircompanies.com, and is a regular contributor to Strongtowns.org. He earns his living by buying, renovating, and renting undervalued properties in places that have good long term prospects. He is a graduate of Rutgers University

  • More Privatization Pain For the Public in North Carolina

    Privatization done right can be a great boon. Done poorly, it can harm the public for decades. We see another example of the latter ongoing in North Carolina (h/t @mihirpshah). The Charlotte Observer reports:

    The N.C. Department of Transportation’s contract with a private developer to build toll lanes on Interstate 77 includes a controversial noncompete clause that could hinder plans to build new free lanes on the highway for 50 years.

    The clause has long been part of the proposed contract. But it was changed in late 2013 or early 2014 to also include two new free lanes around Lake Norman – an important $431 million project supported by local transportation planners.

    Some area officials were surprised that under the contract with I-77 Mobility Partners, the developer would likely collect damages if the state added two new general-purpose lanes from Exit 28 to Exit 36 at the lake.

    Many of these long term privatization contracts are loaded with “submarine” clauses like non-competes that lurk underwater ready to rise up torpedo the public without warning. Did the people of North Carolina know that they were signing away their right to make public policy for the next 50 years when they did this deal?

    What raises serious a red flag is that the clause that incorporated the I-77 added lanes project was added late in the game, which suggests that the current impact were not an accident:

    Bill Coxe, a transportation planner with Huntersville, said he doesn’t know who lobbied for the revision. The new language wasn’t part of the draft contract from 2013, but it was added before the final deal was signed in June. “We saw that late in the game,” he said. “We aren’t sure who modified that.”

    Mooresville’s representative on an advisory committee that helps make transportation recommendations said she didn’t know about the change to the contract with the developer. Neither did Andrew Grant, a Cornelius assistant town manager who helps shape regional transportation policy.

    So many of these deals have less to do with bringing in private capital to finance infrastructure improvements than they do contractually creating a decades long stream of monopoly rents for the contractor.

    Chicago got burned when an arbitrator ruled it owed $58 million to the group that leased the city’s lakefront parking garages. The city had promised it would not allow anyone else to build a garage open to the public to compete with the lessee. But it did anyway and they had to pay damages.

    Contra the claim in the article that these clauses are necessary to attract investment, simply look around and see that businesses take huge investment risks every single day in markets with no barriers to entry for competitors. You don’t see Walgreens going to city governments and telling them they won’t open a store unless the city promises not to approve a CVS within a two mile radius, for example. We often see retail competitors right across the street from each other

    But why invest in the actual marketplace when you can sign a sweetheart deal that grants you a five decade monopoly?

    In this case, it appears to be free lanes and toll lanes side by side on the same facility. So there’s some justification for some sort of agreement on the state’s plans for the free lanes. But given that the free lane expansion was already on the books and supported by transportation planners, to have the project de facto killed through a clause slipped into a private contract in a way that does not appear to have been vetted by the public is dubious. If the residents of the area had known the free lane project they were banking on would be basically taken off the table for 50 years, it might have created protests that could potentially derail the contract. So by simply adding a non-compete clause, the state and contractor could do the same thing without stirring up the public until it was too late. It’s all the more reason why there needs to be much, much more scrutiny on the terms of these deals.

    Aaron M. Renn is a senior fellow at theManhattan Instituteand a Contributing Editor atCity Journal. He writes at The Urbanophile, where this piece first appeared.

    Interstate 77 map by Nick Nolte (Own work) [Public domain], via Wikimedia Commons

  • Driving Farther to Qualify in Portland

    Portland has been among the world leaders in urban containment policy. And, as would be predicted by basic economics, Portland has also suffered from serious housing cost escalation, as its median multiple (median house price divided by median household income) has risen from a normal 3.0 in 1995 to 4.8 in 2014.

    One of the all too predictable effects of urban containment policy is at least some households will drive even farther to "qualify" for mortgages than before. Single-family detached houses have been the national preference in housing in the United States (and a number of other nations) for decades. Significant "leakage" can occur as people skip over the urban growth boundaries, inside of which housing has become unaffordable. For example, after the 2010 census, San Joaquin County, with its seat of Stockton, was added to the San Francisco Bay combined statistical area (CSA). Combined statistical areas are combinations of metropolitan areas have a somewhat weaker economic connection, as defined by commuting patterns than within metropolitan areas (Note 1).

    As in the San Francisco Bay Area, more Portlanders are now commuting from outside the metropolitan area in large enough numbers that four additional, metropolitan areas are now included in the Portland CSA.

    Driving to Qualify from Corvallis and Albany

    Perhaps most notable addition is Corvallis, seat of Benton County and home of Oregon State University. Corvallis is rather exurban to Portland, even though it is now officially in Portland’s commuting belt. At least 15 percent of resident workers in Benton County travel to one of the central counties of the Portland metropolitan area (Clackamas, Multnomah and Washington in Oregon and Clark in Washington) or vice versa. This is no 30 minute commute. Corvallis is 85 miles from downtown Portland. It is 65 miles from the nearest potential Portland MSA employment in southern Clackamas County. Further, the Corvallis metropolitan area is not adjacent to the Portland metropolitan area. To get to the Portland metropolitan area by the most direct route, a Benton County commuter passes through two other metropolitan areas Albany and Salem.

    This would be a very long commute, even by comparison to the nation’s largest metropolitan regions. Take New York, for example. The New York CSA extends from outside of New Haven, Connecticut, to beyond Allentown, Pennsylvania, to beyond Toms River, New Jersey and includes all of Long Island. Yet some of the farthest reaches of New York are no closer to Manhattan than Corvallis to Portland. These include Bethlehem, Pennsylvania, New Haven, Connecticut, and Port Jervis, New York. Philadelphia, beyond the New York CSA, is only slightly farther away (90 miles).

    Or, consider Los Angeles, which its undeserved reputation for sprawl. The Los Angeles CSA is the second largest in the nation. Yet, Banning, which sits on the mountain pass leading to Palm Springs is 85 miles from Los Angeles. San Clemente, the southernmost point in the CSA is only 60 miles from downtown. The expansive Portland commuter shed suggests that, in some ways, Portland, already far less dense, is also more sprawling.

    Expansions for Linn, Marion, Polk and Cowlitz Counties

    The Portland CSA added two more metropolitan areas in the Willamette Valley. Albany (Linn County), only about 15 miles closer than Corvallis is one. Salem, the state capital, was also added. Salem includes Marion and Polk counties and is 45 miles from Portland. To the north, Longview, Washington (Cowlitz County) was also added. By comparison with Corvallis, Longview seems close, at less than 50 miles from Portland.

    The Portland CSA now stretches 175 miles from the southern Linn County border to the northern Cowlitz County border. There it has collided with the southerly expanding Seattle CSA, which now includes Lewis County (Centralia-Chehalis), 85 miles from downtown Seattle.

    However, this does not imply 175 miles of continuous urbanization. Like all metropolitan areas, combined statistical areas, including Portland, have far more rural land than urban land.

    Dispersing in the Metropolitan Area

    Perhaps the greatest irony is that an “urban containment” policy designed to prevent sprawl could well be accelerating it. Higher prices, in part due to this policy, have forced more people to look ever further for housing that is affordable.

    Approximately 98 percent of Portland’s population growth between 2000 and 2011 occurred in the suburbs (Note). There was a small, but significant percentage growth around the central business district, but its addition of fewer than 7,000 residents paled by comparison to the more than 325,000 added to the suburbs and exurbs. The balance of the urban core, (the inner ring) grew by little more than 100, which is glacial for an urban sector with more than 200,000 residents (less than 0.1 percent).

    None of this should be surprising. The attractive inner city developments, especially the Pearl District, do not provide for the economic needs or wants of most people, as the population trend data indicates. Few households are drawn to buy less than one-half the space they want at nearly three times the price per square foot they would pay in outer suburbs like Forest Grove, Wilsonville or Hazel Dell.

    Job Dispersion

    Fortunately for both the suburbanites and an exurbanites, Portland’s job market also dispersed between 2000 and 2011, meaning that a smaller percentage of commuting was to downtown or the balance of the urban core (Figure 3). That makes it easier to drive to qualify. It turns out that while planners plan, people usually make choices that suit their basic needs rather than those of a particular urban ideology.

    Note 1: Metropolitan areas are defined by commuting patterns. Oversimplifying, metropolitan areas are organized around central counties that contain all or part of large urban areas ("built-up" urban areas). All such counties are included in the metropolitan area as well as any counties that have a strong commuting interchange with the central counties. For example, in the case of Portland, the central counties are Multnomah, Washington and Clackamas in Oregon and Clark in Washington. Columbia and Yamhill in Oregon are outlying counties as well as Skamania in Washington. Combined statistical areas are created from combinations of metropolitan areas that meet a weaker commuting interchange threshold. A complete description of the commuting thresholds that apply to metropolitan areas and combined statistical areas is found here.

    Note 2: Based on the City Sector Model (Figure 4), which classifies small areas (ZIP codes, more formally, ZIP Code Tabulation Areas, or ZCTAs) in metropolitan area in the nation based upon their behavioral functions as urban cores, suburbs or exurbs. The criteria used are generally employment and population densities and the extent of transit, versus car use. The purpose of the urban core sectors is to replicate, to the best extent possible, the urban form as it existed before World War II, when urban densities were much higher and when a far larger percentage of urban travel was on transit. The suburban and exurban sectors replicate automobile oriented suburbanization that began in the 1920s and escalated strongly following World War II. The data from 2000 is from the 2000 census. The 2011 data is from the 2009-2013 American Community Survey (mid-year 2011).

    Photo: Benton County Courthouse, Corvallis (in the Portland commuter shed) by Gregkeene (Own work) [CC BY 3.0 us or CC BY-SA 3.0], via Wikimedia Commons

    Wendell Cox is principal of Demographia, an international public policy and demographics firm. He is co-author of the "Demographia International Housing Affordability Survey" and author of "Demographia World Urban Areas" and "War on the Dream: How Anti-Sprawl Policy Threatens the Quality of Life." He was appointed to three terms on the Los Angeles County Transportation Commission, where he served with the leading city and county leadership as the only non-elected member. He served as a visiting professor at the Conservatoire National des Arts et Metiers, a national university in Paris. Wendell Cox is Chair, Housing Affordability and Municipal Policy for the Frontier Centre for Public Policy (Canada), is a Senior Fellow of the Center for Opportunity Urbanism and is a member of the Board of Advisors of the Center for Demographics and Policy at Chapman University.

  • A Fix for California Water Policy

    Critics of California’s current water policy advocate more infrastructure spending on things like dams, canals, and desalination plants.  Many would also curtail water releases for the benefit of fish and other wildlife.

    Certainly, infrastructure spending would be better than wasting money on the governor’s high-speed-train fantasy.  However, California cannot spend enough money on water infrastructure to prevent water shortages.  And, solving California’s water shortage does not require an end to “dumping water” to save fish.

    California has a history of droughts lasting as long as 200 years.  You can dam every canyon in California and line the coast with desalination plants, and you won’t solve the water shortage in a 200-year drought, or even a ten-year drought.  Under the current allocation and pricing system, California will simply consume every new drop of water produced. We will have a water shortage all the same.

    Consider Westborough and Hillsborough, in the South San Francisco area. Hillsborough consumes more than four times the water per person as Westborough, just six miles away. Increasing the supply of water in California will simply allow Westborough to be more like its neighbor. The problem is how to constrain demand in places like Hillsborough.

    California policy makers prefer to use authoritarian conservation policies and police-state enforcement tactics to allocate water and control demand.  These polices do not end water shortages.  They perpetuate the shortage, and they add to the burdens imposed by energy and growth policies which are already driving businesses and people out of the state.

    Eliminating California’s water shortages in the presence of recurring droughts will require that the state resort to something truly radical — a free market in water.  This will require that ownership of water be clearly defined, that resale be allowed, and that we adopt a market-clearing price.

    We know what this looks like. Water markets equipped Australia to endure the 1995-2009 Millennium Drought. This was the worst Australian drought since European settlement.  Total water stored declined to just 27 percent of capacity. Yet water trading allowed Australian cities to avoid the most severe water restrictions. It protected agricultural businesses, and it ensured that the country’s endangered habitats and species received adequate water.

    Remarkably, in an end-of-drought survey, over 90 percent of Australian farmers reported that water markets were important to their businesses’ survival. There are many lessons for California here.  A key one is that the tension between water users is completely the creation of policy. There is no need for the tensions between the agricultural industry and California’s cities, between growers and endangered fish, between Hillsborough and Westborough, between neighbors. Water markets can balance competing uses in a way that benefits all.

    To work, markets need something to trade. The basis for trade in a functioning water market is exclusive access to a share of water from a specific body. Australian water laws provide this. California’s water laws do not.

    In California, water rights are often tied to land ownership. The right to surface- or ground-water is conferred by owning the land and often can only be transferred by selling the land. If a land owner wants to use the water, he needs only to put a straw in the ground or the stream. The landowner is entitled to “reasonable and beneficial” use of the water, but that right only extends to the borders of the property.  He can use all the water he can pump, but he has to use it on his land. There are legal barriers preventing the sale of water.

    This creates a “use it or lose it” system of water allocation, with lots of absurdities.  We have growers using sprinklers to irrigate low-value crops like alfalfa in our deserts, while neighbors shame each other for watering their lawns and cities establish water police to enforce arbitrary rationing goals.  We have huge aquifer overdrafts, with massive damage to the environment and to highways and canals.

    California water users are drawing from a common pool. Since they cannot do anything with their water except use it or lose it, an individual’s incentive is to use as much water as possible, before it’s gone and his neighbor gets it. During a drought, it’s literally a race to the bottom of the well. A functioning water market would provide each user with a specific allocation. Then, as the supply of water diminishes during a drought, remaining allocations would become more valuable, increasing the economic return to conservation.

    Prices in a functioning water market would behave just like those in any number of other healthy markets. Consider gasoline or coffee beans. Over the past year, the price of gasoline in California declined by 30 percent, reflecting new supplies and slower demand growth in some markets. In 2014, coffee bean prices increased by 72 percent, in fewer than four months, reflecting a severe drought in Brazil. Australia’s water behaves the same. During the Millennium Drought, water’s price increased by 20 times, from a low of $25 AUD per acre foot to $500 AUD. Naturally, when the rains returned, the price fell.

    California water prices are much more stable over time, but they vary a lot by geography. California municipalities see prices that vary by about 12 times. For example, Ventura pays pumping charges of just $120 per acre foot, while San Diego is purchasing desalinated water for $2,200 per acre foot. Price discrepancies like this defy economic laws. There is certainly nothing resembling a scarcity price for water.

    When you pay your personal water bill, the price that you pay does not signal that we are facing a critical water shortage. Water prices have increased incrementally, but not nearly enough to convey our dire situation. The gas lines of the 70s reminds us of what a world without scarcity pricing looks like.  Remember how quickly shortages disappeared when price controls were abandoned?

    California does not need another speech by the Governor.  It doesn’t need another legislative proposition promising additional water supply 20 years or more later (think Proposition 1). It doesn’t need more dams or canals.  Remarkably, it doesn’t even need more rain, although more rain would be nice.

    What California needs is a process to define who owns the water and how much is available.  A comprehensive rewrite of California’s water laws is the best way to achieve this, but this is probably politically impossible, especially since that rewrite would require Sacramento to cede control of water allocation to the markets.  Alternatively, California has a court-mediated alternative in place.  The process, adjudication, is far from perfect, but it can work.

    Twenty-three of California’s more than 400 groundwater basins have already undergone adjudication. While not models of efficient water use, adjudicated basins are a big improvement over non-adjudicated basins. Unfortunately, the current legal infrastructure requires a minimum of 10 years for the adjudication process to work.  This is obviously too slow to help with our immediate problem. Sacramento legislators have promised to implement policies to expedite adjudication, but we are still waiting for them to deliver. This should be California’s single highest legislative priority.

    Absent meaningful reform, litigation will take on an increasingly important role. Significant Proposition 218 cases have already been decided in San Juan Capistrano and Ventura. The Ventura case is especially noteworthy. The City sued the local water purveyor over pumping charges which are greater than those of local farmers. Suing to lower the City’s already low water prices during a severe shortage shows impressive audacity. Fortunately, an appeals court ruled that the current rate system is legal. Ventura’s pumping charges are not going down anytime soon.

    The San Juan Capistrano decision seems less helpful. There, an appeals court ruled that the City’s tiered rate system, which increases the cost of water as the number of units increases, is illegal under Proposition 218. We ask the question again, what will constrain the demand for water in places like Hillsborough? Or San Juan Capistrano? We are not qualified to object to the legal decision on its merits. But the cost of water for all users in San Juan Capistrano very likely ought to be higher than it is today. A free market in water would tell us just how much higher.

    Finally, allowing a market price for water would contribute to increased supply during droughts.  Businesses and business people are amazingly efficient at taking advantage of profit opportunities.  Who knows where water would come from if the price were higher? Water districts would have economic incentives to explore supply alternatives such as rain catchment, waste water reuse and desalination. Residents would have incentives to explore household alternatives such as grey water irrigation systems. Maybe Mexico would put in desalination plants and sell it to us? Maybe some business would use tankers to import water?  We don’t know how markets would provide the water, but they would.  We see this with oil, coffee, and every other commodity.  It’s time for California to move to a market price for water.  It’s time to end the current nonsense.

    Matthew Fienup teaches graduate econometrics and works for the Center for Economic Research and Forecasting at California Lutheran University, where he specializes in applied econometric analysis and the economics of land use. He is currently working on his PhD at the Bren School of Environmental Science and Management at the University of California Santa Barbara. He holds a Masters Degree in Economics from UCSB. Bill Watkins is a professor at California Lutheran University and runs the Center for Economic Research and Forecasting, which can be found atclucerf.org.

    Photo by TCAtexas (Own work) [CC BY-SA 3.0], via Wikimedia Commons

  • America’s Cities Mirror Baltimore’s Woes

    The rioting that swept Baltimore the past few days, sadly, was no exception, but part of a bigger trend in some of our core cities towards social and economic collapse. Rather than enjoying the much ballyhooed urban “renaissance,” many of these cities are actually in terrible shape, with miserable schools, struggling economies and a large segmented of alienated, mostly minority youths.

    We are witnessing an unwelcome reprise of the bad old days of the late ’60s, when much of American core cities went up in smoke. Already this year there have been serious disturbances in St. Louis as well as neighboring Ferguson. There’s also been a cascading of urban violence in cities such as Chicago, where the murder rate in 2013 exceeded that of the Capone era. Overall, the geography of fear remains very much what it was a half century ago. The most dangerous places in in the U.S. in terms of violent crime tend to be heavily black cities, led by Detroit, Oakland, Memphis, St. Louis, and Cleveland. Baltimore ranks sixth.

    Of course not everything is as it was. Some cities, notably New York and Los Angeles, are much safer today, and there remains a strong pull for younger people, particularly the well-educated, to move to core cities, at least in their 20s. Black urban professionals enjoy opportunities that were rare a generation ago to reach the highest levels in our most elite cities.

    But, as Baltimore makes clear, we are still very far from what Aaron Ehrenhalt has labeled the “great inversion,” in which our cities change into affluent redoubts while the suburbs devolve into future slums. In reality, this is very far from the truth: cities are, if anything, becoming more bifurcated than ever, with a large, and seemingly unmovable, population that has benefited little from the gentrification of some urban neighborhoods, including some in Baltimore itself.

    The Persistence of Concentrated Poverty

    Perhaps the biggest sign of how limited the urban renaissance has been is to look at the growth of precisely the kind of highly concentrated poor areas like those that blew up in Baltimore. Yet although the suburbs’ share of poverty may have increased, the average poverty rate in the historical core municipalities in the 52 largest U.S. metro areas remains at 24.1 percent, more than double the 11.7 percent rate in suburban areas—despite a considerable urban turnaround in this period.

    BALTIMORE, MD - AUGUST 20: Vacant houses on August 20, 2010 in Baltimore, Maryland . There are an estimated 30,000 vacant homes in Baltimore. More than one third of these buildings are now owned by the city.  (Photo by David S. Holloway/Getty Images)David S. Holloway/Getty

    In fact, neighborhoods suffering entrenched urban poverty (PDF) actually grew in the first decade of the new millennium, increasing in numbers from 1,100 to 3,100 and in population from two to four million. In other words, poverty spread but also became far more intense in cities. “This growing concentration of poverty,” note urban researchers Joe Cortright and Dillon Mahmoudi, “is the biggest problem confronting American cities.”

    Certainly Sandtown-Winchester—where Freddie Gray, whose death sparked the riots, grew up—fits this mode. As the liberal Think Progress website explains, more than half of that neighborhood’s people between the ages of 16 and 64 are out of work and the unemployment rate is double that for the rest of the city. Median income is below the poverty line for a family of four, and nearly a third of families live in poverty. About a quarter to a third of the buildings are vacant, compared to 5 percent in the city as a whole.

    Yet the people in these neighborhoods do not represent the majority of black America. Besides the gap between blacks and whites, there is also a growing one among African-Americans themselves. This is painfully obvious in the Baltimore region which, extending to the Washington, D.C., suburbs, has some of the highest black wages and homeownership rates of any of the county, and ranks among the best places for African-Americans in a new study I co-authored for the Center for Opportunity Urbanism.

    In fact, five of the ten wealthiest black communities in America are in Maryland. Needless to say, residents in those towns are not rioting. There is an increasingly enormous gap between entrenched poor communities, such as those in Baltimore, and a rapidly expanding black suburban population. Barely half of the 775,000 African-Americans in the Baltimore metropolitan region live in the city, and those outside do far better than inside the city limits. In the last decade, suburban Baltimore County added160,000 blacks, far more than moved into the city (PDF). The black suburbanites not only make more money than their urban counterparts but their life expectancy (PDF) is at least eight years longer.

    These trends can be seen nationwide. In the last two decades of the 20th century, more blacks moved into the suburbs than in the previous 70 years, a trend that continues unabated. The 2010 Census indicated that 56 percent of African Americans in major metropolitan areas live in the suburbs. This movement was particularly marked among families with children; the number of black children living in cities like New York, Oakland, Atlanta, Los Angeles all dropped precipitously, as families sought out safer streets, better schools, and more affordable space.

    The Changing Nature of Urban Economies

    African-Americans came to Baltimore and other northern cities in large part to work in the steel, port, and other blue collar, industrial businesses that flourished in mid-century America. Yet most of those jobs are now gone, leaving behind those who must scramble to find work in the growth industries of today—education, technology, medical services. This is the case in almost all heavily black cities, not only in the Northeast, but the Midwest and even parts of coastal California. But today’s star urban industries, notably technology and high-end business services, employ few working class blacks. African-Americans, for example, occupy only the tiniest sliver of jobs—roughly 2 percent—in Silicon Valley. Nor have African Americans done well in the tech boom, driven by software-related firms more likely to staff themselves with Indian technocoolies than boys up from the ’hood. Between 2009 and 2011, earnings dropped 18 percent for blacks and 5 percent for Latinos, according to a 2013 Joint Venture Silicon Valley report.

    Overall the places where these industries have grown often produce not more opportunities for poor people or minorities but rather a subtle form of “ethnic cleansing.” A recent report from the Urban League, for example, pointed out that the very cities most praised as exemplars of urban revival—San Francisco, Chicago and Minneapolis—also suffer the largest gaps between black and white incomes. Notwithstanding the rhetoric, much of the “hip cool” world increasingly consists of monotonic “white cities” with relatively low, and falling, minority populations, such as San FranciscoPortland, and Seattle. These places are achingly political correct in theory, but are actually becoming whiter and less ethnically diverse as the rest of the country diversifies. The situation has changed so much that former MayorGavin Newsom even initiated a task force to address black out-migration.

    Inverting the Inversion

    Baltimore proves that the “great inversion,” insofar as it exists at all, positively affects a relatively small part of the urban population, particularly in historically black cities. Cities may well have become a popular abode for the young, well-educated, and the rich (usually white), but they also contain another, usually much larger population of those, mostly minorities, who have been left behind in the urban evolution. Midwestern urban analyst Pete Saunders describes Chicago in this manner: “one third San Francisco, two thirds Detroit.”

    This is precisely what we see in Baltimore and many traditionally black cities. Everything that does not work in cities today—education, for example, and sometimes law enforcement—most directly affects minorities and the poor. Crime may be down overall in many cities, but not necessarily in predominately minority neighborhoods. As blogger Daniel Hertz has demonstrated, violent crime has actually increased since the early ’90s in several large, predominately African-American Chicago neighborhoods.

    Clearly what we are seeing then is not an urban kumbaya you see in TV ads for fast food and web services, but a hardening of class and racial divisions. Suburban poverty and crime may have increased in recent years, but they are not nearly as entrenched on the periphery as they are in the city. Places like inner Baltimore function essentially as a kind of dead-end, a cul-de-sac for dreams of a better future.

    The Changing Geography of African-American Opportunity

    We are witnessing a very unwelcome resurgence of racial tensions over the past six years, with concern about racism at the highest level since the Rodney King riots in 1992. Today, particularly in the divisive aftermath of Ferguson and other police-related controversies, two in five Americans feel race relations have gotten worse since President Obama took office, while only 15 percent thought they had gotten better.

    How do we reverse this ugly trend? Sadly it takes more than good intentions and handouts. To be sure, the initial Great Society programs helped reduce chronic black poverty. But the poverty rate was already dropping: in the prosperous early ’60s, black poverty plummeted from 56 percent to 34 percent; in contrast, in the years after President Lyndon Johnson launched the war on poverty, it dropped only slightly, to 32 percent. But by the ’70s this progress—despite the implementation of such programs as affirmative action—slowed to a crawl, in large part due to cascading social problems, particularly in industrial cities like Baltimore.

    Many progressives have blamed conservatives starting with President Reagan for the conditions that still prevail for many African Americans. Yet it turns out that expansive era was pretty good for blacks, if not for their leaders. Even as poverty spending growth slowed, the poverty rate dropped in the Reagan years to around 30 percent for African-Americans. Similarly the economic boom of the Clinton era saw even greater progress, with poverty dropping to 25 percent. It began to rise again, albeit slowly, during the tepid recovery of the Bush era, but then began to rise more steeply during the Great Recession, and through the slow, and also tepid, recovery of the Obama years.

    Clearly an improved economy is more important than ramping up social spending. Indeed, according to USC’s Luke Phillips, states. like New York, Massachusetts , California and Illinois spend almost twice as much on welfare payments than do states like North Carolina, Texas, or Florida, both in terms of GDP and state spending. Yet the best results for African Americans in our Center for Opportunity Urbanism study were found overwhelmingly in the former Confederacy, states generally not well known for their generosity to the poor or interest in racial redress.

    This is leading to a stunning reversal in black migration patterns. Between 1910 and 1970 six million African Americans migrated from the South to the North in what became known as the Great Migration. But since World War II the migration has changed course: ambitious blacks now head toward the suburbs, or the South. Between 2000 and 2013, the African American populations of Atlanta, Charlotte, Orlando, Houston, Dallas-Fort Worth, Raleigh, Tampa-St. Petersburg, and San Antonio all experienced growth of close to 40 percent or higher, well above the average of 27 percent for the 52 metropolitan areas.

    “Blacks who have relocated tend to be either retirees or well-educated, well-off middle-agers with children,” John Giggie, associate professor of history and director of graduate studies at the University of Alabama in Tuscaloosa, toldBET.com. They move to the South not because they like the politics (most probably don’t) but because they seek economic progress. Part of the reason may be that sunbelt cities have more broad based opportunites for middle and working class residents than have the increasingly post-industrial economies of California and the Northeast corridor.

    Our leadership class, black and white, misses all this. Sending Al Sharpton, President Obama’s highly publicized advisor, to Baltimore hardly bodes well for improving things on the ground. A little bit of catharsis, perhaps, but at some point you need to deal with reality.

    It would be far better if some CEOs or investors—American, Asian, or European—came to the old Chesapeake city bearing plans for expanding jobs and opportunities. That, at least, would begin to address the economic and social isolation that, inevitably, finds its expression in fires on the street. Good jobs and the prospect of a better future—not good intentions—is what ultimately matters.

    This piece first appeared at The Daily Beast.

    Joel Kotkin is executive editor of NewGeography.com and Roger Hobbs Distinguished Fellow in Urban Studies at Chapman University, and a member of the editorial board of the Orange County Register. He is also executive director of the Houston-based Center for Opportunity Urbanism. His newest book, The New Class Conflict is now available at Amazon and Telos Press. He is also author of The City: A Global History and The Next Hundred Million: America in 2050.  He lives in Los Angeles, CA.

    Photo by Voice of America, Victoria Macchi

  • Building a New California

    The Golden State has historically led the United States and the world in technology, quality of life, social innovation, entertainment, and public policy. But in recent decades its lead has ebbed. The reasons for this are various. But there is one area of decay whose story is a parable for California’s other plights—that area is infrastructure.

    California’s infrastructure, like California, has had a golden past full of larger-than-life personalities and heroic deeds. But in recent decades the state has lost its innovative edge, resting on the laurels of its past successes without adequately preparing for any such bold endeavors in the future. California’s infrastructure imperative, then, is this: to accomplish bold, ambitious projects that promise a transformed and vibrant future for California, yet are still practical and sensible, and have proven viability.

    Should California manage to get its act together and embark upon a course of infrastructure renewal, it will be taking one of several steps necessary to transform itself into an opportunity society again. Systemic reforms beyond infrastructure will be necessary to renew Californian society and lower the cost of living, raise the quality of life, and create opportunities for entrepreneurs and middle-class families. But infrastructure is a fantastic place to start.

    Aside from basic infrastructure renewal like fixing up roads and bridges, expanding our water storage capacity, and reforming public policy and internet regulation to provide a world-class infostructure, there are three main physical infrastructure projects California should be focusing on to bring the state forward into the 21st Century. These are driverless car networks, a new nuclear energy grid, and an archipelago of desalination plants.

    The current strategy for the future of California’s transportation system is wildly unrealistic. Passenger rail is simply too ineffective to justify building an expensive new High Speed Rail system that wouldn’t even be able to pay for itself. Commuter rail usage rates have been on the decline. A better way forward would be to embrace the power of computerization in the transport sector, and put our population on a path towards using self-driving cars.

    The benefits of a driverless car network are numerous. They include greater safety, optimized traffic flow, reduced congestion, higher productivity, and cheaper, more effective travel for those unable to afford a car. The possibilities are endless. Already a test range at the University of Michigan is exploring what a driverless car system would look like. One could expect such a system to seriously reduce traffic congestion, improve transport speeds, conserve energy, nearly eliminate accidents, increase worker productivity, and generally revolutionize driving.

    So how could California go about transitioning to a driverless car system? In the short run, there wouldn’t be much in the way of new construction to worry about. It’s mostly a question of technological investment and regulatory reform.

    First, the state of California should partner with major universities and tech firms currently working on driverless car systems, and fund research and innovation projects geared towards enhancing the vehicles.

    Once driverless cars are tested, California should work to lower the barriers to their deployment. This might include reforming insurance and licensing laws, to make it easier for people to purchase one. It would also help to offer incentives for middle-class individuals to purchase these new vehicles, too, such as tax deductions.

    As with all public goods and services, government policy towards transportation ought to be designed with providing the widest array of convenient options for consumers, rather than forcing people into a single system or expecting them to use costly, uneconomical, heavily subsidized services. The call for a driverless car system is not to rid the roads of traditional vehicles. Nor is this a call to abandon rail or buses or cease investing in bike paths and walkways. This plan, rather, would seek to make one particularly middle-class-convenient option more available.

    The next area California should focus on is its energy generation system, through a new nuclear generator fleet. Currently California generates energy with a combination of coal, oil, natural gas, and renewable power. Governor Brown has launched ambitious initiatives to have as much as 50% of the state’s electricity generated by renewables within a few decades (which doesn’t do anything to make energy cheaper for working and middle-class citizens and families, much less businesses.) Meanwhile the state’s use of fossil fuels for energy generation for backup continues to grow as unstable renewable energy sources go online.

    We need an ambitious energy infrastructure plan if we are to both provide cheap, readily-available energy to the masses of California’s citizens (and thus provide them with a lower cost of living and higher quality of life) and to continue the state’s commitment to combatting climate change. Incidentally, there is a way to achieve both of these goals, while growing the state’s economy at the same time. California should open its fossil fuel fields to exploitation, levy a carbon tax on the profits, and use that revenue from the carbon tax to fund an ambitious nuclear program that could generate a majority of the state’s electricity within a few decades.

    California’s antipathy toward fossil fuels has led it to impose onerous regulations that hurt growth and provide little environmental reward; the deposits of oil and gas off the coast and in the interior have been made even more accessible by the fracking revolution, and if it wanted to, California could become an energy giant. So California could open its fields for drilling, fighting off regulations and lawsuits by various anti-oil interest groups, and begin reaping huge revenues through the imposition of a light carbon tax.

    This light carbon tax would go towards funding research in advanced nuclear energy, and towards a fund for establishing a fleet of a dozen or so advanced nuclear plants across the state. This would signify California’s continued commitment to reducing carbon emissions and adopting advanced energy.

    These new nuclear reactors are not the hulking behemoths of Three Mile Island. Some new reactors have been designed to be as small as a car and power a small city. They are extremely safe. And, far more importantly, nuclear energy is the gift that keeps on giving. In civilizational terms, nuclear energy can power our society forever. And it provides far more bang for the buck than solar or wind, the current green fetish power sources.

    Finally, California seriously needs to confront the water scarcity challenge that has perennially afflicted it throughout its history, and seek a permanent solution for providing cheap and plentiful water to the residents of this parched coastal strip. Desalination is the best way to secure that.

    We are currently in the midst of what appears to be the worst drought California has faced in its entire history as a state, and this does not bode well for the future growth of California. Adequate water is one of those resources that every civilization has depended on. Although California is not literally “down to one year of water” as a recent LA Times article misleadingly claims, we are in a shortage that is economically catastrophic, environmentally devastating, and entirely unnecessary- for it is man-made. Better water policy in past years, allowing Californians to use more of their river water, could have staved it off, as could better storage infrastructure construction. But these projects and policies were never put in place to the degree necessary to stop this drought from happening.

    Rationing and conservation may indeed be the short-term solution, but we need to look to a longer-term solution- and buying more water from other states doesn’t solve the problem.

    Many arid coastal countries – including Australia, Israel, and some of the Persian Gulf states – use desalination plants to water their burgeoning populations, and it is something of a miracle that Southern California has gotten by without such systems. We have a long coastline on which we could build numerous desalination plants, powered by the aforementioned fleet of nuclear reactors. This system could more than satisfy the needs of California residents, farmers, and industries, while simultaneously reducing the pressure on our streams, rivers, and reservoirs.  It would be incredibly capital-intensive and costly, and would perhaps lead to some unforeseen environmental consequences. But it is a better water policy than what we are doing now.

    This infrastructure program would likely require budget, tax and regulatory reform, as well as the broad support of the majority of Californians. It would represent a reasonable response to the now excessive power of the environmental lobby.

    But more than fiscal reform and public support, it would require a newfound political moxie in both the private sector and the public sector. We need a new generation of visionary William Mullhollands, Henry Huntingtons,  and Pat Browns to pursue these and other reforms to turn our Golden State golden again.

    Can it be done? With some political maneuvering and engineering ingenuity, sure. Will it be done? That’s a choice that our next generation of political leaders will have to make for themselves.

    Luke Phillips is a student studying International Relations at the University of Southern California. He is an editorial intern for the magazine The American Interest and a research associate at the Center for Opportunity Urbanism.

  • When it Comes to Technology Privacy, the Eyes Have It

    Back when integrated circuits were safely ensconced in missiles, spacecraft and machine tools, information technology could take us to the moon or build better cars, but – as long as they didn’t blow us up – they didn’t seem destined to strip away the last of our humanity. But as information technology has emerged as a factor in everyday life, the threat to our autonomy and privacy as individuals has mounted.

    This comes at a time when many, particularly the young, worship technology as a new kind of secular god. In a poll of British people, about as many said they trust Google to have their interests at heart as they do God. Apple, in particular, notes Brett Robinson, writer of “Appletopia,” has adherents who back their products with “fanatical fervor.”

    Yet while information technology may bring many blessings, it also threatens our basic freedoms. Such concerns have existed for years, particularly in science-fiction novels like Yevgeny Zamyatin’s 1924 classic, “We,” which described a society where technology served to curb personal privacy and autonomy. Four decades ago, computer industry pioneer Willis Ware warned that the new communication technology, rather than simply making information more universally available, could also increase the “intensive and personal surveillance” of individuals.

    Read the entire piece at The Orange County Register.

    Joel Kotkin is executive editor of NewGeography.com and Roger Hobbs Distinguished Fellow in Urban Studies at Chapman University, and a member of the editorial board of the Orange County Register. He is also executive director of the Houston-based Center for Opportunity Urbanism. His newest book, The New Class Conflict is now available at Amazon and Telos Press. He is also author of The City: A Global History and The Next Hundred Million: America in 2050.  He lives in Los Angeles, CA.

    Photo by Android Open Source project [Apache License 2.0, GPL or CC BY 2.5], via Wikimedia Commons

  • Growth and the Suburban Chassis

    I tend to explore what happens to suburbs as they age and begin to decline. But this time I’m going to explore what happens to suburbs that thrive and continue to grow and work their way up the value chain. It isn’t exactly what many people expect. “Be careful what you wish for.”

    A friend moved from San Francisco to San Jose this winter. Now that I’ve been visiting her on a regular basis I have an excuse to poke around. It’s actually pretty fascinating.

     Screen Shot 2015-04-08 at 1.35.48 AM Screen Shot 2015-04-08 at 1.36.12 AM

    A friend moved from San Francisco to San Jose this winter. Now that I’ve been visiting her on a regular basis I have an excuse to poke around. It’s actually pretty fascinating. Her tract home was built in 1947 on land that had previously been orchards. By the 1960’s the area had become home to military and aerospace firms that then spun off civilian electronics companies in little low rise office parks. By the 1980’s the area had officially emerged as Silicon Valley. Oracle, Apple, Facebook, Hewlett-Packard, Microsoft, Google, eBay, Juniper Network, PayPal… these companies stretch out for miles in every direction. It’s an economic development dream for local governments. While there are a dozen separate municipalities (Redwood City, Cupertino, Mountain View, Palo Alto, Santa Clara, Fremont, Los Gatos, and so on) the entire southern end of San Francisco Bay is essentially one giant suburban corporate office park blur.

    Screen Shot 2015-04-11 at 3.49.19 PM Google Screen Shot 2015-04-08 at 1.09.30 AM Screen Shot 2015-04-08 at 1.06.01 AM Screen Shot 2015-04-08 at 1.10.00 AM

    Here are three examples of the kinds of commercial buildings that served earlier waves of businesses in Silicon Valley. They were probably built between the 1970’s and 1990’s. This office park happens to be in the town of Sunnyvale, but nearly identical arrangements can be found all over the Bay Area. In fact, I bet there are buildings just like these in whatever town you live in too whether it’s in Florida, Michigan, or Utah.

    Screen Shot 2015-04-11 at 4.25.53 PM GoogleScreen Shot 2015-04-08 at 1.52.00 AM   Screen Shot 2015-04-08 at 1.09.00 AM

    Here’s what’s happening to these office parks as the economy heats up. The land has become very valuable and it makes good economic sense to build new eight or ten story office blocks on vacant land and surface parking lots. It’s good for the tech companies who want to expand their existing operations. It’s good for the land owners who can cash in on the sale. It’s good for the city since it brings increased tax revenue to the municipal coffers. And it’s good for people looking for high paying jobs, both in the initial construction phase and later office workers and support staff. There are, of course, also problems associated with this kind of redevelopment, which I’ll get to in a minute.

    Screen Shot 2015-04-11 at 6.33.25 PM Google Screen Shot 2015-04-11 at 6.32.52 PM  Screen Shot 2015-04-08 at 1.52.32 AM

    Here’s another construction site directly across the street. The old one story buildings were scraped and are being replaced by parking decks and office blocks. These are all part of the same company that is experiencing rapid expansion and doubling their corporate campus that already has over a million square feet of space. These few buildings alone will ultimately house another eight hundred well paid workers. Part of the long term plan for this site is to include a two hundred room hotel for business travelers associated with the company. Perhaps that new hotel will replace the existing one story motel.

    Screen Shot 2015-04-11 at 5.26.01 PM Google   Screen Shot 2015-04-11 at 8.04.09 PM Screen Shot 2015-04-11 at 8.04.26 PM Screen Shot 2015-04-11 at 7.27.03 PM Screen Shot 2015-04-11 at 7.26.05 PM

    Here’s the bigger picture. Zooming out on Google Earth you can see how multiple older office parks are being absorbed and folded in to much larger more unified corporate complexes. The scale of the construction is too large to capture even with a macro lens on the ground. These tech workers were walking between buildings at lunchtime and it was quite a trek. This kind of land use intensification is actually very similar to how old orchards were converted to residential subdivisions. Land values increased and property was pressed into service for tract homes which were much more lucrative than apricots or prunes. The same process is now unfolding at the next higher economic level with office parks. If I hadn’t taken these photos myself I would swear some of them were computer generated. The buildings have such a generic AutoCAD look about them. And there are dozens of them at this one site alone.

    Screen Shot 2015-04-11 at 7.44.08 PM Google   Screen Shot 2015-04-11 at 8.14.31 PM  Screen Shot 2015-04-08 at 3.40.10 AM Screen Shot 2015-04-13 at 5.58.20 PM 

    Here’s another corporate campus. This one is in Redwood City. Everywhere you look the old one and two story buildings are being razed and replaced with significantly larger buildings. The schmaltzy motels, strip malls, and office parks of previous decades have been upscaled both physically and economically. This was once open water and marshland that was filled, dredged and contoured in the 1960’s, but has since been redeveloped to a higher value use.

    Screen Shot 2015-04-13 at 5.42.01 PM Google Screen Shot 2015-04-13 at 5.43.28 PM Google

    Companies are fond of the “theme park” suburban campus where the environment is akin to an all inclusive resort destination for workers. These are islands – sometime literal islands – in the suburban landscape. From the air these corporate campuses look a lot like Epcot Center at Disney World or a regional shopping mall off the side of a highway.

    Screen Shot 2015-04-14 at 9.24.20 AM Google Screen Shot 2015-04-14 at 9.12.06 AM Google

    Screen Shot 2015-04-14 at 9.22.14 AM Google  Screen Shot 2015-04-14 at 9.13.02 AM Google

    This inward looking mega block form of development is common in suburbia. The images above show a college, an amusement park, and a corporate office park. When you’re inside one of these bubbles it’s actually very pleasant. But getting to and from these locations is pretty much impossible without a car. Even if you live directly across the street walking wouldn’t work all that well. Add in the fact that many of the nearby residential subdivisions are gated communities and that each of these bubbles are separated by highways, walls, and drainage canals… a car becomes essential. That loads the road network with an insane amount of traffic. If the one story buildings incrementally ramp up to eight story buildings you have a very big transportation problem on your hands.

    Screen Shot 2015-04-11 at 9.05.27 PM Google Screen Shot 2015-04-08 at 2.00.16 AM Screen Shot 2015-04-11 at 9.15.54 PM Screen Shot 2015-04-08 at 1.56.54 AM

    Here’s an intersection halfway between my friend’s house and the corporate campus where she works. It’s a typical suburban commercial corridor lined with standard one story buildings of the office park and light industrial variety that were built anytime from the 1960’s to the 1990’s.

    Screen Shot 2015-04-11 at 9.16.34 PM Screen Shot 2015-04-08 at 1.59.10 AM Screen Shot 2015-04-11 at 9.17.10 PM Screen Shot 2015-04-13 at 8.24.15 PM Screen Shot 2015-04-08 at 1.58.53 AM Screen Shot 2015-04-08 at 2.00.03 AM

    Here’s what’s happening all around Silicon Valley. The small old buildings are being replaced with much larger ones. These aren’t exactly skyscrapers, but they’re significantly more substantial than what was there before.

    Screen Shot 2015-04-13 at 7.26.36 PM Google Screen Shot 2015-04-12 at 11.56.58 AM Screen Shot 2015-04-12 at 11.31.13 AM

    The same thing is happening with residential property. The old suburban roads lined with gas stations and Kwickie Marts are giving way to multi-story apartment buildings with underground parking decks. These two photos show two sides of the same street. This spot is immediately adjacent to a 1950’s residential subdivision of single family homes. The apartment building fills a need for workforce housing at a high, but tolerable price. One bedroom apartments in this neighborhood rent for about $2,000 a month. Two bedroom units rent for closer to $3,000. If you want to buy an actual house the bargain basement fixer uppers start at $600,000. There are a lot of people in the area who can afford to carry a mortgage of that size, but the problem is often the down payment. Twenty per cent of $600,000 is $120,000. That’s a hurdle many people struggle with. I’ve seen some very nice double wide trailers for sale in the $320,000 range, but that doesn’t include the land under the trailer which you would still need to rent. So rental apartments and condo complexes are in fact necessary in this area if many workers are to live anywhere near where the jobs are.

    Screen Shot 2015-04-13 at 5.16.11 PM Google

    That brings us to some of the serious problems with an economically successful suburb. Silicon Valley, as the name suggests, is hemmed in by mountains and water. All the flat, easily developed land has already been built on in the standard suburban fashion. Over the decades highways have been built through mountain passes to access new land on the other side of these mountains and many people and businesses have expanded outward to the far edges where possible. But the resulting transportation bottlenecks and commute times are severe. Driving to and from Silicon Valley to the outer outer outer suburbs is like pouring molasses through a funnel. People are willing to pay a lot extra to not have to endure that schlep every day. In theory public transportation could ease the commute for many people, but the dispersed development pattern guaranties that transit will never be efficient or cost effective since most people need to drive from their house to a transit center and then take a shuttle bus to the office at the other end of the train line. Living closer to work is a better option for many people. If you have a million dollars on hand you can buy a nice big home with a front lawn and swimming pool in the back yard. Many people in the area do. The median income in Silicon Valley for people with a bachelor’s degree is $95,000 a year. That’s the median, so half the working population earns more than that. A million dollar house is within reason, particularly if there are two incomes per household to carry the mortgage. If not, living in a condo or apartment complex is the next best option.

    Screen Shot 2015-04-08 at 3.41.17 AM Screen Shot 2015-04-08 at 3.41.49 AM Screen Shot 2015-04-13 at 8.29.38 PMScreen Shot 2015-04-13 at 8.28.45 PMScreen Shot 2015-04-13 at 8.29.00 PM 

    From my perspective these intensifying suburbs are in an adolescent phase of development. They are rapidly losing the qualities that people like about the suburbs: open space, privacy, convenience, quiet, lower cost, ample free parking, and so on. But they aren’t yet delivering the things people like about cities: culture, vibrant street life, walkability, convenient public transportation, night life, and such. I stopped and took photos of large numbers of tech workers walking along the side of the eight lane highways at lunchtime. There isn’t anyplace for these folks to walk to. There’s nothing but parking lots, highway fly-overs, gas stations, landscaped berms, and convenience stores as far as the eye can see. When I ask the workers where they’re going they say they’re just stretching their legs and getting some air. They eat lunch (and very often breakfast and dinner) inside their office compounds in subsidized cafeterias. Perhaps in another thirty years the transformation from suburb to something more vital may be complete. Given the suburban chassis these places inherited I don’t see how the underlaying infrastructure will ever support anything other than a bad compromise.

    Joel Garreau calls places like this Edge City: a place that has a suburban form but at an urban density. Driving private cars is no longer convenient here anymore, but transit will never function well either. Jobs are plentiful, but housing is too expensive. It lacks the privacy and peace of a good suburb, but is deficient in the vibrancy and culture available in a real city. It’s too thick to be jam, but too thin to be jelly. 

    John Sanphillippo lives in San Francisco and blogs about urbanism, adaptation, and resilience at granolashotgun.com. He’s a member of the Congress for New Urbanism, films videos for faircompanies.com, and is a regular contributor to Strongtowns.org. He earns his living by buying, renovating, and renting undervalued properties in places that have good long term prospects. He is a graduate of Rutgers University.

  • The French housing Bubble also has Roots in Excessive Land Use Regulations

    Despite the claim to uniqueness that is quintessentially French, the housing bubble shares the same root as we see in the Anglo-Saxon world. To be sure, some analysts blame it only on low interest rates: they made the households more solvent, and thus drove home prices up. This rise in purchasing power might have been enhanced by some specific subsidies to new rental units. Some also y point to normative constraints on new buildings have added to production costs.

    These facts are undisputed, but a demand-only driven bubble can’t happen in a really free market where price signals provide incentives to supply more units, moderating price escalation, and eventually revert the price curve. After all, there hasn’t been anything like a “car price bubble”. So there has to be a supply side factor constraining the building of new homes. And since building itself doesn’t require scarce skills, the constraint has to come from land. These analysts observe that in middle America booming cities like Texas’ Houston and Dallas, or others in Kansas, Georgia, Oklahoma, and elsewhere didn’t experience such a price bubble despite identical credit conditions, despite in some cases, as in Texas, an even greater surge in demand.

    Numbers

    Let’s take a look at official French statistics.

    Professor Joseph Comby (From Institut d’Urbanisme de Paris) summarizes essential data in an exhaustive article (not available online) published in the very specialized peer reviewed "Revue Foncière" (n°3, January 2015), dedicated to land and housing issues. His graphs can be accessed from data provided by our national institute of statistics (INSEE).

    The first graph shows that home prices surged between 1997 and 2007, and that the prices didn’t really slump then, despite worldwide economic crisis. Average home price rose by a whopping 150% in 11 years, and rose 86% faster than households’ disposable income.


    Fig 1. Home price Index, adjusted from households’ disposable income – Base 1, 1965.
    Source: French Ministry of Sustainable Development (
    doc format)

    In this period, the median multiple in France (Average Home price / Average Household disposable income) rose from a stunningly low 2.25 to 4.21, and these average figures hide numerous regional discrepancies.

    Home prices can be truncated between land costs and building costs, including the home and the infrastructure costs (road access, sewage, water and energy adduction, and so on). Had this price hike uniquely "credit and demand" driven, we should have seen a relatively parallel evolution between land and building components in home prices.

    Our national statistics institute conducts regular wealth inquiries on the total wealth of French households. These studies show that the  share of aggregate land value in  homes value rose from 15% in 1996, to 50% in 2007, and slowly decreased then to 45% in 2013.


    Fig 2. France – Share of land in aggregate real estate value
    Source: J. Comby, computed from
    INSEE Annual wealth surveys

    So, from these data, let’s compute how the prices of land and building components evolved between the 1996 low and 2007 peak, relatively to households revenue. The following table summarizes it all:


     1996

    2007

    Price Increase

    Existing homes, average price – (current prices, €) (INSEE)

    77 100

    192 800

    +150%

    Average disposable income per household (current values, €)

    34 149

    45 800

    • 33%

    Ratio Home price / disposable income

    2.25

    4.21

    +86 %

    Land, % of home value

    15

    50


    Land, average value in existing homes (€)

    11 565
    (15% of 77100)

    96 400
    (50% of 192800)

    + 733 %

    Land price appreciation, adjusted from household disposable income appreciation

    + 520 %

    Building, average value in existing homes (€)


    65 535

    96 400

    + 47 %

    As has been seen in the Anglo-Saxon regulated markets, land appreciation overwhelms construction costs appreciation. Figures show clearly that the 1996-2007 real estate bubble is driven by land prices appreciation.

    As a confirmation pattern, INSEE figures from its annual wealth studies show that the total value of built land plots went from 67% of GDP in 1998 (no figures for 1996) to 308% in 2007. So owning developable land in the end of the 90s provided returns that no other asset class could offer, despite creating absolutely no new added value for society. On the contrary, high home prices have been harmful to modest households, with 6% of people experiencing very bad housing conditions (obsolete and/or overcrowded units), 9% other having tough times financing their housing needs (1).  And according to INSEE, there were 112 000 homeless people in 2012, a 44% increase from 2001 (2).

    Since there is no physical shortage of land in France (most of the country is rather flat, and only 7% of land is developed), this suggests loudly to look at our land use regulations to understand how they fed the monster.

    Our regulation of land belongs to the “prescriptive” family, according to Wendell Cox and Hugh Pavletich classification (3). It means that land is, by default, limited for natural or agricultural usage, and turning it into developable land must endure a long and politically complex zoning process. Worst of all, not only each city is zoned, but every local zoning has to comply, since the new millennium, with “territorial coherence schemes” which tend to cap the maximal amount of land available for development through years. Prescriptive regulations can be opposed to “responsive” ones, which can be seen in central parts of America and Canada. In a responsive regulatory frame, default status of land is let to the free choice of the owner, and only limitations for some collective purpose have to pass through a political process, and open a right   for owners to be compensated for the loss of land value resulting of limitations. As Cox and Pavletich as well as the Brookings institution showed, places with prescriptive regulations experienced a much tougher bubble than responsive ones during the years of wild credit expansion. France is not different and the same phenomenon happened.

    The idea of a bubble driven by strong regulatory constraints put on land meets a lot of resistance among several groups familiar in other countries: Local politicians, who get power from a population prone to NIMBY attitudes, and feeling richer through home value appreciation, are the first of them; most farmers, 70% of whom are renters, have an interest in preserving legal interdiction to turn  plots at the fringe of cities into housing developments; and there are about 40,000 employees in public and private jobs who make a living from elaborating and implementing these regulations. 

    So we can see that in France, like other countries, the role of artificial restriction of land supply for new development can’t be dismissed. The costs and benefits of these regulations should be publicly questioned. Can their advocates still deny that that this price bubble is largely an unintended outcome of regulations. Nor can they acknowledge that this  results in increasing levels of “housing poverty” and drives so much resources from more productive investments. Is this  more desirable than “sprawl containment”, “farmland preservation” and other pretenses which provided justifications for these regulations in first place ?

    Vincent Benard is senior economic analyst for the Turgot Insitute (www.turgot.org), a french classical liberal think tank. His principal interests are housing, land use and infrastructure policies, and the study of the unintended consequences of regulations.  Since 2006, he authored one book and many articles about the French housing crisis. " 

    (FYI: The book : https://www.scribd.com/mobile/doc/80163334 – Free, PDF, in French) 

    ———

    Notes: (1) Figures from the annual report of the “Abbe Pierre” Foundation, dedicated to homelessness and poverty assistance  www.fondation-abbe-pierre.fr/
    (2) Source: “L’express”, November 2014 – http://www.lexpress.fr/actualite/societe/le-nombre-de-sdf-en-france-a-explose-en-dix-ans_1623371.html
    (3) See Annual Housing affordability report, by Cox and Pavletich, www.demographia.com

    Photo by Benh LIEU SONG (Own work) [GFDL or CC BY-SA 4.0-3.0-2.5-2.0-1.0], via Wikimedia Commons