Category: Policy

  • The Uncertain Future of the California Bullet Train

    On July 18, at a site pregnant with symbolism — the future location of what HSR advocates hope will become San Francisco’s terminus of the state’s bullet train — California Gov. Jerry Brown signed a bill to fund construction of the first section of the high-speed line. Earlier in the day, Brown had traveled for a similar ceremony to Los Angeles, the other "bookend" of the project. The bill signing ceremonies followed the state Senate’s approval (by a single vote) earlier in the month of nearly $8 billion in state and federal money to build the initial section of the line in the Central Valley and to make  a series of  transportation infrastructure improvements in the LA and Bay Area. 

    According to sources at the California High Speed Rail Authority (CHSRA), the total infrastructure commitment now involves:

    *  $6 billion for construction of the first section of the high-speed line in the Central Valley ($2.7B of state HSR bonds and $3.3B of federal ARRA funds);

    *  $1.2 billion for electrification of Caltrain, the commuter rail line in the SF Peninsula (half from state HSR bonds and half from local funds);

    *  $1 billion for San Francisco’s Central Subway (of which $61M is in HSR "connectivity" funds and $930M in federal New Starts money);

    *  $1.5 billion in other connectivity improvements (BART car replacements, LA Metrolink upgrades, LA regional connector, grade separation improvements) funded by the remaining "connectivity" funds, which must be matched ; and

    *  $1 billion in other SoCal projects ($500M from state HSR funds which must be matched).

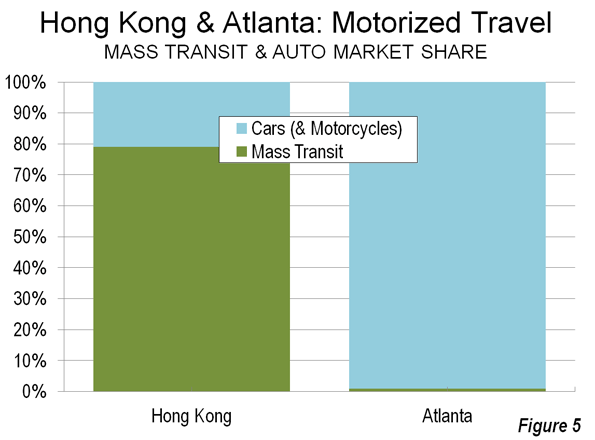
    As can be seen from the above summary, almost half the funding is for upgrades to conventional transit/commuter rail services in LA and the Bay Area. Much to the chagrin of high-speed purists, the project has morphed into a statewide transportation program much of which is totally unrelated to the high-speed rail initiative approved by the voters in Proposition 1A.

    Whether this shift in emphasis represents "a giant fraud perpetrated on the voters who passed Proposition 1A and voted for a true HSR system;" or whether this is a "victory for common sense, a decision that wisely places greater value on satisfying present-day needs than on promises and conjectures of distant-in-time benefits" depends on one’s point of view (both are direct quotes from our interviews.) While bullet train visionaries will view the "bookends" strategy as a betrayal of the original Prop 1A pledge, pragmatists will hail it as a prudent and realistic move to gain political support and a  hedge against  the uncertainties facing the high speed rail project. Just what obstacles confront the project in the months ahead can be gleaned from the discussion below.

    Obstacles and Uncertainties

    Despite the celebratory and self-congratulatory tone of the Governor’s speech, the project faces a number of impediments that could delay it for years if not put an end to it altogether. As a headline in a Wall Street Journal article put it, "For Now, the Bullet Train May Go Nowhere." (WSJ, July 8, 2012). The hurdles the project must overcome include:

    *   A major lawsuit asserting that the Central Valley line project as proposed and approved by the Legislature does not comply with various provisions of the enabling Proposition 1A. According to the plaintiffs, the deficiencies include:(1) no electrification, (2) lack of a "useable segment" (the 130 mile section in the Central Valley by itself is claimed not to satisfy the requirements of an operable segment); (3) lack of adequate committed funding; (4) trip times above the promised 2 hrs 40 min; (5) the need for an operating subsidy; (6) inability to meet the Federal requirement to complete project by September 2017; and (7) inability to meet the promise of a "one-seat ride" from LA to SF (the "blended" approach would require at least one transfer). (John Tos, Aaron Fukuda and County of Kings v. California High Speed Rail Authority). The suit is moving toward trial sometime in 2013.

    *   A lawsuit filed by the Madera County and the Madera and Merced County Farm Bureaus asking for a preliminary injunction to block rail construction in the Central Valley, slated to begin later this year. The suit asserts that the rail line would disrupt 1500 acres of fertile land by cutting off irrigation canals. Officials of the two bureaus say more than 500 farmers whose land lies in the path of the rail line plan to fight any attempts by the state to seize their properties by eminent domain. "It’s going to be a long battle for the Rail Authority," said executive director of the Merced County Farm Bureau. "There is going to be opposition every step of the way."

    *   Several lawsuits challenging the Program level EIR for the Bay-Area-to-Central-Valley section of the statewide project. A victory by the challengers of the Program EIR would "undo" the project level EIRs for the Central Valley construction project, according to Gary A Patton, an attorney who has been involved in the litigation.

    *   Several environmental lawsuits charging the HSR project with violations of the state environmental law (CEQUA) and the Endangered Species Act. The Governor, under pressure from environmentalists, has recently withdrawn his threat  to waive CEQUA requirements.

    *   The possibility of a legal challenge that Proposition 1A money is being used "unlawfully," i.e. for non-HSR projects, in the "bookend" areas.

    Any of the above actions could delay the issuance of the bonds and/or land acquisition, potentially delaying the start of construction and threatening the Authority’s ability to complete the Central Valley section by the federally imposed deadline of September 2017.

    When asked about the potential impact of litigation on the Authority’s schedule, Chairman Dan Richard observed that "simply filing a lawsuit does not means they will win, nor if they do win does it automatically mean injunctive relief." In other words, the litigation may or may not delay construction in the Central Valley. It’s California, so there will always be lawsuits," Richard added with a chuckle.

    The "Bookends" Approach 

    Chairman Richard’s approach is two-pronged. While supportive of the distant vision of linking the Southern and Northern portions of the state with a high-speed rail line, he sees a need to show signs of near-term service improvements in order to gain crucial political support of skeptical local officials and the public. The dollars spent on the "bookends" could have "an immediate and dramatic effect" he told us.

    Improving the metropolitan "bookends" of the system will make it possible to increase the speed of local commuter trains and thus bring immediate travel benefits to large segments of California’s urban population. Will Kempton, chief executive of the Orange County Transportation Authority (OCTA) and chairman of the Independent Peer Review Group advising the High Speed rail Authority agrees. It will be a good investment whether or not the overall $68 billion high-speed rail project ever gets completed, he said. Sensing a promise of new money, planning and transportation agencies in Southern California and the Bay Area have thrown their support to the Authority’s "bookend" strategy.

    The Long-Term Strategy

    As for implementing the high-speed rail project itself, Richard is convinced that its various pieces will eventually fall into place, one step at a time. "What we’re doing is building a high-speed rail line," he told us, "that will connect to the existing tracks and allow passenger-only service between the town of Madera (north of Fresno) and Bakersfield. It will cut significant time off the trip from Oakland/Sacramento to Bakersfield.. At the same time we will be upgrading Metrolink from LA/Union Station up to Palmdale and we have our sight set on the next phase, which is Bakersfield to Palmdale. Once that gap is closed, we’ll have an intercity rail line from LA to northern California, albeit one with a couple of transfers, but we think that is when private sector investment will come in and help upgrade the entire line to full high speed rail. Even our critics agree that if we get to Palmdale, everything changes. We’re not that far away, in terms of either miles or dollars. … Richard summed up, "We took great pains to make sure the investment is not stranded. The point is that we have an effective beachhead for a true advanced passenger rail system."

    Exactly how does the Authority propose to fund the $8-11B cost to close the gap from Bakersfield and the Central Valley to Palmdale and down to LA (assuming the project does not go over budget)? Richard remains serene and confident. "We will have about $4 billion of our bonds left," he said." They must be matched. We will be looking for federal funding, to be sure, arguing that this can help free up freight capacity, assist goods movement through the Central Valley and enhance the efficiency of ports. … We will also be pushing hard to look at other private sources…If all of that fails, we have the prospect of state cap-and-trade revenues."

    These are heroic assumptions. Future federal support is highly uncertain. Congress, by eliminating Title V of the Senate transportation bill (the National Rail System Preservation, Expansion and development Act of 2012) from the final version of the surface transportation reauthorization (MAP-21) and by denying Administration requests for high-speed rail funds three years in a row, could not have sent a clearer message that states should not count on continued congressional funding of high speed rail, Transportation Secretary Ray LaHood’s bluster notwithstanding ("We will not be dissuaded by the naysayers in Congress…High speed rail is alive and well in America…The Administration is keeping high-speed rail on track…") "The President’s high-speed rail program is "a vision disconnected from reality," members of the Democratic-controlled Senate Budget Committee lectured Secretary LaHood at a recent hearing.

    Private sector funding is equally problematic. "We see no evidence that private investors are taking serious interest in this project at this time," a financial consultant knowledgeable in public-private partnerships told us. As for cap-and-trade revenues, their use to bail out HSR is expected to meet with opposition from the state legislature, according to several sources.

    For the backers of high speed rail, the implications are grave. Absent further federal funds and absent private capital, the State will be obliged to seek a fresh infusion of public money as early as 2014 if it is to continue pursuing its $68 billion train project. Will California voters be willing to approve new bonds for this venture, given recent surveys indicating dwindling popular support? Can the Governor and the Authority keep the faith alive by dangling a vision of a bullet train that few voters (and politicians) can hope to see deployed in their lifetime? There is reason to be skeptical.

    Ken Orski has worked professionally in the field of transportation for over 30 years.

    CA route map by Wikipedia user CountZ.

  • The New Geography Of Success In The U.S. And The Trap Of The ‘New Normal’

    This year’s presidential election is fast becoming an ode to diminished expectations. Neither candidate is advancing a reasonable refutation of the conventional wisdom that America is in the grips of a “new normal” — an era of low growth, persistently high unemployment and less upward mobility, particularly for the working class.

    Certainly recent economic news of slowing growth and job creation bolster the pessimists’ case. But Americans may face far better prospects than portrayed by our dueling presidential mediocrities. Let’s look at those states that have found their own way out of the “new normal,” in some cases reversing all the losses of the Great Recession and then some.

    The states that have added the most jobs since 2007 — Texas, North Dakota, Louisiana, Oklahoma and Alaska – are located in a vast energy and commodities corridor extending from the western Gulf to the northern tip of the Continent. New York and Washington, D.C., prime beneficiaries of monetary easing and a growing federal government, have also clawed back.

    But the big winners are in the central energy corridor. Since 2007, Texas has created almost five times as many jobs as New York; California is still down almost 900,000 jobs and Illinois is off close to 300,000.

    This should represent what Walter Russell Mead calls “a new geography of power,” the anointing of new places Americans and business go to find opportunity. One example: five of the six best cities for starting over in 2012, according to TheStreet.com, were in the Dakotas, Utah, Iowa and Nebraska.

    Why the energy and agriculture states? Since the onset of the new century, much of the sustained growth in the world has taken place not in the financial or information capitals, but in regions that produce basic commodities like energy and food. In the high-income world, the consistently best-performing countries since 2008 have also tended to be resource-rich ones such as Norway, Australia and Canada.Blue social policies work best when financed by petro-dollars and minerals sales.

    Domestic and European demand may fall in the next few years, but increasingly global commodity and energy markets are driven by the expanding needs of the major developing countries. This has helped keep energy prices high, particularly for oil. Being good at exploration and drilling has been more profitable than social media. Texas alone has added nearly 200,000 jobs in its oil and gas sector over the past decade and Oklahoma some 45,000. The Lone Star energy sector created twice as many jobs as exist in the software sector in San Jose and San Francisco combined. These jobs have been an outstanding driver of high-wage employment, with an average salary of upwards of $75,000, and located usually in less expensive areas.

    Choice plays an important part in the growth. The energy boom has supercharged the economies of the states that have welcomed this growth, including Texas, Oklahoma, Louisiana, North Dakota, Wyoming and Alaska. It has not been much help to New York and California, which are reluctant to crack rocks to extract even relatively cleaner carbon-based fuels like natural gas. In contrast, long-suffering Ohio and Pennsylvania, where there have been significant new finds of shale oil and gas, appear to have decided that Texas, not California, is the model for spurring growth.

    The energy-producing states can look forward to a bright future in the long run. U.S. oil and Canadian reserves now stand at over 2 trillion barrels and constitute more than three times the total estimated reserves of the Middle East and North Africa. Observers such as the New America Foundation’s Michael Lind believe that new discoveries, particularly of natural gas, mean that we might actually be living in an era of “peak renewables,” and at the onset of a “very long age of fossil fuels.”

    Growth of these sectors — along with construction and manufacturing — could prove critical to our beleaguered working class. There’s not much respect among the university-dominated pundit class for people who work with  their hands or have specific tangible  skills. Instead they need to lower their expectations and seek, as Slate recently suggested, to find work “in the service sector supporting America’s innovative class.”

    In this neo-Victorian society, the “new normal” means a society dominated by  “innovative” or “creative” masters and their chosen, lucky servants. Leave your job and family in the Midwest or Nevada to become a toenail painter in Silicon Valley, San Francisco or Boston. Besides losing any sense of one’s independence, it’s hard to see how a barber or gardener can live decently, particularly with a family, in such expensive places.

    This bleak reality may not inevitable, though. In many places construction employment is on the rise from its nadir in 2010. This recovery has been a nationwide phenomena but is, not surprisingly, most evident in growth states like Montana, Colorado, Indiana, Iowa, Nebraska, Tennessee and Utah.

    At the same time over the last two years the nation has added more than 400,000 manufacturing jobs, led by the industrial states hit hardest by the recession. Though these gains are small compared to the losses earlier in the decade, the growth is encouraging; automakers and other industries already are complaining about severe shortages of skilled labor. Maybe, after all, life as a dog-walker and hostel denizen in Palo Alto is not the best one can hope for if you can make enough to afford a nice suburban house outside Columbus or Detroit.

    The pundit class may be ready to write off the American dream but many Midwest states are working to restore it. Over the past two years Michigan and Ohio have experienced the biggest drop in unemployment of any states in the union; Michigan leads the way with a drop of almost five percentage points, while Ohio comes in second with a nearly three-point decline. Other key Great Lakes battlegrounds—Wisconsin, Indiana and arguably Missouri—have also seen two-point drops in their unemployment numbers.

    Why is this happening? A lot of it has to do with business-friendly state regimes. Unlike Illinois, increasingly the sad sack  of the Midwest, these states have cut taxes, worked to increase the availability of skill training and streamlined regulations. This has allowed them to take advantage of new opportunities.

    Improving the business climate represents the third critical element for overcoming the new normal. Most rundowns of the states with consistently favorable business and tax climates – as judged by executives — start with Texas, Utah and South Dakota. Many states that are recovering best from the recession, like Louisiana, Wisconsin, Florida, Ohio, Michigan and Arizona, all have been improving their rankings in business surveys over recent years.

    But this should not be seen as an exclusively red state phenomenon. Some blue states as well, notably Washington, have worked hard to keep taxes tolerable and have promoted a rapid expansion of their  industrial sector. Democratic-leaning Colorado, under the leadership of pragmatic Gov. John Hickenlooper, has also strived to main a good business climate and promote growth.

    What works, it appears, is not the mindless embrace of GOP or Democratic ideology, but a model that drives economic growth. It’s not rocket science: sensible regulation, moderate taxes and investments to spur job creation and productivity. “There is no Democratic or Republican way to sweep streets,” legendary New York City Mayor Fiorello LaGuardia once remarked and the same is true of economic growth.

    The stories of the successful states tell us the key to success lies  in promoting basic industries like energy, agriculture and manufacturing — which then create business service and high-skilled jobs — combined with a broad agenda favorable to entrepreneurs of all kinds. If only one of our presidential candidates would get the message.

    For more about how states are defying the "new normal," read the 2012 Enterprising States: Policies that Produce report, authored by Joel Kotkin and Praxis Strategy Group.

    Joel Kotkin is executive editor of NewGeography.com and is a distinguished presidential fellow in urban futures at Chapman University, and contributing editor to the City Journal in New York. He is author of The City: A Global History. His newest book is The Next Hundred Million: America in 2050, released in February, 2010.

    This piece originally appeared in Forbes.

    Auto manufacturing photo by BigStockPhoto.com.

  • Housing Affordability Protests Occurring in “Livable” Hong Kong, Not “Sprawling” Atlanta

    The Economist has published another in its city rating series, under the headline "The Best city in the World." This one was the result of a contest examining ways to elaborate on its rating system. The winner, Filippo Lovato, added a spatial dimension to the ratings, which included a 5 point rating of "sprawl," a pejorative term for the natural expansion of cities (which in this article means urban areas, areas of continuous urban development). Much of the urban planning literature is pre-occupied with combating urban sprawl, though urban expansion continues virtually everywhere around the world, as cities add population and become more affluent.

    Livability for Whom?

    As Jon Copestake, the Editor of the Economist Intelligence Unit’s Cost of Living and Livability surveys and I discussed in front of a Property Institute of Western Australia meeting, The Economist livability ratings are not aimed at average resident households, but rather at an international audience, such as corporate executives and corporate relocation services. This distinction can be important.

    Hong Kong was top ranked for livability in the new Economist list. Doubtless this is accurate for well paid executives posted temporarily, who are granted substantial housing allowances by their employers and who can live in luxury condominiums within a short walk or taxi ride to their jobs in Central (the core of the Hong Kong central business district).

    For local residents, livability is measured differently than for jet-setters or corporate executives.

    Hong Kong: Smart Growth Model

    With the developed world’s highest urban area density and lowest automobile market share, Hong Kong beguiles anti-sprawl "smart growth" crusaders, for whom these two characteristics are the "two great commandments."

    The entire  Hong Kong urban form (urban area) is as dense as Manhattan at 67,000 per square mile (25,900 per square kilometer), but is more than twelve times the density of the New York urban area: the city and its “sprawling” surrounding suburbs (5,300 per square or 2,100 per square kilometer). Similarly, Hong Kong is somewhat more dense than the ville de Paris, but seven times the density of the Paris urban area (9,800 per square mile or 3,800 per square kilometer). This hyper-density combined with one of the world’s strongest central business districts give Hong Kong a nearly 80% mass transit share of motorized travel, nearly 10 times that of the New York urban area and more than three times that of the Paris urban area (Figure 1).

    "Livable" Hong Kong?

    To its permanent and unsubsidized residents, though, Hong Kong’s spatial Nirvana does not provide much in terms of livability.

    Excessively Long Commutes Hong Kong’s high density indicates that jobs and houses are relatively close to one another, which should indicate that commute times would be short. Not so. Commutes are among the longest in the developed world – only Tokyo residents take more time to get to work. (Figure 2)

    The average one way commute is 46 minutes in Hong Kong, well above the developed world average of 33 minutes for urban areas over 5,000,000 population. By comparison, commuters in similarly sized Dallas-Fort Worth (26 minutes) and "gridlocked" Los Angeles (27 minutes) get to work much faster. Commuting also takes longer in Hong Kong than in Paris (34 minutes) and London (37 minutes).  Lengthy commutes impose an economic price and make Hong Kong less livable.

    Exorbitant House Prices: Hong Kong’s housing, the largest household budget item, is profoundly unaffordable. The 8th Annual Demographia International Housing Affordability Survey rates Hong Kong as the most costly out of 325 metropolitan areas. The median house price in Hong Kong’s is 12.6 times the median annual gross household income (the "median multiple"), which leaves little more than a pittance in discretionary income for many households. Perhaps this is why Hong Kong’s fertility rate has fallen to rock bottom levels near the lowest on the planet – people cannot afford kids.

    Even during the housing bubble, coastal California never became so unaffordable. Hong Kong housing is nearly twice as costly as San Francisco (6.7 median multiple) and more than four times as costly as Dallas-Fort Worth (2.9), Houston (2.9) or Atlanta (Figure 3).

    Concern about housing affordability has become so intense that it is an issue in public protests, which The Economist reports to have drawn up to 400,000 people earlier this month (link to photo). Exorbitant house prices make Hong Kong less livable.

    "Sprawling" Atlanta

    Things are much different in "sprawling" Atlanta, which The Economist’s spatial list ranks as the worst among the US entries. Atlanta is at the opposite end of the density spectrum from Hong Kong, with the lowest urban population density of any major developed world urban area.

    Short Commutes: Atlanta’s low density would suggest that jobs and houses must be so far apart that commute times are very long. Again, not so. Atlanta commuters have among the shortest travel times (29 minutes) in the world among urban areas of similar size (see Note: Jobs-Housing Balance). Shorter travel times make Atlanta more livable (Figure 4).

    Other similarly sized US urban areas do even better, such as Dallas-Fort Worth (26 minutes) and Atlanta’s leaders know that traffic congestion need to be eased to improve Atlanta’s competitiveness. But the political process politics has offered a dysfunctional plan that would spend more than half of a new tax on mass transit, which is used by only the one percent. Less than one half of the money would be spent on the roads that the 99 percent use (Figure 5). Any strong growth will overwhelm the stingy highway improvements, and if the voters approve the July 31 referendum, Atlanta’s travel time advantage over Hong Kong could narrow.

    Affordable House Prices: Despite being the bane of planning orthodoxy, Atlanta’s has far better housing affordability than Hong Kong. The median multiple is 1.9, compared to Hong Kong’s 12.6. Hong Kongers pay six times as much of their income for their houses (which are also two-thirds smaller than in Atlanta). So far, there have been no protests against Atlanta’s low house prices. Better housing affordability makes Atlanta area more livable.  

    The Hong Kong Model

    Hong Kong’s high density (more than double that of any other large developed world urban area) is an accident of history, the result of geo-politics, not urban planning. Further, China’s impressive new cities are being built at a small fraction of Hong Kong densities. Yet, Hong Kong has given much to the world. Not least is the fact that its market oriented economy served as the model for economic reform which has radically improved livability for hundreds of millions of people in China.

    Further, Hong Kong is attractive as one of the world’s premier tourist destinations. For aficionados of cities, like me, Hong Kong is intensely interesting. It is the ultimate in urbanization. It is a wonderful place to visit and to live – if someone else is paying the bills.

    However, the interplay between Hong Kong’s hyper-dense urban form and its transportation system burdens Hong Kong residents dearly, both in time and money. For them, Hong Kong is hardly a model of livability.

    ——————-

    Note: Commuting in Dallas-Fort Worth: Larger Dallas-Fort Worth has faster average work trip travel times than Atlanta, at 26 minutes, which are principally are aided by its much superior freeway (motorway) systems and arterial street (non-freeway boulevard) systems. Transit carries about one-half the share (0.6%) of travel in Dallas-Fort Worth as in Atlanta.

    Note: Jobs-Housing Balance: One of urban planning’s principal goals is to achieve a jobs-housing balance, wherein jobs and housing are so close that people can walk to work or use transit, minimizing travel times and distances. Hong Kong is best in this, with its small urban footprint. Yet, despite having achieved the ultimate, it takes Hong Kongers much longer to get to work than Atlantans. The comparison of Hong Kong and Atlanta shows this theoretical measure to be of little importance. A better indicator of the jobs-housing balance is practical – how long it takes to get to work.

    Note: Travel Times by Car and Transit: Mass transit has substantially longer average work trip travel times than cars in nearly all of the world metropolitan areas for which data is available. In Atlanta, the average work trip by car (single-occupancy) was 29 minutes in 2007, compared to 54 minutes for mass transit.

    ———-

    Wendell Cox is a Visiting Professor, Conservatoire National des Arts et Metiers, Paris and the author of “War on the Dream: How Anti-Sprawl Policy Threatens the Quality of Life.”

    Photograph: Kowloon, Hong Kong (by author)

  • High Speed Rail Advocates Discredit Their Cause – Again

    Is there any high speed rail boondoggle big enough to make rail transport advocates reject it?  Sadly, for all too many of them, the answer is No, as two recent developments make clear.

    The first is in California, where the state continues to press forward on a high speed rail plan for the state that could cost anywhere from $68 billion to $100 billion. Voters had previously approved $10 billion in bonds for the project, but as the state’s economy and finances have continued to sour – including multiple major cities going bankrupt – the polls have turned against it, and with good reason. The state faces the prospect of already enacted education cutbacks if Gov. Jerry Brown’s tax increase proposal in not approved in a vote this fall.  Other painful service cuts loom. Voters are rightly asking themselves if now is the time to be borrowing public money for very expensive, speculative infrastructure. 

    Equally, many of the much cited overseas examples of high-speed rail seem, well, to be off the tracks.    China’s rail system has serious safety problems, for example. And developing the most extensive high speed rail system in Europe hasn’t stopped Spain from seeing 50% youth unemployment, a 3 percentage point increase in the VAT tax, and a humiliating bailout from the rest of the EU.

    Nevertheless, the California assembly recently voted to go full speed head on its high speed rail plans. As part of an overall $8 billion rail spending package, the state is borrowing $2.6 billion to complement $3.2 billion in federal funds left over from the stimulus (shovel ready???) to build a starter segment of the line linking Bakersfield and Madera through the Central Valley. This is the easiest segment on which to build – though legal action is likely to delay construction – but doesn’t do anything to link the state’s huge population centers around LA and the Bay Area. With no more significant federal funds likely to be forthcoming, and the state’s finances a wreck, this segment risks becoming an embarrassing white elephant, or, as critics call it, “a train to nowhere”.

    After this vote it came to light that respected French high speed rail operator SNCF had approached California officials, private funding in hand, with a preliminary offer to build the LA-SF link themselves on a better and cheaper alignment along I-5 that would cost only $38 billion. But this was rejected by the state. The Times account suggests this rejection came about due to a combination of a political preference for the inefficient Central Valley segment and the clout of Parsons Brinckerhoff, the lead contractor.  Some commentators have referred to this revelation as a “bombshell.”

    Despite management misstep after management deception, rail advocates around the country cheered California’s decision to build the Central Valley segment. Jerry Brown, with not much to show for his reprise as Governor, is excited of course. Secretary of Transportation Ray LaHood called it a “big win.”  America 2050 (an offshoot of the Regional Plan Association of New York), “commended” the state for “taking a big step forward.”  Streetsblog called it a “major victory.”  While I respect what these organizations do in other contexts, this high speed rail vote is not a major victory, but a major defeat for common sense.

    But apparently not willing to let California take the prize in the rail boondoggle category without a fight, Amtrak shortly thereafter issued a “vision” for rail in the Northeast Corridor that would provide faster service between Boston and Washington, DC – at a cost of $151 billion. Strange as it sounds, some commentators actually lauded Amtrak for reducing costs since the previous plan was $169 billion.  The Brookings Institution was measured in its reaction to the plan, but managed to describe it as “more rational.”   With Republicans seemingly safely in charge of the House for now, and large federal deficits projected for the mid-term future, $151 billion for Amtrak seems purest fantasy.

    These developments are unfortunate because high speed rail could play an important role in US transportation, particularly in the Northeast. But that’s unlikely to happen because of the indiscriminate way establishment advocates have supported anything with the “high speed rail” label attached, ranging from $2 billion, 110 MPH peak speed Toonerville Trolleys in Illinois that barely beat Megabus in terms of journey time to the California rail boondoggle, regardless of merit. All they know that if it claims to be high speed rail, they are in favor of it.

    There are other people who take a more serious view. Unfortunately, they tend to be outsiders with little influence.  For example, Alon Levy suggested a set of near term, incremental Northeast Corridor improvements that might cost 90% less than Amtrak’s plan.

    $8 billion in stimulus dollars have gone to purchase us nothing of any real significance in terms of rail infrastructure. That money, invested wisely in high priority projects in the Northeast Corridor, could have made a big difference and started building a real demonstrated case for high speed rail investment in America. Unfortunately, the way high speed rail has been botched by its advocates, all the money we’ve spent on it has accomplished just the opposite. If California’s Central Valley segment is built and the complete line is never finished, it will likely discredit high speed rail in America for the long term.

    Aaron M. Renn is an independent writer on urban affairs and the founder of Telestrian, a data analysis and mapping tool.

    CA route map by Wikipedia user CountZ.

  • Questioning the Messianic Conception of Smart Growth

    A new analysis from the United Kingdom concludes that smart growth (compact city) policies are not inherently preferable to other urban land use policy regimes, despite the claims of proponents."The current planning policy strategies for land use and transport have virtually no impact on the major long-term increases in resource and energy consumption. They generally tend to increase costs and reduce economic competitiveness." The article goes on: "Claims that compaction will make cities more sustainable have been debated for some time, but they lack conclusive supporting evidence as to the environmental and, particularly, economic and social effects."

    These would not be surprising findings to Newgeography.com readers, who are accustomed to similar analyses rooted in economic, demographic, and environmental data. However, this article appeared in the Spring 2012 issue of the Journal of the American Planning Association, under the title, "Growing Cities Sustainably: Does Urban Form Really Matter?"

    Moreover, the authors are urban planning insiders, including Marcial H. Echenique, a land use and transport professor at Cambridge University, Anthony J. Hargreaves from the Martin Centre for Architectural Studies at Cambridge, Gordon Mitchell from the Faculty of the Environment at the University of Leeds and Anil Namdea of the School of Engineering at the University of Newcastle.

    Smart Growth Criticisms

    Many of the British critiques parallel those made by critics of smart growth for years. They focus particularly on the concern that smart growth generally has neglected economic and social costs. For example, smart growth policies lead to higher house prices by rationing land (such as with urban growth boundaries). Higher house prices lead to less discretionary income for households, so that there is less money for other goods and services, lowering employment levels. The resulting densification leads to more intense traffic congestion, with resulting economic losses and more intense air pollution, which is less healthful.

    The Research

    The authors modeled land use and travel behavior in three areas of England, subjecting them to three land use alternatives: compact development (smart growth), planned development (which I would label "smart growth light") and dispersal, the generally liberal approach common in United States, Canada, Australia and New Zealand for decades after World War II (and still in many US and some Canadian markets).

    Echenique et al analyzed the London metropolitan region (Greater London Authority, Southeast England and East England), which has a population of 20 million and the Newcastle (Tyne and Wear) metropolitan region, which has a population of 1,000,000. They also analyzed a sub-region within London metropolitan region, Cambridge, with a population of 500,000.

    Their model projected little difference in outcomes between the three land use regulatory regimes to 2031. Predictably, land consumption was less under the compact development, but the variation in land consumed varied no more than plus or minus one percent from the trend (base case) in the London area, where only 11 percent of the land is in urban or transport use. Other factors, such as the change in transport energy use, greenhouse gas (GHG) emissions from transport and residences and air pollution varied little between the three regulatory regimes.

    Economic costs in 2031 were projected to be the lowest (best) for the dispersed option and the highest for the compact development option, both in the London and Newcastle metropolitan regions. Planned development ranked second.

    The compact development option scored best in the Cambridge sub-region, while the planned development option was the highest cost. The dispersed option ranked second. The researchers attributed the better result for compact development in the Cambridge area to its uniqueness as a low-density, centrally oriented, high-tech, university community and further noted that densification could "reduce its attractiveness over the longer term."

    Smart Growth Claims: Setting the Record Straight

    Based upon their research and review of the literature, the authors proceed to undermine some of smart growth’s most sacred foundations.

    Smart Growth Claim: Smart growth has little or no impact on house prices:

    Echenique et al: "…restrictions on the supply of development land have led to property price increases, penalizing city dwellers by leading to less dwelling space…”

    Smart Growth Claim: Smart growth increases housing choice:

    Echenique et al: "One downside of this policy is a substantial reduction in choice of dwelling types, with new dwellings being mainly apartments."

    Smart Growth Claim: Smart growth does not increase traffic congestion:

    Echenique et al: The authors cite research indicating that high average density is the main cause of highway congestion in Los Angeles. They also cite Reid Ewing (University of Utah) and Robert Cervero (University of California) who reviewed studies of household travel behavior finding that a doubling of density would lead to only a 5 percent reduction per person, or an increase of 90 percent in travel (Note 1). The authors add: "The obvious conclusion is that an increase in density will increase traffic congestion."

    Smart Growth Claim: Smart growth reduces air pollution:

    Echenique et al: "It can also increase the overall respiratory disease burden as exposure to traffic emissions is increased.

    Smart Growth Claim: "Empty nesters" (aging households with no offspring at home) will seek smaller houses in the urban core: 

    Echenique et al: "There is, however, no substantial evidence that older couples leave their spacious houses and gardens…"

    Smart Growth Claim: Smart growth improves the jobs-housing balance.

    Echenique et al: "One of the main arguments for the dispersed city is that there is no longer a single center where most jobs and services occur. Urban areas, rather, exhibit a dispersed and often polycentric structure, bringing jobs and services closer to residents with a more complex movement pattern not readily served by public transport.

    The authors suggest the following "takeaway:"

    "Urban form policies can have important impacts on local environmental quality, economy, crowding, and social equity, but their influence on energy consumption and land use is very modest; compact development should not automatically be associated with the preferred spatial growth strategy."

    Thus, the Echenique et research contradicts the thesis that compact development or smart growth should replace (make illegal) other regulatory regimes, including the more liberal dispersed pattern.

    "Smart growth principles should not unquestioningly promote increasing levels of compaction on the basis of reducing energy consumption without also considering its potential negative consequences. In many cases, the potential socioeconomic consequences of less housing choice, crowding, and congestion may outweigh its very modest CO2 reduction benefits."

    The British research is an important step toward focusing urban policies on objectives, rather than means. Cities are economic organisms. They have increased their share of the population 10 fold in just two centuries and been pivotal to unprecedented economic growth and affluence. People moved to the cities for economic opportunity, not to sample particular urban forms. Cities best serve their principal purpose and their residents best when they encourage economic growth. The fundamental objective is to maximize the discretionary income of residents, and this can be done while reasonable environmental standards are maintained. Yet, as Echenique et al and others have shown, smart growth tends to retard economic growth. In an age of teetering national economies, failing pension funds and the most uncertain fiscal environment in at least 80 years, the world needs cities to be unleashed for the economic growth. Urban policies that ignore economics need to be replaced with wholistic approaches strongly focused on the key reason that cities exist: to enrich their citizens.

    Wendell Cox is a Visiting Professor, Conservatoire National des Arts et Metiers, Paris and the author of “War on the Dream: How Anti-Sprawl Policy Threatens the Quality of Life.”

    ——

    Photo: Letchworth Garden City, London metropolitan region (by author).

    Note 1: Calculation: According to the research, doubling the density of an area reduces vehicle travel per capita by 5 percent. With 200 percent of the previous population (double the density), vehicle travel would be increased 90 percent (200% [x] 95% [=] 190%).

  • U.S. Desperately Needs a Strategy to Attract the Right Skilled Immigrants

    President Obama’s recent “do it myself” immigration reform plan, predictably dissed by conservatives and nativists, reveals just how clueless the nation’s leaders are about demographics. Monday’s Supreme Court ruling on Arizona’s immigration crackdown also broke down along predictable lines, with both parties claiming ideological victories.

    Yet the heated debates are missing the reality of immigration and its role in America’s future. In reality America needs more immigrants, but with a somewhat different mix.

    Rather than an issue of “values” or political sentiment, we need to look at immigration as a matter of arbitrage, a process by which rapidly aging countries bid for the skills and energies of newcomers to keep their economies afloat.

    Nowhere is this immigration arbitrage clearer than in the world’s most rapidly aging region, Europe. By 2050 the workforce there is expected to decline by as much as 25%. Yet this diminishing resource is now increasingly on the march as young Greeks, Italians and Portuguese flee to stronger economies in Europe’s Nordic belt and elsewhere. An estimated half million left Spain last year alone. Ireland, which in recent decades actually attracted new migrants, was exporting a thousand people a week last year. In recession-wracked Britain, a 2010 poll found nearly half of the population would like to move elsewhere.

    Germany, with its ultra-low birthrate and rapidly aging population, has emerged as a primary migration beacon. Germany needs about 200,000 new migrants ever year to keep its economic engine humming. For decades, newcomers from Turkey and other Islamic countries have flocked there, but this migration has failed to deliver much added value due to their general lack of skills and divergent cultural values. So the Germans — as they did back in the 1960s — look to harvest the diminishing pool of skilled workers from equally aging states on the EU’s southern periphery.

    But it’s not simply a matter of a one-way south to north flow. Other EU countries, such as Italy, are playing the immigration arbitrage game by importing young workers from rapidly depopulating southeastern Europe. Milan, for example, added 634,000 foreign residents in just eight years (2000 to 2008), the largest share from Romania, followed by Albania. Over the period, more than 80% of Lombardy’s growth has come as a result of international immigration.

    But immigration arbitrage is more than a simple numbers game. As Europe learned through its bitter experience with immigration from North Africa and the Middle East, importing populations without necessary skills and attitudes useful for the modern economy can produce unhappy results. The key issue is how to attract and select immigrants likely to contribute to the national well-being and economic competitiveness.

    Almost everywhere in the world, there are shortages of skills ranging from construction to advanced engineering. Much of contemporary immigration to East Asia reflects the need for workers — largely from India, Bangladesh, Indonesia and Sri Lanka — to perform tasks considered “dirty, dangerous and difficult” (or 3-D).  Singapore and Hong Kong also have a bull market for high-end workers in order to maintain their increasingly financial and technology-oriented economies.

    But skills should not be conflated merely with university degrees. Education is no longer a guarantor of productivity; the degree, once a sign of distinction, has become a commodity. Many disciplines have little net positive economic impact. Few countries likely suffer shortages of post-modernist literature graduates, performance artists or lawyers.

    Opening the doors to undocumented high school graduates, many with no real marketable skills, as President Obama just did, may not have a great positive long-term effect on the economy. Perhaps it would be better if our immigration policies were less about politics, and ethnic constituencies, and more about gaining specific skills and abilities from other countries, including from Mexico’s growing ranks of educated and skilled workers.

    Some countries, such as Canada, Australia and Singapore, already have made major accommodations favoring skilled or entrepreneurial immigrants. The United States, to its great disadvantage, has been slow in this regard. In 2011 barely 13% of all American immigrants came as a result of employment-based preferences, down from 18% 20 years ago. Family reunification should remain a cornerstone of immigration but needs to give way substantially to a more skills-oriented policy.

    America’s approach is particularly baffling given our looming skills shortages. The reviving auto industry is already running short of craftspeople such as numerical machine tool operators. In fact, David Cole, chairman of the Center for Automotive Research, predicts that as the industry tries to hire upwards of 100,000 workers, they will start running out of people with the proper skills as early as next year.

    This shortage is also intense in many engineering and technically oriented fields. The Pittsburgh area alone has 1,500 engineering job openings. The Great Lakes Metro Coalition, covering 12 states, is advocating for a federal immigration policy focused on attracting highly skilled talent. Government and business leaders in economically healthy parts of the Great Plains, Texas and Utah now consider persistent skilled labor shortfalls — particularly in science and technical fields — as the greatest barrier to continued growth.

    Immigration policy should also look to bring in more entrepreneurs. As business start-ups overall have slowed, immigrants continue to launch new businesses. Today fully one-fifth of all American businesses are owned by immigrants, up from 12% two decade ago. Many of these are located in suburbs and small towns, where together a majority of immigrants see opportunities and a better quality of life.

    These qualitative distinctions may be lost on many in the pundit class. As a decline in Mexican immigration has driven overall immigration down below 2009 levels, the number of Asian newcomers is once again growing. Their share of annual new arrivals has risen over the past two years from 36% to 42%.

    Asians increasingly do not come for just economic opportunity — there’s often more of that at home — but to attain things almost impossible in their native countries  such as a single-family homes with a backyard and less congested, tree-shaded neighborhoods. For some, like migrants from China, political and religious freedom also is often a major attraction.

    This is good news for the future. As a Pew report recently pointed out, Asian immigrants tend to possess many of the characteristics this country sorely needs: a commitment to education, family and entrepreneurship. McKinsey suggests China and India will produce 184 million new college graduates over the next 10 years; this provides a vast pool of which the U.S. has only to pick up a small portion to boost its economy.

    This is not to argue for a policy based on ethnicity or geography. There are hard-working, skilled immigrants to be had from the poorest countries in Latin America or Africa. If you want to see this, go to any strip mall around Houston, Los Angeles or northern New Jersey.

    We need to target immigrants most likely to help our advanced industries, start businesses and families, and whose descendants will provide critical demographic vibrancy. There may soon be many such people looking to move from places like the Middle East, particularly Christians or liberal Muslims threatened by rising Islamism. There also should be policies to welcome restless young Europeans who may be seeking more opportunity elsewhere.

    The age of immigration arbitrage will require critical shifts in all advanced countries to provide many more openings for skilled immigrants and entrepreneurs. But ultimately the best way to attract these people lies in boosting the kind of economic growth and opportunity that can attract this most valuable resource to a country.

    Joel Kotkin is executive editor of NewGeography.com and is a distinguished presidential fellow in urban futures at Chapman University, and contributing editor to the City Journal in New York. He is author of The City: A Global History. His newest book is The Next Hundred Million: America in 2050, released in February, 2010.

    This piece originally appeared in Forbes.

    Immigration rally photo by BigStockPhoto.com.

  • Historic Heritage of the Rust Belt

    I’ve been spending a lot of time in Ravenna recently. No, not the town in Italy with its early Christian buildings and glittering mosaics. I mean Ravenna, Ohio, a small industrial city of some 12,000 people near Akron. 

    Along with Akron and Cleveland, Ravenna flourished as an industrial center in the early 20th century.  In recent decades, however, its economy, like most of northeastern Ohio’s, has been sluggish at best, and the town hasn’t changed much physically for many years except for occasional demolitions at the center and new subdivisions at the periphery. News from Ravenna rarely makes it even into the Cleveland papers. It is certainly not known for its architecture.  It has some perfectly good late 19th and early 20th century houses and commercial buildings, but none of these is likely to draw tourists.

    One of the very few really remarkable things about Ravenna is a 150-foot high flagpole erected in 1893.  Almost absurdly high for the scale of the city, it is a fascinating product of late 19th century American engineering ingenuity and vernacular design as well as a reflection of patriotism and civic pride. Standing right in the center of the city, it is arguably the most notable monument not just of Ravenna but for miles around.

    Unfortunately, township trustees now plan to demolish it.


    Image:  Ravenna flagpole viewed from East Main Street, Ravenna Ohio.  Photo by Tom Riddle, 2012

    The battle over the Ravenna flagpole says a good deal about the fate of the great manufacturing belt that stretches along the southern edge of the Great Lakes. Once one of the greatest manufacturing regions of the world, it has struggled mightily since World War II as aging infrastructure, obsolete industrial facilities, a gap in educational attainment, and non-competitive wages have left it fighting to find its place in the late 20th, not to mention the 21st century economy.

    In many ways Ravenna is a microcosm of the larger region.  In Ravenna, as throughout the region, economic stagnation has taken a toll on the city’s built environment. Main Street has vacant storefronts and empty lots where stores used to stand. Some of the housing stock has started to deteriorate. 

    The biggest change in Ravenna, as in most Rust Belt cities, though, has been the transformation in the industrial landscape. In city after city from Duluth, Minnesota, to Rochester, New York, icons of American industry have vanished. The Homestead Steel works outside Pittsburgh has been largely demolished, replaced by a shopping mall. The same fate has befallen the LTV Steel plant in Cleveland and the great Western Electric complex on the boundary between Chicago and Cicero.


    Image:  Hawthorne Works Shopping Center in front of remaining tower of the Western Electric Hawthorne Works in Cicero Illinois

    Some of this demolition was necessary, even welcome, since many of these factories were located amidst densely populated neighborhoods and constituted a logistical and environmental nightmare. But much of the demolition has been motivated primarily by a desire to remove from sight embarrassing reminders of a previous era. Demolishing the factory, city fathers figure, better allows potential buyers of the site to appreciate a wonderful riverside location or proximity to downtown and the endless opportunities to build something new. 

    What has replaced those grand temples of industry, however, has usually been underwhelming, with late 19th century brick loft buildings reduced to rubble to make way for cheap one-story strip malls that neither employ a lot of workers nor generate a lot of tax revenue. The old urban identity has been destroyed, but there has been very little to take its place. 

    The process is akin to the efforts of men and women of a certain age who resort  to plastic surgery, hair implants and clothes more appropriate for a younger generation. These cosmetic efforts rarely fool anyone.  In fact, what they most clearly convey is a loss of confidence.  

    Fortunately there is a growing awareness that wholesale demolition of industrial fabric does not necessarily   prepare cities for their post-industrial future. This movement to save industrial heritage came into its own first in Britain, not surprisingly, since Britain was the cradle of the Industrial Revolution. For decades now important eighteenth and early nineteenth century industrial sites have been preserved, often as historic sites and tourist destinations.


    Image: Ironbridge in Coalbrookdale, Shropshire, England, named a World Heritage Site in 1986

    A similar thing has happened in the United States.


    Image:  Pawtucket, Rhode Island, Slater Mill, started 1793, now a National Historic Landmark.


     Old loft buildings have become residential condominiums, even in some rather unlikely places.

    Image: River Mill Condominiums along the Fox River in Oshkosh, Wisconsin, opened in 1986 in a building constructed for the Paine Lumber Company


    Image: Quaker Square, Akron, a hotel developed in 1980 in concrete silos built by the Quaker Oats Company in the 1930s and now owned by the University of Akron.

    The preservation of the industrial landscape that cannot be easily reused has been more problematic.   Even so, there has been a movement to preserve some of the most important examples both as testimony to the industrial heritage of their regions and as a way of showcasing the regions in which they are located, providing amenities for the citizens and attracting tourists.

    Germany has been a leader in this movement. The Voelklinger Huette outside Saarbrucken preserves an entire complex intact as a monument to the industrial heritage of the area.  Even more spectacular has been the transformation of large pieces of the Ruhrgebiet, the heart of Germany’s pre-World War II heavy industry, into a set of imaginative parks, museums and other institutions.


    Voelklingen Huette (Voelklingen Iron Works) near Saarbrucken, Germany. A UNESCO World Heritage site and museum.


    Duisburg Nord Landschaftspark (landscape park) in Duisburg, Germany, a coal and steel plant transformed into a public park according to designs done in 1991 by architect Peter Latz who retained as many of the old structures as possible.

    Of course, the Ravenna flagpole lacks the grandeur or the historical significance of these places. But it is an important historic relic in its own right and arguably as important for Ravenna as the great industrial complex at Duisburg is to the Ruhrgebiet.

    Erected in 1893 by the Van Dorn Iron Works of Cleveland, the flagpole was one of at least four similar or identical structures erected in the northeast of the United States. It appears that only the one at Palmyra, New York, still stands. Recently refurbished, the Palmyra pole seems to have been built as a mast for displaying banners of political candidates. 


    Image:  Post card of Main Street Ravenna showing the flagpole in front of the courthouse.


    Image:  Palmyra, New York, flagpole, fabricated, like the Ravenna pole, by the Van Dorn Iron Works of Cleveland. It has been recently restored.

    These flagpoles reflect late 19th century American engineering ingenuity. Earlier poles had usually been of wood. They frequently snapped in high winds and had to be replaced. When the Ravennans needed to replace their pole they used a new and improved technology available to them.

    The technology, involving the use of latticed steel boxes, was developed for the railroad and construction industry. The individual elements were not new. Steel had been replacing wrought and cast iron for a number of years. Truss bridges and other constructions using similar structural technologies had been well developed earlier in the century. Inexpensive steel and the techniques of constructing large structures out of it using rivets rather than bolts, however, was new. The technology was ideally suited to the construction of large structures of all kinds, notably bridges.


    The same qualities of strength and light weight that made it ideal for bridges also made it perfect for towers. All over Europe and America engineers used latticed towers not just for flagpoles, for but lighthouses, look-out stations, electric light towers and a host of other uses.


    Image:  Electric Light Tower, constructed in 1881 at the corner of Market and Santa Clara streets in San Jose, California to house arc lights intended to illuminate downtown.  It collapsed in December 1915.

     
    Image: A surviving “Moonlight Tower” in Austin, Texas.  Manufactured by the Fort Wayne Electrical Company for use in Detroit, 31 of the towers were purchased from the city of Detroit and re-erected in Austin.  In 1970 the remaining 17 towers were listed on the National Register of Historic Places. The city spent $1.3 million to dismantle and restore these towers in the early 1990s.  


    Image: Villingen, Germany, Aussichtsturm (Observation Tower) 1888. This 30 meter high tower, erected on a hill outside the village of Villingen, provided views over the surrounding countryside as far as the Alps.

    The grandest example of this structural technique is, of course, the Eiffel Tower, built for the Paris exposition of 1889. Although larger in scale than any of the other examples, it used many of the same materials and construction methods as the Ravenna flagpole. Initially heavily criticized by much of the artistic elite of the day as being essentially useless and much too big, the Eiffel Tower soon came to symbolize Paris to the world. No one would imagine demolishing it today.


    Image:  Paris, Eiffel Tower built for the 1889 Exposition. It reaches a height of  1015 feet using latticed steel elements and rivets similar to those used on the Ravenna flagpole

    The Ravenna pole, erected four years later was built as a monument to national pride and an affirmation of the place of the city of Ravenna in the larger American republic. The pole also had a more local significance. It would allow Ravennans for once to greatly outstrip their neighbors and rivals in Kent, 10 miles to the west. In fact, at the time of its completion, the pole must have been one of the taller flagpoles in America and one of the taller structures anywhere outside the largest cities.  Of course, by now it has been dwarfed, particularly in the last couple of decades when a new battle for flagpole superlatives has broken out, curiously enough this time in some of the most out-of-the-way corners of the globe.

    National Flagpole at Baku, Azerbaijan, at 545 ft. flagpole, briefly the world’s highest flagpole before being eclipsed by one in Tajikistan. Both were built by a company in San Diego.

    Even if now dwarfed by flagpoles in Azerbaijan, North Korea, and Tajikistan, the Ravenna flagpole still reflects the pride of a struggling industrial city. It has required periodic maintenance and has gotten into the news occasionally when some inebriated citizen has tried to climb it. However, for most Ravennans it has come to be so much taken for granted that citizens were stunned when they heard that the  Trustees of the Township of Ravenna, the body that has jurisdiction, decided that it was a legal liability, a drain on township resources and should be demolished. In response, a group of local citizens has stepped in and is fighting to maintain the pole, raising money toward its repair and trying to see if ownership can be transferred to a governmental entity or group of entities willing to maintain it.

    In one way, this is a fight about intangibles like local pride, patriotism, a desire to maintain historic heritage and a sense of place. Some people write off these sentiments as mere nostalgia. But preservation of this kind can have tangible consequences. No one is claiming that preserving the pole will generate vast new tourist revenues or solve basic economic problems. But the movement to save the flagpole rests on the notion that stewardship of historic heritage can play an important role in reminding everyone of the specific qualities of a place that made it successful in the past – and perhaps can be built upon to craft a better future.

    Robert Bruegmann is professor emeritus of Art history, Architecture and Urban Planning at the University of Illinois at Chicago.

  • Cities, Cars, People: Is Changing Car Use a Function of New Urbanism?

    One cornerstone for urban designers and planners seeking to transform the polycentric or suburban city of the 20th Century into something resembling the high density city of the 19th was a cross-city comparison by Newman and Kenworthy and successors. [1]   They argued that this proved automobile dependence is a function of city density.  It followed that regulating for greater residential densities and increasing the capacity of public transport systems to avoid the congestion that would follow if people continued to drive themselves would improve the sustainability of cities.

    Of course, any comparison with the overcrowded and unhealthy cities of an earlier century is unfair: today’s density is achieved with higher standards of private and public space, and much enhanced transit and sanitation.  And many, probably the majority, of 21st century citizens in high income nations can escape the confines of the urban environment on occasional sojourns to country or coast (or beyond), unlike their 19th Century or developing world counterparts.  They can even find repose in the midst of 24/7 city hubbub in their own in-house media centres.

    But can we really build urban policy on the Newman and Kenworthy analysis?  Especially given evidence that car use is declining anyway?

    Questionable correlation
    There are still questions over the original analysis and it successors.  Cross-cultural effects, physical geography, differences in economic structure, incomes, wealth, and growth all intervene in the relationship between city density and car dependence.  And cause and effect are hard to pin down. 

    Perhaps more critical: the leap from observing relationships across cities at a point in time to regulating travel behaviour, housing ,and consumption choices into the future assumes that individual behaviour is a microcosm of collective behaviour. This fallacy of inference has long been recognised by the biological and sociological sciences.  And the likelihood of getting policy wrong by making such an assumption is far greater when dealing with populations of people, with their diverse circumstances, beliefs, values, and means, compared with, say, populations of penguins. 

    Is it this blind spot that has made it so much more difficult to get people out of their cars or their low density houses than anticipated by urban reformists?

    The city as a time warp
    One problem is that analyses of city density and car dependence are usually static.  Plotting urban form and transport consumption at a particular point in time – the mid/late 20th century in the Newman and Kenworthy case – embodies particular patterns of technology, wealth, and behaviour.  Consequently, their urban prescription is based implicitly on the 9 to 5 work day; single city centres that focus urban employment, exchange, and consumption; and the nuclear family with its distinctive housing and service demands. These are all urban artifacts that have been breaking down since the 1960s.

    But the times they are a-changing
    In a 2011 paper the authors acknowledge that things are changing as international evidence shows rates of car use beginning to decline in parts of the world.  A partial view of what they are changing from, though, sustains a deterministic explanation of the why and what they are changing to:

    “technological limits set by the inability of cars to continue causing urban sprawl within travel time budgets; the rapid growth in transit and re-urbanization which combine to cause exponential declines in car use; the reduction of car use by older people in cities and among younger people due to the emerging culture of urbanism and the growth in the price of fuel which underlies all the above factors”.[2]

    The view remains time-bound; even the reference to exponential decline is a simplistic inference of the relationship between public transport and car use taken from a cross section of cities in 1995. 

    Individual agency barely gets a mention.  Any description of an “emerging culture of urbanism” needs to be embedded in the reality of evolving patterns of wealth, income, and consumption and even in simple demographics to determine just how real and significant it is.

    Growing old and driving more
    What are the grounds for the claim that older people are reducing their car use, for example? I took a quick look at the evidence for New Zealand.  It is certainly not the case here.  The rate of growth in driving has been higher among older age groups than among younger – with decline most evident among the under 45s.  

    Is it so different in the other ageing societies from which Newman and Kenworthy draw their examples?

    Figure 1: Changes in Annual Driving Distance by Age, New Zealand 1990-2008


    Fewer kilometres doesn’t mean less dependence
    What does go a long way to explaining declining car travel in the aggregate is the fact that older people don’t drive as much younger people, and populations in western cities are simply getting older.  It’s simple maths – as the population ages car usage will go down, despite a greater propensity to drive among older cohorts. Again, look at the evidence from New Zealand:

    Figure 2: Automobile Dependence by Age Group, New Zealand 2004-2008


    Car usage appears to decline after age 44, rapidly after retirement age, 65. 

    Why does car use fall with age?
    There are a number of reasons why this may be so.  From 45 years on households have fewer transport-dependent children.  Mature families may have more localised social networks.  A greater share of recreation may be neighbourhood based.

    On retirement work trips disappear and incomes, discretionary dollars and consumption fall.  The capacity for more shared travel and trip planning increases as households age.  Diminished car use doesn’t necessarily mean that households are less automobile dependent.  They just doesn’t generate as much travel demand.

    These explanations don’t depend on particular urban designs.  Yet Newman and Kenworthy claim that diminished driving happens because “older people move back into cities from the suburbs”.  This is not consistent with the common observation of people’s preference to age in place.[3]  (For the New Zealand evidence, see my posting Ageing in the City).

    Moving into the centre – a one-way street?
    And their notion “the children growing up in the suburbs would begin flocking back into the cities rather than continuing the life of car dependence” rather simplifies a historically specific event: the transition of sons and daughters of the baby boomers from young adulthood, advanced education, and job seeking to the career and housing paths associated with their movement into more stable relationships.  As they age, it is highly likely that suburban preferences re-emerge, sustained by the capacity to purchase and operate a private vehicle.

    Generation X boosted inner city dwelling over the past two decades, and Generation Y will do so, to a lesser extent, for another decade.  The 15 to 24 year age group also coincides with the age of greatest automobile independence (illustrated for New Zealand in Figure 3).  But don’t expect this historically-specific phenomenon to sustain some sort of indefinite culture of city consolidation, and I wouldn’t bet the fiscal bank on expensive transit systems designed around the assumption that it will. 

    These are passing generations: their successors will be that much smaller and facing a somewhat different world.[4]

    Figure 3: Use of non-Automotive Modes by Age Group, New Zealand 2004-2008


    Who are we planning for?
    Of course, there are plenty of exceptions to prove the rule: but that is the point.  Diverse communities have diverse expectations and behaviours. And they are continuously changing, in composition, in form, and in behaviour. 

    The failure of modernity lay in its assumption of conformity and convergence, compounded by the conceit that we could regulate for it.  And planning for what is little more than a statistical construct – the auto-independent city – risks blinding us to the richness and opportunity of alternatives, of lifestyle, of environmental stewardship, of urban design, and of mobility.

    If we start with the behaviour of individuals and households our designs for sustainable cities may be less deterministic and our planning less didactic, better informed, lighter in touch, and a lot more effective in meeting the long-term needs of evolving urban communities.

    Phil McDermott is a Director of CityScope Consultants in Auckland, New Zealand, and Adjunct Professor of Regional and Urban Development at Auckland University of Technology.  He works in urban, economic and transport development throughout New Zealand and in Australia, Asia, and the Pacific.  He was formerly Head of the School of Resource and Environmental Planning at Massey University and General Manager of the Centre for Asia Pacific Aviation in Sydney. This piece originally appeared at is blog: Cities Matter.

    Aukland photo by Bigstockphoto.com.


    [1]            Newman, P and Kenworthy J (1989) Cities and Auto Dependency: A Sourcebook. Gower, Aldershot
                         Newman, P and Kenworthy, J Sustainability and Cities: Overcoming Automobile Dependence, Island Press, Washington, D.C.
    [2]        Newman P and Kenworthy J (2011) “‘Peak Car Use’: Understanding the Demise of Automobile Dependence”, World Policy Transport and Practice, 17, 2, 31-42
    [3]        Pynoos R, Caraviello R, and Cicero C (2009) “Lifelong Housing: The Anchor in Aging-Friendly Communities”, Journal of the America Society on Aging, 33, 2, 26-32
    [4]         For New Zealand, check the numbers

  • Enterprising States 2012: Beating the New Normal and Policies that Produce

    The following is an exerpt form a new report, Enterprising States, released this week by the U.S. Chamber of Commerce and National Chamber Foundation and written by Praxis Strategy Group and Joel Kotkin. Visit this site to download the full pdf version of the report, or check the interactive map to see how your state ranks in economic performance and in the five policy areas studied in the report. The full report include a case for the nation beating the "new normal" and lists of best-performing states by policy area, and an index to select the top 10 states likely to continue to grow.

    Troubled by economic stagnancy and high unemployment, many pundits and policy makers are referring to the U.S. economic malaise as the “new normal,” claiming that we have reached both technological and economic plateaus. To be sure, the relative weakness of the current recovery – arguably the weakest in contemporary history – does support the “new normal” thesis.

    Not everyone, or every state, accepts the notion of inevitable, slow growth and gradual decline. From the onset of the recession, some states have largely avoided the downturn. By the end of 2011, six states – North Dakota, Wyoming, Alaska, Utah, Texas, and Montana – showed more than 8% job growth over the past decade. Another 22 had shown some, although less robust, employment increases compared to 2001.

    More important still, nearly every state enjoyed some overall private-sector job growth between January 2011 and January 2012. Most critically, growth has spread to many states hardest hit by the recession, including Michigan, California, and Florida. The strongest job growth continued to take place in other states, notably Louisiana, Oklahoma, Texas, Utah, and North Dakota.

    The new geography of growth reflects many of the intrinsic strengths of the U.S. economy often missed by many policymakers and commentators. After a brief lapse, the country is already outperforming all its traditional high-income rivals in Europe, as well as Japan, as it has done for most of the past two decades. Key U.S. assets include surging agricultural and energy production, the general rebound in U.S.-based manufacturing, and unparalleled technological supremacy. The country remains attractive to both foreign investors and skilled immigrants.

    For the U.S. to be successful, this new geography of growth needs to extend across the 50 states and expand for long enough to significantly lower the high rate of unemployment. This will require something more than a single-sector focus. Attention must be paid to both basic and advanced industries since innovation and technology growth alone cannot turn around most regions and states. 

    More than anything, governments and business leaders need to appreciate how these sectors interact with each other. To be effective across all geographies, innovation must be applied to a broad array of industries, including but not limited to computers, media, and the Internet. Innovation and new technologies are also a means to unlock the productive potential of both mundane traditional industries and the service sector.

    States striving to do well in this environment face many barriers to fostering economic growth and creating jobs. These barriers include the high level of debt in many states; a growing skills mismatch between the workforce and the jobs available within a state; and outdated regulations and taxes that serve as barriers to free enterprise.

    Policies that Produce

    In the ebb and flow of the global economy, states can no longer rely solely on strategies of keeping costs low and providing incentives to attract footloose, commodity-based branch plants or offices. Instead, states must create the right business climate that allows companies and entrepreneurs to create 21st century jobs. 

    Dramatic changes in the scope and scale of the global economy have significantly altered the nature of foreign competition. Jobs are the new currency for leaders across the globe, and those who can create good jobs will own the future. With 95% of the world’s customers now living outside our borders, trade with other countries is a key part of our economy that will continue to be important long into the future. 

    Businesses need a highly skilled workforce – which includes many workers with certificates or two-year degrees – that is able to perform the jobs of a 21st century economy. States that are able to get students involved in the STEM fields – science, technology, engineering, and math – will be the most competitive. 

    Innovation, now the essential driving force for creating and sustaining economic opportunities, is much more multidisciplinary and global in scope than ever before. Innovation and market cycle times are much shorter and continue to accelerate. This makes it more important than ever that states provide the tools, support, and tax and regulatory environments for companies to continuously innovate without onerous delays and burdensome costs that put their entrepreneurs and businesses at a competitive disadvantage.

    Enterprising States 2012 takes an in-depth look at the specific priorities, policies and programs of the 50 states. Generally, the states fostering economic growth and creating jobs today – and those most likely to grow in the next decade – are defined by the following broad policy approaches:

    • Parlaying their natural resources and historically competitive industry sectors into 21st century job-creating opportunities
    • Paying attention to and addressing their competitive weaknesses
    • Supporting their companies’ business development efforts to reach an expanding global marketplace
    • Creating a fertile environment and workforce for a technology-based and innovation-driven economy
    • Investing in infrastructure – digitally and physically engineered – that meets the operating requirements of business and connects businesses to markets and customers
    • Getting government, academia, and the private sector to collaborate effectively to make sure that more new ideas developed by companies and in research labs scale up into industries
    • Taking steps to make existing firms more productive and innovative, creating an environment in which new firms can emerge and thrive
    • Maintaining an affordable cost of living for middle-skilled and middle-class employees
    • Promoting education, workforce development and entrepreneurial mentoring to continually fill the talent pipeline
    • Fostering an enterprise-friendly business environment by cleaning up the DURT (delays, uncertainty, regulations, and taxes), modernizing government, and fixing deficiencies in the market that inhibit private-sector investment and entrepreneurial activity.

    State policies and programs that most effectively promote job creation are rooted in market reality. This means building on the existing core industries and technological advantages of a state while pursuing opportunities in growing and emerging sectors. Building on and sustaining existing economic momentum remains a key means of guaranteeing success in the future.

    Huge increases in food exports, domestic energy investment, a revived manufacturing sector, a burgeoning tech sector, vital demographics, and increased investment from abroad create a strong base for long-term secular recovery of the U.S. economy. Rather than facing a dismal future of the new normal, we may actually be on the cusp of a recovery that could become one of America’s finest moments. The key to making this work, for the states and the nation, lies in policies that promote broad-based, long-term economic growth.

    Download the full report, or read the Enterprising States 2012 coverage at the National Chamber Foundation blog.

    Praxis Strategy Group is an economic research, analysis, and strategic planning firm. Joel Kotkin is executive editor of NewGeography.com and author of The Next Hundred Million: America in 2050.

  • From California to Canberra, the Real Class War

    Just under a year before she crawled over Kevin Rudd to claim the Prime Minister’s office, Julia Gillard visited the United States in her then capacity as Australia’s Education Minister. Her stay in Los Angeles took in the Technical and Trades College, where she brushed up on the teaching of “green skills,” a subject close to her heart. “Here in Los Angeles," she told the media that day, “under the leadership of Governor Schwarzenegger, this is a state that is looking to the future; this is a state that is leading on climate change adaption; and this is a state that’s leading on green skills and I’ve seen that on display today at this college.”

    The date was 5 October 2009. As far as dud forecasts go, these platitudes don’t match Lincoln Steffens on the Soviet Union – “I’ve seen the future and it works” – but they’re bad enough. Today Schwarzenegger has gone, his reputation in tatters, and California, reduced to issuing IOU’s to pay its bills, teeters on the brink of bankruptcy.

    Australians have long seen California as a trend-setter, given the common Anglophone culture and semi-arid climate on the Pacific Rim. There’s also the shared love of motor car mobility and suburban independence, and a voracious appetite for tech and entertainment products pouring out of Hollywood and Silicon Valley. But these days the Golden State is just as likely to fill Australians with unease. They find themselves infected with a strain of the green-welfare-utopianism that brought California to its knees.  

    Sure, this doesn’t show up in official statistics; at least not yet. Gillard and Treasurer Wayne Swan never tire of reminding Australians they are “the envy of the world”: unemployment at 4.9 per cent, GDP growth of 3 percent (or more) this financial year, government debt to GDP ratio of just 23 percent and a projected budget surplus in 2013. In April, the IMF predicted that Australia would be the best performing advanced economy over the coming two years. The government and its allies in the elite media are hyper-vigilant about containing discussion of the nation’s affairs within this bounteous frame.

    It’s hard to reconcile Australia’s position with the plight of California, which routinely attracts phrases like “basket case.” Unemployment is running at around 11per cent, significantly above the national US average of 8.2 percent, and Governor Jerry Brown is struggling with an intractable budget deficit of around $US20 billion. Thousands of teachers and other public servants are being laid off, and revenue imposts are driving businesses to other states. One commentator went so far as to say “California’s situation is in some ways more worrisome than Greece’s,” since it represents 14 per cent of the American economy, while Greece only accounts for 2 per cent of the EU.

    But if any of this is supposed to make Australians feel good about their lot, it doesn’t. However benign the headline figures look, they’re in a restive mood. The Westpac-Melbourne Institute index of consumer sentiment continues to languish in negative territory, and the latest Roy Morgan Monthly Business Confidence Survey recorded a 57 percent fall in businesses which believe “Australia will have good economic conditions in the next 12 months”. Astonishingly, the recent Boston Consulting Group consumer sentiment survey found that Australians feel less financially secure than the average European, even less secure than Spaniards, whose economy is in meltdown.

    Nor is much love flowing to Gillard and Swan. Stuck in opinion-poll hell – support for the government has been around 30 percent for over a year – they would be thrown out in a landslide if an election were held today.  

    Why are Australians so low when their economy is so high? The chattering classes are in a funk over this conundrum. People should be showering this fine progressive government with praise, they insist. In patronising tones so familiar around inner Sydney and Melbourne, one columnist scribbled “we are, as a nation, chucking a full-on, all-screaming, all-door slamming teenager temper tantrum … Maybe it’s time we grew up and realised how good we’ve got it.” Others suggest more sober explanations.

    Topping the list is Gillard’s absurd $23 a tonne carbon tax, effective from 1 July this year. Most pundits are loath to concede that, in international terms, the measure is quite radical and Gillard only embraced it to appease the Greens. From the comfort of their armchairs, they dismiss fears about the tax as irrational. After all, Treasury modelling indicates that the effect on growth will be minuscule and, under the government’s package, households will be over-compensated for cost of living increases. If only the Opposition would drop its inflammatory attacks, they maintain, the pessimism would disappear.

    Some blame the negative wealth-effect of sliding house prices and shrinking superannuation funds, battered by stock market volatility.  

    No doubt, such factors do contribute to the malaise, along with loss of faith in a parliament hit by financial and sexual scandals implicating the Speaker and a Labor MP. But opinion-makers who refuse to look beyond the headline figures are concealing the larger story. Across a range of traditional industries, workers grasp that the economy is shifting in directions that could erode the foundations of their mobility and independence. Understanding more than they are given credit for, they fear that the current Labor Government, beholden to Greens and academic elites, and hiding behind stodgy rhetoric, is driving or exploiting those shifts. The most visible manifestations of this are the carbon tax and other green agendas.

    These workers have cause to be worried, if they glance across the Pacific. In his close analysis of the California crisis, US demographer Joel Kotkin starts with the premise that “California consolidated itself as a bastion of modern progressivism.” Drawing on extensive evidence, Kotkin exposes the suffocating influence of radical environmentalists, progressive high-tech venture capitalists, Hollywood moguls, and civil rights attorneys, who have given California escalating energy costs – 50 per cent above the US average and rising – and dwindling fossil-fuel energy exploration and production, America’s sixth highest tax rates, also rising, coupled with proposals to skew the tax system in favour of the super-rich against microbusinesses, the third heaviest tax burden on business out of the 50 states, enormous subsidies and tax breaks for solar and other renewable-energy producers, and complex labour laws.

    “California’s green policies”, says Kotkin, “affect the very industries – manufacturing, home construction, warehousing, and agribusiness – that have traditionally employed middle and working class residents”. With reason, Kotkin calls these developments The New Class Warfare. There is indeed a class dimension to discontent in the United States and Australia, and it has nothing to do with the confected class-war rhetoric coming out of the Obama Administration – “we must all pay our fair share” – and the Gillard Government –“spreading the benefits of the [mining] boom”.  

    John Black, a demographic profiler and former senator, points out that since Labor came to power in 2007, “public administration, education, and health sector jobs have accounted for almost six out of ten of the 760,000 jobs created, instead of the longer term two out of ten.” The health industry alone has grown by 260,000 jobs in four years, a figure that equates to some 2.6 per cent of the whole workforce. Over those years, manufacturing, which accounts for 8.3 of total employment, lost close to 100,000 jobs.

    Last year, “health care and social assistance” replaced “retail trade” as the largest occupational category profiled by the Australian Bureau of Statistics, while “manufacturing” along with “agriculture, forestry and fishing”, traditional blue-collar hubs, were the only categories to contract. "Education and training" and "public administration and safety" ranked higher than "transport, postal and warehousing" and "wholesale trade".

    Job-shedding by a succession of manufacturing, retail and construction firms has dominated recent news bulletins. According to Black, if not for growth in the publicly-funded sector, the employment rate would be closer to 7 than 5 percent.

    If Gillard and Swan are to be believed, such shifts are beyond their control. In a major address on the economy in February, Gillard explained that “the level of the dollar – and the pace of its rise – has broken some business models and forced economic restructuring”. Displaying Marie Antoinette levels of indifference, she declared “these are powerful, economy-wide transformations, perhaps best thought of as ‘growing pains’.” If you thought this posed a complex challenge, think again. “The equation is simple,” she said, “skills brings jobs, and skills bring job security.”

    Here Gillard genuflects to the progressive dogma that education is the answer to every economic problem. It’s hardly surprising that a movement dominated by academics, researchers, educators and university administrators should claim ownership of the path to salvation. But Gillard has it back-to-front. In activities like manufacturing, economic growth brings jobs, which bring skills, not the other way around.

    It’s true that the mining boom and Australia’s safe credit rating have driven the dollar to near or above parity with the greenback. It’s also true that this has exerted pressures on the export and import-competing sector. But government action has intensified these pressures. Labor is ideologically committed to social gentrification and expansion of the white-collar professional classes, particularly in social services, even if this means transferring resources from productive industries that will slow down, stagnate, shrink or vanish.

    While Gillard and Swan would never be so candid, their allies in Australia’s bulging university system, the public sector unions and the Greens aren’t so inhibited. Nor are Labor figures like former Prime Minister Paul Keating, who criticised the Opposition’s attack on the carbon tax in these startling terms:

    … in this country, 80 per cent of people work in the tertiary economy, in services, in the industry like – as we are tonight, in the service economy. And, the new industries, the green industries, are service industries, not the old manufacturing. Manufacturing’s moved to the east [meaning East Asia]. It’s the service industries that are the new growth industries. So, to turn your back on the mechanism which allocates the capital out of the old industries and into the new ones is to turn your back on the future.

    If Gillard Labor cared about blue-collar and other routine jobs, not to mention the small business sector, they would switch to policy settings that spur growth in industries like manufacturing, retail, transportation and logistics, construction and forestry. Cutting spending, reducing company and other business taxes, junking green taxes and green tape, withdrawing from the debt market and liberalising industrial relations would hand employers more flexibility to cope with the high dollar and low cost competitors in Asia.

    Clearly, this isn’t the government’s priority. Instead they have introduced a carbon tax and a mining tax, and in last month’s budget dropped a proposed cut in company tax, they are throwing at least $2.7 billion at various green schemes, not including the “winner picking” $10 billion Clean Energy Fund, they have adopted a Renewable Energy Target of 20 per cent by 2020, they are pouring vast sums of money into higher education to the tune of $5 billion a year including an additional $5.2 billion in the budget, some of which will find its way into a maze of “sustainability institutes,” they have lifted the cap on university places and embarked on a radical plan to expand the proportion of 25 to 34 year olds with a bachelor’s degree to 40 per cent by 2025, they have re-regulated the labour market and imposed a system which, according to the chairman of BHP-Billiton, “is just not appropriate and doesn’t recognise today’s realities,” they have laid the groundwork for new multi-billion-dollar programs in aged, disability and mental health care, employing tens of thousands of new carers, and they have endorsed an industrial tribunal decision that boosts the pay of these workers by up to 65 percent.

    California here we come.

    John Muscat is a co-editor of The New City, where this piece first appeared.

    Photo of Australian Parliament House by BigStockPhoto.com.