Category: Politics

  • Playing with the Big Boys: The Costs of Fruitless Passenger Rail Tours

    In these hard times the New Zealand public is somewhat excited about the travel costs incurred by our Government Ministers and MPs. Overseas travel attracts particular rage and fury.

    A particularly galling example is a proposal by Christchurch City Mayor Bob Parker, his CEO Tony Marryat, and an urban planner, to visit the US to investigate the performance of light rail in Los Angeles, San Francisco Bay Area, Seattle and Vancouver.

    These cities seem unlikely to provide any relevant information, if only because their populations are many times those of Christchurch, a metropolis of roughly 370,000 and a downtown population of a mere 8000. In comparison:

    • Los Angeles – 13.8 million
    • San Francisco/San Jose – 5.3 million
    • Seattle – 3.3 million
    • Vancouver – 2.1 million

    The reason the Christchurch team cannot investigate a rail system in the US serving a metropolitan area of only some 350,000 people, and with a CBD of only 8,000 people, may be that because so far, at least, even the most enthusiastic Smart Growth planners in the US are not that silly.

    Randal O’Toole, who has made many studies of urban rail systems, points out in “Unlivable Strategies” that spending money on expensive forms of rail transit is fundamentally inefficient because other transportation systems cost far less to build.

    Light rail, he argues, has become popular in the United States precisely because it is expensive. Congress gives transit grants to cities on a first-come, first-served basis. So the cities that build the most expensive transit systems get the largest share of federal transit funding.

    Naturally, dozens of cities are in line to get their share of the pork.

    But that does not prove that light rail is worthwhile. Too many cities have built expensive rail lines and then found that, due to overruns, high operations and maintenance costs, or heavy mortgages, they have to cut back bus service. The result is that rail construction has actually led to reduced transit ridership in many, if not most, cases.

    The Grand Tour: My Version

    Los Angeles and San Francisco Bay

    Here is what the Christchurch Mayor and his team should learn from their visits to the Los Angeles and San Francisco Bay.

    • Los Angeles reinforces the Portland experience (a much smaller city) where cost overruns forced Portland to raise bus fares and cut bus service during construction of its first light-rail line in the 1980s. As a result, a smaller proportion of Portlanders ride transit to work and other places today than did so in 1980. A similar situation in Los Angeles led to a 17 percent decline in transit ridership between 1985 and 1995. The NAACP sued the transit agency for cutting bus service in low-income neighborhoods while building rail to middle-class neighborhoods. The suit forced the agency to scale back its rail plans and restore bus service, which led to a recovery of ridership.
    • In the San Francisco Bay Area, due to heavy rail debt, San Jose was forced to drastically cut bus and rail service in 2001 and lost 35 percent of its riders. The transit system had to make further cuts in 2007.

      Furthermore, despite (or because of) several extensions of the BART line, transit ridership in the San Francisco Bay Area has fallen by more than 10 percent since 1982. Several transit advocacy groups, including the Sierra Club (Piper, 2004), the Bay Area Transportation and Land Use Coalition (BATLUC, 2003), and the Bay Rail Alliance (Carpenter, 2007), actively oppose a proposed extension of BART to San Jose because they know investments in other forms of transit are much more cost effective.

    Overall, US urban areas with rail transit have not fared as well as areas with bus transit. Between 1990 and 2000, the number of people in regions with rail transit who commute to work by transit actually declined, while the number in regions with bus-only transit systems increased.

    The saddest part of these stories is that the people who lose tend to be those most dependent on transit due to low incomes or an inability to drive, while the people who end up riding rail lines tend to have higher incomes and plenty of auto-mobility. (Winston and Shirley, 1998, p. 9).

    Rail transit actually represents a transfer of resource from the poor to the well-off – Robin Hood at work in reverse gear.

    Seattle

    After getting voter approval for rail transit in 1996, Sound Transit began operating 31 miles of commuter rail service between Tacoma and Seattle in 1999. It also built a 1.6-mile streetcar line in downtown Tacoma at a cost of $50 million a mile, a third more than planned. As of December, 2003, Sound Transit also operates a 35-mile commuter rail line from Everett to Seattle.

    Sound Transit’s Seattle-Tacoma commuter-rail line is one of the least productive in the nation, carrying less than one seventh as many passenger miles per route mile as the average commuter-rail line. As a result it has one of the highest operating costs per trip or per passenger mile of any commuter rail line. Despite starting out with free service, the Everett line has been running more than 70 percent empty.

    Transit’s growth in travel and market share is almost entirely due to bus transit, not rail transit. But the growth in the region’s congestion is due to decisions made early in the decade to concentrate on rail transit rather than highway construction. Those decisions have harmed Seattle area residents in many ways, including cost overruns, congestion, transit’s cost ineffectiveness, and housing prices.

    Future plans: The Sound Transit agency originally projected that the cost of building a 24-mile light-rail line from the Seattle-Tacoma airport to the University of Washington and Northgate would be $2.4 billion. Shortly after receiving voter approval, the agency increased this estimate to $3.6 billion.

    After many stops and starts, last year voters endorsed an $18 billion Sound Transit plan for a 53 mile network which they hope will attract 25,000 daily riders by 2030.

    Our Christchurch team should learn from the Seattle story that, once embarked upon, these rail plans tend to eat ever increasing amounts of money.

    Vancouver

    We can only wish them luck on getting useful information out of Vancouver. There seem to be no collections of the statistics on the performance of the transit systems as are available to US researchers here and here (Excel files).

    However, we do note that in 2008 the operating cost of the Translink Sky Trains was C$773,737,000 and this was ‘covered’ by C$359,911,000 of fares and advertising, $262,298,000 motor fuel taxes,$255,741,000 property tax, parking site taxes $8,758,000 and others of $33,313,000.

    So the transfers from motorists and property owners are greater than the fare revenues.

    In 2008 the Long-term debt was C$1,822.7 million.

    Grand Plans

    Christchurch Mayor and his team are presumably looking at these rail systems as a means of supporting their Smart Growth plans for the Greater Christchurch area.
    If the Mayor and his team ask the right questions, and collect the right data, it will be evident to Blind Freddy’s dog that if these boondoggle systems have failed in these major cities, with their major concentrations of employment, then there is no way that light rail can provide a cost effective and efficient service to Christchurch and its environs.

    Sorry about that. Enjoy the trip.

    Owen McShane is Director of the Centre for Resource Management Studies, New Zealand.

  • Vetting the Volt: Toward Meaningful Electric Car Fuel Consumption Ratings

    The 230 Miles per Gallon Claim: The General Motors (GM) announcement last week that the Chevrolet Volt would achieve 230 miles per gallon in city driving and a rating of more than 100 miles per gallon with combined city and highway driving sadly contains more hype than reality. The Chevrolet Volt is a plug-in hybrid vehicle that GM intends to begin marketing in 2010. GM has indicated that the car will be able without gasoline for 40 miles, on its rechargeable battery. After the battery is depleted, the car would begin to use gasoline. The 230 mile per gallon figure, according to GM, was calculated using a proposed but yet not revealed Environmental Protection Agency fuel economy testing procedure. Similarly, the details of the GM calculation were not revealed.

    Criticisms: Rather than the expected praise, the GM claim was met by a barrage of questions and criticism. Consumer Reports said that the 230 miles per gallon claim might be the exaggeration of the century. Automaker Nissan, facetiously responded with a claim that its forthcoming all electric (not hybrid) “Leaf,” would achieve 367 miles per gallon in a Twitter post. Nissan, unlike GM can be excused for not providing the details of its calculation, since it was “making fun.” EPA distanced itself from the GM announcement, indicating that it had not yet tested the Volt.

    The criticisms and questions revolved around a single issue: How had General Motors calculated the 230 miles per gallon figure. Regrettably, General Motors has yet to provide a complete answer.

    From the sketchy details released, it appears that the 230 mile per gallon rating was based upon the assumption that a driver would travel less than 40 miles each day and recharge the battery at night. Using this methodology, there would never be a reason for the car to use gasoline, so long as the daily mileage is less than the battery capacity.

    A New EPA Rating System: Reportedly, the EPA’s fuel economy testing procedure for plug-in electric vehicles (whether hybrid or not) will report kilowatt hours (KWH) of electricity consumed per 100 miles. Presumably, this rating will be placed on the fuel economy window sticker on new cars, perhaps alongside some miles per gallon conversion. GM indicates that the Volt will consume 25 kilowatt hours per 100 miles in city driving.

    Policy Imperative for Improving Fuel Efficiency: The impetus for improving automobile fuel economy is being driven by public policy objectives to reduce greenhouse gas emissions, especially carbon dioxide (Note 1), and away from the consumption of petroleum .

    Even though the Volt will produce no greenhouse gas emissions from its tailpipe when operating in the electric mode, the electricity that drives its battery would come from power plants, many of them relying on fuels like coal, which produce high amounts of greenhouse gas emissions. In fact, coal accounts for roughly 30 percent of all electricity production in the country; other fossil fuels another 35 percent.

    A Flawed EPA Fuel Economy Rating System? Neither the GM calculation nor apparently the proposed EPA rating system include greenhouse gas emissions from electricity generation. A greenhouse gas gram emitted from an electric power plant smokestack has the same impact as one from an auto tailpipe. Any EPA fuel efficiency rating system that does not take into consideration power generation emissions would be shockingly incomplete and misleading. Consumers would not be given reliable information on the greenhouse gas emissions from cars they might purchase. One would expect that a government committed to greenhouse gas emission reduction would task its implementing agency with ensuring the availability of relevant and reliable information.

    Power Generation and Plug-In Cars: On average in the United States, the generation of each KWH produces 610 grams of carbon dioxide (1.35 pounds). By comparison, combustion of a gallon of gasoline emits nearly 8,900 grams of carbon dioxide. Thus, nearly one gallon of gasoline is the equivalent of approximately 15 KWH of electric power in its greenhouse gas emissions (Note 2).

    Thus, if the Volt uses 25 KWH to travel 100 miles in an urban area, then the greenhouse gas emissions from generating its power will be somewhat over 15,000 grams (Note 2), or the same as 1.7 gallons of gasoline (Note 3). Under these average operating conditions, the Volt would achieve approximately 60 miles per gallon (Note 4).

    Exaggeration Doesn’t Help: Now there is nothing to be ashamed about 60 miles per gallon, unless, that is, you have claimed 230 miles per gallon. Regrettably, General Motors, which could have claimed a great environmental advance, has diminished it by failing to “level” with the public. This kind of public relations will not help a company whose performance has cost it market share for well over a generation. .

    The Volt (and the Leaf) Will Get Better: Of course the equivalent miles per gallon would be much higher if US power generation were more efficient. And, it will be. For example, it has been proposed that electric power generation needs to become at least 80 percent less greenhouse gas intensive by 2050. If this is accomplished, the Chevrolet Volt could indeed achieve 230 equivalent miles per gallon and perhaps the Leaf 367. But neither car will reach these plateaus in the short term.

    A Better Fuel Economy Rating System: Since the EPA fuel economy rating system has not been finalized, its potential defects can be corrected. Any EPA fuel economy rating system should include a greenhouse gas emissions indicator. This should be provided for city driving, for highway driving and a combined overall figure. Moreover, such a rating must include the very real emissions that occur at the power plant. It would be appropriate for EPA to continue reporting miles per gallon and adding KWH per 100 miles, so that the cost impacts are clear to purchasers.

    Regional Variations: There is another complicating factor – regions. For example, in North Dakota fuel economy would be approximately 35 miles per gallon equivalent with full electric operation, well below the average 60 equivalent miles per gallon. On the other hand, in the state of Washington, the Volt would achieve its 230 miles per gallon equivalent, nearly 7 times the North Dakota fuel efficiency. This is not because people in Washington are more environmentally sensitive than North Dakotans. The difference is in type of power generation. Nearly 80 percent of Washington’s power is generated by hydro-electric and nuclear plants, which produce virtually no carbon dioxide emissions. On the other hand, nearly 80 percent of North Dakota’s electric power is produced with fossil fuels. These differences will be moderated as electric power production becomes less greenhouse gas intensive.

    The Bottom Line: Despite the exaggeration and misleading information, this story is far more positive than negative. Congratulations to General Motors (and Nissan) on the strong advances they have apparently made in vehicle technology. This is just further evidence of the potential of human ingenuity. From the 150 mile per gallon cars to which President Obama is committed to the zero emission petroleum car system demonstrated by a Georgia Tech team, the good news is that people can continue to live as they like, while admirably reducing their greenhouse gas emissions to meet whatever objectives are ultimately adopted.


    Notes
    1: Carbon dioxide accounts for the overwhelming share of greenhouse gas emissions from motor vehicles.
    2: Calculation: 8,900 (divided by) 610
    3: Calculation: 25 KWH (times) 610
    4: Calculation: 15,000 grams (divided by) 8,900 grams
    5: Calculation: 100 (divided by) 1.7
    6: A grams per mile rating system should include “upstream” activities, such as the greenhouse gas emissions required to produce and distribute petroleum, which by various estimates increases the emissions by 20 to 25 percent. Similarly, upstream electric power production emissions should be included.


    Wendell Cox is a Visiting Professor, Conservatoire National des Arts et Metiers, Paris. He was born in Los Angeles and was appointed to three terms on the Los Angeles County Transportation Commission by Mayor Tom Bradley. He is the author of “War on the Dream: How Anti-Sprawl Policy Threatens the Quality of Life.

  • Hypocrisy? Conservative Anti-government Folks are Also at the Public Trough

    Frequent news stories tell of folks who protest and rant about “socialism” and government handouts, especially recently in the “debate” over health care reform, but who turn out to live on social security and depend on Medicare, and sometimes don’t even know they are public programs! This likely tells us about the astounding power of the religious right and of the economic illiteracy of much of the population.

    Statistics of possible interest and value include data on the balance between federal tax receipts and federal outlays for the states and variation in “dependency” or the shares of unearned income/transfer payments by states (social security, public assistance, etc).
    Is there any evidence of more “liberal” Obama-voting in states which actually pay more in taxes than they get back, or which have lower rates of dependency?

    Yes, but the relations are not strong, because there are some very confounding factors, like size of state, age of the population, or presence of federal institutions.

    Still, here is a list of states that support the hypocrisy argument about the balance of receipts versus outlays.

    Get/Give Ratio Share of Obama Vote Get/Give Ratio Share of Obama Vote
    State Low High   State High Low
    NV 65 55 MS 202 43
    NJ 66 57 AK 184 38
    CT 69 61 LA 178 40
    NH 71 54 WV 176 45
    MN 72 54 AL 166 39
    IL 75 62 SD 153 45
    DE 77 62 KY 151 41
    CA 78 61 MT 147 47
    NY 79 63 AR 141 39
    CO 81 54 OK 136 34
    MA 82 62 SC 135 45
    WI 86 56 ID 121 36
    WA 88 57 AZ 119 45
    MI 92 57 KA 112 42
    OR 93 57 WY 111 33

    But some states are exceptions, notably the following group with both high outlays relative to receipts and high concentrations of Obama voting:

    Get/Give Ratio Share of Obama Vote
    State High High
    NM 203 57
    VA 151 53
    HI 144 72
    ME 141 58
    MD 130 62

    Except for Maine, these states have a large federal presence.

    Now is there evidence of states with higher shares of the populace depending on unearned income and transfer payements voting more Republican? Again, yes, but even less strongly, and the dependency share are never really very high.

      Dependence Obama State Dependence Obama
    States High Low     Low High
    OK 7.3 34 MD 4.1 62
    AL 7.2 39 MA 5.0 62
    AR 8.3 39 IL 5.2 62
    KY 7.5 41 CT 4.9 61
    MS 7.7 43 CA 4.8 61
    ND 7.5 45 WA 5.3 57
    WV 10.5 45 NJ 4.9 57
    MT 7.9 47 NV 5.2 55
    NH 5.1 54
    MN 5.1 54
    CO 4.0 54

    But some states are exceptions, coming in high in both categories or low in both categories, notably:

    Dependence Obama State Dependence Obama
    States High Low     Low High
    RI 6.7 63 TX 4.8 44
    VT 6.5 67 UT 4.8 34
    HI 6 72 AK 3.2 38
    ME 7.3 58 GA 4.5 47
    NM 6.8 57
    PA 7.5 54
    IA 7.3 54
    FL 7.8 51

    These “high high” states have very high shares of the elderly.

    States on both lists supporting the hypocrisy theory include the Republican voting states sitting at the trough: WV, AL, KY, MT, AR and OK on the one side, and Democratic voting states showing less dependency on various federal sources: MA, NV, NJ, CT, NH, MN, IL, CA, CO and WA on the other. HI and ME are contrary on both lists. Note that most of the other states have around average values and show no consistent patterns. They are mapped but not discussed.

    Richard Morrill is Professor Emeritus of Geography and Environmental Studies, University of Washington. His research interests include: political geography (voting behavior, redistricting, local governance), population/demography/settlement/migration, urban geography and planning, urban transportation (i.e., old fashioned generalist)

  • The New Radicals

    America’s ”kumbaya” moment has come and gone. The nation’s brief feel-good era initiated by Barack Obama’s stirring post-partisan rhetoric–and fortified by John McCain’s classy concession speech–has dissolved into sectarian bickering more appropriate to dysfunctional Iraq than the world’s greatest democratic republic.

    Yet little of the shouting concerns the fundamental economic issue facing the U.S. today: the decline of upward mobility and income growth for the working and middle classes. Instead we have politicos battling over two versions of ”trickle down” economics.

    The Democrats seem bent on installing a permanent ruling mandarinate alongside a small financial aristocracy. The Republicans, meanwhile, simply want to help the rich hold onto as much of their money as possible.

    Neither approach will improve prospects for the vast majority of Americans. The Bush Administration policies of low taxes–for the upper classes–and less regulation helped engender a massive asset bubble unsupported by economic fundamentals. This ultimately drove up both the current account and federal deficits and led to the severe Great Recession.

    The Obama ”trickle down” is, sadly, not all that different from the Bush-Paulson strategy. Like its predecessor, it endorses the bailout of giant financial institutions as the linchpin of its economic policy. It is, simultaneously, profoundly anti-democratic and anti-capitalist.

    Other aspects of the Obama policy seem likely to prop up Wall Street traders at the expense of the rest of us. The administration’s big ”cap and trade” proposals could prove more advantageous to well-heeled ”carbon traders” than to the environment. The other big winners may be Silicon Valley venture capitalists, who– increasingly bereft of their own ideas for making money–hope to cash in on Washington-subsidized energy schemes.

    Of course, not all Democrats have sold out. Sens. Byron Dorgan, D-N.D., and John Tester, D-Mont., have expressed opposition to bailing out ”too big to fail” institutions. New York Attorney General Andrew Cuomo has been fearless in unveiling the enormous Wall Street bonuses–over $32.6 billion last year– handed out as firms suffered $81 billion in losses and almost drove the world economy to ruin.

    Unfortunately, these are exceptions. Illinois Sen. Dick Durbin recently admitted that the banks remain ”the most powerful lobby on Capitol Hill,” adding that they ”frankly own the place.”

    So far in 2009 the Democrats have netted nearly 60% of all campaign contributions that have come from the financial industry, now the largest sector in terms of donations. The biggest donations have gone to such influential Democrats as Sen. Charles Schumer and his sidekick, newly appointed Sen. Kirsten Gillibrand, from New York; Sen. Chris Dodd D-Conn., and Majority Leader Harry Reid D-Nev. Schumer, the Street’s leading vassal in Congress, has emerged as the rising star in the Democratic leadership. If Majority Leader Reid loses his seat–as is now possible, according to polls in Nevada–Wall Street’s main man could well end up a future Majority Leader.

    Some Democrats try to have it both ways, playing populists for the peanut galleries but getting cozy with the industry when it matters. Massachusetts Rep. Barney Frank, the House Financial Services Chairman, talks tough but has a history of friendly relations with financial powerhouses. One of Frank’s own top assistants, Michael Pease, just went to work for the biggest winner since taking TARP bucks, Goldman Sachs. As left-winger blogger Glenn Greenwald put it recently: ”The only way they can make it more blatant is if they hung a huge Goldman Sachs banner on the Capitol dome and branded it onto the foreheads of leading members of Congress and executive branch officials.”

    In the end the faux populist Democrats end up with policies that make Ronald Reagan’s ”trickle down” seem downright Leninist. Harry Truman once quipped that ”There should be a real liberal party in this country, and I don’t mean a crackpot professional one.” Sadly, it’s increasingly the latter.

    The hypocrisy should open a path for the Republicans as wide as the Grand Canyon. But the ill-named Party of Lincoln still seems to think that the path to power lies in the tired old formula of ultra-patriotism, guns, abortion and religious rectitude. Screaming ”socialism” may awaken the spirits of some on the old right, but it’s hard to make a convincing case when George Bush socialized banking and grew the deficit.

    You certainly can’t trust big-business conservatives to stop bonuses for the TARP babies, particularly the 25 financial firms deemed ”too big to fail” by the likes of Ben Benanke. Give GOP big-business leaders higher stock prices, and they will follow you anywhere. Only a few–such as Sen. Charles Grassley, R-Iowa,–have shown they are truly serious about the free market or defending the interests of the regular taxpayer.

    Given this sad political picture, the best hope now is to build an alternative perspective that focuses on the basic economic issues. This would not be the media celebrated movement of moderates–Democrats-lite and Republicans-lite–who seek kumbaya through compromise. It would, instead, require a radical third tendency–neither strictly left or right–that would draw on long-term American priorities and values.

    These new radicals would focus on basic issues like improving infrastructure, and primary education and bolstering the nation’s productive economy. Their inspiration would come from a long tradition of federal successes–from the Homestead Act and the WPA to the Interstate Highway and the space program. They would view the financial crisis not as an imperative for protecting the well-connected but for financial reform, decentralization and innovation.

    Such an approach would address what the British author Austin Williams calls our ”poverty of ambition.” Americans historically have rejected a future constrained by entrenched hierarchies. Most, I believe, would support spending money and paying taxes, if it was spent to achieve big things that would lead to a greater, more widespread prosperity and opportunity.

    Just imagine if the upward of $1 trillion spent guaranteeing Goldman Sachs and Citigroup executives giant paydays had instead gone into roads, bridges, subways, buses, port development, skills training, energy transmission lines and basic scientific research. And imagine if instead of protecting Citigroup and Bank of America, we encouraged stronger local banks and solvent financial entrepreneurs to fill the breach left behind by gross failures.

    Such an approach may seem extreme, but it might have wide appeal. We know, for example, that the TARP bailout is widely unpopular. Indeed, according to one survey taken earlier this year, Americans oppose continuing bailouts for banks by better than 2 to 1.

    As I travel the country, I find anger is deepest among business owners who find securing loans increasingly difficult nearly a year after the original bailout. Even as the economy slowly recovers, this anger will become more pronounced with the coming bonuses doled out to those at bailed-out firms. As Sen. Grassley puts it: ”My people ask, ‘When are these people going to be put in jail?”’ Instead we’re paying for them to stay at the Ritz.

    This article originally appeared at Forbes.

    Joel Kotkin is executive editor of NewGeography.com and is a presidential fellow in urban futures at Chapman University. He is author of The City: A Global History. His next book, The Next Hundred Million: America in 2050, will be published by Penguin early next year.

  • California Disease: Oregon at Risk of Economic Malady

    California has been exporting people to Oregon for many years, even amid the recession in both states.

    Indeed, the 2005 American Community Survey report shows that California-to-Oregon migration was 56,379 in 2005, the sixth-largest interstate flow in the United States. The 2000 census showed a five-year flow of 138,836 people, the eighth-largest over that time period. Until two years ago, Oregon was managing to absorb this population with mixed results, but generally as part of an expanding and diversifying economy. But that pattern has ended, at least for now.

    So now what will Oregon do with a suddenly excess population? California, at least, can say its emigres over time will reduce unemployment and reduce out-of-whack property prices. The immediate net benefits for Oregon are harder to discern.

    California’s massive economic collapse — which has resulted in 926,700 jobs lost from July 2007 through June 2009 and an unemployment rate of 11.6 percent — is now becoming Oregon’s problem. As Californians, largely for lifestyle and cost reasons, head north across the border, they have helped swell Oregon’s ranks of both unemployed and, perhaps equally important, underemployed.

    Our analysis of California migrants has shown a gradual reduction in their earnings over what they were earning in the Golden State. There also are less quantifiable impacts. Portland, a city attractive to many unemployed and underemployed younger Californians, could well be becoming the “slacker” capital of the world.

    There’s another major problem with the continuing California migration. Along with young people, newcomers to the state also include large numbers of the retired and semi-retired. These people generally have little interest in economic growth, whether for longtime state residents or their fellow, often younger emigres. Instead what they bring with them are political attitudes that could slow down the state’s economic recovery.

    Some might call this California disease. This refers to a chronic inability to make hard decisions as well as a general disregard for business and economic activity.

    California’s inability to plan or create new public infrastructure affects every part of the state’s economy. California was once a leader in building infrastructure, but that was in Pat Brown’s gubernatorial administration in the 1960s when California last planned a major infrastructure project.

    There are consequences to California’s inability to deal with infrastructure. Its freeways are parking lots. Its water problems are threatening the viability of Central Valley agriculture, one of the key drivers of the state’s economy. Its electrical system is so bad that every summer brings the fear of interruptions in the supply of electricity. Its universities are in decline. Its prisons are overcrowded.

    Another symptom of California disease is regulation and red tape that increases the uncertainty for any project and raises the cost.

    California projects can be in planning for years, and at the end of that planning process they may still be denied. The long delays are expensive. And as many would-be California developers will tell you, the uncertainty is a strong detriment to economic activity and development.

    We also see symptoms of California disease in tax policy. California no longer has the United States’ highest income tax rate. Big deal. With a top income tax rate of 10.3 percent, sales taxes that can reach 10.25 percent and a 33.9 cents-per-gallon gas tax, its total taxes are among the highest in the country.

    California’s regulatory climate also reflects the disease. Even as the state endures its most brutal recession in decades, it persists in unilaterally imposing new regulation, making the state less competitive with other states.

    In short, California is whistling past the graveyard, hoping that its economy will rebound, “because it always has.”

    Key symptoms of California disease are forgetting that quality of life begins with a job and negative domestic migration.

    With all the influx of Californians, it’s not surprising that Oregon shows some signs of California disease. It recently increased its tax rates so that Oregon’s highest-income taxpayers face marginal tax rates that match Hawaii’s for the highest in the nation. Oregon’s land-use planning had been extremely centralized for some time. Indeed, Oregon’s land-use planning may be the most centralized in the United States. This makes it harder for communities to control their own destinies, whether they want to grow or not.

    If Oregon does have California disease, the malady is surely not as advanced as it is in California. Oregon has lower gasoline taxes and lower property taxes than California. Oregon, in contrast with California, enjoys net positive domestic migration. It is also a good sign that a significant percentage of the people moving to Oregon from California are young folks. While it seems to many that the typical California immigrant is a wealthy aging baby boomer, the data show that he (or she) is still most likely a young person in his 20s or 30s, and often married with children. They are people who, if the economy grew, could have something to contribute to the economy as well as the cultural development of the state.

    But Oregon’s relationship with California remains a double-edged sword. On the one hand, Oregon has benefited from the inflow of cash and skilled workers. On the other hand, Oregon’s relationship with California has led to the current situation where at 12.2 percent for the month of June, Oregon has one of the highest unemployment rates in the United States.

    Oregon may be at a crossroads. The state is richly endowed with many of the components of a high quality of life. People want to live in Oregon, and they are moving to Oregon even in hard times. Yet as the population swells, there’s no concurrent growth in businesses and employment. Over time, this could pose serious problems. Remember, quality of life begins with a job, preferably a rewarding, well-paying job.

    However, Oregon must avoid making many decisions that led to California’s current situation. The costs of California disease are more than those reflected in the economic statistics. Devastated communities and families, and wasted opportunities, could infect this fair state for years to come.

    Joel Kotkin is author of “The City: A Global History.” Bill Watkins is director of the Center for Economic Research and Forecasting at California Lutheran University.

  • Nice Houses for Ducks

    During the long hot summer of the expenses scandal in British politics, one of the most bizarre stories concerned a Conservative MP who claimed from the public purse for a second home: a place for his ducks. It wasn’t any old duck house, however, but a ‘Stockholm’ floating model, valued at over £1,500. It is over 5 feet high.

    If only two ducks lived in the duck house, with its prime waterside location and spectacular views of the gardens beyond, their living space would be on a more generous specification – measured by their weight – than the hundreds of thousands of new homes that have been built in Britain in recent years. For one of the lesser-commented upon hypocrisies of the expenses scandal has been the chasm between those with two or more houses, and the many thousands who have just bought a home to find they couldn’t swing a duck around in it, let alone a cat.

    The BBC recently reported some of the new homes are so small that they have been rejected by the housing associations: these are the agencies that have taken over a great deal of the rented housing in Britain since the Conservatives abolished council house building in 1980. Housing associations are empowered to purchase some homes from the private market for rent to their tenants, or for shared ownership schemes.

    Good housing for those who cannot afford private ownership should be welcomed, and the housing associations congratulated for dismissing the smallest new dwellings. But the key question is: why should so much of the new housing seem to be built for birds, not people?

    British new housing today is rapidly becoming a scandal, at least for those who have to live in it. The BBC report found that in some new dwellings valued at over £200,000 ($326,000), rooms were tiny, and many basic construction faults were to be found. And Britain is now building the smallest new homes in the developed world: in Holland the average size of a new build home is 115 square metres, and in Japan it is 92.5 square metres. In Britain a paltry 76 square metres is common. (BBC News, New Homes Rejected for Social Housing (16 May 2009))

    The causes of this cramped and unhappy state of affairs cannot completely be laid at the door of New Labour. During the 1980s the Conservative government of Margaret Thatcher terminated the obligation of private builders to construct new homes according to the Parker Morris standards set out in the report of the same name in 1961. The Toryism of Thatcher may have been more stridently in favour of the aspirational home owner than the more ‘one-nation’ Conservatism of Harold Macmillan, who legislated them, but these guidelines should not have been revoked. Whatever their faults, those standards laid down decent room sizes, and allowed for more generous interpretations of internal uses of space. Council tenants and private home owners benefited from both.

    Now, following the abolition of Parker Morris, it was possible to build new dwellings with a double bedroom that was marginally bigger than a double bed. This tendency to cram became commonplace, however, under Labour, whose housing policies mindlessly follow the idea that, when it comes to housing, tiniest is next to godliness.

    This brilliant approach arose in the 1990s as part the notion that creating higher densities in British cities would stimulate urban renewal. The formula was simple, or rather simplistic, and was best articulated by the leading architect Lord Rogers of Riverside. ‘Let’s cram our city centres’ he wrote provocatively. Of course, this was not for his usual clients for whom he designed spacious office blocks and sizeable swanky houses.

    Rogers was appointed as Head of the Urban Task Force, commissioned by the New Labour government. Its report entitled Towards an Urban Renaissance (1999), called for flats to populate the city centres at high densities. And as for those sprawling suburbs around the outskirts of town, so popular with English home owners, they were to be retro-fitted to utilise existing green spaces for housing.

    So much for verdant England. Even little parks and large private gardens are now vulnerable to development. Interestingly, the first illustration in Towards an Urban Renaissance is a photograph of the then Deputy Prime Minister John Prescott, who, of course, has two homes and more than one car. Needless to say, he welcomed the recommendations in the report since he likely never saw it applying to him or his friends.

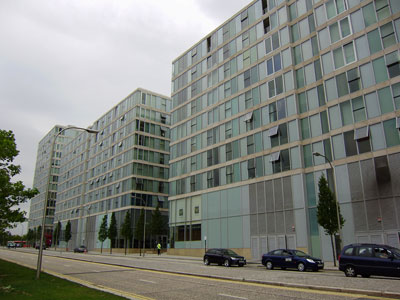
    Environmentalism has further accelerated the trend for the shrinking of the British home. The emphasis upon the Rogers-style compact city has been trumpeted by the Green Party and other environmental lobby groups because higher densities and small build theoretically cause less carbon emissions and use up less non-renewable sources of energy.

    Yet let the obstreperous commoner be a bit put off by the high priests of cramming. Some of the most outspoken advocates of environmentalism come from wealthy patrician backgrounds, for example Jonathan Porrit and Prince Charles. Buckingham Palace and High grove House are hardly exercises in low-density living.

    All this leads to some doubts about the democratic future under the influence of our feudalist betters. A recent article in Regeneration and Renewal magazine by Sir Peter Hall draws attention to research led by Marcial Echenique at Cambridge University. Echenique and his team compared the ‘Richard Rogers-style compact city’ with ‘market-led dispersal, US fashion’. Their findings raise some profound questions in an urban democracy:

    The compact city cut carbon emissions by just 1 percent; but there were higher economic costs in outer areas where people still want to live, and where demand was greatest. Also, any social aspects of the compact city were to some extent undermined by crowding, exposure to noise and the crush on facilities.

    American style sprawl by contrast raised energy use and CO2 emissions by almost 2 percent, but engendered lower house prices, less crowding and less road congestion. (Hall, Sir Peter ‘Planners may be wasting their time’, Regeneration and Renewal, 6 July, 2009)

    None of this has yet created the momentum for a radical push back on housing policies, but it should. Conservative, Liberal and Labour MPs are now guiltily paying back their sums for using their expenses to buy their own often lavish second homes. It is striking how they have enjoyed a privileged access to accommodation which they, through legislation, would make all but unaffordable to millions outside the wealthiest classes.

    Once upon a time our political class understood that they ignored the hopes of less-well-off owner occupiers at their peril. Labour’s spectacular victories in 1997 and 2001 owed much to the votes of those who wanted to get on the housing ladder, or who had just clambered onto it, and naturally wanted the best home for their money. Before then, under Thatcher, the Conservatives successfully garnered the support of the same class.

    Now lamentably all the parties display little interest in the aspirations of working-class, lower middle-class and immigrant wannabe homeowners for a decent space. Instead they are to be treated like water fowl by those who generally have access to one or more homes. Some may do it in the name of being “green” but there’s a better term for what they are doing: hypocrisy and class privilege.

    Mark Clapson is a social historian, with interests in suburbanisation and social change, new communities in England and the USA, and war and the built environment.

  • Glimpsing the Good in Police Chief Bratton’s Goodbye to L.A.

    Los Angeles Police Department (LAPD) Chief William Bratton’s pending departure makes now a good time to give him credit for a habit that draws scant attention amid talk of his traveling ways and unapologetic ego: The guy works very hard at every aspect of his duties.

    It’s a habit that can touch other lives as a matter of course. It touched me one morning at the Los Angeles Police Academy. Bratton had invited me there to address a graduating class with a reading of a column I had written about the challenges of policing our city. I sat on the main dais with my wife, while some of my other family members were in a front row to the right, where the sun soon drew a bead on them.

    At one point Bratton had finished an inspection of the graduates arrayed on the greensward and was returning to the main dais when he stopped smartly and told my family members to feel free to move back a row or two for some shade.

    It was a considerate gesture amid a precisely timed ceremony – made all the more so because Bratton had no way of knowing that one of my sisters had recently been treated for skin cancer. This is a younger sister of mine, and it’s been some time since she’s needed me to look out for her, but I still do in small ways.

    I took Bratton’s courtesy personally, as a helping hand. It was one of those moments when someone extends themselves without knowing the full effect of their effort. It was the residue of a solid work ethic. It was the by-product of a constant dedication to the protocol that helps inform a sense of duty.

    Bratton has it – and he will be missed.

    There are also plenty of very public reasons to regret Bratton’s departure. Crime has gone down consistently on his watch. Relations between LAPD and the city’s ethnic communities are better than ever, although there’s still work to be done. In any case, the agency has seen broad reform and earned a release from federal oversight.

    Yet there’s an opportunity to be found in taking a break from the intensity Bratton brings to his work. This is a fellow who comprehends much more than the core of policing, taking pains to understand anything that could have a significant bearing on the job, including technology and statistical analysis. Lately he’s talked about using those disciplines in something called predictive policing, an effort to pinpoint who is likely to commit crimes, at what times, and in which locations.

    I think we should all appreciate the fact that substantial individuals are dedicated to an exhaustive pursuit of new tools for law-enforcement.

    We should also remember, however, that Bratton is a cop who views the world from a cop’s perspective. That is altogether appropriate for him — and it leaves us with the responsibility of considering whether a hard-charging chief who is intrigued by predictive policing could hold the potential to bring serious erosion to our civil liberties.

    It’s true that we have elected officials and a judicial system to stand guard against incursions on our civil liberties, adding more than a cop’s view to the debate.

    That’s a bit shaky, though, given political trends of recent years.

    Bratton adds to my worries because he’s as good at politics as any politician in our city. I worry about having a police chief who not only has the ability and drive to get a grasp on something like predictive policing but might also have enough political skill to sell the notion in a way that bypasses healthy debate.

    Perhaps Bratton’s departure will provide time for Mayor Antonio Villaragiosa and others at City Hall to ponder the balance of liberty and security – and to consider how much of one we are willing to trade for the other.

    I thank Bratton for his dynamic approach to reshaping law enforcement in our city, and I certainly don’t intend to diminish his success at fulfilling the mission he took on in Los Angeles.

    I address my concerns to our elected officials, all of whom should recalibrate their relationships with the sort of authority figures who possess the ability to make folks feel safe.

    It could be downright unsafe to get in the habit of relying on a top cop to handle the whole job.

    Jerry Sullivan is the Editor & Publisher of the Los Angeles Garment & Citizen, a weekly community newspaper that covers Downtown Los Angeles and surrounding districts (www.garmentandcitizen.com)

  • Can Obama be deprogrammed?

    In my first foray into political life in the 1970s, I worked during college on the staff of a liberal Democrat in the Texas state Senate. Only a few years earlier, Patty Hearst had been kidnapped and brainwashed by the Symbionese Liberation Army, and a moral panic about cults seducing college kids was sweeping the nation. One result was the rise of a new, thankfully ephemeral profession: “deprogrammers” who for pay would kidnap a young person from a cult and break the spell, by means of isolation, interrogation and maybe reruns of “The Waltons.”

    A reactionary Republican state senator from the Houston area, who was heartily despised by my senator, introduced a bill granting parents the right to hire deprogrammers to kidnap adult children who belonged to what the parents regarded as cults and then confine them in motels for several weeks, subject to psychological coercion, without notifying the authorities. Needless to say, this deprogramming law was the greatest threat to the tradition of habeas corpus until another reactionary Texan was installed in the White House in 2001. The bill was laughed to death, when, during a hearing, the sponsor was asked if it could be used to deprogram young people who had joined a certain well-known cult. “Why, yes, Senator,” the Republican replied, “it would apply to cults like the Unitarians.”

    Boy, do we need deprogrammers now, to liberate Barack Obama from the cult of neoliberalism.

    By neoliberalism I mean the ideology that replaced New Deal liberalism as the dominant force in the Democratic Party between the Carter and Clinton presidencies. In the Clinton years, this was called the “Third Way.” The term was misleading, because New Deal liberalism between 1932 and 1968 and its equivalents in social democratic Europe were considered the original “third way” between democratic socialism and libertarian capitalism, whose failure had caused the Depression. According to New Deal liberals, the United States was not a “capitalist society” or a “market democracy” but rather a democratic republic with a “mixed economy,” in which the state provided both social insurance and infrastructure like electric grids, hydropower and highways, while the private sector engaged in mass production.

    When it came to the private sector, the New Dealers, with some exceptions, approved of Big Business, Big Unions and Big Government, which formed the system of checks and balances that John Kenneth Galbraith called “countervailing power.” But most New Dealers dreaded and distrusted bankers. They thought that finance should be strictly regulated and subordinated to the real economy of factories and home ownership. They were economic internationalists because they wanted to open foreign markets to U.S. factory products, not because they hoped that the Asian masses some day would pay high overdraft fees to U.S. multinational banks.

    New Dealers approved of social insurance systems like Social Security and Medicare, which were rights (entitlements) not charity and which mostly redistributed income within the middle class, from workers to nonworkers (the retired and the temporarily unemployed). But contrary to conservative propaganda, New Deal liberals disliked means-tested antipoverty programs and despised what Franklin Roosevelt called “the dole.” Roosevelt and his most important protégé, Lyndon Johnson, preferred workfare to welfare. They preferred a high-wage, low-welfare society to a low-wage, high-welfare society. To maintain the high-wage system that would minimize welfare payments to able-bodied adults, New Deal liberals did not hesitate to regulate the labor market, by means of pro-union legislation, a high minimum wage, and low levels of immigration (which were raised only at the end of the New Deal period, beginning in 1965). It was only in the 1960s that Democrats became identified with redistributionist welfarism — and then only because of the influence of the New Left, which denounced the New Deal as “corporate liberalism.”

    Between the 1940s and the 1970s, the New Deal system — large-scale public investment and R&D, regulated monopolies and oligopolies, the subordination of banking to productive industry, high wages and universal social insurance — created the world’s first mass middle class. The system was far from perfect. Southern segregationist Democrats crippled many of its progressive features and the industrial unions were afflicted by complacency and corruption. But for all its flaws, the New Deal era is still remembered as the Golden Age of the American economy.

    And then America went downhill.

    The “stagflation” of the 1970s had multiple sources, including the oil price shock following the Arab oil embargo in 1973 and the revival of German and Japanese industrial competition (China was still recovering from the damage done by Mao). During the previous generation, libertarian conservatives like Milton Friedman had been marginalized. But in the 1970s they gained a wider audience, blaming the New Deal model and claiming that the answer to every question (before the question was even asked) was “the market.”

    The free-market fundamentalists found an audience among Democrats as well as Republicans. A growing number of Democratic economists and economic policymakers were attracted to the revival of free-market economics, among them Obama’s chief economic advisor Larry Summers, a professed admirer of Milton Friedman. These center-right Democrats agreed with the libertarians that the New Deal approach to the economy had been too interventionist. At the same time, they thought that government had a role in providing a safety net. The result was what came to be called “neoliberalism” in the 1980s and 1990s — a synthesis of conservative free-market economics with “progressive” welfare-state redistribution for the losers. Its institutional base was the Democratic Leadership Council, headed by Bill Clinton and Al Gore, and the affiliated Progressive Policy Institute.

    Beginning in the Carter years, the Democrats later called neoliberals supported the deregulation of infrastructure industries that the New Deal had regulated, like airlines, trucking and electricity, a sector in which deregulation resulted in California blackouts and the Enron scandal. Neoliberals teamed up with conservatives to persuade Bill Clinton to go along with the Republican Congress’s dismantling of New Deal-era financial regulations, a move that contributed to the cancerous growth of Wall Street and the resulting global economic collapse. As Asian mercantilist nations like Japan and then China rigged their domestic markets while enjoying free access to the U.S. market, neoliberal Democrats either turned a blind eye to the foreign mercantilist assault on American manufacturing or claimed that it marked the beneficial transition from an industrial economy to a “knowledge economy.” While Congress allowed inflation to slash the minimum wage and while corporations smashed unions, neoliberals chattered about sending everybody to college so they could work in the high-wage “knowledge jobs” of the future. Finally, many (not all) neoliberals agreed with conservatives that entitlements like Social Security were too expensive, and that it was more efficient to cut benefits for the middle class in order to expand benefits for the very poor.

    The transition from New Deal liberalism to neoliberalism began with Carter, but it was not complete until the Clinton years. Clinton, like Carter, ran as a populist and was elected on the basis of his New Deal-ish “Putting People First” program, which emphasized public investment and a tough policy toward Japanese industrial mercantilism. But early in the first term, the Clinton administration was captured by neoliberals, of whom the most important was Treasury Secretary Robert Rubin. Under Rubin’s influence, Clinton sacrificed public investment to the misguided goal of balancing the budget, a dubious accomplishment made possible only by the short-lived tech bubble. And Rubin helped to wreck American manufacturing, by pursuing a strong dollar policy that helped Wall Street but hurt American exporters and encouraged American companies to transfer production for the U.S. domestic market to China and other Asian countries that deliberately undervalued their currencies to help their exports.

    By the time Barack Obama was inaugurated, the neoliberal capture of the presidential branch of the Democratic Party was complete. Instead of presiding over an administration with diverse economic views, Obama froze out progressives, except for Jared Bernstein in the vice-president’s office, and surrounded himself with neoliberal protégés of Robert Rubin like Larry Summers and Tim Geithner. The fact that Robert Rubin’s son James helped select Obama’s economic team may not be irrelevant.

    Instead of the updated Rooseveltonomics that America needs, Obama’s team offers warmed-over Rubinomics from the 1990s. Consider the priorities of the Obama administration: the environment, healthcare and education. Why these priorities, as opposed to others, like employment, high wages and manufacturing? The answer is that these three goals co-opt the activist left while fitting neatly into a neoliberal narrative that could as easily have been told in 1999 as in 2009. The story is this: New Dealers and Keynesians are wrong to think that industrial capitalism is permanently and inherently prone to self-destruction, if left to itself. Except in hundred-year disasters, the market economy is basically sound and self-correcting. Government can, however, help the market indirectly, by providing these three public goods, which, thanks to “market failures,” the private sector will not provide.

    Healthcare? New Deal liberals favored a single-payer system like Social Security and Medicare. Obama, however, says that single payer is out of the question because the U.S. is not Canada. (Evidently the New Deal America of FDR and LBJ was too “Canadian.”) The goal is not to provide universal healthcare, rather it is to provide universal health insurance, by means that, even if they include a shriveled “public option,” don’t upset the bloated American private health insurance industry.

    Education? In the 1990s, the conventional wisdom of the neoliberal Democrats held that the “jobs of the future” were “knowledge jobs.” America’s workers would sit in offices with diplomas on the wall and design new products that would be made in third-world sweatshops. We could cede the brawn work and keep the brain work. Since then, we’ve learned that brain work follows brawn work overseas. R&D, finance and insurance jobs tend to follow the factories to Asia.

    Education is also used by neoliberals to explain stagnant wages in the U.S. By claiming that American workers are insufficiently educated for the “knowledge economy,” neoliberal Democrats divert attention from the real reasons for stagnant and declining wages — the offshoring of manufacturing, the decline of labor unions, and, at the bottom of the labor market, a declining minimum wage and mass unskilled immigration. One study after another since the 1990s has refuted the theory that wage inequality results from skill-biased technical change. But the neoliberal cultists around Obama who write his economic speeches either don’t know or don’t care. Like Bill Clinton before him, Barack Obama continues to tell Americans that to get higher wages they need to go to college and improve their skills, as though there weren’t a surplus of underemployed college grads already.

    Environment? Here the differences between the New Deal Democrats and the Obama Democrats could not be wider. Their pro-industrial program did not prevent New Deal Democrats from being passionate about resource conservation and wilderness preservation. They did not hesitate to use regulations to shut down pollution. And their approach to energy was based on direct government R&D (the Manhattan Project) and direct public deployment (the TVA).

    Contrast the straightforward New Deal approaches with the energy and environment policies of Obama and the Democratic leadership, which are at once too conservative and too radical. They are too conservative, because cap and trade relies on a system of market incentives that are not only indirect and feeble but likely to create a subprime market in carbon, enriching a few green profiteers. At the same time, they are too radical, because any serious attempt to shift the U.S. economy in a green direction by hiking the costs of non-renewable energy would accelerate the transfer of U.S. industry to Asia — and with it not only industry-related “knowledge jobs” but also the manufacture of those overhyped icons of the “green economy,” solar panels and windmills.

    While we can’t go back to the New Deal of the mid-20th century in its details, we need to re-create its spirit. But short of confining them in motel rooms and making them watch newsreels about the Hoover Dam, Glass-Steagall, the TVA and the Manhattan Project, is it possible to liberate President Obama and the Democratic leadership from the cult of neoliberalism?

    This article first appeared at Salon.com

    Michael Lind is Whitehead Senior Fellow at the New America Foundation and Director of the American Infrastructure Initiative.

    Official White House Photo by Pete Souza.

  • Origins and Growth of Al Capone’s Outfit: Chicago’s First Ward Democratic Organization and its Aftermath

    Barack Obama ran for President with his headquarters in downtown Chicago. Obama’s election night victory speech was just blocks away in Chicago’s Grant Park. To historians of organized crime both locations are located in a significant place: Chicago’s old First Ward. This valuable plot of land is where Chicago’s Democratic Machine and Al Capone’s criminal organization both began. The connection between the two is of great historical significance. Why? Because the Chicago Mob is nothing but an outgrowth of Chicago’s old First Ward Democratic Organization.

    The First Ward contained not only the big office buildings of downtown Chicago but also the near south side which contained the Levee (which was America’s premier vice district for prostitution and gambling) in the early part of the twentieth century. Crime researcher Ovid Demaris explains the origins of the First Ward in the first decade of the Twentieth Century:

    The chain of command on the levee started at the top with committeeman Michael “Hinky Dink” Kenna and Alderman Bathouse John Coughlin, bosses of the First Ward, the wealthiest plot of real estate (it contains the Loop) in the Midwest. Their bagman was Ike Bloom, a ward heeler and proprietor of a busy dance hall. The next in command was Big Jim Colosimo, an Italian pimp and restaurateur, who started out as a street cleaner. When he married a madam with a pair of dollar houses, Hinky Dink made him a precinct captain in charge of getting out the Italian vote.

    By 1912, Jim Colosimo owned 200 brothels, many located in the First Ward. Colosimo is considered by the FBI to be the first head of the Chicago Mob. His base – organizing street sweepers – presaged the powerful role of public unions in Chicago nearly a century later.

    Another important First Ward Democratic precinct captain with connections to Kenna and Coughlin was Harry Guzik. Guzik, like Colosimo, was a pimp who passed his political connections on to his son, Jake. Jake Guzik, also a pimp, became the Chicago Mob’s accountant until his death in 1956. Guzik (note 1) was considered the number two man in the Chicago Mob and the financial brains behind the operation until his death in 1956.

    In 1909, Colosimo reached out for help in running his expanding empire. New York street gang leader John Torrio came to Chicago to help manage Colosimo’s empire from Colosimo’s Cafe at 2126 South Wabash Avenue at the south end of the First Ward.

    In 1919, on the eve of Prohibition, Torrio wanted the operation to expand into bootlegging. Colosimo was content with the money he was making from the existing rackets. So, Torrio had Colosimo executed. Before Colosimo was executed, Torrio had brought to Chicago a street thug he mentored in New York: Al Capone. With Colosimo, out of the way, Torrio moved the operation headquarters a few blocks away to the 2222 S. Wabash. Capone acted as the underboss of the operation.

    Torrio and Capone no longer needed to take orders from Kenna and Coughlin of the First Ward. Over time, as the Chicago Mob became wealthy, they began to tell Kenna and Coughlin how to operate. Jake Guzik became the de facto political boss of the First Ward issuing orders to Kenna and Coughlin.

    By 1925, Torrio stepped down as boss after an assassination attempt and left Chicago. Al Capone took over. The mob extended its political influence into other Chicago wards, to the surrounding suburbs of Chicago and even downstate.

    Capone’s reign only lasted until 1932, but his legacy and organization were just beginning. Robert Cooley and Hillel Levin in their monumental book When Corruption Was King explain:

    Oddly enough, far less is known about his successors and their grip on the city during the last half of the twentieth century. But that is when Chicago’s Mafia became the single most powerful organized crime family in American history. While Mob bosses knocked each other off on the East Coast, in Chicago they united into a monolithic force called the Outfit…By the Seventies, the FBI reported that Chicago’s Mob controlled all organized criminal activity west of the Mississippi – including and especially Las Vegas. Millions were skimmed from casinos like the Tropicana and the Stardust, and bundles of cash, stuffed in green army duffel bags, found their way back to the Outfit’s bosses.

    By the 1950s, the Chicago Mob realized it would be more efficient to send one of their own “made members” to City Council (Note 2). John D’Arco was a high ranking made member elected to City Council in 1951. D’Arco also became the First Ward Democratic Committeman, the boss of the precinct captains. He got caught by the FBI meeting with Sam Gianciana near Chicago’s O’Hare Airport, in 1962, and stepped down from City Council but kept his ward committeemanship until the 1990s. He was a regular visitor to Mayor Jane Byrne’s office in the late 1970s and early 1980s.

    In 1968, the Chicago Mob sent Fred Roti, one of their most effective high ranking made members, to the City Council. Roti grew up in the First Ward just blocks away from Capone headquarters. He was a precinct captain for John D’ Arco. Roti’s success on City Council surpassed John D’Arco. By 1982, the Chicago Tribune reported that Roti was Chicago’s most powerful City Council member:

    Roti’s name is always called first during council roll calls, and he revels in that privilege. His initial response gives other administration aldermen their cue as to what Roti – and, therefore, the mayor – wants. It’s often said that roll calls could stop after Roti votes – the outcome is already known. Roti, an affable fellow, controls the Chicago City Council with an iron fist.

    According to the Justice Department, Roti was an important co-conspirator in turning a large segment of Chicago’s organized labor movement into a racketeering enterprise.

    In the 1980s, criminal defense lawyer Robert Cooley wore a wire on Alderman Roti and his boss Pat Marcy. Cooley became the star witness in a series of sensational trials from an investigation titled Operation Gambat. Roti was indicted in 1990 and “was convicted of RICO conspiracy, bribery and extortion regarding the fixing of criminal cases in the Circuit Court of Cook County, including murder cases involving organized crime members or associates, and was sentenced to 48 months’ imprisonment.” John D’Arco’s son was also indicted and convicted of taking bribes. John D’Arco Jr. was the Chicago Mob’s man in Springfield, rising to the position of Assistant Majority Leader of the Illinois Senate.

    The Chicago Mob was never the same. Without Roti and Marcy, the judges could no longer be bribed into allowing the mob hitmen back on the street. The regular killings, to get people in line, stopped. The First Ward got mapped out of existence in the early 1990s. Senior FBI agent William Roemer explained the devastation to the Chicago Mob by Robert Cooley’s “Operation Gambat”:

    As a result of Gambat, Tony Accardo’s people were deeply wounded. For decades Pat Marcy and John D’Arco, Sr., has been to Accardo what Hinky Dink and Bathhouse John were to Colosimo, Capone, and Nitti. Since 1950 – some forty years – John D’ Arco had been there. They were themselves a great one-two punch for Accardo and for Greasy Thumb…

    So, the Chicago Mob has been in retreat. But, it still exists and has great access to power.

    In 1999, at Fred Roti’s funeral, his best friend on City Council Alderman Bernard Stone spoke. Alderman Stone, set the record straight in case there was any illusion of how important Fred Roti was in the history of Chicago:

    “Our skyline should say ‘Roti’ on it,” Stone said at the funeral. “If not for Fred Roti, half the buildings in the Loop would never have been built.”

    At the time of his indictment in 1990, Roti was Chairman of the City Council Buildings Committee. This is the key committee in Chicago that determines the height of buildings.

    After Fred Roti’s funeral, his body was laid to rest at the Mount Carmel Cemetery in the Chicago suburb of Hillside. Roti was buried in Section 34 of the Cemetery. Just a short walk from Roti’s casket in Section 35 of the Cemetery is Al Capone’s grave.

    The man who brought down the First Ward, FBI informant Robert Cooley, is back in the news. Days after Governor Rod Blagojevich was arrested, WLS TV reported that according to Cooley, Blagojevich was bookmaker for the Chicago Mob. WLS TV did a follow up report in which a former senior FBI agent confirmed that Cooley made bookmaking allegations about Blagovich in the 1980s. This isn’t the only mob tie concerning Blagojevich. His wife is related to the recently deceased Chicago Mob Consiglerie Alphonse Tornabene.

    Lurking in the background of the Blagojevich criminal case is a casino license that was to be auctioned off. The license was by far the most valuable asset Blagojevich had control over. Blagojevich wanted the casino built in the Chicago Mob dominated suburb of Rosemont. The Chicago Mob also wanted the casino built there. In November of 2005, Blagojevich brought in Eric Holder to give Rosemont a clean bill of health. Holder and Blagojevich had a news conference outside the Thompson Building, which is in the old First Ward.

    The mob connection extends beyond the Blagojevich case. In their drive to retain President Obama’s U.S. Senate seat, the frontrunner is Obama’s friend, Alexi Giannoulis. He is so tainted by Chicago Mob allegations that Illinois Democratic Party Chairman Mike Madigan refused to endorse him in a past race for State Treasurer.

    As the Senate race heats up, these connections between the Chicago machine and the mob could prove embarrassing at least for the man the machine has helped elevate to the White House.


    Note 1: Jake “Greasy Thumb” Guzik earned his nickname from counting stacks of money and bribing public officials.

    Note 2: In preparation for this article, a former FBI agent identified John D’ Arco Sr. as a high ranking made member of the Chicago Mob. His status was at the level of a capo in which he was allowed to run a political crew.

    Steve Bartin is a resident of Cook County and native who blogs regularly about urban affairs at http://nalert.blogspot.com. He works in Internet sales.

  • One Step for Short-term Economic Stimulus, and One Giant Leap (backward) for U.S. Energy Sustainability

    The “cash for clunkers” (or CARS) program that was widely predicted to be extended by the Congress has been, if nothing else, a clear public relations win for the Obama Administration. It may also be, at least for the short-term, a shot in the arm for the beleaguered American auto industry (including domestic dealerships of foreign car companies, like Honda and Toyota). But the program’s extension may also be bad news for anyone who was hoping that candidate Obama’s campaign promises to fix our domestic energy policy would translate into something resembling a robust make-over.

    Don’t get me wrong; I am a huge fan of President Obama. And I am generally very supportive about what the Administration is trying to do. The President’s agenda is nothing if not ambitious, or may be better described as audacious. In no particular order, President Obama is seeking to fix the environment, reform the healthcare system, overhaul banking and financial services regulations, reverse a downwardly spiraling national and global economy, repair race relations in America, and get drivers to cease texting and talking on their cell phones while driving.

    And yet, one of President Obama’s greatest strengths may also be his greatest weakness: The willingness and ability to compromise, as it is the fundamental nature of compromise that the outcome will inevitably be less than ideal. This consequence of compromise can be seen clearly in the President’s efforts to secure Congressional approval of an additional $2 billion in funding for the CARS program.

    The initial concept behind CARS was elegant in its simplicity: give owners of “gas-guzzlers” (i.e. automobiles with highly inefficient internal combustion engines) a monetary incentive to trade their fuel inefficient vehicles for highly fuel-efficient replacements. The auto industry – albeit more centered in Tokyo than Detroit on this point – clearly is producing numerous passenger vehicles capable of achieving a combined city/highway rating of 30 miles-per-gallon (mpg) or more. Yet there remain a number of registered motor vehicles in the U.S. with substantially less than 18 mpg ratings under the program (any vehicle with a mpg rating above that is not worthy of the “clunker” moniker).

    If this was the Administration’s original goal for the CARS program, the $1 billion authorization could have had a considerable impact on fuel consumption. Assuming the maximum rebate of $4,500 on every trade-in, almost a quarter of a million (222,222 to be exact) fuel-inefficient vehicles would have been voluntarily taken off America’s roads. Great idea! Triple that program funding amount to $3 billion, coupled with the same lofty goal, and two-thirds of a million fuel inefficient cars would have been swapped out for highly fuel efficient cars. If the average driver puts 12,000 miles per year on a car, and the average improvement in fuel efficiency is 12 mpg (i.e. from 18 mpg to 30 mpg) the program would save 1,000 gallons of gas per car, per year, or 666,666,000 gallons of gas annually.

    If only this purpose – to incentivize drivers to purchase only the most fuel efficient vehicles – had remained the thrust of the CARS program. However, it seems that the elegant simplicity behind the CARS concept became intertwined in the “since the government now owns GM and Chrysler don’t you think we should do something to spur domestic car sales” debate. All of a sudden, light trucks (the product type on which the Big Three hung their hats and, subsequently, on which they were hung by their collective petard) became eligible provided they are more fuel-efficient than the millions of light trucks already registered and on domestic highways. So, instead of a rising fleet of truly efficient cars we now see sales of new SUVs of all sizes and dimensions, and not just the recently introduced hybrid versions, being allowed a “cash-for-clunkers” rebate. All that is necessary is for the trade-in vehicle to qualify under CARS and the newly purchased SUV achieve a paltry 18 combined mpg.

    In other words, the concept behind the initial legislation appears to have quickly devolved from “let’s incentivize the best consumer behavior possible when it comes to fuel efficiency” to “let’s get people to buy passenger cars, SUVs, and light trucks.” The Hummer H3, for example, with an MSRP of less than $45,000 (the maximum MSRP allowed under CARS), and a combined city/highway mpg of 18, could qualify for the rebate program (hoping the irony is not lost on anyone that a vehicle, the Humvee, that was the exclusive product of a publicly owned entity, the Defense Department, ended up being the product of another publicly owned entity, GM).

    There’s no doubt that CARS was wildly successful in its public debut, so much so that the $1 billion in federal rebate funds were projected to run out within the first 30 days of the program’s roll-out. Car dealerships and automakers were as ecstatic in their praise for the program as they were vociferous in their clamor to seek the additional $2 billion in Congressional funding. However, the pace at which the CARS rebates were utilized strongly suggests that the cash-for-clunkers program would have been equally successful even if Congress had stuck to the original premise of the program: To get car owners to trade in the worst mpg offenders for the exemplars of fuel efficiency. Instead, Congress and the Administration have botched the chance to make a real, lasting difference, while spending $3 billion in the process.

    So here are the “outcomes” of CARS thus far: According to cars.com, the top ten fuel-efficient cars sold in the U.S. range from the Honda Fit (32 combined mpg) to the Toyota Prius (46 combined mpg). However, based on statistics tracked by jalopnik.com, of the top ten new vehicles purchased using CARS rebates only two, the Toyota Prius (#1 in fuel efficiency and #4 in most-purchased) and the Honda Fit (#10 in fuel efficiency and #9 in most-purchased), are on both lists (see the table below). In fact the list of the most-purchased vehicles using CARS rebates appears to be comprised of more lower-priced cars (e.g. the Chevy Cobalt and Hyundai Elantra) and cars that were already very high-volume sellers before the economic downturn (e.g. Toyota Camry and Corolla).

    Ten Most-Purchased Vehicles Using CARS Rebate*

    Ten Most Fuel-Efficient Vehicles Sold in the U.S.**

    1

    Toyota Corolla

    1

    Toyota Prius 48/45/46 mpg

    2

    Ford Focus FWD

    2

    Honda Civic Hybrid 40/45/42 mpg

    3

    Honda Civic

    3

    Smart Fortwo 33/42/36 mpg

    4

    Toyota Prius

    4

    Nissan Altima Hybrid 35/33/34 mpg

    5

    Toyota Camry

    5

    Toyota Camry Hybrid 33/34/34 mpg

    6

    Hyundai Elantra

    6

    Volkswagen Jetta TDI 30/41/34 mpg

    7

    Ford Escape FWD

    7

    Ford Escape Hybrid*** 34/31/32 mpg         

    8

    Dodge Caliber

    8

    Toyota Yaris 29/36/32 mpg

    9

    Honda Fit

    9

    MINI Cooper/Clubman 28/37/32 mpg

    10

    Chevrolet Cobalt

    10

    Honda Fit 28/35/31 mpg

    *as posted on jalopnik.com Aug. 7th

    **as posted on cars.com Aug. 7th, city/hwy/combined mpg                             

    *** also includes Mercury Mariner/Mazda Tribute Hybrid

    Inasmuch as Congress has already approved the additional $2 billion for the CARS program – without improving the fuel efficiency goals the program incentivizes – then why don’t we at least be honest about it and just add the $3 billion CARS price tag to the federal auto industry bailout. Sadly, as it stacks up now, claiming that this program is all about fuel efficiency or domestic energy policy is a sham.

    Peter Smirniotopoulos, Vice President – Development of UniDev, LLC, is based in the company’s headquarters in Bethesda, Maryland, and works throughout the U.S. He is on the faculty of the Masters in Science in Real Estate program at Johns Hopkins University. The views expressed herein are solely his own.