Category: Small Cities

  • America’s Fastest-Growing Cities Since The Recession

    It was widely reported that the Great Recession and subsequent economic malaise changed the geography of America. Suburbs, particularly in the Sun Belt, were becoming the “new slums” as people flocked back to dense core cities.

    Yet an analysis of post-2007 population trends by demographer Wendell Cox in the 111 U.S. metro areas with more than 200,000 residents reveals something both very different from the conventional wisdom and at the same time very familiar. Virtually all of the 20 that have added the most residents from 2007 to 2012 are in the Old Confederacy, the Intermountain West and suburbs of larger cities, notably in California. The lone exception to this pattern is No. 15 Portland. The bottom line: growth is still fastest in the Sun Belt, in suburban cities and lower-density, spread out municipalities.

    The No. 1 city on our list, New Orleans, fits this picture to a degree as a quintessentially Southern city, but it’s a bit of an anomaly. Its fast growth is partially a rebound effect from its massive population loss after Katrina, but is also a function of a striking economic revival that I have seen firsthand as a consultant in the area.

    Since 2007 New Orleans’ population has grown 28% to 370,000. Many are newcomers who came, at least initially, to rebuild the city.  But the city is still way below the 2002 population of 472,000, much less its high of 628,000 in 1960.

    New Orleans is one of six cities where the population of the core has grown more in total numbers than the surrounding suburbs. (The other five are New York; San Jose, Calif.; Providence, R.I.; Columbus, Ohio; and San Antonio.) This is also a product of the fact that, when the Greater New Orleans region began to recover, the return to the suburban regions, for the most part, came before that to the city.

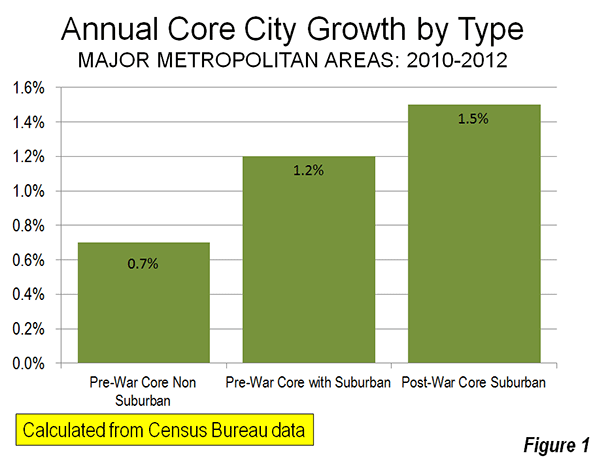
    Nothing in the data, however suggests a revival of the older, dense “legacy” cities that were typical of the late 19th century and pre-war era. Most of the fastest-growing big cities since 2007 are of the sprawling post-1945 Sun Belt variety, including Charlotte, N.C. (No. 4); Ft. Worth, Texas (No.  6); Austin, Texas, (10th); El Paso, Texas (11th); Raleigh, N.C. (12th); and Oklahoma City (18th). Some of the fastest-growers are also outside the major metropolitan areas,  such as No. 5 Bakersfield in California’s Central Valley, the North Carolina cities of Greensboro and Durham, (9th and 14th, respectively), and  Corpus Christi, Texas (16th).

    Among the big Northeast cities, the best performer is Washington (27th with 7.8% population growth) followed by Boston (71st, 2.2%). New York has managed only 0.3% population growth since 2007 (88th). Among other leading U.S. cities San Francisco’s population is up 3.3%, Los Angeles has grown 2.1%, and Chicago’s population has dropped 3.4%.

    The other somewhat surprising result is the strong performance of more purely suburban cities, that is, ones that have grown up since car ownership became nearly universal. They are not the historic cores of their regions but have developed into major employment centers with housing primarily made up of single-family residences. These include the city that has grown the second most in the U.S. since 2007: Chula Vista, a San Diego suburb close to the Mexican border, whose population expanded 17.7%. It’s followed in third place by the Los Angeles suburb of Irvine (16.3%); No. 7 Irving, Texas; and the California cities of Fremont (13th) , located just east of San Jose-Silicon Valley, and Oxnard (17th), north of Los Angeles.

    What do these results tell us? First, that Americans continue to move decisively to both lower-density, job-creating cities and to those less dense areas of major metropolitan areas particularly where single-family houses, good schools and jobs are plentiful.

    Irvine, a planned postwar city of some 230,000 which ranks as the country’s seventh-wealthiest municipality, has three jobs for every resident; roughly two in five residents work in the city. Irvine’s 16.3% growth rate since 2007 has been bolstered by a strong inflow of Asians. Once overwhelmingly white, Irvine’s population is now roughly 40% Asian and 9% Hispanic.

    Similarly, Irving, Texas, also thrived through the recession. Like Irvine this Dallas-area suburb is a major job center. Headquarters for Nokia , NEC Corporation of America, Blackberry, and Exxon Mobil, Irving’s population has soared over 13% over the past five years to 225,000.

    This contrasts with some similarly sized suburbs that boomed in the first part of the decade. North Las Vegas added 80,000 people between 2002 and 2007 but its growth slowed down considerably as the Nevada economy cratered. This extension of Las Vegas has added a relatively paltry 12,000 people since 2007. With Phoenix losing 3.2% of its population since ’07, the nearby former boomtowns of Mesa and Scottsdale have also seen net outflows of residents.

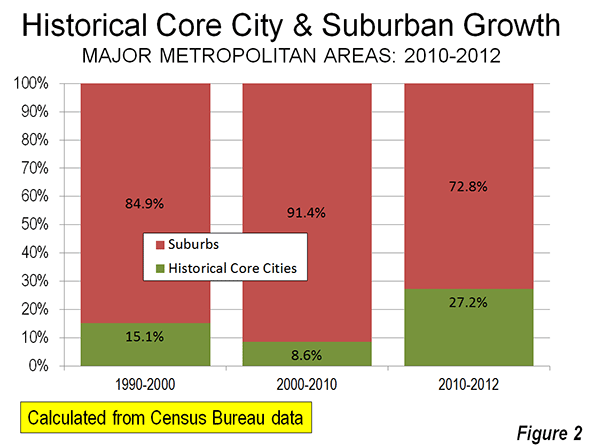
    Migration numbers for 2010 to 2012 alone hammer home that suburban areas are continuing to attract people, and that the more dense core areas do not generally perform as well. Although their growth has slowed compared to the last decade, suburban locales, with roughly three-quarters of all residents of metropolitan areas, have added many more people than their core counterparts.

    Where do we go from here? The urban future will continue to evolve in directions that contradict the prevailing conventional wisdom of a shift toward more crowded living. The continued dispersion of America’s population is evidenced by the persistent, and surprising, strength of suburban towns, as well as the low-density cities of Texas and the Plains. The key to growth in the next decade may depend largely on whether these rising municipalities can continue to create the jobs, favorable educational environment and amenities necessary to attract more newcomers in the future.

    MUNICIPALITIES OVER 200,000 IN 2012
    25 Fastest Growing 2007-2012
    POPULATION CHANGE
    RANK MUNICIPALITY 2002 2007 2012 2007-2012
    1 New Orleans, Louisiana     472,744     288,113     369,250 28.2%
    2 Chula Vista, California     194,167     214,506     252,422 17.7%
    3 Irvine, California     162,205     197,714     229,985 16.3%
    4 Charlotte, North Carolina     590,857     669,690     775,202 15.8%
    5 Bakersfield, California     259,146     312,454     358,597 14.8%
    6 Fort Worth, Texas     570,808     680,433     777,992 14.3%
    7 Irving, Texas     195,764     198,119     225,427 13.8%
    8 Laredo, Texas     189,954     215,789     244,731 13.4%
    9 Greensboro, North Carolina     231,415     245,767     277,080 12.7%
    10 Austin, Texas     684,634     749,120     842,592 12.5%
    11 El Paso, Texas     570,336     600,402     672,538 12.0%
    12 Raleigh, North Carolina     313,829     379,106     423,179 11.6%
    13 Fremont, California     205,034     199,187     221,986 11.4%
    14 Durham, North Carolina     196,432     216,943     239,358 10.3%
    15 Portland, Oregon     538,803     546,747     603,106 10.3%
    16 Corpus Christi, Texas     276,877     283,445     312,195 10.1%
    17 Oxnard, California     176,594     183,235     201,555 10.0%
    18 Oklahoma, Oklahoma     519,100     545,910     599,199 9.8%
    19 Aurora, Colorado     282,707     309,007     339,030 9.7%
    20 Denver, Colorado     561,072     578,789     634,265 9.6%
    21 Fontana, California     158,916     184,814     201,812 9.2%
    22 Fresno, California     442,987     465,669     505,882 8.6%
    23 Orlando, Florida     199,358     230,239     249,562 8.4%
    24 Colorado Springs, Colorado     376,341     399,751     431,834 8.0%
    25 Riverside, California     272,814     290,601     313,673 7.9%


    Joel Kotkin is executive editor of NewGeography.com and a distinguished presidential fellow in urban futures at Chapman University, and a member of the editorial board of the Orange County Register. He is author of The City: A Global History and The Next Hundred Million: America in 2050. His most recent study, The Rise of Postfamilialism, has been widely discussed and distributed internationally. He lives in Los Angeles, CA.

    This piece originally appeared at Forbes.com.

    New Orleans photo by Bigstock.

  • Retrofitting the Dream: Housing in the 21st Century, A New Report

    This is the introduction to "Retrofitting the Dream: Housing in the 21st Century," a new report by Joel Kotkin. To read the entire report, download the .pdf attachment below.

    In recent years a powerful current of academic, business, and political opinion has suggested the demise of the classic American dream of home ownership. The basis for this conclusion rests upon a series of demographic, economic and environmental assumptions that, it is widely suggested, make the single-family house and homeownership increasingly irrelevant for most Americans.

    These opinions — which we refer to as ‘retro-urbanist’ — gained public credence with the collapse of the housing bubble in 2007. The widespread media reports of foreclosed housing in suburban tracts, particularly in the exurban reaches of major metropolitan areas, led to widespread reports of the “death of suburbia” and the imminent rise of a new, urban-centric “generation rent.”

    Yet despite this growing “consensus” about the future of housing and home ownership, our analysis of longer-term demographic trends and consumer preferences suggests that the “dream,” although often deferred, remains relevant. We see this in the strength of suburbs, as well as in the growth of the post-war “suburbanized cities” that generally have been the fastest growing regions of the country. These trends are notable in the three key demographic groups that will largely define the American future: aging boomers, immigrants, and the emerging millennial generation.

    This does not mean that suburbia, or home construction patterns, will not change in the coming decades. Higher energy prices, for example, could necessitate shorter commutes, even with automobile fuel efficiency improvements. The emerging concentration of employment centers could help bring this about by improving job housing balance. There is a need to fully make use of the high speed digital communication that can promote both dispersed and home-based work.

    For these and other reasons McKinsey & Company, among others, has noted that meeting environmental challenges does not require the kind of radical alteration of lifestyles and aspirations so widely promoted in the media, academia, and among some real estate interests. Equally important, there has been little consideration of the profound economic and social benefits of both home ownership and low to medium density living. These include, on the economic side, the huge impact on employment from home construction and the ancillary industries associated with household upkeep and improvement.

    More important still may be the social benefits. Most serious studies have shown that lower-density, homeowner-oriented communities are more socially cohesive in terms of volunteerism, neighborly relations, and church attendance, than denser, renter-oriented communities. Suburban and lower density urban neighborhoods are particularly critical for the growth of families and the raising of children, an increasingly important factor in a ‘post-familial’ era of plunging birthrates.

    To be sure, housing has been changing rapidly from the model developed in the 50s, and this process will continue over the next generation. Houses today are more energy efficient, and look to accommodate home-based work, as well as extended, multigenerational families. Similarly, the suburbs and low/mid density urban communities are already far more diverse, in terms of ethnicity and age profile, than the homogeneous communities often portrayed in media and academic accounts. This trend is also likely to accelerate.

    Ultimately, we believe that the dream is not at all dead, but is simply evolving. America’s tradition of property ownership, privacy, and the primacy of the family has constituted a critical aspect of our society since before the nation’s founding. It will need to remain so in the decades ahead if the country is to prove true to the aspirations of its people and the sustainability of its demographics.

    Joel Kotkin is executive editor of NewGeography.com and a distinguished presidential fellow in urban futures at Chapman University, and a member of the editorial board of the Orange County Register. He is author of The City: A Global History and The Next Hundred Million: America in 2050. His most recent study, The Rise of Postfamilialism, has been widely discussed and distributed internationally. He lives in Los Angeles, CA.

  • Market Surge Confirms Preference for Homeowning

    Ever since the housing bubble burst in 2007, retro-urbanists, such as Richard Florida, have taken aim at homeownership itself, and its “long-privileged place” at the center of the U.S. economy. If anything, he suggested, the government would be better off encouraging “renting, not buying.”

    Similar thinking has gained currency with some high-rise (or multi-unit) builders, speculators and Wall Street financiers, who would profit by keeping Americans permanent renters, with encouragement from former Morgan Stanley financial analyst Oliver Chang, who predicted we were headed toward a “rentership society.”

    Some support comes from research suggesting that higher ownership rates actually create unemployment. A study by the proausterity Peterson Institute for International Economics, cited recently both by Florida and the New York Times’ Floyd Norris, lays out an econometric case against homeownership.

    The authors justified their findings by pointing to larger unemployment-rate changes from 1950-2010 in states, mostly in the South, such as Alabama, Georgia, Mississippi, South Carolina and West Virginia, compared with California, North Dakota, Oregon, Washington and Wisconsin. They then noted that, in the states with the larger unemployment rate increases, homeownership had increased more. Hence, the connection between higher homeownership and higher unemployment rates.

    This analysis is staggeringly ahistorical. It fails to correct for the massive labor market changes that have occurred in the Southern states, as the agricultural and domestic employment common in 1950 has largely disappeared. The analysis begins with a year in which three of the states cited to prove that lower homeownership is associated with lower unemployment had unusually high unemployment in 1950 (California was No. 1, Oregon, No. 4, and Washington, No. 6); unemployment in these three West Coast states averaged nearly double that of the Southern examples.

    Another ahistorical implication is that that the South experienced a huge increase in homeownership since 1950, as economically disadvantaged African-Americans began to buy their residences. An analysis by demographer Wendell Cox indicates that, even as labor markets were being radically altered, per capita incomes in relatively underdeveloped Alabama, Georgia, Mississippi, South Carolina and West Virginia rose during 1950-2010 at more than double the rate experienced in California, North Dakota, Oregon, Washington and Wisconsin (more than 140 percent, adjusted for inflation, compared with approximately 65 percent).

    The Peterson thesis is also undermined by a close examination of county homeownership and unemployment rates, which finds, generally, that large counties with higher rates of homeownership have lower unemployment rates. For example, among the nation’s approximately 260 counties with more than 250,000 residents, those with homeownership rates above 70 percent have average unemployment rates of 8.1 percent. Among the counties with homeownership rates below 50 percent, unemployment rates average 9.6 percent. This is exactly the opposite relationship that would be expected from the Peterson Institute research.

    Finally, many large urban counties with the lowest homeownership rates – Los Angeles, Kings County (Brooklyn), New York County (Manhattan), Queens, Cook County (Chicago) and Philadelphia – also suffer well-above-average levels of unemployment and high levels of poverty. In contrast, suburban counties with high homeownership rates, like Nassau County, N.Y., Chester County (in the Philadelphia area), or Fairfax County, Va., boast considerably lower unemployment than their urban neighbors, and higher per-capita incomes. Most of the cities with the highest ownership rates, like Fort Worth and Austin, Texas, Indianapolis, Denver and Columbus, Ohio, all did very well in the most recent Forbes “Best Cities for Jobs” study.

    It is also alleged that countries with high ownership rates do worse than those with lower ones. And to be sure, troubled countries like Portugal and Spain have high levels of homeownership, while Germany, Sweden and Denmark have somewhat lower ones. Yet, many successful countries – Taiwan, Singapore, Norway, Australia, Canada and Israel – actually do quite well with higher ownership rates than in America.

    Dream that refuses to die.

    From a historic perspective, the present U.S. homeownership rate, 65.4 percent, does not represent a structural decline from the middle 2000s, as is often argued, but remains consistent with the virtual equilibrium achieved over the past half century. As recently as 1940, only 40 percent of Americans owned their homes, a share that reached 60 percent by 1960s. Since then, it has remained fairly stable. The modest decline from the middle 2000s was from an artificially high level that resulted from the virtual suspension of mortgage credit standards – egged on by Wall Street and government agencies – which was followed by a deep recession and a weak recovery.

    The housing bust changed the market, but not because of some fundamental shift in buyer preferences, as is sometimes alleged. Indeed, the recent spike in home sales confirms that Americans continue to aspire to homeownership. Research at the Woodrow Wilson Center indicated that 91 percent of respondents identified it as essential to the American Dream, and most favored steering government policy to spur homeownership.

    Much has been written about how the under-30 population is either living at home or cannot buy a house. Yet, surveys by generational chroniclers Morley Winograd and Mike Hais found that a full 82 percent of adult millennials surveyed said it was “important” to own their own home, which rose to 90 percent among married millennials. Another survey, this one by TD Bank, found that 84 percent of renters ages 18-34 intend to purchase a home in the future.

    Homeownership achieves almost cultish status among immigrants, who account for some 40 percent of all new owner households over the past decade. Among Asians who entered the country before 1974, a remarkable 81 percent own their home, while Latino homeownership is projected to rise to 61 percent by 2020.

    Societal advantages of owning

    Critics of homeownership often point out that renters have far more flexibility to move; that’s true and important particularly for people in their 20s. But, as people age, get married and, especially, have children, they seek to become involved in their communities on a more permanent basis. Pundits and economists often fail to recognize that people are more than simply profit-maximization machines ready to cross the country for an income increase of a few thousand dollars; they also seek out friends, stable neighbors, familial comfort, community and privacy.

    Homeowners reap the financial gains of any appreciation in the value of their property, so they tend to spend more time and money maintaining their residence, which also contributes to the overall quality of the surrounding community. The right to pass property to an heir or to another person also provides motivation for proper maintenance.

    Given their stake, homeowners participate in elections much more frequently than renters. One study found that 77 percent of homeowners had, at some point, voted in local elections, compared with 52 percent of renters. The study also found a greater awareness of the political process among homeowners. About 38 percent of homeowners knew the name of their local school board representative, compared with 20 percent of renters. The study also showed a higher incidence of church attendance among homeowners.

    People who own their homes also tend to volunteer more in their community, notes the National Association of Realtors. This applies to the owners of both expensive and modest properties. One 2011 Georgetown study suggests that homeownership increases volunteering hours by 22 percent.

    Perhaps the largest social benefits relate to children. Owners remain in their homes longer than do renters, providing a degree of stability valuable for children. Research published by Habitat for Humanity identifies a number of other advantages for children associated with homeownership versus renting, ranging from higher academic achievement, fewer behavioral problems and lower incidence of teenage pregnancy.

    ‘A share in their land’

    Even before the American Revolution, the notion of ownership, usually of a farmstead, was a critical lure. Even after the yeoman utopia of the early 19th century faded, Americans continued to yearn for their own homes, something that led them in two great waves, first in the 1920s and again in the 1950s and 1960s, to the suburban periphery.

    In contrast to today’s progressives, many traditional liberals embraced the old American ideal of dispersed land ownership. “A nation of homeowners,” President Franklin D. Roosevelt believed, “of people who own a real share in their land, is unconquerable.”

    Legislation under Roosevelt and successor presidents supported this ideal. More than a response to the market, governments embraced homeownership as a positive societal and economic good for the majority of Americans. This policy – brilliantly exploited by entrepreneurs – worked for both people and the economy. Almost half of suburban housing, notes historian Alan Wolfe, depended on some form of federal financing.

    Road to serfdom?

    The suggestion that we need to abandon what the New York Times denounces as the “dogma on owning a home” has grown deeply entrenched among retro-urbanists. Rather than facilitate the broad dispersion of property ownership across economic classes, the new orthodoxy suggests we would be better off as a nation of renters, living cheek-to-jowl in apartments. This works to the advantage of the Wall Streeters and other investors, who profit from our paying off their mortgages rather than our own. The assault on homeownership also pleases some advocates of austerity, such as Pete Peterson, who would like to eliminate the mortgage interest deduction as a way to raise revenue at the expense of the middle class.

    Turning against homeownership undermines the very promise of American life and the culture of independence critical to our identity as a people. Housing accounts for about two-thirds of a family’s wealth and the vast majority of the property owned by middle- and working-class households. The house represents for the middle class, devastated by the weak recovery, both a chance to make a long-term investment as well as a place to raise a family; a Wall Street portfolio, for all but the very affluent, who can afford the best advice, provides no reasonable alternative.

    We have to consider what kind society we wish to have. The nomadic model now in fashion suggests Americans should simply move from place to place, untethered to any one spot, seeking personal fulfillment and the best financial deal for themselves. Such a model fits with current planning dogma and facilitates a source of profit for some, but undermines the dispersion of property that can sustain our society, and our families, over the long run.

    Joel Kotkin is executive editor of NewGeography.com and a distinguished presidential fellow in urban futures at Chapman University, and a member of the editorial board of the Orange County Register. He is author of The City: A Global History and The Next Hundred Million: America in 2050. His most recent study, The Rise of Postfamilialism, has been widely discussed and distributed internationally. He lives in Los Angeles, CA.

    This piece originally appeared in the Orange County Register.

    Home illustration by Bigstock.
    Update: The Pete Peterson referred to here is not the Pete Peterson running for office in California.

  • The Cities That Are Stealing Finance Jobs From Wall Street

    Over the past 60 years, financial services’ share of the economy has exploded from 2.5% to 8.5% of GDP. Even if you believe, as we do, that financialization is not a healthy trend, the sector boasts a high number of relatively well-paid jobs that most cities would welcome.

    Yet our list of the fastest-growing finance economies is a surprising one that includes many “second-tier” cities that most would not associate with banking. To identify the cities making the biggest gains, we ranked metropolitan statistical areas’ employment growth in the sector over the long-term (2001-12), mid-term (2007-12) and the last two years, as well as momentum.

    Best Cities for Jobs in Finance Industries

    New High-Fliers

    Tops on our list among the 66 largest metro areas is Richmond, Va., where financial sector employment has grown an impressive 12% since 2009. This reflects the presence of large banks such as Capital One Financial , the area’s largest private employer with 10,900 jobs, and SunTrust Banks , which employs 4,400. The insurer Genworth Financial is based in Richmond, and Wells Fargo and Bank of America also have sizable operations there. Along with the Northern Virginia metropolitan statistical area (an area encompassing the state’s suburbs of Washington, D.C., including Fairfax, Arlington, Loudoun and Prince William counties), which is No. 7 on our list, the Old Dominion is quietly becoming a major financial power.

    In once-gritty Pittsburgh, which places second on our list, financial services is now the largest contributor to the regional GDP, according to the Allegheny Conference. Long seen as a backwater, the area has begun to lure the kind of highly trained workers used by financial firms, leading Rust Belt analyst Jim Russell to joke, “Pittsburgh is becoming the new Portland.” Financial employment there has grown nearly 7% since 2009. The strongly reviving local economy spans everything from energy to medical technology.

    Like Pittsburgh, some of the areas doing well in financial services are also thriving generally. These include such Texas high-fliers as No. 3 Ft. Worth-Arlington, where financial services employment has expanded over 12% since 2007, as well as No. 4 San Antonio-New Braunfels. And it is not real estate that is driving this boom—in Fort Worth, for example, the “real estate and rental and leasing” sub-sector of financial services shed jobs over the last five years while the “finance and insurance” subsector expanded almost 20%.

    Some metro areas that aren’t exactly setting the world on fire are scoring in the financial job sweepstakes. Jacksonville, Fla., ranks fifth on our list and St. Louis, MO-IL ranks eighth. In St. Louis, financial sector employment is up 6.4% since 2007 by our count, and the number of securities industry jobs has increased 85% to 12,000 over that span, according to the Wall Street Journal.

    What’s Driving Dispersion of Financial Services?

    The largest traditional financial centers appear to be losing their edge. New York, home to by far the largest banking sector with 436,000 jobs, places a meager 52nd on our list of the cities winning the most new jobs in the sector. Big money may still be minted in Gotham, but jobs are not. Since 2007 financial employment in the Big Apple is down 7.4%.

    The next four biggest financial centers are also doing poorly. San Francisco-San Mateo ranks 37th – remarkably poor given that San Francisco placed first overall on our 2013 list of The Best Cities For Jobs. Meanwhile Boston-Cambridge-Quincy ranks 44th (despite notching a strong 17th place ranking on our overall list), Los Angeles-Long Beach is 47th, and Chicago-Joliet-Naperville is 57th.

    So what gives here? A key factor is cost-cutting. As firms look to move back office and some sales functions to less expensive locales, the traditional financial centers are losing out. Between 2007 and 2012, New York, Boston, Los Angeles, Chicago and San Francisco lost a combined 40,000 finance jobs.

    In addition to lower rents in the cities that rank highly on our list, workers come cheaper, too: the average annual salary for securities industry jobs in St. Louis is $102,000, according to the Wall Street Journal, compared with $343,000 in New York.

    This trend is not just limited to the high-profile investment banks and brokerages. Insurance, the quieter and tamer part of the financial services sector (it has roughly the same number of jobs today as it did in 2001 and 2007), has seen an exodus of jobs into these lower-cost regional markets as well. Illinois-based insurance giant State Farm, for example, recently signed mega-leases in Dallas, Phoenix and Atlanta.

    Manufacturing And Energy Drive Changes

    The manufacturing revival in the Rust Belt and the Midwest is creating financial sector jobs in midsized cities (those with overall employment totaling 150,000 to 450,000).  Tops on that list is Ann Arbor, Mich., followed by Green Bay, Wisc., No. 16 Grand-Rapids-Wyoming, Mich., and No. 19 Madison, Wisc. Among small cities, Owensboro, Ky., ranks first, followed by No. 3 Kankakee-Bradley, Ill., No. 5 Clarksville, Tenn.-Ky., No. 11 Bloomington-Normal, Ill., and No. 13 Michigan City-La Porte, Ind. With low commercial and industrial market costs and available workforces, these regions could prove attractive to manufacturers re-shoring U.S. operations.

    The top of the financial services rankings for midsized and small cities is also liberally sprinkled with places where hot energy economies are driving employment in all sectors. The midsized list features Bakersfield-Delano, Calif., in third place, the Texas towns of El Paso and McAllen-Edinburg-Mission in fifth and ninth place, respectively, and No. 10 Lafayette, La. Our small cities ranking includes the Texas towns of Odessa (2nd), Midland (fourth) and Sherman-Denison (10th), and Cheyenne, Wyo. (14th). More economic activity will continue to flow to these regions both as they grow and as their suppliers move closer to reduce costs.

    What The Future Holds

    Historically financial services clustered in big cities, but increasingly cost is leading financial institutions to focus on smaller metropolitan areas. With the connectivity of the Internet and growth of educated workforces in many smaller metros, it has become increasingly possible for financial firms to locate many key functions outside of the traditional money centers.

    Some places can boast advantages beyond just lower costs. Jacksonville, and Miami-Kendall (No. 13 on our big cities list) benefit from the huge demand for financial advisers in Florida. The Sunshine State ranks fourth in the number of financial advisors, and this seems likely to grow as at least some of the expanding ranks of down-shifting boomers — some with decent nest eggs– head down south to retire or start second careers. This demographic trend could also benefit Phoenix, which already hosts substantial operations of Bank of America, JPMorgan Chase and Wells Fargo.

    Perhaps no low-cost metro area has greater long-term advantages than Salt Lake City, 12th on our list. The unique linguistics skills of the largely Mormon workforce have attracted big financial firms such as Goldman Sachs, who need people capable of conversing in Lithuanian, Chinese or Tagalog. Salt Lake City, with 1,400 employees, is the investment bank’s sixth largest location in the world.

    “We consider Salt Lake a high leverage location,” notes Goldman managing director David W. Lang. “There’s a huge cost differential and you have a huge talent-rich environment.”

    As we saw in manufacturing and information sectors, the financial services industry appears to be undergoing a profound geographic shift. Once identified largely with such storied locales as Wall Street, Chicago’s LaSalle Street or San Francisco’s Montgomery, the financial sector — like much of the economy — is dispersing, perhaps even more rapidly. Over time, this could accelerate the process of economic decentralization that has been occurring, fairly steadily, for the better part of a half century.

    Best Cities for Jobs in Finance Industries

    Joel Kotkin is executive editor of NewGeography.com and a distinguished presidential fellow in urban futures at Chapman University, and a member of the editorial board of the Orange County Register. He is author of The City: A Global History and The Next Hundred Million: America in 2050. His most recent study, The Rise of Postfamilialism, has been widely discussed and distributed internationally. He lives in Los Angeles, CA.

    Michael Shires, Ph.D. is a professor at Pepperdine University School of Public Policy.

    This piece originally appeared at Forbes.com.

    Downtown Richmond photo by CoredesatChikai.

  • Addressing Housing Affordability Using Cooperatives

    Our country is six years into the Great Recession, the biggest economic downturn since the Great Depression. It’s been replete with reports of home foreclosures, collapsing commuter towns, and young people struggling to become home owners. The term “generation rent” is often used in the media to describe the struggles of aspiring young people.  

    This is really a problem of upward mobility, and  how little the political system has responded to this problems of “generation rent” and those who have lost their homes. The current lack of action can be contrasted with the two very different periods in our economic history – the Roaring Twenties and the Great Depression.

    When discussing home ownership, many often bring up the efforts of Franklin Delano Roosevelt during the Great Depression. FDR called a nation of homeowners “unconquerable.”  But his administration really built on the ideas of previous administrations. Herbert Hoover, while serving as Warren Harding and Calvin Coolidge’s Secretary of Commerce, lent his support the “Own Your Own Home Campaign” of the Federal National Mortgage Association. This campaign touted the benefits of home ownership to the American people. And when Hoover became president, he created the Federal Home Loan Bank Board which chartered and supervised federal savings and loan institutions and created Federal Home Loan Banks to lend money to finance home mortgages. The purpose of this bank was to make homeownership cheaper for lower income people. It also represented a portion of Hoover’s efforts to fight the depression, and those efforts often went unrecognized by the American people both then and now. Hoover said home ownership could "change the very physical, mental and moral fiber of one’s own children." 

    After being elected president, Roosevelt created the Federal Housing Administration which insured homes made by banks and other lenders. The agency made it possible for people to pay for homes over three decades, before this period most homes were paid for through a three to five year loans. This program, followed up by Harry Truman’s support of veteran’s home loans and the home mortgage interest deduction, helped turn a nation of urban tenement dwellers into a nation of suburban home owners. Today, the federal government spends billions in subsides to ensure people have the opportunity to own their own homes. 

    Urbanist Richard Florida discusses the issue of home ownership in the 2010 book The Great Reset. In his interesting but misguided book, he correctly points out that too many people attained loans in the housing bubble and that high rates of homeownership hobble the labor market, as owning a home makes it harder for the job seeker to move. He also faults the Obama Administration for trying to do too much to prop up the mortgage market and recommends that the government quit supporting home ownership and start supporting renting to a greater extent. He said Fannie Mae has already taken steps in this direction by allowing people who experienced foreclosure to rent their houses. 

    But Florida is overstating the importance of renting in the lives of the American people, as we have a strong heritage as an upwardly mobile, ownership society that stretches back to the homesteading legislation pushed by Thomas Jefferson and Abraham Lincoln. But there’s no doubting that we’re a more mobile society than in the homesteading days. While FDR built on the work of his Republican predecessors, today’s leaders also have a template in the cooperative housing movement. According to the National Association of Housing Cooperatives, cooperative housing is defined as when “people join together on a democratic basis to own and control the housing or community facilities where they live.” Each month those who live in a housing cooperative pay their share of the expenses while sharing the benefits of the cooperative. According to the NAHC, 1.2 million families live in cooperative housing in the United States.

    What if we could create more forms of cooperative housing to make sure families have the opportunity to own a home and at the same time have a certain amount of mobility? Could a new Cooperative Housing Authority, with funding from Fannie Mae, buy up foreclosed houses and charge a monthly below market rate to a family? All such houses could be considered a part of the CHA and the family in the house would share in the profits of the authority. If and when the family moves, they’ll be entitled to those profits which could be used for rent or a down payment on a house. Such a program would help commuter towns who are suffering from high gas prices and foreclosures. 

    But a Cooperative Housing Authority would also be a conduit for affordable housing in America’s big cities and the surrounding suburbs, as the added supply of new housing forces the cost down. This would be an asset to certain cities where the supply of affordable housing is dwindling due to gentrification. Like most cooperative housing, the housing could take various forms: condos, townhomes and single family homes. I would suspect single family homes would be the most popular because they are the preference of most Americans. 

    A Federal Community Land Trust could be along with a CHA another way to deal with affordable  housing shortages. Like any land trust, it could add civic buildings, commercial spaces and community assets to the areas where the housing exits. This would ensure mixed/use type neighborhoods where residents would have access to shopping and civic life nearby. 

    Returning to FDR’s administration, during the 1930s the government constructed what was called garden suburbs outside of major cities: Greenbelt, Maryland; Greenhills, Ohio; and Greendale, Wisconsin. The garden suburbs were intended to house rural people who were migrating to the city as well as poor urban workers. The project was a two way street, as the government provided the road grid and cheap credit for the suburbs while aspiring families provided the mortgage payments.  These garden suburbs – designed to be suburban with some green (trees and parks) – provided a template for the mass automobile suburbanization that occurred in the 1950s.

    Of course, urbanists have never quit critiquing this suburban development model since it emerged. Like many in the city planning world, Lewis Mumford was horrified at the way suburbanization played out after World War II:
    "The planners of the New Towns seem to me to have over-reacted against nineteenth-century congestion and to have produced a sprawl that is not only wasteful but–what is more important–obstructive to social life."
    Mumford advocated the regional city – a city that included an urban core surrounded by well-planned suburbs, as he also rejected the densely packed cities of the decades before the war.     

    Could a FCLT and CHA work to create family friendly suburbs with mixed use development, and in turn save families money on energy and at the same time spare the environment more greenhouse gas pollution? I think that it could, and if these developments were to become a reality, Lewis Mumford’s vision of a regional city might look like a reality. 

    Jason Sibert is a freelance writer who has lived in the St. Louis Metro Area since the late 90s. He worked for the Suburban Journals for a decade and his work has appeared in various publications over the last four years.

    Chicago housing cooperative photo by Jennifer D. Ames.

  • Texas Suburbs Lead Population Growth

    The US Census Bureau has reported that eight of the fifteen 2011-2012 fastest-growing municipalities with at least 50,000 population were in Texas. Three of them were in the Austin metropolitan area. San Marcos, south of Austin, grew the fastest in the nation at 4.9 percent. Cedar Park, located in Austin’s northern suburbs, ranked fourth in growth at 4.7 percent while Georgetown, also north of Austin grew 4.2 percent and ranked seventh. Houston suburb Conroe placed 10th adding 4.0 percent to its population. Dallas-Fort Worth suburbs McKinney and Frisco placed 11th and 12th. The other two Texas municipalities ranking high were outside the major metropolitan areas, Midland (third) and Odessa (13th).

    Growth Outside Texas

    South Jordan, located in the southern suburbs of the Salt Lake City metropolitan area was the second fastest-growing municipality, at 4.9 percent. Atlanta suburb Alpharetta grew 4.4 percent and ranked sixth. The largest municipality among the fastest-growing was Irvine, an Orange County suburb in the Los Angeles metropolitan area, which grew 4.2 percent to a population of 230,000. Buckeye, a suburb on the western periphery of the Phoenix metropolitan area placed ninth, growing 4.1 percent.

    Among the above 11 fastest-growing suburbs in major metropolitan areas, all are either near the periphery of the urban area or beyond the principal urban area. This illustrates the historic tendency of the fastest-growing city sectors to be located on (or beyond) their fringes. This was also strongly evident in the 2000 to 2010 census data, which showed 94 percent of major metropolitan area growth to be 10 miles or more from the urban cores.

    Other fast growers were not in major metropolitan areas, including Midland, Texas, Odessa, Texas, Auburn, Alabama and Manhattan, Kansas. Clarksville, Tennessee grew fifth-fastest. Clarksville is the core city of the second fastest-growing metropolitan area in the nation, just north of Nashville.

    First Census Bureau Municipal Estimates Since 2010

    These were the first reliable municipality (sub-county) population estimates produced by the Census Bureau since the 2010 census. The 2011 municipality estimates were virtually meaningless, since they were simply percentage allocation of county growth to municipalities based upon their share of the 2010 population.

    Growth in the Major Metropolitan Core Cities

    Nonetheless, over the past two years the greatest historical core municipality growth has been in those with the most suburban (Figure 1) land use characteristics. (See Suburbanized Core Cities for discussion of how “Historical Core Cities” are defined).

    Pre-War & Non Suburban Core Cities: The least suburban core cities, those with little postwar suburban development, grew 0.7 percent between 2010 and 2012. The strongest growth in this category was in Washington, which added 2.2 percent annually. In reaching a population of 634,000, Washington passed nearby Baltimore for the first time in its history. New York added the largest number of people in the category at 162,000.

    Pre-War and Suburban Core Cities: The Pre-War Core cities with large tracts of post-war suburban development grew at a 1.2 percent annual rate (Note 1). In this category, New Orleans grew the fastest, at an annual rate of 3.2 percent, as it continues to recover from Hurricane Katrina. Denver also grew strongly, at an annual rate of 2.5 percent.

    Post-War & Suburban Core Cities: These core cities, none of which had strong urban cores before World War II and which are virtually all suburban, grew at an annual rate of 1.5 percent. Austin, which is at the core of the fastest-growing major metropolitan area in the United States, grew the fastest in this category, at 2.9 percent.

    Metropolitan, Core City and Suburban Trends

    The estimates also indicate that the suburban population boom that accompanied the housing bubble has run its course. During the 2000s, the share of major metropolitan area (over 1 million population) growth in historical core municipalities fell to approximately one-half the rate of the 1990s. That picked up in the late 2000s as housing construction came to a near standstill and the slower suburban growth rates that have continued through to 2012.

    In a few metropolitan areas, historical core municipalities attracted the majority of the population growth. The leader in this regard was Providence, with 75 percent of its metropolitan growth, which was miniscule. New Orleans captured nearly 2/3 of the growth in its metropolitan area, while New York accounted for 61 percent of its metropolitan area growth. San Antonio, San Jose, and Columbus also attracted more than one half of their metropolitan area growth, though the high share of core-city growth in San Jose and San Antonio was reflective of their high population shares (Table 1).

    Between 2000 and 2012, historical core municipalities accounted for 27.2 percent of the growth in major metropolitan areas (Figure 2). This is slightly more than their 26.4 percent of the population in 2010. It would be a mistake to interpret this as presaging the long predicted "return to the city." It would take a continuation of these growth rates for nearly 500 years for historical core municipality populations to struggle to 30 percent of the major metropolitan area population. At the same time, there have been recent indications of even more dispersion, as major metropolitan areas lost nearly two million domestic migrants to smaller areas between 2000 and 2011, according to Census Bureau data.

    Further, the trends in domestic migration indicate that people continue to move to the suburbs from elsewhere, while moving away from the core counties (migration data is not available below the county level). Overall, the core counties of major metropolitan areas lost 167,000 domestic migrants, while the suburban counties added 286,000 (Note 2).

    The domestic migration losses in some core counties were substantial. In the five counties that constitute New York, there was a loss of 139,000 domestic migrants (there was also a loss of 114,000 domestic migrants in the suburbs). Los Angeles County lost 111,000 domestic migrants, while Chicago’s Cook County lost 74,000. The largest gainers were in Austin (Travis County: 36,000), Atlanta (Fulton County: 32,000) and San Antonio (30,000). Core counties continued to attract most international migration, adding 757,000, compared to 589,000 in the suburban counties (Table 2).

    The Future?

    It seems apparent that the nation’s growth continues to be in a transitional period. Should a more normal and vibrant economy replace the current malaise, it seems likely that suburban growth will be renewed. That would not, however, preclude a continuation of the recent smaller inner-core population growth in the increasingly safer and more attractive downtown areas.

    Table 1
    Metropolitan and Historical Core CityPopulation: 2010-2012
    Metroplitan Area Metropolitan Area Change Historical Core City(s) Change Share of Growth
    Atlanta, GA        5,457,831         171,099         443,775        23,496 13.7%
    Austin, TX        1,834,303         118,017         842,592        51,955 44.0%
    Baltimore, MD        2,753,149           42,660         621,342            381 0.9%
    Birmingham, AL        1,136,650             8,600         212,038           (250) -2.9%
    Boston, MA-NH        4,640,802           88,400         636,479        18,885 21.4%
    Buffalo, NY        1,134,210            (1,301)         259,384         (1,926)
    Charlotte, NC-SC        2,296,569           79,534         809,798        21,221 26.7%
    Chicago, IL-IN-WI        9,522,434           61,329       2,714,856        19,258 31.4%
    Cincinnati, OH-KY-IN        2,128,603           14,023         296,550           (400) -2.9%
    Cleveland, OH        2,063,535          (13,705)         390,928         (5,886)
    Columbus, OH        1,944,002           42,037         809,798        21,221 50.5%
    Dallas-Fort Worth, TX        6,700,991         274,781       1,241,162        43,329 15.8%
    Denver, CO        2,645,209         101,731         634,265        34,241 33.7%
    Detroit,  MI        4,292,060            (4,187)         701,475       (12,302)
    Grand Rapids, MI        1,005,648           16,710         190,411          2,371 14.2%
    Hartford, CT        1,214,400             2,016         124,893            118 5.9%
    Houston, TX        6,177,035         256,579       2,160,821        63,604 24.8%
    Indianapolis. IN        1,928,982           41,105         834,852        14,410 35.1%
    Jacksonville, FL        1,377,850           32,254         836,507        14,723 45.6%
    Kansas City, MO-KS        2,038,724           29,386         464,310          4,523 15.4%
    Las Vegas, NV        2,000,759           49,490         596,424        12,637 25.5%
    Los Angeles, CA       13,052,921         224,079       3,857,799        65,172 29.1%
    Louisville, KY-IN        1,251,351           15,643         605,110          7,774 49.7%
    Memphis, TN-MS-AR        1,341,690           16,861         655,155          8,266 49.0%
    Miami, FL        5,762,717         198,060         413,892        14,384 7.3%
    Milwaukee,WI        1,566,981           11,073         598,916          4,176 37.7%
    Minneapolis-St. Paul, MN-WI        3,422,264           73,405         683,650        16,004 21.8%
    Nashville, TN        1,726,693           55,803         624,496        20,969 37.6%
    New Orleans. LA        1,227,096           37,233         369,250        25,421 68.3%
    New York, NY-NJ-PA       19,831,858         264,451       8,336,697      161,561 61.1%
    Oklahoma City, OK        1,296,565           43,573         599,199        19,196 44.1%
    Orlando, FL        2,223,674           89,263         249,562        11,258 12.6%
    Philadelphia, PA-NJ-DE-MD        6,018,800           53,459       1,547,607        21,601 40.4%
    Phoenix, AZ        4,329,534         136,647       1,488,750        41,198 30.1%
    Pittsburgh, PA        2,360,733             4,448         306,211            509 11.4%
    Portland, OR-WA        2,289,800           63,791         603,106        19,328 30.3%
    Providence, RI-MA        1,601,374               522         178,432            396 75.9%
    Raleigh, NC        1,188,564           58,074         423,179        19,232 33.1%
    Richmond, VA        1,231,980           23,879         210,309          6,072 25.4%
    Riverside-San Bernardino, CA        4,350,096         125,245         213,295          3,343 2.7%
    Rochester, NY        1,082,284             2,613         210,532              20 0.8%
    Sacramento, CA        2,196,482           47,355         475,516          9,028 19.1%
    St. Louis,, MO-IL        2,795,794             8,099         318,172         (1,122) -13.9%
    Salt Lake City, UT        1,123,712           35,839         189,314          2,871 8.0%
    San Antonio, TX        2,234,003           91,495       1,382,951        55,346 60.5%
    San Diego, CA        3,177,063           81,755       1,338,348        36,727 44.9%
    San Francisco-Oakland, CA        4,455,560         120,169       1,226,603        30,649 25.5%
    San Jose, CA        1,894,388           57,477         982,765        30,203 52.5%
    Seattle, WA        3,552,157         112,348         634,535        25,875 23.0%
    Tampa-St. Petersburg, FL        2,842,878           59,635         347,645        11,936 20.0%
    Virginia Beach-Norfolk, VA-NC        1,699,925           23,105         245,782          2,979 12.9%
    Washington, DC-VA-MD-WV        5,860,342         224,110         632,323        30,600 13.7%
    Total     173,283,025       3,770,067     45,771,761    1,026,581 27.2%
    Calculated from US Census Bureau data
    Table 2
    Migration: Major Metropolitan Areas
    Net Domestic Migration Net International Migration
    Metroplitan Area Core County(s) Suburban Counties Core County(s) Suburban Counties
    Atlanta, GA             32,368             4,672                8,122             31,891
    Austin, TX             36,045           30,339                9,536              2,161
    Baltimore, MD             (9,476)             9,895                4,282             14,336
    Birmingham, AL             (6,365)             2,141                1,709              1,119
    Boston, MA-NH             (2,596)             3,109              14,543             36,407
    Buffalo, NY             (4,920)            (1,473)                4,930                 440
    Charlotte, NC-SC             20,354           16,936                9,535              2,732
    Chicago, IL-IN-WI            (74,050)          (48,018)              36,540             15,580
    Cincinnati, OH-KY-IN            (10,814)            (3,155)                3,420              3,622
    Cleveland, OH            (24,548)            (2,628)                6,409              1,382
    Columbus, OH              3,116             2,366                9,220              1,088
    Dallas-Fort Worth, TX              9,745           88,765              20,652             22,153
    Denver, CO             17,317           29,839                3,447              6,393
    Detroit,  MI            (49,741)              (706)                7,716             13,973
    Grand Rapids, MI                 171                 59                1,794                 776
    Hartford, CT            (10,189)            (3,202)                9,480              1,428
    Houston, TX             20,101           50,554              42,096             12,295
    Indianapolis. IN             (6,523)           11,509                5,561              2,670
    Jacksonville, FL             (2,000)           12,461                5,991              1,546
    Kansas City, MO-KS             (6,842)             2,624                1,957              4,711
    Los Angeles, CA          (110,934)             8,439              88,868             23,635
    Louisville, KY-IN                (906)             1,837                3,871                 647
    Memphis, TN-MS-AR             (4,670)              (656)                3,727                 261
    Miami, FL                   26           44,255              66,308             44,873
    Milwaukee,WI            (11,271)               662                3,740                 911
    Minneapolis-St. Paul, MN-WI              2,706            (4,786)              11,583             11,424
    Nashville, TN              6,117           19,203                5,357              2,714
    New Orleans. LA             19,061              (585)                1,439              4,262
    New York, NY-NJ-PA          (139,190)        (114,335)            151,431           117,636
    Oklahoma City, OK              7,494           12,791                3,335              1,432
    Orlando, FL             16,507           15,163              21,115             10,779
    Philadelphia, PA-NJ-DE-MD            (14,535)          (18,095)              16,276             22,104
    Phoenix, AZ             42,243             4,716              18,971                 413
    Pittsburgh, PA              3,114             4,050                5,006                 783
    Portland, OR-WA              9,266           14,323                5,055              7,153
    Providence, RI-MA             (9,263)            (5,050)                6,428              2,988
    Raleigh, NC             25,546             3,409                7,207                 568
    Richmond, VA              1,965             3,781                1,656              4,908
    Riverside-San Bernardino, CA             (4,221)           33,207                6,649              6,184
    Rochester, NY             (5,738)            (2,222)                4,392                 583
    Sacramento, CA             (2,086)             6,472              11,150              3,172
    St. Louis,, MO-IL             (7,666)          (14,640)                2,322              6,677
    Salt Lake City, UT              1,486                 47                5,486                   28
    San Antonio, TX             30,130           16,031                7,417                 604
    San Francisco-Oakland, CA              1,736           17,103              12,294             36,783
    San Jose, CA             (7,029)               476              30,315                 104
    Seattle, WA             21,616             5,003              26,670              9,748
    Tampa-St. Petersburg, FL             20,153           15,875              12,823              7,086
    Virginia Beach-Norfolk, VA-NC             (4,405)            (7,859)                3,269             10,065
    Washington, DC-VA-MD-WV             14,170           21,026                6,199             73,365
    Total          (163,363)         285,728            798,480           588,593
    Calculated from US Census Bureau data


    Wendell Cox is a Visiting Professor, Conservatoire National des Arts et Metiers, Paris and the author of “War on the Dream: How Anti-Sprawl Policy Threatens the Quality of Life.

    —–

    Note 1: See 2010 historical core municipality list. This list does not include Grand Rapids, which now exceeds 1,0000,000 population as a result of the new metropolitan definitions, and is classified as Pre-War Core and Suburban.

    Note 2: Excludes the Las Vegas and San Diego metropolitan areas, which have only one county.

    Photo: Google Earth image of Cedar Park, Texas

  • Rust Belt: Can Micro-Suburbs Stay Independent?

    The Ohio suburb of East Cleveland abuts the core city to its west and north, and in terms of physical appearance the boundary between the two is indistinct. A century ago, the City of Cleveland unsuccessfully attempted to annex East Cleveland on two occasions. These days, Cleveland is unlikely to perceive its eastern neighbor as much of a catch. East Cleveland fell on hard times during the deindustrialization that took place throughout the Cuyahoga Valley: since 1970, it has lost more than half of its population. Nearly 40% of the 2010 population falls below the poverty level.

    East Cleveland’s residents and depressed real estate do not contribute a tax base by which the city can provide fundamental services. In this way, it’s no different than numerous exceedingly small towns and micro suburbs scattered nationwide. Can it — and other places like it — survive? And, if so, how?

    East Cleveland’s ‘solution’ is to shift the burden to motorists by tackling them with hefty speeding tickets. The 2.5-mile stretch of Euclid Avenue that passes through town is one of the city’s few revenue-raisers; a sidewalk sign promises camera monitoring and $90 speeding tickets.

    East Cleveland is a “Community of Strict Enforcement” that may not have high road fatalities, but the city’s socioeconomics give it few other options to generate the revenue it needs. The placard on the sidewalk (seen above) undoubtedly owes its existence to the debacle that a few years back brought about the demise of another Ohio town, New Rome.

    New Rome, outside Columbus, was a tiny village of only about nine city blocks (approximately twelve acres) that, even at its peak, no more than 150 people called home; the 2000 Census estimated its population at 60. It would probably have gone completely ignored if it weren’t for a four-block stretch of U.S. 40 (West Broad Street in Columbus) that fell within the town’s corporate limits. Within New Rome’s 1000-foot segment of highway, the speed limit dropped from 45 mph to 35. The New Rome Police Department had every right to issue $90 citations to motorists going 42 mph within this speed trap — and it did. The village of a dozen ramshackle houses, three apartment buildings, and a handful of small businesses earned nearly all its revenue from traffic tickets. With no other real public agencies, the money paid for the police force (which at times had as many as 14 employees, one quarter of the then-population) and the village council.

    A few neighbors eventually grew so frustrated that they launched the website New Rome Sucks. And after a series of corruption revelations, the town attracted the attention of the Franklin County Prosecutor and Ohio Attorney General Jim Petro, who determined that, after decades of incompetent management, New Rome should be abolished. Eventually, Petro convinced the Ohio General Assembly to pass a law allowing the state to seek dissolution of a village under 150 people if the State Auditor found that it provided few public services and demonstrated a pattern of wrongdoing. In 2004, the Village of New Rome was irrevocably absorbed into Prairie Township of Franklin County, Ohio.

    In most municipalities, good governance is a selling point. However, New Rome’s malfeasance was unequivocally a reflection of the will of its constituents. They got the racket that a majority of them apparently wanted. And eventually the village forfeited its very existence.

    While a New Rome could realistically emerge anywhere in the country, it is worth questioning whether the municipal incorporation structure in Ohio — and other states — particularly abets the process. Tiny municipalities exist everywhere. But they seem particularly prevalent in the industrial heartland. Cleveland’s Cuyahoga County has 57 incorporated municipalities; Columbus’ Franklin County has 25; Cincinnati’s Hamilton County has 38. Most states to Ohio’s northeast are almost completely incorporated: William Penn mandated this characteristic in his original charter for Pennsylvania. New Jersey is 99% incorporated. It is not uncommon to find boroughs as small as New Rome in both of these states; the Philadelphia suburb of Millbourne, for example, measures only .07 square miles.

    Conversely, southern states are more likely to opt for either expanses of unincorporated urbanized land (which characterizes the vast New Orleans suburb of Metairie) or mega-municipalities, such as the “town” of Gilbert outside Phoenix, with a population over 200,000.

    The majority of shrinking cities — and towns, villages, boroughs, and townships — now are clustered in the Northeast and the Midwest. “Home Rule” provisions in the Ohio state constitution, and similar legislation elsewhere in these regions, coupled with a small population, allow for a disproportionate amount of self-actualization… for better or worse. Cleveland’s most prosperous micro-suburbs have wielded it effectively to stem the erosion of their tax base.

    Does this broad-brush distinction between North and South yield any conclusions? At the very least, Rust Belt states must carefully weigh the benefits of entitling tiny populations to remain as independent towns. Otherwise, the only way many communities in a metropolitan mosaic will ever paint themselves out of the red is through surreptitious speed traps.

    Eric McAfee is an itinerant urban planner/emergency manager who fuses his cross county (and trans-national) travels and love of contemporary landscapes into his blog, American Dirt, where a different version of this article appeared.

    Photo in East Cleveland by the author.

  • America’s Off-The-Radar Tech Hubs

    At the moment, the technology sector is the focus of a lot of attention — and with good reason. Tech industries have helped turn San Jose and Austin into major economies and brought other large metros, like Detroit, through tough spells. But which small, off-the-radar towns out there also deserve recognition as technology hubs?

    To explore this question, we analyzed 70 high-tech occupations identified by BLS economist Daniel E. Hecker. The list includes everything from computer systems analysts to forest and conservation technicians. Many of the highlighted economies contain a strong contingent of one or two of these occupations, while other occupations may not be especially concentrated in the region.

    In order to locate these economies, we had to explore some obscure parts of EMSI’s extensive database. For one thing, we removed cities with very large populations since many of them would come as no surprise. (We already know that Seattle, San Jose, and Austin are capitals of the tech sector.) Cities with very small numbers of tech workers were also cut from the list; if an influx of 10 tech workers could radically shift the economy, it can be hard to gauge whether or not the industry is really growing.

    We chose to highlight MSAs that have 1,000-50,000 jobs in the industry, have grown by more than 10% since 2001 and more than 0% since 2010, and also have promising concentration (measured by location quotient, LQ). Another factor that we took into account is whether or not the industry grew during the recession (2007-09). After applying all these filters to our data, we chose 11 MSAs which have exhibited impressive growth but which have also, for the most part, sneaked under the radar.

    The list starts with Los Alamos, N.M., and Williston, N.D., which have already gained attention for their growing economies. Then we’ll move from smallest to largest MSA, examining a key tech occupation in each.


    Los Alamos, New Mexico

    Population: 18,294

    Tech workers: 4,559 jobs

    Highlighted tech occupation: Biochemists and Biophysicists (410)

    Why you should be watching: Tech occupations in Los Alamos have skyrocketed in the last 11 years, with a gobsmacking 325% growth since 2001. Currently, the city has a concentration of tech workers almost six times that of the nation. The median wage of these workers is $51.47/hr, which is much higher than the average for the occupation.

    Between 2005 and 2007, Los Alamos gained 3,750 jobs in the tech sector. The occupations barely dipped during the recession and have remained steady since, with only a slight decline in the last year.

    What’s causing all these insane numbers? Obviously, the Los Alamos National Laboratory. As an example of just how unique this city is, consider this fact: there are 252 nuclear technicians in Los Alamos. The LQ for that occupation in the region is 254.42. Basically, this means that if nuclear technicians were as concentrated nationwide as they are in Los Alamos, they would make up the 10th largest occupation in the United States, with 2,184,588 jobs.

    Williston, North Dakota

    Population: 25,107

    Tech workers: 926 jobs

    Highlighted tech occupation: Petroleum Engineers (211)

    Why you should be watching: The number of tech workers in Williston has grown 324% since 2001, and 93% in the last three years. Although there are only 928 workers, they are getting paid a median hourly wage of $46.29 and those paychecks have already had significant economic impact on the state. That’s what an oil boom will do for you.

    As you can see, there are twice as many petroleum engineers as the next largest tech occupation. And the second largest occupation is geological and petroleum technicians, which are also involved in the oil industry.

    Los Alamos and Williston are not really surprises when it comes to tech centers. Both have appeared in the news for several years now as emerging economies. As we look at these other regional economies and evaluate them as potential tech hubs, we can compare them to the exploding economies of Los Alamos and Williston.

    Susanville, California

    Population: 34,019

    Tech workers: 1,258 jobs

    Highlighted tech occupation: Forest and Conservation Technicians (761)

    Why you should be watching: Susanville is another one of those cities with growth in a lot of different areas. The fact that it is a logging town keeps the economy tied to local industries and helps it stay well-rounded. The most impressive thing about Susanville is that during the recession, the number of tech workers grew by 18%.

    Whenever we find an industry or occupation that grew during the recession, we usually discover that it was strongly supported by the government. Susanville is no different. According to EMSI’s inverse staffing pattern, the government sector accounts for 95% of all tech-related occupations. Below are the three government industries and their portions of tech occupations:

    • Federal government, civilian, excluding postal service (65.7%)
    • State government, excluding education and hospitals (25.6%)
    • Local government, excluding education and hospitals (3.2%)

    It’s not too surprising that the regional economy has been doing so well.

    Pullman, Washington

    Population: 45.4K

    Tech workers: 1,299 jobs

    Highlighted tech occupation: Electrical Engineers (163)

    Why you should be watching: Small economies sometimes have a better chance of withstanding economic recession because they can be self-contained. This is especially true of Pullman, where the economy is almost entirely driven by two forces: Washington State University and Schweitzer Engineering Laboratories. Even with a mere 1,283 tech jobs in the area, the sector grew 38% since 2001 and, more impressively, 9% during the recession.

    The line graph displays the increase of electrical engineers since 2001. While 163 jobs might not seem like very much, the growth is dramatic enough to warrant comment.

    St. Marys, Georgia

    Population: 50,957

    Tech workers: 992 jobs

    Highlighted tech occupation: Civil Engineers (136)

    Why you should be watching: Out of the MSAs we examined for this report, St. Marys has the most consistent growth across the board. The tech sector has grown 88% since 2001 and 50% since 2010, increasing the LQ by 0.53 in the last eleven years. Most of this growth is probably caused by the Naval Submarine Base Kings Bay, but the occupations that have grown are quite varied.

    The table below shows the top five industries for tech occupations in St. Marys. As you can see, engineering services is at the top of the list, followed by federal government, civilian.

    NAICS Industry Occupation Group Jobs in Industry (2012) % of Occupation Group in Industry (2012) % of Total Jobs in Industry (2012)
    541330 Engineering Services 468 47.2% 52.3%
    901199 Federal Government, Civilian, Excluding Postal Service 194 19.6% 8.5%
    336414 Guided Missile and Space Vehicle Manufacturing 100 10.1% 18.9%
    541519 Other Computer Related Services 37 3.8% 42.7%
    524114 Direct Health and Medical Insurance Carriers 29 2.9% 8.1%

    Engineering services accounts for the most tech jobs in the region (468 jobs), and government jobs come next with 194 tech jobs. Guided missile and space vehicle manufacturing are tied to the government as well, as most of that research is probably happening at the Naval Submarine Base.

    Helena, Montana

    Population: 76,801

    Tech workers: 3,109 jobs

    Highlighted tech occupation: Forest and Conservation Technicians (371)

    Why you should be watching: Helena is another one of those plucky economies that refused to buckle during the recession. Helena has a quite a few tech workers (3,144 in 2012), but they are spread out evenly over many occupations. Since Helena is the state capital, the largest employer of tech workers is the state government (comprising 1,321 jobs), but the tech sector as a whole grew almost 12% in the last three years.

    Forest and conservation technicians account for 371 jobs in the tech sector, followed by civil engineers at 336 jobs. Forest and conservation technicians grew 48% growth since 2001 (most of that taking place 2005-2009. It’s easier to understand this growth knowing that 96% of the forest and conservation technician jobs in Helena are in state or federal government.

    Dubuque, Iowa

    Population: 95.5K

    Tech workers: 3,041 jobs

    Highlighted tech occupation: Software Developers, Systems Software (430)

    Why you should be watching: Dubuque has seen strong growth among tech workers in the last ten years, especially in software developers. Since 2010, the tech economy has increased by 3,126 jobs. Many of these jobs are due to the presence of IBM’s Global Delivery Center and other developing tech companies. Dubuque is currently #8 on Forbes’ list of best small places for businesses and careers.

    Lexington Park, Maryland

    Population: 109,409

    Tech Workers: 7,789 jobs

    Highlighted tech occupation: Electronics Engineers, Except Computer (1,438)

    Why you should be watching: During the recession, Lexington Park’s proximity to D.C. propped up its economy. The city grew 9% from 2007 to 2009, but its tech industry has grown 5.2% since then. Tech workers are 3.48 times more concentrated in Lexington Park than in the rest of the nation, for which the city can thank the Patuxent Naval Air Station.

    This graph represents the top industries for electronics engineers, except computer engineers, in Lexington Park. All together, the industries staffed by electronics engineers have increased 56%, compared to 16% in the 50 largest metropolitan statistical areas and 19% in the nation as a whole. Most of this growth has occurred in research and development in the physical, engineering, and life sciences (NAICS 541712), which has seen 93% since 2001, and in engineering services, which has seen 84% growth since 2001.

    Midland, Texas

    Population: 143.4K

    Tech workers: 4,484 jobs

    Highlighted tech occupation: Petroleum Engineers (927)

    Why you should be watching: The 4,484 tech jobs in Midland aren’t the most impressive thing about the city. What is impressive is the 23.4% growth in the last three years and the $42.76 hourly wage. A increase of 83% since 2001 is nothing to snort at either. That’s what the oil industry will do for you.

    The line graph below represents the growth of petroleum engineers since 2001. The blue line stands for the Midland MSA. Green stands for all 11 tech centers highlighted in this post. Brown and red stand for the 50 largest MSAs in the nation and the nation as a whole, respectively.

    Despite the fact that petroleum engineers drive the Midland economy, the 11 tech centers have increased in petroleum engineers slightly faster. Both are significantly ahead of the nation as a whole, however. What’s not reflected on this chart is the fact that the petroleum engineers occupation in Midland has a regional LQ of 45.16. With such a high concentration of a single occupation, Midland’s economy is primed for expansion as other industries and occupations rush in to support the oil industry.

    Trenton, New Jersey

    Population: 368.9K

    Tech workers: 17,573 jobs

    Highlighted tech occupation: Software Developers, Applications (2,899)

    Why you should be watching: The Trenton-Ewing area used to be a big hub for manufacturing jobs, but has since shifted its focus. Government, health care, and technology are currently the largest industries in the area. Tech workers have increased 11% since 2001 and grew 3% during the recession, and workers earn a median wage of $41.23/hr.

    Trenton’s highlighted tech occupation is software developers, which is spread out over several different industries. Here are the five industries that employ the most software developers in Trenton-Ewing.

    Custom computer programming services has gained quite a few software developers and investment banking and securities dealing has more than doubled its numbers. Software publishers take the cake with an increase of zero to 160 since 2001.

    Madison, Wisconsin

    Population: 583.8K

    Tech workers: 25,597 jobs

    Highlighted tech occupation: Computer Support Specialists (3,827)

    Why you should be watching: Madison has 26,722 tech workers and grew 28% over the last 10 years. It could be hard to maintain such a high concentration of tech workers, but the LQ of tech workers in Madison has grown from 1.31 in 2001 to 1.61 in 2012. Madison is currently #89 on Forbes’ list of the Best Places for Business and Careers and #38 in job growth.

    The complete data is reproduced below.

    Metropolitan Statistical Area 2012 Jobs 2001-12 % Change 2007-09 % Change 2010-12 % Change Median Hourly Earnings 2001 Location Quotient 2012 Location Quotient LQ Change
    Source: QCEW Employees, Non-QCEW Employees & Self-Employed – EMSI 2013.1 Class of Worker
    Los Alamos, NM (31060) 4,585 325% -2% -3.8% $51.47 2.42 5.91 3.49
    Williston, ND (48780) 928 324% 24% 93.7% $46.29 0.47 0.65 0.18
    St. Marys, GA (41220) 974 88% -3% 49.8% $34.02 0.55 1.08 0.53
    Midland, TX (33260) 4,488 83% 4% 23.4% $42.76 0.88 1.17 0.29
    Susanville, CA (45000) 1,246 74% 18% 0.7% $22.42 1.42 2.41 0.99
    Dubuque, IA (20220) 3,126 63% 1% 12.8% $30.96 0.75 1.10 0.35
    Lexington Park, MD (30500) 7,659 55% 9% 5.2% $45.26 2.62 3.48 0.86
    Helena, MT (25740) 3,144 39% 7% 11.9% $25.99 1.36 1.53 0.17
    Pullman, WA (39420) 1,283 38% 9% 9.3% $33.67 1.10 1.37 0.27
    Madison, WI (31540) 26,722 28% 2% 5.7% $32.57 1.31 1.61 0.30
    Trenton-Ewing, NJ (45940) 17,887 11% 3% 0.2% $41.23 1.48 1.59 0.11

    Christian Leithart is a tech writer with EMSI. Follow them on Twitter @DesktopEcon.

  • Millennial Lifestyles Will Remake American Homes

    As Millennials, America’s largest generation, enter their thirties in ever greater numbers, their beliefs about how and where to raise a family will have a major impact on the nation’s housing market. This follows as their media and political preferences have helped shape how we entertain ourselves and who is the president of the United States.   A 2012 survey indicated that seventy percent of Millennials would prefer to own a home in the suburbs if they can “afford it and maintain their lifestyle.” Now a new survey of 1000 18-35 year olds conducted for Better Homes and Garden Real Estate (BHGRE) by Wakefield Research provides a much more detailed picture of the type of home Millennials believe best fits their needs and desires.  


    Reflecting their overall attitudes about spending their hard-to-come-by money, Millennials look more for value than “pizzazz” in a new home. Seventy-seven percent told BHGRE they preferred an “essential” home over a “luxury” model. And more than half (56%) believe the technological capabilities of a house are more important than its “curb appeal.”            

    Millennials are known for their fascination with technology.  The BHGRE survey demonstrates that tendency in reference to their home buying decisions. Almost two-thirds (64%) would not want to live in a home that wasn’t “tech-friendly.” Not surprisingly, almost half (44%) focus on the technological sophistication of the family room rather than other rooms in the house in making that determination. In fact, almost as many (43%) would rather turn their living room into a home theater with a big screen TV than use it in more traditional ways. Even in the kitchen, a solid majority (59%) would rather have a television screen than a second oven (41%).

    Another constant concern of Millennials, security, is also reflected in their technology preferences. Almost half (48%) named a security system as one of the technological essentials in a home and about a quarter (28%) would like to be able to control such a system from their smart phone.

    In addition, befitting the generation that first popularized social media sites such as MySpace and Facebook, most Millennials want a house that can be customized to their individual preferences. Forty-three percent want their home to be less a “cookie cutter” offering and more capable of allowing them to put their own finishing touches on it. Almost one-third (30%) would prefer a “fixer upper” to a “move-in-ready” home, and seventy-two percent of those surveyed thought they were at least as capable of making those repairs as their parents. Almost all (82%) of this supposedly “entitled” generation say they would find a way to handle the cost of these repairs themselves rather than borrowing the money from Mom or Dad.

    Millennials also take their concern for the environment into account when choosing a home. Almost half (45%) don’t want a home that wastes energy. Reflecting this, an energy efficient washer and dryer topped their essential technology wish list (57%). A smart thermostat was important to 44% of those surveyed, placing it third on the list of Millennial housing essentials.

    These preferences aren’t the only reason that Millennial homes will reduce the nation’s carbon footprint in coming years. Millennials see their home as a place to “do work,” not just a place to return to “after work.” Already one in five Millennials say that “home office” is the best way to describe how they use their dining room. The generation’s blurring of gender roles as well as its facility in using digital technologies means that Millennials will likely work as much from home as “at work,” as they share child rearing responsibilities based upon whose work responsibilities require which partner to be away from the house during the day.

    The cumulative impact on America’s energy consumption from this shift could be dramatic. A study by Global Workplace Analytics suggested that, if half of American worked from home, it would reduce carbon emissions by over 51 million metric tons a year—the equivalent of taking all of greater New York’s commuters off the road. Eliminating traffic jams would save almost 3 billion gallons of gas a year and cut greenhouse gas emissions by another 26 million tons. Additional carbon footprint savings would come from reduced office energy consumption, roadway repairs, urban heating, office construction, and business travel.

    By the end of this decade the Millennial generation will comprise more than one out of every three adult Americans (36%). Just as the Baby Boomers influenced the housing market when they started buying homes and raising families, the Millennial generation’s overwhelming size will place an indelible stamp on the nation’s housing market. Its numbers will produce a boom in demand for housing that will help heal this critical sector of the nation’s economy. 

    This may affect boomers and other old generations. Every seller of houses will have to adjust their offerings to accommodate Millennial preferences for the type of home in which they want to raise a family. The end result will be more family friendly neighborhoods where homes serve as the hub for their owner’s economic activity, simultaneously lowering the nation’s  carbon footprint and improving  the civic health of its communities.

    Morley Winograd and Michael D. Hais are co-authors of the newly published Millennial Momentum: How a New Generation is Remaking America and Millennial Makeover: MySpace, YouTube, and the Future of American Politics and fellows of NDN and the New Policy Institute.

    New home photo by BigStockPhoto.com.

  • CSI Switzerland: Anatomy of an iPod Theft

    When my seventeen year old son was mugged this year, coming home on a late weekend tram, he lost his iPod along with his Beats headset. I felt sympathetic, but not shocked, that he had been shaken down, even though we live in a quiet village on the outskirts of Geneva.

    The city has been experiencing a crime wave—at least by the standards of the Swiss countryside—with about 700 house break-ins a month. Unemployment for youths under 25 in nearby France, about a mile from our house, is now more than 25%, but more than double that for illegal immigrants, for whom house burglaries in Geneva are one of the few growth industries.

    Nor is it unusual to hear that a teenager has had something stolen or been roughed up. In my son’s case he wasn’t badly hurt; he took some punches to the head. Most of his wounds were to his childhood sense of security.

    He reported the incident to the police, who picked him up at the tram crime scene, drove around looking for the muggers, and dropped him back at home. A few days later he filed a more substantial report with a detective, who promised to look at the security tapes on the tram. We expected the matter to end there.

    Under the sway of late-night television, I was for staking out the tram on weekend nights, a proposal my wife dismissed as worthy only of Charles Bronson (Yeah? Well, what if the cops can’t handle this?). My wife rolled her eyes.

    A few weeks later, however, the Geneva police called to say that they not only had apprehended the muggers—all local Swiss, not Lyonnais gangsters—but had gone to the house of one of them and found a stash of loot, including my son’s iPod and his Beats.

    Equally incredible, that night two detectives came to our house close to midnight and returned the robbed goods. The detectives explained to my son that he had the option to press charges against the three, and give testimony in court, which he agreed to do, and that he could claim damages from the incident.

    We showed up at the appointed hour and were led into a wood-paneled, sparely furnished courtroom, locally called “Le Tribunal des Mineurs.” The only police officers were sitting outside in a waiting room, next to one of the defendant’s parents.

    As if called to the principal’s office, the three attackers were seated on small chairs directly in front of the judge, who sat alone behind a long desk. They looked like other teenagers I see on the street — jeans, sneakers, varsity jackets, and vacant expressions — but without iPhones. Behind the defendants sat three lawyers, testament that the muggers came from some means.

    Dressed casually, without robes or a necktie, the judge began by asking my son what happened. In Swiss cases, the judge hears the witnesses and dictates a summary to a court reporter. There was no jury.

    My son went over how these three kids, about sixteen- or seventeen-years-old, had sat behind him on a bus, and followed after him when he changed to a tram. When they were the only ones left on the street car, they asked him for a cigarette (he said he didn’t smoke).

    When the tram reached the end of the line, my son chose to sit tight in the bright lights under the surveillance cameras, rather than to make a run for the doors. He’d been unable attract the attention of the driver. When he finally decided to make a break, the gang of three surrounded him, shoved him back into his seat, hit him with their fists, and made off with his gear.

    The judge asked my son what he did next, and he said, “I called 117” (the police). The judge responded quickly, “But how?” My son described how, when the kids sat down behind him on the empty train, he managed to slip his phone and wallet into his underwear. The judge almost whistled when he said, “Bravo.”

    Then he questioned the attackers professionally, sternly, and, often, incredulously. He asked them if the testimony was true, and they said it was. He asked if they wanted to “say anything to the victim.” From their three mouths came stuttered, awkward apologies.

    The judge ended the court session by asking the three muggers what they would do if they saw their victim on the street (my son chuckled when one said he would “shake his hand”). The three were forced to go on the record, before a judge, that they would do him no additional harm if they met by chance.

    The court reporter printed out the transcript, my son signed three copies, and the judge explained that because it was a juvenile court the sentencing would not be made public.

    As juveniles, the three will not be sentenced to jail, but to a court program dealing with youthful offenders. I can imagine them attending anger-management classes, unless they were part of some larger, more violent crime syndicate, although I doubt that is the case. The pros don’t roll their victims under security cameras and stash the loot in bedrooms decorated with soccer posters.

    When the judge excused us, he walked over to my son, and said, “It took courage for you to come here today.” He shook his hand.

    I felt as if it were 1935 and I was listening to a justice of the peace lecture three kids about delinquent behavior. He wasn’t looking to send them up the river, but he spoke for a society that does not condone personal violence, especially in public places against strangers. I sensed the three got his message. At least, they were forced to hear it.

    In the annals of crime, this mugging means nothing, except to those involved. The prosecution did nothing to reduce the wave of house burglaries; those are the work of gangs operating out of Lyon and elsewhere in France. But the Geneva judge treated this matter as if he had the fate of several lives in his hands, and, in my view, he handled those lives with professionalism and care.

    Matthew Stevenson, a contributing editor of Harper’s Magazine, is the author of Remembering the Twentieth Century Limited, a collection of historical travel essays. His next book is Whistle-Stopping America.

    Flickr Photo by Alain Rouiller- rouilleralain — a street in a village near Geneva.