Category: Suburbs

  • Infinite Suburbia

    The following is an excerpt from the introduction of Infinite Suburbia, a collection edited by Alan M. Berger and Joel Kotkin, with Celina Balderas Guzaman:

    “Global urbanization is heading toward infinite suburbia. Around the world, the vast majority of people are moving to cities not to inhabit their centers but to suburbanize their peripheries. Thus, when the United Nations projects the number of future “urban” residents, or when researchers quantify the amount of land that will soon be “urbanized,” these figures largely reflect the unprecedented suburban expansion of global cities. By 2030, an estimated nearly half a million square miles (1.2 million square kilometers) of land worldwide will become urbanized, especially in Asia, Africa, and Latin America. In the United States alone, an additional 85,000 square miles (220,000 square kilometers) of rural land will be urbanized between 2003 and 2030. Given that these figures represent the conversion of currently rural land at the urban fringe, these lands are slated to become future suburbias. Even so, many countries are already majority suburban. In the United States, 69 percent of the population lives in suburbs. As late as 2010, over 75 percent of American jobs lay outside the urban core. Many other developed countries are also majority-suburban. In the Global South, it is estimated 45 percent of the 1.4 billion people who become new urban residents will settle in peri-urban suburbs. The sheer magnitude of land conversion taking place, coupled with the fact that the majority of the world’s population already lives in suburbs, demands that new attention and creative energy be devoted to the imminent suburban expansion.”

    Infinite Suburbia will be available for sale this week through the Princeton Architectural Press website. You can find the link here.


  • California Politicians Not Serious About Fixing Housing Crisis

    California’s political leaders, having ignored and even abetted our housing shortage, now pretend that they will “solve it.” Don’t bet on it.

    Their big ideas include a $4 billion housing subsidy bond and the stripping away of local control over zoning, and mandating densification of already developed areas. None of these steps addresses the fundamental causes for California’s housing crisis. Today, barely 29 percent of California households, notes the California Association of Realtors, can afford a median-priced house; in 2012, it was 56 percent.

    At the heart of the problem lie “urban containment” policies that impose “urban growth boundaries” to restrict — or even prohibit — new suburban detached housing tracts from being built on greenfield land. Given the strong demand for single-family homes, it is no surprise that prices have soared.

    Before these policies were widely adopted, housing prices in California had about the same relationship to incomes as in other parts of the country. Today, prices in places like Los Angeles, the Bay Area and Orange County are two to three times as high, adjusted for incomes, as in less-regulated states. Even in the once affordable Inland Empire, housing prices are nearing double that of most other areas, closing off one of the last remaining alternatives for middle- and working-class families.

    How did we get here?

    Largely in response to regulatory constraints, the state has been underproducing housing since the 1970s. So far this year, Los Angeles, the nation’s second-largest metropolitan region, has produced fewer homes than much smaller areas like Dallas-Fort Worth, Houston and Atlanta.

    The California Environmental Quality Act and other laws and restrictions have helped to make building the number of houses needed by California’s middle-income families unattainable. The state’s more recent draconian climate change policies are also making the building of more affordable homes, usually on the fringe of urban areas, almost impossible.

    Some developers and planners blame much of the problem on NIMBYs, or “not in my backyard” activists, who oppose high-density development in their communities. NIMBYism, often aligned with green policies, is part of the problem, but high-density housing is expensive, and there are not enough people looking for “micro-apartments” to solve the affordability crisis.

    Indeed, housing in buildings of more than five stories requires rents approximately two-and-a-half times those from the development of garden apartments, notes Gerard Mildner, academic director of the Center for Real Estate at Portland State University. In the San Francisco Bay Area, the cost of townhouse development per square foot can double that of detached houses (excluding land costs), and units in high-rise condominium buildings can cost up to seven-and-a-half times as much.

    Longtime San Francisco journalist Tim Redmond points out that luxury apartments tend to replace the often more affordable older buildings in urban neighborhoods. There’s been a gusher of high-rises built in places like San Francisco or Los Angeles, but these are generally very expensive, and have not discernibly lowered prices.

    Read the entire piece at The Orange County Register.

    Joel Kotkin is executive editor of NewGeography.com. He is the Roger Hobbs Distinguished Fellow in Urban Studies at Chapman University and executive director of the Houston-based Center for Opportunity Urbanism. His newest book is The Human City: Urbanism for the rest of us. He is also author of The New Class ConflictThe City: A Global History, and The Next Hundred Million: America in 2050. He lives in Orange County, CA.

    Wendell Cox is principal of Demographia, an international public policy and demographics firm. He is a Senior Fellow of the Center for Opportunity Urbanism (US), Senior Fellow for Housing Affordability and Municipal Policy for the Frontier Centre for Public Policy (Canada), and a member of the Board of Advisors of the Center for Demographics and Policy at Chapman University (California). He is co-author of the “Demographia International Housing Affordability Survey” and author of “Demographia World Urban Areas” and “War on the Dream: How Anti-Sprawl Policy Threatens the Quality of Life.” He was appointed to three terms on the Los Angeles County Transportation Commission, where he served with the leading city and county leadership as the only non-elected member. He served as a visiting professor at the Conservatoire National des Arts et Metiers, a national university in Paris.

    Photo credit: refundrealestate.com

  • The South’s Big Cities Moment

    August’s tragic events in Charlottesville kickstarted a somber debate about the appropriate way to commemorate the war that gave all Americans their freedom. It also triggered a conversation about whether the south’s legacy of rebellion and independence – with slavery a painful and regretful part of its past – is a legacy worth remembering.

    These discomforting conversations are a reminder that the south’s antebellum past continues to affect it in the present. Beyond civil rights, these impacts are profoundly felt in the south’s continuing urbanization, which is among the most rapid in the country despite occurring largely within the frameworks of cities whose prewar, pre-industrial bones were never suited for the “big city” qualities filled by their northern cousins. Today’s globally-connected southern cities grew largely from antebellum-era towns that were not the commercial or industrial powerhouses of the past, and yet they are growing dramatically anyway.

    The result is a murmuring culture war about the future of southern cities. The media may be fixated on statues, but the real issue is how these cities – thanks to a variety of historical and developmental factors that differentiate them from those in the north – are growing in ways that may not appeal to many planners and local boosters.

    Many of the south’s transformations have been enviable and measurable: between 2000 and 2012 most large southern metro grew by at least 20 percent, with some like Charlotte and Austin growing at more than twice that rate. Since air conditioning became a norm rather than an exception, growth has trended toward warmer climates, with half of America’s population growth in the last 50 years going to the eight states with the warmest climates. Southern cities have been particularly successful in attracting black families, a declining demographic in nearly every large northern city. They have by and large remained affordable, and continue to be attractive relocation destinations for big companies: metro Atlanta, for instance, is now home to more Fortune 1000 companies than vaunted San Francisco.

    The result is a set of increasingly economically significant and connected large cities with ever-larger suburbs and de-centralized economic gravity. Compared to northern cities, southern ones are less urban, less clustered, and less tall, on average with about half the number of skyscrapers per capita as major northern cities, based on data available from Emporis.com. This dispersion reflects their expanding ethnic diversity. Counties that were once entirely rural are now increasingly suburban, and attractive to minorities and immigrants. Georgia’s recent 6th District election in 2017 and Hillary Clinton’s victory in Fort Bend outside Houston reflects this unpredictable new southern political world.

    Planners have celebrated the urban revitalization in many large existing cities in the north, but largely have been less enthusiastic about this continued growth of sprawling cities in the south. In turn, they have sought increasingly to steer their growth in a more traditional northern pattern. Foremost among the goals of these planners is to densify and re-orient these cities around downtowns that have generally never embodied a strong urban character. This has created a number of awkward dualities: the push for walkability in places that have never before been walkable; the push for rail in cities where the density doesn’t support it; and the push for outdoor living in cities where being outside is uncomfortable for much of the year. This push for glassy Chicago-style downtowns does not always come naturally to cities whose strongest urban legacy is that of sleepy tree-lined Georgian mansions, and it has forced cities from Charlotte to Charleston to contemplate what kind of cities they want to be in the future.

    Conventional urban planning is simply not well-suited to the south’s dynamic new urban environments. New urbanism, for instance, while influential in the south, has made its name through quaint town making largely in the suburbs. Typical urban approaches like the repurposing of downtowns back into modern reinventions of what they once were – do not reflect the development, demographic, infrastructural, or character-driven challenges of cites without urban or industrial legacies.

    Now, the south has begun inventing its own new brand of experimental urban development, often heavily fueled by the private sector. In Atlanta, for instance, the public-private development of the Battery and Sun Trust Park is a public-private typology virtually unimaginable in the north. Boldly, the Atlanta Braves major league baseball team uprooted from its perfectly acceptable downtown home to move closer to its suburban fan base; a county without a discernible center delivered on much of the financing, and worked with the Braves to develop, from scratch, an entire new ballpark-oriented urban district to compete with downtown Atlanta and help fund both the cultural evolution and the cash flows needed to sustain the ballpark.

    The Battery was a form of urbanization and regional re-positioning delivered through a single project. Rather than a renewed focus on the urban core through adaptive reuse and infill, all gospel to planners in the north, metro Atlanta has shaped its own new downtown at a convenient juncture in the sprawl. These kinds of large-format development projects that create their own energy and introduce their own anchors are a hallmark of southern city-making, and build upon the “edge cities” idea first extensively written about by Joel Garreau in the early 1990s.

    The most impressive forms of project-driven development have been those where private developers have taken on urbanization efforts too massive for governments. In Florida and Texas, for instance, private developers are trying to implement high-speed rail lines by leveraging potential profits from real estate development around stations as part of the funding package. And Sandy Springs, Georgia received abundant attention in 2012 when it became a “contract city”, the ultimate privatization experiment when it bid out nearly all of its city services to outside contractors. By relying on private industry to take on these kinds of complex development and governance projects, southern cities are trying to avoid the government boondoggles as well as budget and debt ceiling shortfalls many northern cities face. In turn, however, those delivering on the projects have tremendous power over the formation of these cities, while urbanization is rarely happening according to plan.

    Acknowledging the power of these leaps and bounds innovations, some cities are trying to better channel the urbanization through example projects designed to inspire the private sector to develop in a more organized way. In Raleigh, for instance, the development market has been slow to deliver on high-quality urban projects, so in response the City is taking on the challenge itself: its own new City Hall campus may end up being the most powerful piece of modern architecture in the city. In turn, it is hoped to have catalytic potential to induce dramatic change across a downtown smattered with low-rise buildings. In many such cities, there is an underlying belief that channeling the pent-up private development market toward areas where land values are already the highest will maximize tax revenues and fiscal stability, and improve those cities’ urban qualities. Whether it’s a strategy with staying power is yet to be seen.

    There is no rulebook for how urban change is occurring in the south, but there is no doubt it is occurring more rapidly there. The universal themes in southern city-making today are diversification and creativity, ideas imbuing innovation that would be unlikely if they borrowed conventional approaches verbatim from the north. This new creativity on behalf of big steps and bold visions belies many recommendations from nationally-focused planners toward government consolidation and the belief that all new good things must happen through incremental steps in traditional downtowns. Perhaps this new form of southern rebellion will have staying power; much better, and better for its citizens, than the last one.

    Roger Weber is a city planner specializing in global urban and industrial strategies, urban design, zoning, and real estate. He leads the Urban Policy Practice Area for Skidmore, Owings & Merrill’s City Design Practice and holds a Master’s degree from the Harvard Graduate School of Design. Research interests include urban finance, demographics, architecture, housing, and land use.

    Photo: Thomson200 [CC0], via Wikimedia Commons

  • Forget the Urban Stereotypes: What Millennial America Really Looks Like

    Perhaps no generation has been more spoken for than millennials. In the mainstream press, they are almost universally portrayed as aspiring urbanistas, waiting to move into the nation’s dense and expensive core cities.

    Yet like so many stereotypes — often created by wishful thinking — this one is generally exaggerated and even essentially wrong. We now have a solid 15 years of data on the growth of young people ages 20-34, from 2000 to 2015, which covers millennials over the time they entered college, got their first jobs and, in some cases, started families.

    What The Numbers Say

    An analysis of Census Bureau data by demographer Wendell Cox contradicts much of the conventional wisdom. Take, for example, the #1 region for growth in the number of young people since 2000 (out of the 53 largest metropolitan areas). True, it’s in California, but it’s not San Francisco, Los Angeles or even Silicon Valley; rather, it’s the sprawling Inland Empire (Riverside-San Bernardino), which saw a remarkable 47.7% growth in young people, adding more than 315,000.

    Cities widely seen as millennial magnets — like Seattle, San Francisco, San Jose, Los Angeles, New York and Chicago — did considerably worse. Seattle performed the best among those superstar cities, ranking 15th on our list with a healthy 24.2% growth, adding more than 75,000 young people. The Bay Area lags behind, with San Francisco at #39 with 7.7% growth and San Jose at #49 with growth of barely 1%. Together, the two areas added 78,000 young people — one-fourth the growth of the Inland Empire even though they have roughly twice its total population.

    The performances of New York, Los Angeles and Chicago were also unimpressive. New York (#43) saw growth of 6.2%, slower than the national increase of 12.9%. Los Angeles (#47) did even worse, at 3.3% growth, while Chicago ranked 50th with a meager 0.5% increase in the demographic.

    Housing And Rent Costs

    Behind these developments may well be the rising cost of housing, combined with paltry economic prospects. Young people face an economy that, according to the Luxembourg Income Study, has produced relatively lower incomes and too few permanent, high-paying jobs. New York City reported that the incomes of residents ages 18-29 in 2014 had dropped in real terms compared with those of the same age in 2000, despite considerably higher education levels; rents in the city, meanwhile, increased by 75 percent from 2000 to 2012. According to data from Zillow, rent costs claim upward of 40% of income for workers ages 22-34 in Los Angeles, San Francisco, Miami and New York, compared with closer to 30 percent of income in metropolitan areas like Washington, Dallas-Fort Worth, Houston and Chicago.

    Virtually all the fastest growing millennial locations — including Riverside-San Bernardino and the rest of the top 10 metropolitan areas (Orlando, San Antonio, Las Vegas, Austin, Houston, Sacramento, Jacksonville, Raleigh, Tampa-St. Petersburg) — have even lower housing costs.

    Of course, cheap housing is not enough to attract millennials by itself. They also need jobs, and most of the areas in our top 10, as well as #12 Nashville and #13 Denver, have done well, not just in terms of overall job growth but also in such critical fields as professional and business services. Low-priced cities with mediocre or poor growth — #53 Detroit, for example — have fared worse; the Motor City and its environs have seen their youth numbers drop by 9.3% since 2000, amounting to a loss of more than 83,000.

    What The Future Holds

    A more recent subset of the data, from 2010 to 2015, shows similarities to the broader set, but in this case, it’s booming San Antonio that comes in first. The tech boom has helped boost millennial growth in some markets, such as San Francisco, Boston and San Jose, but as this generation ages, these places seem likely to continue lagging behind the fast-growth markets, which are largely in the Sun Belt.

    There remains a school of thought, particularly in the mainstream media, that millennials have little interest in purchasing homes and will avoid suburbs, and sprawling places, at all costs. Yet more than 80% of people ages 25-34 in major metropolitan areas already live in suburbs and exurbs, according to the latest data. Further, since 2010, nearly 80 percent of population growth in this group has occurred in the suburbs and exurbs, even though the millennials living in urban cores are better educated and more celebrated by the media. Among those under 35 who do buy homes, four-fifths choose single-family detached houses, which are more affordable in the fast-growing cities and suburbs.

    These trends may deepen as these young people enter their 30s. As economist Jed Kolko notes, adult responsibilities tend to make people move to affordable suburbs; the website FiveThirtyEight notes that as millennials have aged, they have actually been more likely to move to suburban locations than those their age in the past. We have already passed, in the words of USC demographer Dowell Myers, “peak urban millennial” and may be witnessing the birth of a new suburban wave.

    Economic Impacts

    Over time, it’s likely that younger workers, oppressed by high housing prices, will continue to follow this pattern as they seek affordability. As shown in a new report from the Center for Demographics and Policy at Chapman University, the decline in the home ownership rate for Californians ages 25 to 34 stands at 25 percent, compared with the 18 percent national loss. In San Francisco, Los Angeles and San Diego, the 25-34 home ownership rates range from 19.6 percent to 22.6 percent — approximately 40 percent below the national average.

    It’s clear that, for the most part, high housing prices lead to out-migration — among millennials and other generations — as illustrated by the continuing exodus from California, indicated by the last two years of IRS data. This follows a national pattern: People leave areas where house prices are higher, relative to incomes, for places that are more affordable, a pattern documented in Harvard research.

    In the end, it boils down to aspirations. At their current savings rate, millennials would need about 28 years to save enough for a 20% down payment on a median-priced house in the San Francisco area, but only five years in Charlotte or three years in Atlanta, according to a study by Apartment List. This may be one reason, a recent Urban Land Institute report notes, that 74 percent of all Bay Area millennials are considering a move out of the region in the next five years. Unwilling to accept permanent status as apartment renters, many millennials, so key to California’s dynamism, could be driven out.

    Millennials represent the nation’s largest living generation, and where they choose to move will shape local economies over the coming years. Although some will likely continue to move to superstar cities like New York and San Francisco, with their evident allures, the bulk of growth in millennial America is likely to take place elsewhere, offering opportunities to those economies that best attract and retain them.

    This piece originally appeared on Forbes.

    Joel Kotkin is executive editor of NewGeography.com. He is the Roger Hobbs Distinguished Fellow in Urban Studies at Chapman University and executive director of the Houston-based Center for Opportunity Urbanism. His newest book is The Human City: Urbanism for the rest of us. He is also author of The New Class ConflictThe City: A Global History, and The Next Hundred Million: America in 2050. He lives in Orange County, CA.

    Wendell Cox is principal of Demographia, an international public policy and demographics firm. He is a Senior Fellow of the Center for Opportunity Urbanism (US), Senior Fellow for Housing Affordability and Municipal Policy for the Frontier Centre for Public Policy (Canada), and a member of the Board of Advisors of the Center for Demographics and Policy at Chapman University (California). He is co-author of the “Demographia International Housing Affordability Survey” and author of “Demographia World Urban Areas” and “War on the Dream: How Anti-Sprawl Policy Threatens the Quality of Life.” He was appointed to three terms on the Los Angeles County Transportation Commission, where he served with the leading city and county leadership as the only non-elected member. He served as a visiting professor at the Conservatoire National des Arts et Metiers, a national university in Paris.

    Photo by Michael Adams [CC BY-SA 3.0], via Wikimedia Commons

  • Postcards From the Zombie Apocalypse

    I’m regularly accused of being a doomer whenever I point out the obvious – that many aspects of how we’ve organized our affairs over the last several decades aren’t meant to last. So they won’t. The end of Jiffy Lube and Lean Cuisine isn’t The End. Civilization will carry on without them, I assure you. But when it’s suggested that our current set of arrangements won’t last forever people immediately imagine Mad Max, as if no other alternative exists. Things are going to change. They always have and they always will. The future will just be different. That’s absolutely not the same as saying the world is coming to an end. Clear eyed individuals who are paying attention can start to get a feel for who the new winners and losers are likely to be and place themselves in the best possible situation ahead of the curve. That’s a pragmatist’s view – not a doomer’s.

    It helps to explore previous versions of these regularly occurring historical shifts. Think of them as postcards from the last few rounds of the Zombie Apocalypse. Here’s a small farm town in rural Nebraska. Its population peaked in the 1920s. The period between World War I and the Great Depression was an especially prosperous time for such towns as commodity prices were high and technological innovation (the telephone, radio, automobiles, tractors, etc.) created an enormous amount of new wealth and opportunity. The 1920s was also an era of rampant unsustainable practices of all kinds that lead to the ruined soils and draughts of the Dustbowl and the collapse of speculative credit based financial institutions. The population of this town began to decline in the 1930s and is currently down to a few dozen souls.

    Remnants of some of that early twentieth century technology still litter pastures on the edge of town. One resourceful farmer organized these old car carcasses into a makeshift corral for his livestock.

    It’s possible to connect the dots from rural Nebraska to Detroit where those very same vintage vehicles were manufactured all those decades ago. Detroit peaked in population, economic power, and political influence in 1950. Today huge swaths of Motown look remarkably similar to the abandoned farms and small towns of the prairie. Entire city blocks are now cleared of people and buildings. The Zombie Apocalypse arrived there too. If small scale agriculture was made redundant by mechanization and industrial scale production, then industry itself was hammered by other equally powerful forces. Everything has a beginning, middle, and end.

    The most recent iteration of the Zombie Apocalypse has already begun to unfold in some places. Suburbia was exactly the right thing for a particular period of time. But that era is winding down. The modest tract homes and strip malls built after World War II  are not holding up well in an increasing number of marginal landscapes. I have been accused of cherry picking my photo ops, particularly by people who engage in their own cherry picking when discussing the enduring value of prosperous suburbs. But there’s too much decay in far too many places to ignore the larger trend. The best pockets of suburbia will carry on just fine. But the majority of fair-to-middling stuff on the periphery is going down hard.

    The desire to push farther out and build ever more upscale suburban developments in increasingly remote locations is palpable. That’s what a significant proportion of the population desires on some level. But in the same spots – often next to each other – is ample evidence that there’s something profoundly wrong.

    Not all farm towns died. Not all industrial cities collapsed into ruin. Not all suburbs will fail… But the external forces at work are going to favor some places much more than others moving forward. The trick is to understand what those forces are before everyone else does and position yourself to benefit instead of getting whacked by the shifts. Would you have rather sold your house in Detroit in 1958 when things were still pretty good, or wait until 1967 when the panicked herd began to stampede? Would it have been better to buy property in the desert in 1970 and take advantage of a wave of growth for a few decades, or buy now at the top of that cycle and slide down from here on out?

    The future drivers of change will be the same as the previous century – only in reverse. The great industrial cities of the early twentieth century as well as the massive suburban megaplexes that came after them were only possible because of an underlaying high tide of cheap abundant resources, easy financing, complex national infrastructure, and highly organized and cohesive organizational structures. Those are the elements of expansion.

    But once the peak has been reached there’s a relentless contraction. The marginal return on investment goes negative as the cost of maintaining all the aging structures and wildly inefficient attenuated systems becomes overwhelming. The places that do best in a prolonged retreat from complexity are the ones with the greatest underlying local resource base and most cohesive social structures relative to their populations. The most complex places with the most critical dependencies will fail first as the tide recedes.

    The next Zombie Apocalypse will relentlessly dismantle superficial decorative landscapes and highly leveraged economies of scale. Take away the twelve thousand mile just-in-time supply chains, heavy debt loads, and limitless cheap resources and you get a very different world. Over the long haul Main Street has a pretty good chance of coming back along with the family farm. But the shorter term in-between period of adjustment to contraction is going to be rough as existing institutions attempt to maintain themselves at all costs.

    This piece first appeared on Granola Shotgun.

    John Sanphillippo lives in San Francisco and blogs about urbanism, adaptation, and resilience at granolashotgun.com. He’s a member of the Congress for New Urbanism, films videos for faircompanies.com, and is a regular contributor to Strongtowns.org. He earns his living by buying, renovating, and renting undervalued properties in places that have good long term prospects. He is a graduate of Rutgers University.

  • Want to be Green? Forget Mass Transit. Work at Home.

    Expanding mass-transit systems is a pillar of green and “new urbanist” thinking, but with few exceptions, the idea of ever-larger numbers of people commuting into an urban core ignores a major shift in the labor economy: More people are working from home.

    True, in a handful of large metropolitan regions — what we might call “legacy cities” — trains and buses remain essential. This is particularly true of New York, which accounts for a remarkable 43% of the nation’s mass-transit commuters, and of other venerable cities, such as San Francisco, Washington, Boston, Philadelphia and Chicago. Together, these metros account for 56% of all mass-transit commuting. But for most of the rest of the country, transit use — despite often-massive infrastructure investment — has either stagnated or declined. Among the 21 metropolitan areas that have opened substantially new urban-rail systems since 1970, mass transit’s share of work trips has declined, on average, from 5.3% to 5%. During the same period, the drive-alone share of work trips, notes demographer Wendell Cox, has gone up from 71.9% to 76.1%.

    Meantime, the proportion of the labor force working from home continues to grow. In 1980, 2.3% of workers performed their duties primarily at home; by 2015, this figure had doubled to 4.6%, only slightly behind the proportion of people who commute via mass transit. In legacy core-metropolitan statistical areas (MSAs), the number of people working from home is not quite half that of those commuting by transit. In the 47 MSAs without legacy cores, according to the American Community Survey, the number of people working from home was nearly 250% higher than people going to work on trains or buses.

    In the greater Los Angeles area, roughly 1.5% of people worked from home in 1980; today about 5% do. Meanwhile, despite significant expenditures, the share of people using mass transit went from slightly over 5% to slightly less than 5%.

    The areas with the thickest presence of telecommuters — including cities such as Austin, Raleigh-Durham, San Diego, Denver, and Seattle — tend to have the greatest concentration of tech-related industries, which function well with off-site workers. In San Jose, the epicenter of the nation’s tech industry, 4.6% of people work from home, exceeding the 3.4% who take mass transit. Other telecommuting hot spots include college towns like Boulder, where over 11.6% of workers work from home, and Berkeley, where the share is 10.6%.

    Leading telecommuting centers tend to be home to many well-educated, older and wealthy residents. Communities such as San Clemente, Newport Beach and Encinitas in Southern California, as well as Boca Raton in Florida, all have telecommuting shares over 10%. Perhaps older, well-connected people are more inclined to avoid miserable commutes, given the chance to do so. As the American population skews older, the economy will likely see more workers making such choices.

    Another important demographic force contributing to the work-from-home inclination is Americans’ continuing move to lower-density cities, which usually lack effective transit, and to the suburbs and exurbs — where 81% of job growth occurred between 2010 and 2014. While most metropolitan regions can be called “polycentric,” they are actually better described as “dispersed,” with central business districts (CBDs) and suburban centers (subcenters) now accounting for only a minority of employment. By 2000, more than three-quarters of all employment in metropolitan areas with populations higher than 1 million was outside CBDs and subcenters.

    Home-based work could be the logical extension of this dispersal — and modern technologies, from ride-sharing services to automated cars, will probably accelerate the trend. A recent report by the global consulting firm Bain suggested that greater decentralization is likely in the coming decades. A 2015 National League of Cities report observes that traditional nine-to-five jobs are on the decline and that many white-collar jobs will involve office-sharing and telecommuting in the future. The report also predicts that more workers will act as “contractors,” taking on multiple positions at once.

    Some see these developments as ominous, but greens and urbanists shouldn’t: Telecommuting will, among other things, reduce pollution. It may be that the shift to home-based work will prove the ultimate in mixed use — albeit for workers in their pajamas.

    This piece originally appeared on the Los Angeles Times.

    Joel Kotkin is executive editor of NewGeography.com. He is the Roger Hobbs Distinguished Fellow in Urban Studies at Chapman University and executive director of the Houston-based Center for Opportunity Urbanism. His newest book is The Human City: Urbanism for the rest of us. He is also author of The New Class ConflictThe City: A Global History, and The Next Hundred Million: America in 2050. He lives in Orange County, CA.

    Photo from Picjumbo.

  • Moving to the More Suburban Metropolitan Areas

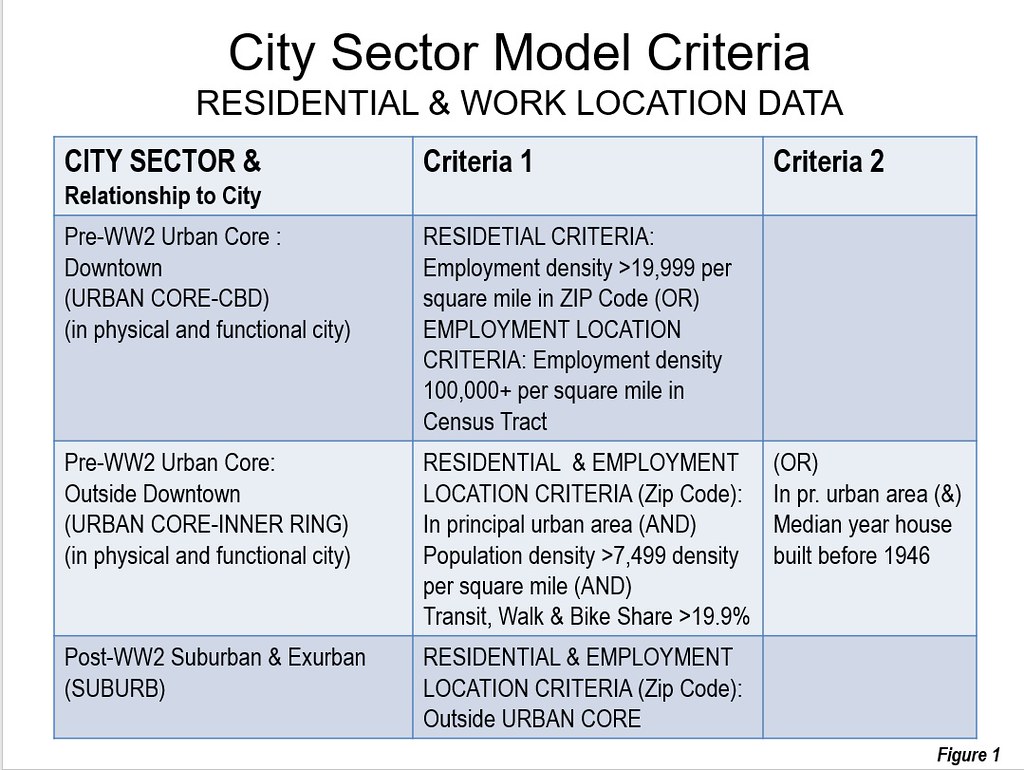
    A review of the most recent US Census Bureau population estimates and components of population change indicates that US residents are overwhelmingly moving to the most suburban cities (metropolitan areas). We previously rated the 53 major metropolitan areas (over 1 million population) using the City Sector Model (see America’s Most Suburbanized Cities), which classifies small areas (zip codes) into five urban core and suburban categories based on factors such as density, transit use, and age of housing stock.(Figure 1). This article examines net domestic migration based on the extent of suburbanization identified in the previous article.

    In this decade to date, the 30 most suburbanized cities gained 2.3 million net domestic migrants. These cities are from 94.8 percent to 100.0 percent suburban. The 23 cities that are less suburban had, overall, loss of 2.1 million net domestic migrants. Overall, the 53 major metropolitan areas gained 200,000 net domestic migrants.

    The First Quintile: 100 Percent Suburban Cities

    A total ten cities are rated 100 percent suburban this means that they have virtually no population densities high enough to qualify for urban cores in any zip code. This indicates that virtually all of their development has occurred during the post-World War II period and that any historical high density zip codes have experienced a decline to below 7500 persons per square mile. The most suburban of these cities is determined by the percentage of exurban population, since there is a 10 way tie for 100 percent suburbanization. This article examines net domestic migration trends in relation to the suburban character of the major metropolitan areas. Net domestic migration counts the number of US residents who move between counties (which are also the building block components of metropolitan areas).

    Charlotte is the most suburban and the other nine cities that are 100 percent suburban all located in the South or West (Table 1).

    Table 1
    Most Suburban Cities: (Metroplitan Areas)
    1 Charlotte, NC-SC
    2 Riverside-San Bernardino, CA
    3 Raleigh, NC
    4 Orlando, FL
    5 Birmingham, AL
    6 Jacksonville, FL
    7 Phoenix, AZ
    8 San Antonio, TX
    9 Tampa-St. Petersburg, FL
    10 Tucson, AZ
    Out of 53 with more than 1,000,000 population


    For the purposes of analyzing domestic migration, these 10 cities are considered to be the top quintile in suburbanization. With 53 cities overall, two quintiles are one city short, the first and the fifth.

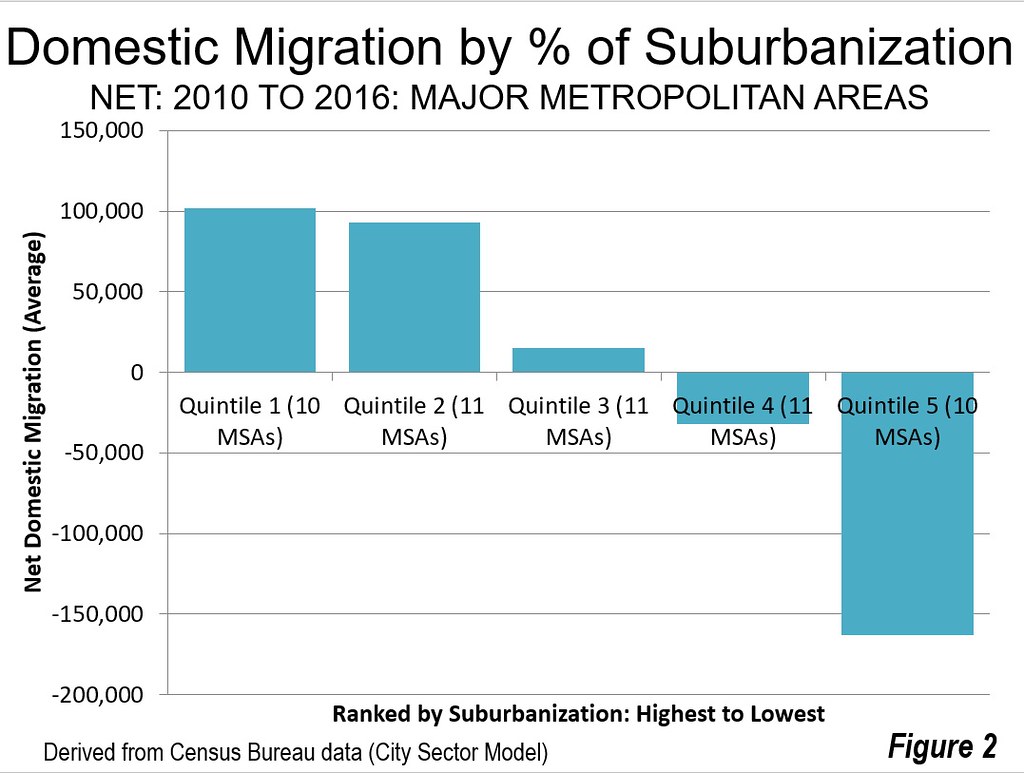
    The all suburban cities had an average positive net domestic migration of 93,000 persons between the 2010 census (April 1) and the 2016 Census Bureau population estimates (Figure 2). Their total net domestic migration was 1,016,000.

    Not all of the most suburbanized cities experienced positive net domestic migration. Birmingham, rated as the fifth most suburbanized city, lost 5000 net domestic migrants. But that’s an exception. Five fully suburban cities gained more than 100,000 net domestic migrants, including Phoenix (215,000), Tampa – St. Petersburg (163,000), San Antonio (146,000), Charlotte (143,000) and Orlando (132,000). Three of the other all suburban cities gaining domestic migrants added more than 50,000 including Raleigh, Jacksonville and Riverside – San Bernardino). Tucson gained only 3000 (Table 2).

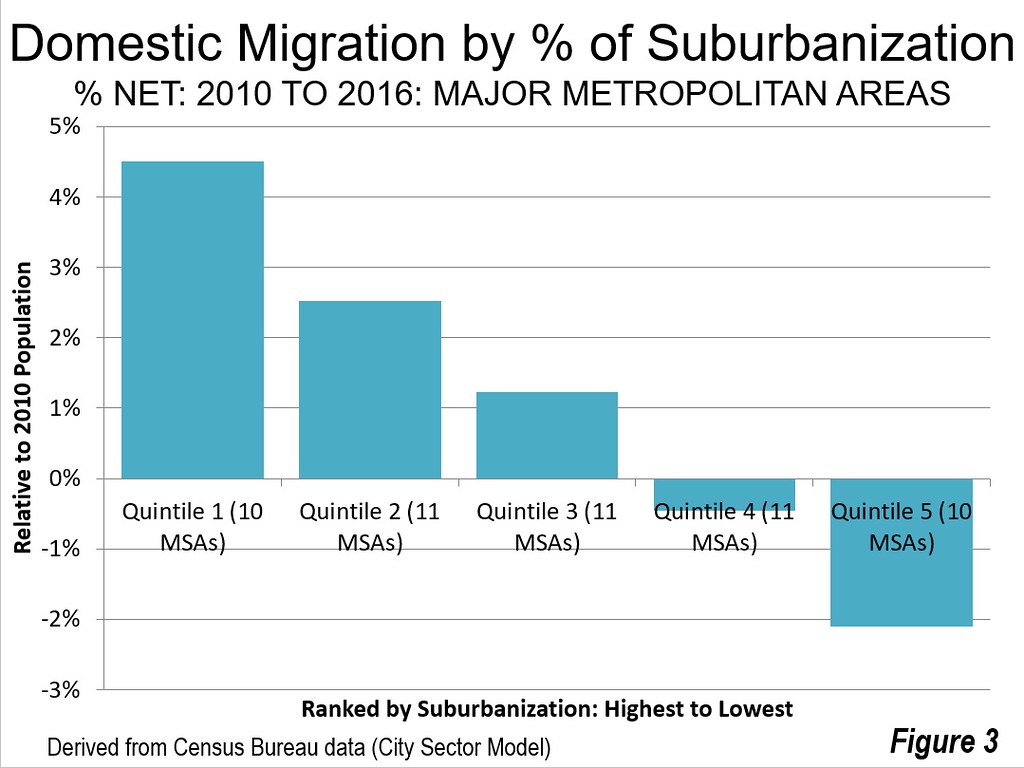
    Overall the net domestic migration averaged 4.5 percent relative to their 2010 Census population (Figure 3). Raleigh had the highest percentage net domestic migration gain at 8.3 percent, followed by San Antonio at 6.9 percent, Charlotte at 6.5 percent and Orlando at 6.1 percent (Figure 3).

    The Second Quintile

    The second quintile includes cities that are from 97.6 percent suburban to 99.8 percent suburban.

    With 11 cities, the second quintile attracted more net domestic migrants than the top quintile (1,023,000), which has only 10 cities. The per city average was somewhat lower than in the first quintile, at 93,000. Five of the cities in the second quintile added more than 100,000 net domestic migrants, including Dallas – Fort Worth at 304,000 (the highest of any city), Houston at 283,000 Austin at 192,000, Atlanta at 153,000 in Nashville at 104,000. Three cities in the quintile lost net domestic migrants, including San Jose, Virginia Beach – Norfolk and Memphis.

    The net domestic migration in second quintile averaged 2.5 percent of the 2010 population. Austin had the highest net domestic migration gain of any city at 11.2 percent. Nashville gained 6.2 percent.

    Like the first quintile, all cities in the second quintile are in the South or West.

    The Third Quintile

    The third quintile includes cities that are from 91.2 percent suburban to 97.2 percent suburban.

    The third quintile had an average net domestic migration of 15,000 per city and an average of 66,000 overall for the 11 cities. The largest gainers were Denver, at 155,000 and Oklahoma City at 52,000. Only two of the city’s lost net domestic migrants, Detroit at 131,000 and Miami at 7000.

    On average, the third quintile added 1.2 percent to their 2010 population through domestic migration. The largest gain was in Denver, at six percent, followed by Oklahoma City at 4.2 percent. The largest loss was in Detroit at 3.0 percent.

    The third quintile has cities from the Midwest as well as from the South and the West.

    The Fourth Quintile

    The fourth quintile includes cities that are from 84.1 percent suburban to 90.0 percent suburban.

    Overall these cities lost 352,000 net domestic migrants, for an average of a 32,000 loss per city. The largest gainers were Seattle, at 106,000 and Portland at 94,000. The growth of these cities is being strengthened by the strong outmigration from California with its horrendously expensive housing costs. The largest loser in the fourth quintile was Los Angeles, at 373,000 which ranks it the third largest losing major metropolitan area.

    Overall, the average city lost 0.5 cent of its population to net domestic migration. The largest gain was in Portland, at 4.3 percent and in Seattle at 3.1 percent. The largest losses were in Hartford, 3.9 percent and Rochester at 3.0 percent.

    The Fifth Quintile

    The fifth quintile includes cities that are from 83.3 percent suburban to New York, at 46.7 percent suburban ; the only city with a dominant urban core. Only one of these cities, San Francisco – Oakland gained net domestic migration, at 43,000 the largest net domestic migration losses were in New York at minus 903,000 and Chicago at minus 409,000.

    San Francisco – Oakland had a net domestic migration gain of 1.0 percent relative to its 2010 population, though in the last year has fallen into decline as house prices continue to rise to the stratosphere. New York had the largest percentage loss of any city due to net domestic migration at minus 4.6 percent. Chicago’s loss was minus 4.3 percent.

    Moving to the Suburbs and to the Most Suburban Cities

    A couple of months ago we and others reported on the resurgence of suburban population growth in net domestic migration compared to that of the urban cores (see “Flight from Urban Cores Accelerates: 2016 Census Metropolitan Area Estimates”). When examined relative to the extent of suburbanization, the trend is even more significant, with strong net domestic migration to the most suburbanized cities. America continues to evolve, often not following the densification and anti-suburban proclivities of many planners and media outlets.

    Table 2
    Domestic Migration in Relation to Suburbanization of Cities
    Major Metropolitan Areas: 2010 Census to 2016 Population Estimates
    Rank Metropolitan Area % Suburban Net Domestic Migration Net Domestic Migration %
    1 Charlotte, NC-SC 100.0%        142,873 6.5%
    2 Riverside-San Bernardino, CA 100.0%          59,453 1.4%
    3 Raleigh, NC 100.0%          90,756 8.3%
    4 Orlando, FL 100.0%        131,588 6.1%
    5 Birmingham, AL 100.0%           (5,122) -0.5%
    6 Jacksonville, FL 100.0%          68,237 5.1%
    7 Phoenix, AZ 100.0%        215,447 5.1%
    8 San Antonio, TX 100.0%        146,511 6.9%
    9 Tampa-St. Petersburg, FL 100.0%        163,157 5.9%
    10 Tucson, AZ 100.0%            3,372 0.4%
    11 Nashville, TN 99.8%        104,331 6.2%
    12 San Jose, CA 99.8%         (47,033) -2.5%
    13 Houston, TX 99.6%        283,239 4.8%
    14 Dallas-Fort Worth, TX 99.5%        304,468 4.7%
    15 Virginia Beach-Norfolk, VA-NC 99.5%         (41,540) -2.5%
    16 Atlanta, GA 99.2%        153,366 2.9%
    17 San Diego, CA 98.9%         (15,477) -0.5%
    18 Sacramento, CA 98.3%          38,745 1.8%
    19 Memphis, TN-MS-AR 98.1%         (36,854) -2.8%
    20 Austin, TX 97.9%        192,375 11.2%
    21 Las Vegas, NV 97.6%          87,856 4.5%
    22 Oklahoma City, OK 97.2%          51,983 4.2%
    23 Miami, FL 97.1%           (6,762) -0.1%
    24 Denver, CO 96.9%        154,847 6.1%
    25 Grand Rapids, MI 96.5%            8,480 0.9%
    26 Salt Lake City, UT 96.5%            2,006 0.2%
    27 Richmond, VA 95.6%          21,389 1.8%
    28 Columbus, OH 95.3%          29,167 1.5%
    29 Indianapolis. IN 95.0%          21,365 1.1%
    30 Kansas City, MO-KS 94.8%            5,866 0.3%
    31 Detroit,  MI 93.7%       (130,532) -3.0%
    32 Louisville, KY-IN 91.2%            8,475 0.7%
    33 Cincinnati, OH-KY-IN 90.0%         (23,149) -1.1%
    34 Portland, OR-WA 90.0%          94,284 4.3%
    35 Los Angeles, CA 89.4%       (372,990) -2.9%
    36 Seattle, WA 89.3%        105,516 3.1%
    37 New Orleans. LA 89.1%          27,417 2.3%
    38 Hartford, CT 88.7%         (46,980) -3.9%
    39 Rochester, NY 88.6%         (32,196) -3.0%
    40 St. Louis,, MO-IL 88.4%         (57,902) -2.1%
    41 Minneapolis-St. Paul, MN-WI 86.8%           (8,015) -0.2%
    42 Baltimore, MD 84.3%         (26,498) -1.0%
    43 Pittsburgh, PA 84.1%         (11,742) -0.5%
    44 Washington, DC-VA-MD-WV 83.3%         (46,264) -0.8%
    45 Cleveland, OH 78.3%         (58,375) -2.8%
    46 Milwaukee,WI 76.6%         (42,639) -2.7%
    47 Chicago, IL-IN-WI 74.2%       (409,167) -4.3%
    48 Philadelphia, PA-NJ-DE-MD 74.1%       (127,868) -2.1%
    49 Providence, RI-MA 73.9%         (28,789) -1.8%
    50 San Francisco-Oakland, CA 73.0%          42,847 1.0%
    51 Buffalo, NY 71.0%         (22,091) -1.9%
    52 Boston, MA-NH 64.3%         (36,483) -0.8%
    53 New York, NY-NJ-PA 46.7%       (902,616) -4.6%
    Derived from 2010 Census and American Community Survey using City Sector Model

    Wendell Cox is principal of Demographia, an international public policy and demographics firm. He is a Senior Fellow of the Center for Opportunity Urbanism (US), Senior Fellow for Housing Affordability and Municipal Policy for the Frontier Centre for Public Policy (Canada), and a member of the Board of Advisors of the Center for Demographics and Policy at Chapman University (California). He is co-author of the "Demographia International Housing Affordability Survey" and author of "Demographia World Urban Areas" and "War on the Dream: How Anti-Sprawl Policy Threatens the Quality of Life." He was appointed to three terms on the Los Angeles County Transportation Commission, where he served with the leading city and county leadership as the only non-elected member. He served as a visiting professor at the Conservatoire National des Arts et Metiers, a national university in Paris.

    Photograph: Downtown Dallas in the metropolitan area with the largest gain in net domestic migrants (by author)

  • Las Vegas Lessons, Part II

    A couple weeks ago I wrote some thoughts after a recent visit to Las Vegas. Most of what I wrote about concerned the Strip and downtown areas of the city, without question the two most recognizable and most frequently visited parts of the region. But in a rapidly growing region of nearly 2.2 million people (the Las Vegas Valley held only 273,000 residents in 1970, meaning it has increased its population by 8 times since then), clearly there’s much more to the region than its most iconic and visible parts. Here I’ll offer some thoughts on the broader region, its built environment, its economy, and thoughts on its future.

    First, for those tl;dr readers who won’t click through to read Part I, here’s a quick summary of it:

    • The Strip and Las Vegas are two entirely different entities.
    • Strip is a great pedestrian experience.
    • The Strip is an exclusively private space.
    • Downtown Las Vegas is quite different from the Strip.
    • There are poor linkages between Downtown Las Vegas and the Strip.
    • The north end of the Strip is plagued with high-profile failed projects.

    Again, as someone who’s “part urbanist, part sociologist, and part economist,” I offer some observations and thoughts on the rest of the city and region.

    The balance of the city and region consists of unremarkable suburbia. This is probably evident to anyone who puts any amount of thought into it, but it does bear repeating. Step away from the Strip and downtown, and Las Vegas’s built environment is amazingly consistent: according to the U.S. Census Bureau American Community Survey in 2015, the metro area is about 60% single family detached homes, with about 4,000-6,000 people per square mile throughout. There’s no sudden or even slight gradation in density as one commonly finds in many eastern cities; the city quickly establishes its suburban character and spits it out relentlessly. And, I’ve been struck on this visit and previous ones at how similar Vegas looks to suburbia in other places. Yes, there are newer, upscale areas that stand out (Summerlin comes to mind), but if you replace Vegas’s palm trees with oaks and elms, it looks a lot like suburbia anywhere else in America, except with Spanish tile roofs. Similarly…

    Nothing in the region is old; the region will have to learn the art and skills of redevelopment. Fifteen years ago when I did some consulting work in Las Vegas, I thought it was weird when city officials referred to West Las Vegas, just northwest of downtown, as “historic”. Most of the homes and businesses there were built in the ’50s and through the ’70s, and in my mind they were the kind of structures that were just beginning to establish some character. But when the median year of structure built in the region is 1995 (the same for Chicago’s metro is 1967), you simply won’t find the pre-WWII type of development that is called historic in other places. There will come a time when the structures of the Las Vegas Valley will be viewed as obsolete and inconsistent with modern living (whatever that is), and the region will have to undergo one of the more difficult transitions for municipalities — shifting from easy greenfield development to complex redevelopment.

    Low wage and low skill jobs proliferate in the region. Like the unremarkable nature of the suburban pattern, here’s another conventional observation that bears repeating. As one would expect, the accommodations/food services employment sector dominates in Las Vegas — nearly one-third of all Las Vegas workers work in hospitality. Those have traditionally been low-paying jobs, and that’s true of the region today. Overall, 44% of Vegas workers earn less than $40,000 a year. Contrast that with Austin, a similarly-sized and similarly-fast-growth metro, where only 9% of workers are employed in accommodations/food services, and just 34% of workers earn less than $40,000 a year (and consider that Austin is a college town that has many recent grads, possibly pushing incomes downward). My concern for Vegas in this regard is that there is growing research that suggests that the kind of work automation that decimated much of the Rust Belt’s manufacturing jobs may now enter a phase that targets food services, administration and office support, sales and even retail jobs — precisely the kinds of jobs that many new Las Vegas residents moved there to occupy. Las Vegas workers could be quite vulnerable to the kinds of challenges that reshaped the Rust Belt.

    The Las Vegas Valley is nearing its physical limits. According to Wikipedia, the Las Vegas Valley is a 600 sq. mi. basin surrounded on all sides by mountains. I don’t know the precise delineations between flat and inclined topography, but a look at Google Earth tells me the region is near its limit:

    I could be wrong, but it looks as if Vegas has available land to the north and southwest, and the Valley might be approaching 90% developed. It could be that the region hits the wall (literally) within the next 10 years. What will that mean for a region that is as low-density suburban as this one? Will the Valley’s communities have the ability to shift their focus inward? Time will tell.

    What happens to the region if tourism… changes? Wikipedia’s Atlantic City page has a good explanation for the decline of tourism there after World War II. It connects its decline with the car; prior to the war, people generally traveled to Atlantic City by train and stayed for a week or two. Cars made people more mobile and they made shorter visits. Suburbanization and its creature comforts, like backyards and air conditioning, also took visitors away from AC. The final nail in the coffin was affordable jet service, opening up vacation spots like Miami, Havana, and the Bahamas (and Vegas) in the 50’s and onward. I don’t know what challenge is out there for Vegas now, but what will be crucial to the region’s survival is how it responds.

    What impact will climate change have on a desert resort city? When flying into Las Vegas I couldn’t help but notice the low level of Lake Mead, just southeast of the city. It was clear from the air; bleached rock that had once been under water now exposed. Las Vegas is blessed to have one of the largest reservoirs in the nation at its back door, but could continued drought and increased demand for water undermine everything? The Strip’s casinos tout themselves as leaders in water conservation, but whether their efforts will be enough as conditions worsen is an open question.

    Las Vegas is truly a unique place. It’s a place that seems to serve a certain time and space, and is concerned about now more than its future. But I’m sure if the region squints its eyes and looks, it will see the future is getting closer. It will need to figure out how it will be sustainable as that future approaches.

    This piece originally appeared on The Corner Side Yard.

    Pete Saunders is a Detroit native who has worked as a public and private sector urban planner in the Chicago area for more than twenty years.  He is also the author of “The Corner Side Yard,” an urban planning blog that focuses on the redevelopment and revitalization of Rust Belt cities.

    Photo by Stan Shebs [GFDL, CC BY-SA 3.0 or CC BY-SA 2.5], via Wikimedia Commons

  • Connecticut’s Future is Suburban, Not Urban

    Connecticut is now grappling with a fiscal and economic crisis that, according to some leading Democrats, has been caused by ineffective urban policy. In late May, Hartford-based insurer Aetna confirmed long-discussed rumors that it will be moving its headquarters from Connecticut. General Electric announced plans to move from Fairfield, Connecticut to Boston in January 2016. Though the Great Recession officially ended eight years ago, state budget forecasters are projecting a $2 billion deficit for next fiscal year, or 11 percent of the budget. One policy report published in March, when rosier estimates pegged Connecticut’s deficit at only 9 percent, ranked Connecticut as having the 8th largest shortfall among American states. Hartford, the state capital, is on the verge of bankruptcy.

    What course should Connecticut take to stabilize government budgets and stimulate the economy? Gov. Dannel Malloy and Hartford mayor Luke Bronin believe that stronger cities are the answer. As Malloy said recently, explaining why his budget increases state aid for cities, “I think there is a body of people who don’t understand urban environments, and I think Connecticut has too long pursued a public policy of insufficient support for our urban environments.”

    But there are many questions to raise about just how vital urban Connecticut is to the state’s future. Connecticut’s major cities have their charms, especially Hartford and New Haven. But in terms of meeting the enormous fiscal and economic challenges with which the state is now faced, they are and will remain less important than its suburban regions.

    With all due respect to Gov. Malloy and Mayor Bronin, there’s a certain glibness in how they presume that Connecticut’s poor urban areas can be revitalized. It’s not as if their predecessors haven’t been trying. Any visitor to downtown Hartford and New Haven will be struck by several imposing works of mid-20th century modern architecture. Examples include Constitution and Bushnell plazas in Hartford and New Haven’s Temple Street Garage. These projects date back to the “urban renewal” era of the 1950s and 1960s, when massive government resources were devoted towards breathing new life into tired central cities.

    New Haven was nationally-renowned for its urban renewal efforts, both because it focused just as much on rehabbing old buildings as demolishing them . Mayor Richard Lee’s “human renewal” social service programs anticipated criticisms that poverty can’t be cured through real estate development alone. But the widely celebrated Mayor Lee failed to hit the mark. New Haven, the “Model City,” was rocked by a race riot in 1967, as was Hartford in 1969.

    Despite growing evidence that Connecticut cities were not coming back, urban renewal in modified forms would continue throughout the decades. In 1974, Hartford gained the “Hartford Civic Center,” (now known as the XL Center), a sports and entertainment venue where the NHL’s Hartford Whalers played from 1980 to 1997. The state’s convention center opened in Hartford in 2005, and a minor league baseball park just came online in April. And yet, among American cities with a population above 100,000, Hartford’s poverty rate is 8th highest in the nation. Mayor Bronin himself describes the current fiscal state of affairs in Hartford as “the largest budget crisis in our city’s history.”

    State government is not much better off. Connecticut’s budget deficit is driven by escalating costs for public pensions, which powerful government unions have balked at reforming, and weak tax receipts despite—or perhaps because of—a series of recent income tax hikes. Gov. Malloy, a progressive Democrat, has recently taken the position that trying to further increase the tax burden on the state’s 1 percent would be counterproductive.

    Urban revitalization is an unsound strategy for addressing budget deficits because creating strong cities is the work of generations. The secret of Boston’s success is reflected in a famous saying attributed to Daniel Patrick Moynihan: “If you want to build a world-class city, build a great university and wait 200 years.” Cities like New York that are now envied as talent magnets have had that reputation going back many years. Even in the 1970s, when New York was plagued by high crime and the threat of insolvency, it was still a national leader in finance, media and the arts.

    Bronin and Malloy have said that they understand Hartford can’t become New York or Boston. But among Hartford’s true peers—formerly industrial small and mid-sized cities throughout the northeast and Midwest—it is very difficult to find any examples of an authentic comeback city. In an analysis I recently wrote about Hartford, New Haven, Waterbury and Bridgeport, I found that, since 1970, the number of poor people living in these cities had increased by 56.1%, 40.8%, 153.6% and 86.3%, respectively. Over the same span, all have seen their total populations decline with the exception of Waterbury, which has grown by 1.7%.

    Despite all the hype over America’s urban renaissance, cities remain a tough sell for the middle class. However magnetic a city may be in attracting young millennials, as studies by William Sander of DePaul University and William Testa of the Chicago Fed have demonstrated, the more educated you are, the more likely you are to opt for suburbs when you settle down. If, 20 years ago, a given city had an underperforming school system that was unattractive to middle class families, it most likely remains unattractive to them now. According to the most up-to-date Census data we have, within most major metros, suburban areas are growing more rapidly than central cities.

    Connecticut is often associated with suburban blandness. But it happens to boast one of the most talented labor forces in the nation. A 2016 McKinsey report ranked Connecticut second among states in productivity (GDP per worker). Statewide, 16.6 percent of adults have advanced degrees, a rate which trails only Massachusetts and Maryland. (Only 6.7 percent of adults in Hartford have advanced degrees.) In coming years, the high levels of productivity and educational attainment among Connecticut’s suburban residents will be essential to any growth the state manages to achieve. Fairfield County Connecticut boasts some of the strongest public schools in the nation, whereas the state’s urban school districts remain troubled.

    As Connecticut officials contemplate a policy response to Aetna’s exit, it is crucial that they not lose sight of the following. We don’t know how to revitalize poor old industrial cities, especially small and mid-sized ones. Middle class families with children are opting for the suburbs just as reliably as in prior generations. One of the soundest economic development strategies is for a state to offer potential employers a productive and educated workforce, which Connecticut plainly does. State officials should build on current virtues, avoid chasing fads, focus more on budget discipline, and by all means stop trying to make Connecticut into something it’s not.

    Stephen Eide is a Senior Fellow at the Manhattan Institute.

    Photo by Doug Kerr, via Flickr, using CC License.

  • Dispersed Cities: Starting the 3rd Decade

    Cities (urban areas or settlements) have been around for millennia. Over that time, cities have changed in form and function. But the way that people move around the city has materially changed only twice. Walking was predominant until less than 200 years ago, then came mass transit, the automobile and now autonomous cars and some substitution for driving by online technology.

    The Walking City

    When walking predominated, cities had to be very dense, because things had to be close enough for pedestrian access. Walking Paris reached approximately 250,000 persons per square mile and London over 100,000 in the 17th century. The US also had dense walking cities, but they were smaller , emerged much later and never reached the highest densities of old-world cities. By 1820, New York had an estimated 50,000 residents per square mile, but a population of less than 150,000.

    Indeed in 1820 urban travel was little different than in for the average resident than in the pre-urban temple center of Gobekli Tepe (Turkey) 11,000 years ago, the Caral (Peru) of 4,500 years ago or the Wangchenggang (China) of 4,000 years ago.

    The Transit City

    However, the second quarter of the 19th century saw the emergence of the mass transit revolution. The new the horse drawn omnibuses were affordable to many people, unlike individual horses and horse drawn carriages. Over nearly all of the next century, transit shaped the city. Services were expanded and improved. Electric streetcars and interurbans appeared. If the Census Bureau had asked a “journey to work” question in the 1900 census, the answers would have shown transit’s share of mechanized to be virtually 100 percent.

    During this period, transit shaped the dominant downtowns (central business districts or CBDs), as is chronicled by Robert Fogelson in Downtown: Its Rise and Fall: 1880-1950. Transit lines converged on the CBD, which was the key to its emergence as the central point of a monocentric city. Transit retained its primacy through much of the 1910s, as people who worked downtown were able to move further away.

    The Automobile City

    But, just as the transit city was peaking, the car began its ascent, with automobile ownership expanding rapidly in the 1920s. By 1929, 90 percent of the world’s car registrations were in the United States, according to Northwestern University economist Robert Gordon. All of this made it possible to travel farther in urban areas and to live even farther from the urban core.

    After the Great Depression and World War II, which slowed growth, automobile ownership expanded even more. By 1950, New York region’s urban density had dropped below 10,000 per square mile and the average density among the principal urban areas in today’s 53 major metropolitan areas (more than 1,000,000 population) was approximately 6,000 per square mile. By 2010, New York’s urban density had dropped to 5,300, and Los Angeles had become the densest at 7,000. The average of the principal urban areas to 3,100.

    Polycentricity’s Short Interlude

    The dominance of the automobile ended much of the need for a CBD. As people moved farther away (suburbanized), employment and commercial development also suburbanized. Large retail shopping centers appeared throughout the suburbs. Soon after, large employment centers developed outside the downtowns, such as Bellevue (Seattle), Uptown (Houston), Century City (Los Angeles) and Research Triangle (Raleigh-Durham). In 1991 Joel Garreau first brought centers like this to public attention, coining the term “edge city” in his book Edge Cities: Life on the New Frontier. It had become clear to those who were paying attention that the monocentric, CBD oriented US city was a thing of the past. There were still CBDs, of course, but most were shadows of their former selves in employment and shopping shares. American cities were increasingly referred to as “polycentric.”

    Dispersion: The New Urban Form

    But polycentricity did not last very long. In 1997, University of Southern California economists Peter Gordon and Harry W. Richardson noted the trend toward dispersion in Beyond Polycentricity: The Dispersed Metropolis, Los Angeles, 1970-1990. In a 1998 Brookings Institution paper, they highlighted one of the most important advantages of dispersion. Traffic “doomsday” forecasts, for example, have gone the way of most other dire predictions. Why? Because suburbanization has turned out to be the traffic safety valve. Increasingly footloose industry has followed workers into the suburbs and exurban areas and most commuting now takes place suburb-to-suburb on faster, less crowded roads.”

    Further evidence came in 2003 from University of Nevada Las Vegas Professor Robert Lang who documented the dispersion of office space outside the CBDs in Edgeless Cities: Exploring the Elusive Metropolis.

    Finally, Bumsoo Lee (now at the University of Illinois, Champaign-Urbana) and Peter Gordon published Urban Spatial Structure and Economic Growth in US Metropolitan Areas which looked at 2000 census tract data and classified employment based on job density into three categories, CBDs, subcenters and dispersed.

    Among metropolitan areas with more than 500,000 population, all had most of their employment outside CBDs and subcenters. In other words, all metropolitan areas were more dispersed than polycentric or monocentric. Further, in the largest metropolitan areas, more than twice as many jobs were in subcenters as the CBDs (Figure 1).

    • Among metropolitan areas with more than 3,000,000 residents, 77.9 percent of employment was dispersed, 15.0 percent in subcenters and 7.1 percent in CBDs.

    • Among metropolitan areas with from 1,000,000 to 3,000,000 residents, 82.2 percent of employment was dispersed, 7.0 percent in subcenters and 10.8 percent in CBDs.

    • Among metropolitan areas with from 500,000 to 1,000,000 residents, 82.6 percent of employment was dispersed, 5.6 percent in subcenters and 12.2 percent in CBDs.

    Unfortunately, this research has not been updated with the results of the 2010 census. But, there is every reason to believe that the dispersion continued. A City Sector Model (Figure 2) analysis of County Business Pattern data suggests that the dispersion has continued (Figure 3). Between 2000 and 2015, 90 percent of new jobs were in the suburbs and exurbs. The largest gains were in the Later Suburbs and Exurbs, while there were losses in the Urban Core Inner Ring and the Earlier Suburbs. While there was an increase in CBD employment, exurban job growth was nearly twice as great.

    This reality of the dispersed city, however, does not get in the way of media and others who talk as if the city remains monocentric. Yet in an era of new possibilities unleashed by technology — Uber, Lyft, autonomous vehicles — the likely trajectory is for more dispersion not less.

    Wendell Cox is principal of Demographia, an international public policy and demographics firm. He is a Senior Fellow of the Center for Opportunity Urbanism (US), Senior Fellow for Housing Affordability and Municipal Policy for the Frontier Centre for Public Policy (Canada), and a member of the Board of Advisors of the Center for Demographics and Policy at Chapman University (California). He is co-author of the “Demographia International Housing Affordability Survey” and author of “Demographia World Urban Areas” and “War on the Dream: How Anti-Sprawl Policy Threatens the Quality of Life.” He was appointed to three terms on the Los Angeles County Transportation Commission, where he served with the leading city and county leadership as the only non-elected member. He served as a visiting professor at the Conservatoire National des Arts et Metiers, a national university in Paris.

    Top photo: Los Angeles, CBD, polycentric (Wilshire district, Hollywood and Glendale) and dispersed (the rest), by author.