Category: Suburbs

  • Moving to the London Exurbs and Beyond

    A review of the most recent internal migration (domestic migration) in England and Wales reveals some surprises. The latest data covers the one year ended June 30, 2014. It was published by the Office of National Statistics (ONS) and provides estimates at least down to the local authority area (municipality). In this regard, is positioned along with a number of European nations and the Australian Bureau of statistics well ahead of the US Census Bureau, which provides estimates only to the county level.

    The Regions

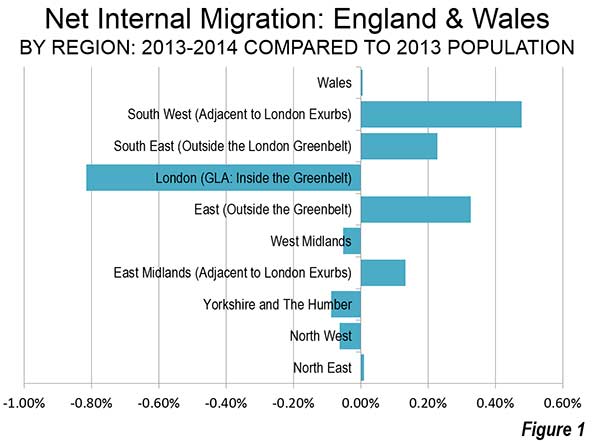
    On a regional level, there was little movement outside the southern half of England. England is divided into nine regions. Three of the northern and middle regions lost modest numbers of internal migrants, ranging from a minus 0.05% (minus 3,000 people) in the West Midlands, which contains England’s second largest city, Birmingham. There was loss of 0.06% (minus 7,100 people) in the North West, where Manchester and Liverpool are located. There was a 0.09% loss (minus 4,700 people) in Yorkshire and the Humber, where Leeds and Sheffield are located (Figure 1).

    The North East, which contains the city of Newcastle, has long been an area of economic hardship and is of danger of becoming "Britains Detroit" according to  The Guardian. Yet the North East experienced a small gain of 0.01% in internal migrants (500 people). The largest gain outside southern England was in the East Midlands, which includes Leicester and Nottingham, attracted a net 0.13 percent in new migrants (6,200 people). Wales (largest city Cardiff) also had a 0.1% gain in internal migrants (200 peopled).

    London (the Greater London Authority) lost by far the largest percentage of its population to internal migration, at minus 0.82 percent, or 68,600 people. This may be particularly surprising because London has recently reached its all-time population peak, having exceeded its pre-World War II 1939 estimated level. Yet virtually all of London’s huge population gain has been from natural growth (births minus deaths) and international migration. In recent years, this growth stems from strong gains in migration from a European Union countries, between which there is virtually unrestricted immigration.

    But Londoners, whether born in Great Britain or those who arrived before 2013, have been moving in large numbers to the exurbs beyond the greenbelt for some time and even farther away. The two large exurban regions have attracted many migrants. The East, which includes such well-known localities as Cambridge, Luton, Milton Keynes and St. Albans added the 0.33 percent to its population through internal migration. The South East, which includes localities like Oxford, Windsor, Dover and the entrance to the Euro tunnel to France added a somewhat smaller 0.23 percent.

    But some Londoners appear to be moving even farther away. The largest growth was in the South West region, which lies at least 70 miles (125 kilometers) from Trafalgar Square in London. The South West is home to such places as Bristol, Bath, Salisbury and Cornwall. The South West added 0.48 percent to its population through.

    London and Environs

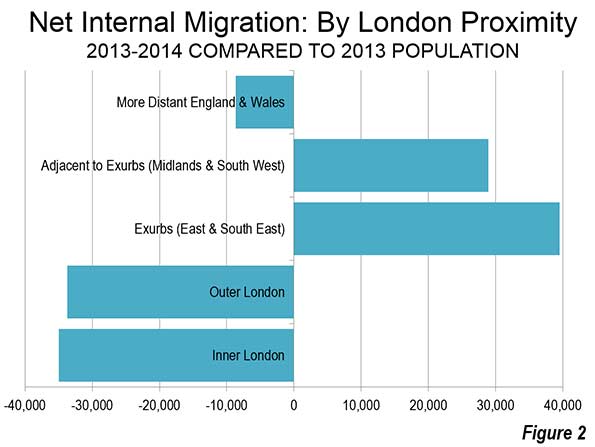
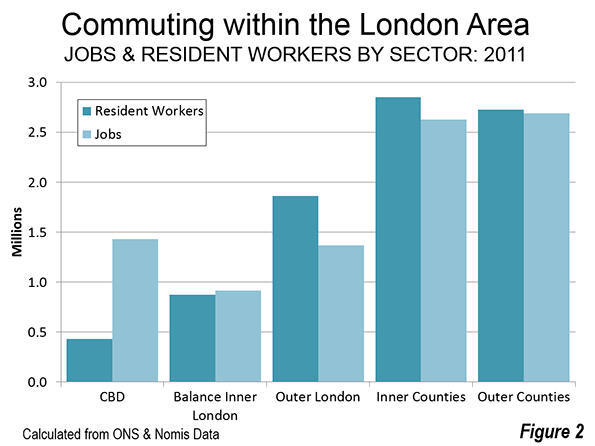
    During 2013-2014, the dominant trend was movement away from London to the exurbs and regions just beyond the exurbs, with a less dominant trend away from the balance of England and Wales. Virtually all the internal migration growth was in the London Exurbs (East and South East) and the adjacent areas, the South West, East Midlands and West Midlands (Figure 2). Nearly all the loss was in London. Inner London, suffered the largest domestic migration loss, at 1.05 percent of its population (minus 35,000). Inner London, at 3.3 million remains well below its population peak of 4.5 million, reached nearly 115 years ago (1901). Outer London, consisting of the large tracts of semidetached and detached housing built in the inter-war years lost a smaller 0.66 percent of its population to internal migration (minus 33,700). Outer London now has a population of approximately 5.1 million, one-half larger than Inner London.

    The Office for National Statistics (ONS) explains that London attracts internal migrants up to age 29. But, the internal outmigration of people 30 and above more than cancels this out. ONS explains:

    "A key factor for people in their 30s and 40s who move out of London could be the cost of housing. Young couples wishing to buy their first house, or a larger one for a growing family, may find prices in London prohibitively expensive and therefore choose to live outside of London."

    ONS adds:

    "Another important reason may be that people with children are more likely to move out of London because of environmental or social factors. For example, they may be seeking somewhere greener and quieter, and may also perceive that a less urban neighbourhood offers a better social and educational environment for children. Moves of adults with children also explains why there is a net outflow of children from London."

    ONS further indicates that there is net migration from London of older citizens, including those over 90 (the highest age category reported upon). These are trends similar to those we have identified in the United States some of which were opposite the conventional wisdom (See: Driving Farther to Qualify in Portland, Urban Core Millennials? A Matter of Perspective, Exodus of the School Children, and Seniors Dispersing Away from the Urban Cores)

    Greatest Gains and Losses

    Even so, London had one local authority area with the greatest internal migration gain: the historic City of London. However, this area, which is the core of the central business district, has few residents. Even after the internal migration gain (1.80 percent), the city still has fewer than 8,000 residents. The other largest gainers in numbers were found in the London exurbs or the South West, with the exception of Fylde, which is located in Lancashire (the North West), adjacent to the resort of Blackpool.

    London had nine of the 10 local authority areas with the greatest internal migration losses (out of 348). The largest loss was in the inner London borough of Newham (minus 2.68%). The one non-London local authority area in the bottom 10 was Pendle, in Lancashire (the North West).

    Metropolitan Areas

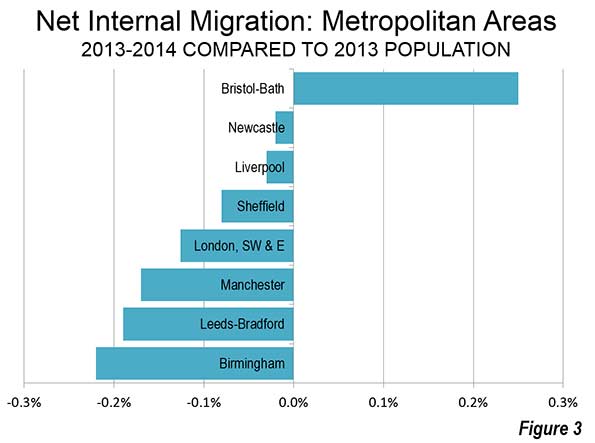
    Only one of the larger metropolitan areas experienced a net internal migration gain. The Bristol – Bath area (ceremonial Avon County), located in the South West gained 0.25 percent (Figure 3).

    Two metropolitan areas that have long experienced serious economic declines suffered only modest losses. Newcastle (Tyne and Wear Metropolitan County) lost only 0.2 percent of its population to internal migration. Liverpool, with a central municipality that dropped from a population of 856,000 in 1931 to 439,000 in 2001 (after which modest growth returned), had an internal migration loss of 0.03 percent. Sheffield (South Yorkshire Metropolitan County) lost 0.08% of its population to net internal migration.

    In view of the relative fortunes of London and Liverpool over the last century, it is especially surprising that the London region, including the exurbs, lost internal migration at a rate four times that of Liverpool (0.13%).

    Manchester (Greater Manchester Metropolitan County) experienced a net internal migration loss of 0.17 percent, and Leeds-Bradford (West Yorkshire Metropolitan County). Birmingham (West Midlands Metropolitan County) have the greatest loss at -0.22 percent.

    More Dispersion

    By far the largest net internal migration numbers are in the south of England, reflecting strong trends of decentralization away from London, to the East and the South East. But, by far the largest recipient of internal migration is the South West, beyond even the exurbs. This is another confirmation of the dispersing pattern of development, as has been observed in virtually all of the world’s megacities.

    ————–

    Note: The United Kingdom does not formally designate metropolitan areas. This article uses metropolitan and former (ceremonial) counties to approximate metropolitan areas.

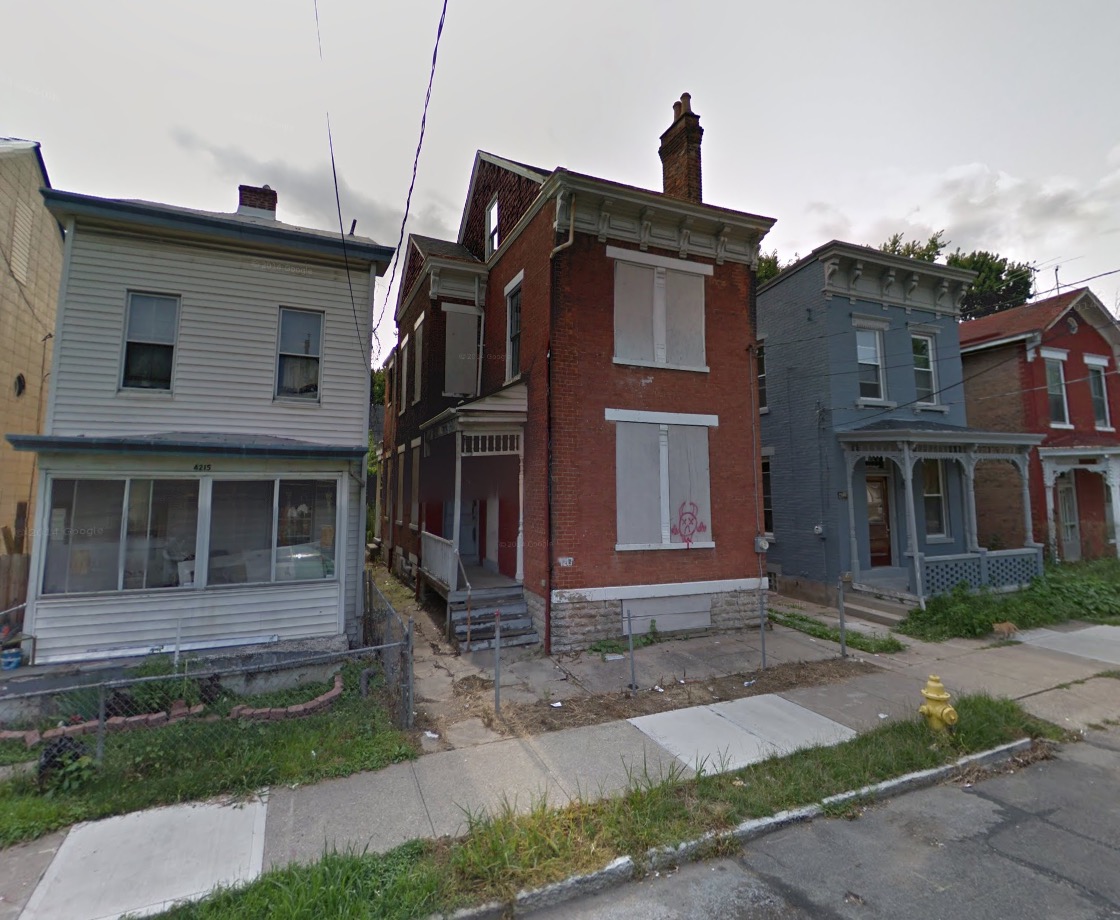
    Photograph: Local authority of Milton Keynes, Buckinghamshire (South East of England), by author

    Wendell Cox is Chair, Housing Affordability and Municipal Policy for the Frontier Centre for Public Policy (Canada), is a Senior Fellow of the Center for Opportunity Urbanism (US), a member of the Board of Advisors of the Center for Demographics and Policy at Chapman University (California) and principal of Demographia, an international public policy and demographics firm.

    He is co-author of the "Demographia International Housing Affordability Survey" and author of "Demographia World Urban Areas" and "War on the Dream: How Anti-Sprawl Policy Threatens the Quality of Life." He was appointed to three terms on the Los Angeles County Transportation Commission, where he served with the leading city and county leadership as the only non-elected member. He served as a visiting professor at the Conservatoire National des Arts et Metiers, a national university in Paris. 

  • More Local Decisions Usurped by Ideological Regulators

    In hip, and even not-so-hip, circles, markets, restaurants and cultural festivals across the country, local is in. Many embrace this ideal as an economic development tool, an environmental win and a form of resistance to ever-greater centralized big business control.

    Yet when it comes to areas being able to choose their urban form and for people to cluster naturally – localism is now being constantly undermined by planners and their ideological allies, including some who superficially embrace the notion of localism.

    In order to pursue their social and perceived environmental objectives, they have placed particular onus on middle- and upper-class suburbs, whose great crime appears to be that they tend to be the places people settle if they have the means to do so.

    Central planning

    Nothing is more basic to the American identity than leaving basic control of daily life to local communities and, as much as is practical, to individuals. The rising new regulatory regime seeks decisively to change that equation. To be sure, there is a need for some degree of regulation, notably for basic health and public safety, as well as maintaining and expanding schools, parks, bikeways and tree-planting, things done best when supported by local voters.

    Read the entire piece at The Orange County Register.

    Joel Kotkin is executive editor of NewGeography.com and Roger Hobbs Distinguished Fellow in Urban Studies at Chapman University, and a member of the editorial board of the Orange County Register. He is also executive director of the Houston-based Center for Opportunity Urbanism. His newest book, The New Class Conflict is now available at Amazon and Telos Press. He is also author of The City: A Global History and The Next Hundred Million: America in 2050. He lives in Orange County, CA.

    City Hall photo by Flickr user OZinOH.

  • What Jane Jacobs Got Wrong About Cities

    Few people have had more influence on thinking about cities than the late Jane Jacobs.

    The onetime New Yorker turned Torontonian, Jacobs, who died in 2006, has become something of a patron saint for American urbanists, and the moral and economic case she made for urban revival has been cited by everyone frompundits and think tanks to developers.

    However, though widely celebrated for her insights and unabashed embrace of dense urbanism, Jacobs may ultimately prove more influential than relevant. Her writing was often incisive and inspiring, particularly when she opposed planning and overdevelopment and embraced the role of middle-class families in cities. But the urban revival that has actually taken place is at variance with her own romantic version of cities and how they work.

    Currently the American cities that are doing best are not those with a flourishing middle class but those have become the preferred playgrounds of the rich and famous—New York, San Francisco, even Washington, D.C. At the same time, vast portions of urban America remain cut off from society’s mainstream.

    The Nature of the New Urban Revival

    When Jacobs published her most important work, The Death and Life of Great American Cities,in 1961, America’s cities were clearly in trouble. Racial tensions and a massive flight to suburbia were undermining the promise of cities, and the only response of planners at the time seemed to be to expand freeway access, tear down old neighborhoods, construct massive apartment blocks, and subsidize big employers.

    Jacobs rightly opposed these approaches, and constructed a far more human and enduring vision of urbanism. Her appealing perspective was based on middle-class neighborhoods, families, and grassroots economic activity. Her maxim about the best role for places remains a guiding light to those who care about upward mobility: “A metropolitan economy, if it is working well, is constantly transforming many poor people into middle-class people, many illiterates into skilled people, many greenhorns into competent citizens. … Cities don’t lure the middle class. They create it.”

    Yet when cities did begin to come back—a handful in the ’80s and then again more around the time of the millennium—the revivals were in many ways the opposite of her grassroots vision. Instead of creating more family-oriented middle-class neighborhoods, the urban revival ended up being based on “luring” the affluent, the still forming young person, or the accomplished, childless professional than generating a new middle class.

    Witold Rybczynski noted in 2010 that the rise of successful urban cores increasingly has little in common with Jacobs’s romantic bottom-up organic urbanism:

    “The most successful urban neighborhoods have attracted not the blue-collar families that she celebrated, but the rich and the young. The urban vitality that she espoused—and correctly saw as a barometer of healthy city life—has found new expressions in planned commercial and residential developments whose scale rivals that of the urban renewal of which she was so critical. These developments are the work of real estate entrepreneurs, who were absent from the city described … but loom large today, having long ago replaced planners and our chief urban strategists.”

    As Rybczynski suggests, the current rise of “urban vitality” derives not from the idiosyncratic, diverse and, if you will, democratic form that Jacobs celebrated but in a more manufactured matter that at times outdoes suburbs for conformity and boredom.

    The Evisceration of the Urban Middle Class

    Jacobs’s vision failed in large part because today’s cities play a different economic role than they did in the past. The economic basis of her New York—small businesses, manufacturers, business service firms employing masses of middle-class workers—has declined while the city has evolved into what Jean Gottman called the “transactional metropolis,” dependent on the most elite financial services, high-end consumption, and the all too present media industry.

    This urban economy has many strengths but increasingly relies on the rich. A Citigroup study suggested that cities, particularly New York and London, have become “plutonomies”—economies driven largely by the wealthy class’s investment and spending. In this way the playground or luxury cores serve less as places of aspiration than geographies of inequality.

    New York, for example, is by some measurements the most unequal of American major cities: Gotham’s 1 percent earns a third of the entire city’s personal income—almost twice the proportion for the rest of the country.

    Other luxury cores exhibit similar patterns. A 2014 recent Brookings report found that virtually all the most unequal large central cities—with the exception of Atlanta and Miami—are dense, luxury-oriented cities such as San Francisco, Boston, Washington, New York, Chicago, and Los Angeles. Although high-wage jobs have increased in these metropolises, the bulk of new employment in cities like New York has been in low-wage service jobs.

    As urban studies author Stephen J.K. Walters notes, these cities tend to develop highly bifurcated economies, divided between an elite sector and large service class. He notes this is “the opposite of [Jane] Jacobs’s vision of cities” that relied on “transforming” poor people into the middle-class people

    Even diversity, often cited by Jacobs as a great asset of cities, has suffered. Among the most successful cities today are what analyst Aaron Renn has labeled “the white cities”—places like Boston, San Francisco, Seattle, and Portland, Oregon—which have historically been home to relatively small and now shrinking, minority populations. San Francisco’s black population is 35 percent lower than what it was in 1970. In the nation’s whitest major city, Portland, African-Americans are being driven out of the urban core by gentrification, partly supported by city funding. Similar phenomena can be seen inSeattle and Boston, where long existing black communities are rapidly shrinking.

    In the more diverse big cities like Los Angeles, New York, and Chicago, gentrification takes place alongside growing concentrations of poverty. It is often forgotten, according to demographer Wendell Cox, that 80 percent of the increase in urban core population in the last decade was from poor people; overall, despite the growth of poverty in suburbs, the core poverty rate remains more than twice as high.

    Nor is this situation necessarily improving. During the first 10 years of the new millennium, neighborhoods with entrenched urban poverty actually grew, increasing in numbers from 1,100 to 3,100 and in population from 2 million to 4 million. “This growing concentration of poverty,” note urban researchers Joe Cortright and Dillon Mahmoudi (PDF), “is the biggest problem confronting American cities.”

    We see this in places like Brooklyn and Chicago, two much-hyped epicenters of urban gentrification. Brooklyn’s poorer sections—a quarter of the residents are onfood stamps—have become even more so, notes analyst Daniel Hertz. Incomes between 1999 and 2001, he notes, dropped overall, falling in the poorer areas even as they soared in the more gentrified neighborhood closer to Manhattan and surrounding Prospect Park.

    Hertz found similar, if more extreme, phenomena in Chicago, which has also seen an unwelcome return to high crime rates, particularly in its poorer sections. Gentrification has indeed expanded into formerly working- and middle-class neighborhoods, but poverty and despair still characterize much of the city. As Chicago urban analyst Pete Saunders has put it: “Chicago may be better understood in thirds—one-third San Francisco, two-thirds Detroit.”

    Here Comes the Childless City

    Arguably Jacobs’s biggest miscalculation related to urban demographics. As H.G. Wells predicted well over a century ago, cities now depend in large part on affluent, childless people, living what Wells labeled a life of “luxurious extinction.” Jacobs’s contemporary, the great sociologist Herbert Gans, already identified a vast chasm between suburbanites and those who favor urban core living who he identified as “the rich, the poor, the non-white as well as the unmarried and childless middle class.”

    Jacobs never got this point, perhaps because she instinctively hated where families were in fact headed: the suburbs. Like many intellectuals in the ’50s and ’60s, she saw no need for suburbs, even as they experienced explosive growth, just dense city surrounded by traditional countryside.

    Perhaps nothing of Jacobs seems more dated than her assertion that “suburbs must be a difficult place to raise children.” She lovingly portrayed neighborhoods like her own West Village as ideal places where locals watched out for each other. She wrote about how “Mr. Lacey, the locksmith, bawls out one of my sons for running into the street, and then later reports the transgression to my husband as he passes the locksmith shop. Mr. Lacey, with whom we have no ties other than street propinquity, feels responsible for him to a degree.”

    At best, Jacobs’s compelling portrait from 1961 is something of an anachronism. Families in urban apartments today, notes Cornell researcher Gary Evans (PDF), generally have far weaker networks of neighbors than their suburban counterparts, a generally more stressful home life, and significantly less “social support.” Toronto author Phillip Preville notes, “In the years since, all the Mr. Laceys of the world have died and gone to downtown heaven,” he notes. “We can all talk Jane’s talk, but some people are pickled in Jane’s brine.”

    Certainly statistics back up Preville’s assertion. Greenwich Village today now largely consists of students, wealthy people, and pensioners. Despite the presence of many young people, children and teens between 5 and 17 account for only 6 percent of the Village’s population, far below the norms for New York City (PDF), and less than half the 13.1 percent found across the United States’s 52 largest metropolitan areas. Overall, Manhattan has among the lowest percentage of children in the country; a majority of its households are made up of singles.

    This pattern holds across the country. According to census data, in 2011 children 5-14 constitute about 7 percent in core districts across the country, roughly halfthe level seen in suburbs and exurbs. By 2011 people in their 20s constitute roughly one-quarter of the residents in urban cores, but only 14 percent or fewer of those who live in suburbs, where the bulk of people go as they start to reach the point of establishing families.

    Even in Toronto, generally seen as one of the world’s most livable cities and Jacobs’s chosen home, Statistics Canada notes that for every person who moved from the hinterlands to the city, 3.5 moved towards the periphery. The people most likely to move out are 25 to 44, people entering the stage of family formation. As one Torontonian, who recently moved to the suburbs, observed: “The big city has its uses. It served me well, and I served it back. Living in Toronto enabled me to transform my life in ways I dearly wanted: marriage, fatherhood, career advancement. That transformation has brought with it needs that Toronto cannot adequately provide: personal space, affordability, an emphasis on community over privacy. The intensity and the anonymity of the city now hinder my life more than they help. Simple as that. I’m outta here.”

    Overall, high-density cores, whether in Canada, America, or East Asia, consistently exhibit the lowest percentages of children. The far more ultra-dense cities of East Asia—Hong Kong, Singapore, and Seoul—exhibit the lowest fertility rates on the planet (PDF), sometimes less than half the number required simply to replace the current population. Due largely to crowding and high housing prices, 45 percent of couples in Hong Kong say they have given up on having children.

    In Asia people have few opportunities to move to lower-density housing. But in the United States, with abundant and often much cheaper land, super-urbanity often serves as a kind of way station in which people spend only a portion—often an exciting and career-enhancing one—of their lives. But when they grow older, and particularly when they decide to start families, they tend to leave for the periphery.

    Getting Beyond Nostalgia

    Nostalgia makes people feel good. Some still dream about a coming revival of diverse, child-friendly, dense city neighborhoods. They dream, in the words of oneauthor, of bringing us “back to the way we were, when most people lived in cities, did not own a car, walked or took the bus or train to work, and lived in much smaller residences.”

    Wishing to return to something that last predominated a half-century ago does not mean it will occur. Just as conservatives who hearken for a return to the ’50s are sure to be disappointed, urban advocates who suggest a “return to the city” for middle-class families will be as well. Both minorities and millennials, often thought of as spearheading a “back to the city” drive, are, according to most indicators, moving out to the suburbs as they enter their 30s and start families.

    Dense urbanity, of course, remains a huge contributor to the nation’s economy and culture. Urban centers are great places for the talented, the young, and childless affluent adults. But for most Americans, the central city offers at best a temporary lifestyle. It does not fit with what people can afford and where they want to live. There is a reason why 70 to 80 percent of Americans in our metropolitan areas live in suburbs, and those numbers are not likely to change appreciably in the coming decade.

    Cities, as Jacobs hoped, have indeed experienced a renaissance, but not in the form she preferred. To be sure, this revival is a hell of lot better than the urban dystopia that developed in the years after Jacobs’s Death and Life of Great American Cities first appearedBut it’s time to recognize that we are not seeing a renaissance of the kind of middle-class urbanity that she loved and championed. That city has passed into myth, and, unless society changes in very radical ways, it is never going to come back.

    This piece originally appeared at The Daily Beast.

    Joel Kotkin is executive editor of NewGeography.com and Roger Hobbs Distinguished Fellow in Urban Studies at Chapman University, and a member of the editorial board of the Orange County Register. He is also executive director of the Houston-based Center for Opportunity Urbanism. His newest book, The New Class Conflict is now available at Amazon and Telos Press. He is also author of The City: A Global History and The Next Hundred Million: America in 2050. He lives in Orange County, CA.

    By Phil Stanziola [Public domain], via Wikimedia Commons

  • Special Report: Maximizing Opportunity Urbanism with Robin Hood Planning

    This is the first section of a new report authored by Tory Gattis for the Center for Opportunity Urbanism titled Maximizing Opportunity Urbanism with Robin Hood Planning. Download the full report (pdf) here.

    Across America and the developed world, we face a well-reported crisis of income stagnation, rising inequality, a declining middle class, and a general lack of broad prosperity. Yet contemporary urban planning seems disconnected from this crisis, focusing instead on pedestrian aesthetics, environmentalism, and appealing to the supposed preferences of the wealthy and the “creative class.” This approach increasingly dominates urban thinking, expressed often as New Urbanism or Smart Growth. In this perspective, dense and usually older cities like New York, Portland, and San Francisco have been held up as models. For the most part, planners see their world through the perspective of an architect – an architect of the physical form of cities. But what if they tried the perspective of an economist – an architect of opportunities for people to have a better life?

    Cities matter far more than they used to as engines of opportunity and upward social mobility – the very essence of the American Dream. As the basis of the economy has shifted from industry to services, proximity to others now matters more than ever before. A factory can be anywhere and ship its products anywhere, but, generally speaking, most services need to be in-person. This is pushing more and more of the population to agglomerate around not so much cities, as defined by their political boundaries, but major metros, including numerous suburban rings, where the vast majority of the population resides. In many metros, limited housing supply has driven up home prices and rents to levels where much of the middle and working classes are either unable to buy or must pay a heavy portion of their incomes in mortgages or rents.

    This is occurring as economic and technological factors have directed ever more wealth to a relatively small population of elites, whose demand for specialized services – whether personal spending or that of the corporations they control – has become a major part of the economy. Economic opportunity is driven not just by proximity to others in general, but by proximity to the very small but critically influential super-affluent class – what Citigroup research calls the “Plutonomy”. iv In some markets, such as Miami, New York and San Francisco, the locational preferences of this class – who often have several residences and many are foreign buyers – has been yet another driver of major metro agglomeration and higher housing prices, particularly where there are strong land use regulations.

    Family sizes have shrunk and reduced fertility rates are leading towards destabilizing demographic implosions in Europe, Japan, and China – and the U.S. trend is moving in the same direction.vi As nations seek to improve fertility rates, one of the greatest challenges is a shortage of family-friendly housing with sufficient space. If that space is not affordable, then people do the next best alternative: shrink their family size. Whereas families used to be comfortable with multiple children per bedroom, the modern standard is one bedroom for every child – not to mention the “home office” for virtual work by the dual-income parents. With the large suburban house both regulatory out-of-favor and unaffordable in some metropolitan areas, families are forced to shrink to live in expensive density, or pay very high prices and rents for what used to be considered standard middle class homes.

    The planning community generally has few answers to these dilemmas, but in practice the steps they often advocate may actually be making it worse. A dominant tenet of Smart Growth actually seeks to restrict suburban development and encourage density to contain urban expansion. Draconian regulations – and ever higher costs – are piled on any new developments. On the other side, pressure from NIMBY homeowners often limits development of any kind – including high-density. In some areas, exclusionary zoning – such as tight restrictions on multi-family housing – is used to prevent minority, disadvantaged, or lower-income populations from moving in nearby.

    All in all, the net effect is a suffocating restriction on new housing supply even as demand increases, leading to skyrocketing home prices. This has the effect of making affluent NIMBY homeowners, who are disproportionately white and older, quite happy since their homes prices, sans new competition, are almost certain to increase. But the system works like a “Robin Hood in reverse” for younger, middle and working class families that lose out. This is a major driver of inequality – in fact, recent analysis indicates that homeownership completely accounts for the rise in inequality in recent decades. xii Planners have to take a hard look in the mirror and face an uncomfortable truth: whether they have been conscious of it or not, they have been direct accomplices in the rise of inequality and the decline of the middle and working class.

    Download the full report (pdf) from the Center for Opportunity Urbanism.

    Tory Gattis is a Founding Senior Fellow with the Center for Opportunity Urbanism, and co-authored the original Opportunity Urbanism studies. Tory writes the popular Houston Strategies blog and its twin blog at the Houston Chronicle, Opportunity Urbanist, where he discusses strategies for making Houston a better city. He is the founder of Coached Schooling, a startup to create a high-tech network of affordable private schools ($10/day) combining the best elements of eLearning, home and traditional schooling to reinvent the one-room schoolhouse for the 21st century. Tory is a McKinsey consulting alum, TEDx speaker, and holds both an MBA and BSEE from Rice University.

  • The Evolving Urban Form: Jing-Jin-Ji (Dispersing Beijing)

    China’s cities continue to add population at a rapid rate, despite a significant slowdown in population growth. Although overall population is expected to peak around 2030, the urban population will continue growing until after 2050. China’s cities will be adding more than 250 million new residents in the next quarter century, according to United Nations projections. China’s cities will add nearly as many people as live in Indonesia, the world’s fourth largest country, more than live in Brazil and 10 times as many as live in Australia.

    Two of China’s six megacities (urban areas with more than 10 million population) are nearly adjacent, within 90 miles (150 kilometers) of one another. The urban areas of Beijing and Tianjin have a combined population of 35 million and are among the fastest growing in the world. This is an increase of nearly 60% from the 2000 population of 21 million.

    The Jing-Jin-Ji Megalopolis

    The faster growing of the two, Beijing, is the national capital. Beijing is encircled by five freeway standard ring roads or beltways. These are numbered 2 through 6, with the first ring road being surrounding the Forbidden City. Its population is served by a number of additional expressways and the world’s longest subway. For some time there has been discussion of integrating the metropolitan areas of a much larger region. A principal purpose is dispersion — to redistribute activities, such as government administration and manufacturing away from Beijing’s congested core to peripheral locations.

    Over the past year, there have been various announcements describing the process. The  megalopolis would be called Jing-Jin-Ji, and would be composed of Beijing, Tianjin and Hebei province. An alternative name would be the "Capital Economic Circle." The name, Jing-Jin-Ji is constructed of the last syllables of "Beijing" and "Tianjin," along with "ji," which is the pronunciation of the one character Mandarin abbreviation for Hebei.

    The Need for Dispersal

    Beijing has just become too dense and too crowded. Traffic congestion already is among the worst in the world. According to The Sydney Morning Herald, the situation has become so bad that officials intended to limit the population of the Beijing municipality (province) to 23 million, only slightly above the population that is nearing 22 million. They also intend to reduce the population of central districts by 15%.

    Important steps are already being taken. Construction has begun on a new facility to house Beijing municipality functions in the suburban district ("qu") of Tongzhou. This subsidiary center is a 40 minute drive from the city center. Tongzhou borders the municipality of Tianjin and, according to the Beijing Municipality government is itself growing about one-quarter faster than the Beijing municipality itself.

    There are also plans to move many of the manufacturing facilities that have located in Beijing to the other jurisdictions. The extent of the manufacturing dominance of Beijing is illustrated by the much larger "floating population," of Beijing, which consists of migrants from other parts of the country who lack local residence permission (hukou). According to data in the China Yearbook 2014, Beijing has more than double the ratio to its population of migrant workers as Tianjin and nearly 10 times the ratio of Hebei, which has more than two-thirds of the megalopolis population.

    One large automobile manufacturer has already completed moving out of Beijing to Huanghua, a county level city in the Hebei municipality of Cangzhou, which borders Tianjin to the south.

    Geography of Jing-Jin-Ji

    The jurisdictions comprising Jing-Jin-Ji have approximately 110 million residents. The gross land area is approximately 216,000 square kilometers (83,000 square miles), approximately the land area of Romania or the US state of Idaho. No one, however, should imagine a Phoenix or Portland type sprawl of such a magnitude. As is indicated the Table, the overall population density of Jing-Jin-Ji is only 500 residents per square kilometer (1,300 per square mile).  The largest urban areas comprise only 3.5% of the land area, yet contain approximately 40% of the population. Despite the massive urbanization of Beijing and Tianjin, and the other large urban areas, Jing-Jin-Ji has a population that is 40% rural.

    Components of Jing-Jin-Ji
    Jurisdiction Total Population (2013) Density (per KM2) Principal Urban Area Population (2015) Urban Density (per KM2)
    Beijing 21.2      1,300 20.2      5,100
    Tianjin 14.7      1,200 10.9      5,400
    Jing-Jin-Ji Core 35.9      1,300 31.1      5,200
    Baoding 10.2         500 1.3      5,900
    Langfang 4.4         700 0.5      3,800
    Canzhou 7.2         500 0.5      3,800
    Tangshan 7.5         600 2.4      8,700
    Zhangzhiakow 4.6         100 1.2      9,200
    Qinhuangdao 2.9         400 1.0      6,500
    Chengde 3.7         100 0.1      4,300
    Inner Jing-Jin-Ji 40.5         300 7.0      6,600
    Shijiazhuang 10.4         700 3.4    17,000
    Handan 9.2         800 2.0    11,900
    Xingtai 7.1         600 0.7      6,000
    Henshui 4.3         500 0.4    11,800
    Outer Jing-Jin-Ji 31.0         600 6.5    12,500
    Jng-Jin-Ji 109.2         500 44.6      5,900
    Population in millions.
    Jurisdition population from government sources
    Urban area population from Demographia World Urban Areas


    The Nearby Urban Areas

    In addition to Tianjin, other urban areas are expected to gain functions, jobs and residents from Beijing. Baoding, an urban area to the southwest of Beijing is expected to gain hospitals, educational institutions and government offices. Baoding has a population of 1.3 million and is a former capital Hebei, but was displaced by Shijiazhuang in 1967. Shijiazhuang, with a population of 3,4 million, is located  in the outer ring of Jing-Jin-Ji.

    Langfang is unusual in being a discontinuous municipality, part of which is an enclave surrounded by Beijing and Tianjin (as is Hebei province), and the other part located to the south of both jurisdictions. Langfang is in the path of growth of both Beijing and Tianjin. The urban area of Langfang is still relatively small, with 500,000 residents. The urbanization along the Jingtang Expressway through Langfang nearly reaches the development of Beijing to the northwest and Tianjin to the southeast.

    Tangshan is directly north of Tianjin and east of Beijing. Tangshan seems likely to benefit from the dispersion of functions, jobs and residences by virtue of its proximity to both of the megacities. A new high speed rail line has just been announced that would connect Tangshan with Beijing in 30 minutes. Tangshan gained international notoriety in 1976 when it was struck by a devastating earthquake (photo here) that virtually flattened the city and killed at least 240,000 people (estimates of the earthquake death toll reach 800,000). Tangshan has been completely rebuilt, with impressive modern architecture (photograph above, taken from an earthquake memorial), but not appreciated by all. One architectural critic has insensitively bloviated that the new architecture "has been more destructive to Tangshan’s urban history than the great earthquake." Today, Tangshan is an urban area of 2.4 million.

    Qinhuangdao, an urban area of 1 million, lies just beyond (northeast of) Tangshan on the way to Shenyang and China’s Dongbei (Manchuria). Qinhuangdao could profit from its well placed seaport.

    Transportation Improvements

    Important transportation improvements have been announced. There are plans to expand Beijing’s subway, which already has the highest ridership in the world and is second longest (after Shanghai). New suburban train lines will be built and new high speed rail lines will connect the cities within Jing-Jin-Ji that are farther apart. There will be considerable expansion of the already comprehensive expressway system, including Beijing’s seventh ring road, which is to be fully completed by 2017. Already, approximately 400 kilometers have been completed, much of it through the mountains to the west of Beijing.

    Decentralizing Beijing

    Jing-Jin-Ji would be China’s third megalopolis, joining with the Yangtze Delta (centered on Shanghai) and Pearl River Delta (centered on an axis from Guangzhou to Shenzhen). But Jing-Jin-Ji is substantially different and not so obvious a candidate for integration. Jing-jin-ji’s urban areas are located farther apart than in the Pearl or the Yangtze. Yet its concentration of development is greater, especially in the Beijing core, which provides much of the justification for decentralization.

    Wendell Cox is Chair, Housing Affordability and Municipal Policy for the Frontier Centre for Public Policy (Canada), is a Senior Fellow of the Center for Opportunity Urbanism (US), a member of the Board of Advisors of the Center for Demographics and Policy at Chapman University (California) and principal of Demographia, an international public policy and demographics firm.

    He is co-author of the "Demographia International Housing Affordability Survey" and author of "Demographia World Urban Areas" and "War on the Dream: How Anti-Sprawl Policy Threatens the Quality of Life." He was appointed to three terms on the Los Angeles County Transportation Commission, where he served with the leading city and county leadership as the only non-elected member. He served as a visiting professor at the Conservatoire National des Arts et Metiers, a national university in Paris. 

    Photograph: Tangshan’s modern architecture, from an earthquake memorial (by author)

  • Countering Progressives’ Assault on Suburbia

    The next culture war will not be about issues like gay marriage or abortion, but about something more fundamental: how Americans choose to live. In the crosshairs now will not be just recalcitrant Christians or crazed billionaire racists, but the vast majority of Americans who either live in suburban-style housing or aspire to do so in the future. Roughly four in five home buyers prefer a single-family home, but much of the political class increasingly wants them to live differently.

    Theoretically, the suburbs should be the dominant politically force in America. Some 44 million Americans live in the core cities of America’s 51 major metropolitan areas, while nearly 122 million Americans live in the suburbs. In other words, nearly three-quarters of metropolitan Americans live in suburbs.

    Yet it has been decided, mostly by self-described progressives, that suburban living is too unecological, not mention too uncool, and even too white for their future America. Density is their new holy grail, for both the world and the U.S. Across the country efforts are now being mounted—through HUD, the EPA, and scores of local agencies—to impede suburban home-building, or to raise its cost. Notably in coastal California, but other places, too, suburban housing is increasingly relegated to the affluent.

    The obstacles being erected include incentives for density, urban growth boundaries, attempts to alter the race and class makeup of communities, and mounting environmental efforts to reduce sprawl. The EPA wants to designate even small, seasonal puddles as “wetlands,” creating a barrier to developers of middle-class housing, particularly in fast-growing communities in the Southwest. Denizens of free-market-oriented Texas could soon be experiencing what those in California, Oregon and other progressive bastions have long endured: environmental laws that make suburban development all but impossible, or impossibly expensive. Suburban family favorites like cul-de-sacs are being banned under pressure from planners.

    Some conservatives rightly criticize such intrusive moves, but they generally ignore how Wall Street interests and some developers see forced densification as opportunities for greater profits, often sweetened by public subsidies. Overall, suburban interests are poorly organized, particularly compared to well-connected density lobbies such as the developer-funded Urban Land Institute (ULI), which have opposed suburbanization for nearly 80 years. 

    The New Political Logic

    The progressives’ assault on suburbia reflects a profound change in the base of the Democratic Party. As recently as 2008, Democrats were competitive in suburbs, as their program represented no direct threat to residents’ interests. But with the election of Barack Obama, and the continued evolution of urban centers as places with little in the way of middle-class families, the left has become increasingly oriented towards dense cities, almost entirely ruled by liberal Democrats.

    Obama’s urban policies are of a piece with those of “smart growth” advocates who want to curb suburban growth and make sure that all future development is as dense as possible.  Some advocate radical measures such as siphoning tax revenues from suburbs to keep them from “cannibalizing” jobs and retail sales. Some even fantasize about carving up the suburban carcass, envisioning three-car garages “subdivided into rental units with street front cafés, shops and other local businesses” while abandoned pools would become skateboard parks.

    At the end of this particular progressive rainbow, what will we find? Perhaps something more like one sees in European cities, where the rich and elite cluster in the center of town, while the suburbs become the “new slums” that urban elites pass over on the way to their summer cottages.

    Political Dangers

    The abandonment of the American Dream of suburban housing and ownership represents a repudiation of what Democrats once embraced and for which millions, including many minorities, continue to seek out. “A nation of homeowners,” Franklin D. Roosevelt asserted, “of people who own a real share in their land, is unconquerable.”

    This rhetoric was backed up by action. It was FDR, and then Harry Truman, who backed the funding mechanisms—loans for veterans, for example—that sparked suburbia’s growth. Unlike today’s progressives, the old school thought it good politics to favor those things that most people aspire to achieve. Democrats gained ground in the suburbs, which before 1945 had been reliably and overwhelmingly Republican.

    Even into the 1980s and beyond, suburbanites functioned less as a core GOP constituency than as the ultimate swing voters. As urban cores became increasingly lock-step liberal, and rural Democrats slowlyfaded towards extinction, the suburbs became the ultimate contested territory. In 2006, for example, Democrats won the majority of suburban voters. In 2012, President Obama did less well than in 2008, but still carried most inner and mature suburbs while Romney trounced him in the farther out exurbs. Overall Romney eked out a small suburban margin.

    Yet by 2014, as the Democratic Party shifted further left and more urban in its policy prescriptions, these patterns began to turn.  In the 2014 congressional elections, the GOP boosted its suburban edge to 12 percentage points. The result was a thorough shellacking of the Democrats from top to bottom. 

    Will demographics lead suburbs to the Democrats?

    Progressive theory today holds that the 2014 midterm results were a blast from the suburban past, and that the  key groups that will shape the metropolitan future—millennials and minorities—will embrace ever-denser, more urbanized environments. Yet in the last decennial accounting, inner cores gained 206,000 people, while communities 10 miles and more from the core gained approximately 15 million people.

    Some suggest that the trends of the first decade of this century already are passé, and that more Americans are becoming born-again urbanistas. Yet after a brief period of slightly more rapid urban growth immediately following the recession, U.S. suburban growth rates began to again surpass those of urban cores. An analysis by Jed Kolko, chief economist at the real estate website Trulia, reports that between 2011 and 2012 less-dense-than-average Zip codes grew at double the rate of more-dense-than-average Zip codes in the 50 largest metropolitan areas. Americans, he wrote, “still love the suburbs.”

    What is also missed by the Obama administration and its allies is the suburbs’ growing diversity. If HUD wants to start attacking these communities, many of their targets will not be whites, but minorities, particularly successful ones, who have been flocking to suburbs for well over a decade.

    This undermines absurd claims that the suburbs need to be changed in order to challenge the much detested reign of “white privilege.” In reality, African-Americans have been deserting core cities for years, largely of their own accord and through their own efforts: Today, only 16 percent of the Detroit area’s blacks live within the city limits.

    These trends can also be seen in the largely immigrant ethnic groups. Roughly 60 percent of Hispanics and Asians, notes the Brooking Institution, already live in suburbs. Between the years 2000 and 2012, the Asian population in suburban areas of the nation’s 52 biggest metro areas grew by 66 percent, while that in the core cities expanded by 35 percent. Of the top 20 areas with over 50,000 in Asian population, all but two are suburbs.

    Left to market forces and natural demographic trends, suburbs are becoming far more diverse than many cities, meaning that in turning on suburbia, progressives are actually stomping on the aspirations not just of privileged whites but those of many minorities who have worked hard to get there.

    Another huge misreading of trends relates to another key Democratic constituency, the millennial generation.  Some progressives have embraced the dubious notion that millennials won’t buy cars or houses, and certainly won’t migrate to the suburbs as they marry and have families. But those notions are rapidly dissolving as millennials do all those things. They are even—horror of horrors!—shopping atWal-Mart, and in greater percentages than older cohorts.

    Moreover, notes Kolko, millennials are not moving to the denser inner ring suburban areas. They are moving to the “suburbiest” communities, largely on the periphery, where homes are cheaper, and often schools are better. When asked where their “ideal place to live,” according to a survey by Frank Magid and Associates, more millennials identified suburbs than previous generations. Another survey in the same year, this one by the Demand Institute, showed similar proclivities.

    Stirrings of Rebellion

    So if the American Dream is not dead among the citizens, is trying to kill it good politics? It’s clear that Democratic constituencies, notably millennials, immigrants and minorities, and increasingly gays—particularly gay couples—are flocking to suburbs. This is true even in metropolitan San Francisco, where 40 percent of same-sex couples live outside the city limits.

    One has to wonder how enthusiastic these constituents will be when their new communities are “transformed” by federal social engineers. One particularly troubling group may be affluent liberals in strongholds such as Marin County, north of San Francisco, long a reliable bastion of progressive ideology.

    Forced densification–the ultimate goal of the “smart growth” movement—also has inspired opposition in Los Angeles, where densification is being opposed in many neighborhoods, as well as traditionally more conservative Orange Country. Similar opposition has arisen in Northern Virginia suburbs, another key Democratic stronghold.

    These objections may be dismissed as self-interested NIMBYism, but this misses the very point about why people move to suburbs in the first place. They do so precisely in to avoid living in crowded places. This is not anti-social, as is alleged, but an attempt—natural in any democracy—to achieve a degree of self-determination, notes historian Nicole Stelle Garrett.

    Aroused by what they perceive as threats to their preferred way of life, these modern pilgrims can prove politically effective. They’ve shown this muscle while opposing plans not only to increase the density in suburbs, and also balking at the shift of transportation funding from roads, which suburbanites use heavily, to rail transit. This was seen in Atlanta in 2012 when suburban voters rejected a mass transit plan being pushed by downtown elites and their planning allies. Opposition to expanding rail service has also surfaced in the Maryland suburbs of Washington.

    Suburbs and 2016 Election

    To justify their actions against how Americans prefer to live, progressives will increasingly cite the environment. Climate change has become the “killer app” in the smart growth agenda and you can expect the drumbeat to get ever louder towards the Paris climate change conference this summer.

    Yet the connection between suburbs and climate is not as clear as the smart growth crowd suggests.  McKinsey and other studies found no need to change housing patterns to reduce greenhouse gases, particularly given improvements in both home and auto efficiency. Yet so great is their animus that many anti-suburban activists seem to prefer stomping on suburban aspirations rather seeking ways to make them more environmental friendly.

    As for the drive to undermine suburbs for reasons of class, in many ways the  assault on suburbia is, in reality,  a direct assault on our most egalitarian geography. An examination of American Community Survey Data for 2012 by the University of Washington’s Richard Morrill indicates that the less dense suburban areas tended to have “generally less inequality” than the denser core cities; Riverside-San Bernardino, for example, is far less unequal than Los Angeles; likewise, inequality is less pronounced in Sacramento than San Francisco. Within the 51 metropolitan areas with more than 1 million people, notes demographer Wendell Cox, suburban areas were less unequal (measured by the GINI Coefficient) than the core cities in 46 cases.

    In the coming year, suburbanites should demand more respect from Washington, D.C., from the media, the political class and from the planning community. If people choose to move into the city, or favor density in their community, fine. But the notion that it is the government’s job to require only one form of development contradicts basic democratic principles and, in effect, turns even the most local zoning decision into an exercise in social engineering.

    As America’s majority, suburbanites should be able to deliver a counterpunch to those who seem determined to destroy their way of life. Irrespective of race or generation, those who live in the suburbs—or who long to do so—need to understand the mounting threat to their aspirations  Once they do, they could spark a political firestorm that could reshape American politics for decades to come.

    This piece first appeared at Real Clear Politics.

    Joel Kotkin is executive editor of NewGeography.com and Roger Hobbs Distinguished Fellow in Urban Studies at Chapman University, and a member of the editorial board of the Orange County Register. He is also executive director of the Houston-based Center for Opportunity Urbanism. His newest book, The New Class Conflict is now available at Amazon and Telos Press. He is also author of The City: A Global History and The Next Hundred Million: America in 2050. He lives in Orange County, CA.

    Suburbs photo courtesy of BigStockPhoto.com.

  • Some Kindly Advice From an Old White Guy

    Last month I bought an old fixer-upper for $15,000 in Cincinnati. It was originally offered at $17,000, but I got the sellers down a bit. The place is a complete disaster. All the copper pipes and wires have been stripped out of the building. It hasn’t seen paint for decades. Every window and door needs to be replaced. The roof is shot. There’s no insulation of any kind. The yard is a mess. And there are plenty of similar houses in the neighborhood. So why exactly did I buy it? I’ll get to that in a minute.


    Screen Shot 2015-06-20 at 2.39.06 PMGoogle

    Screen Shot 2015-06-20 at 3.43.32 PMGoogle

    Screen Shot 2015-06-20 at 2.51.09 PMGoogle

    But first I want to relate a conversation I had with a contractor this morning. He’s an older man who lives in the distant suburbs and has very definite opinions about the city. He spoke to me in a kindly grandfather voice. “Do you understand where this house is? Do you know what kind of people live there?” He used some colorful language which I won’t repeat. Let’s just say he’s a white guy of a particular generation from the South… He advised me to take the money I’m about to spend renovating the house and use it to buy a nice big new home on a good sized piece of land across the river in Kentucky instead.

    If this were 1980, or 1990, or 2000 this man’s recommendation would have been entirely valid from an economic perspective. Inner city neighborhoods all over the country were hemorrhaging population, jobs, and revenue for decades. It would have been a disastrous investment. But times have changed. Not everyone has noticed.

    Screen Shot 2015-06-20 at 1.15.34 PMGoogle

    Screen Shot 2015-06-20 at 1.16.17 PMGoogle

    Screen Shot 2015-06-20 at 1.11.49 PMGoogle

    Screen Shot 2015-06-20 at 1.12.31 PMGoogle

    Screen Shot 2015-06-20 at 2.12.12 PMGoogle

    Screen Shot 2015-06-20 at 2.12.43 PMGoogle

    Screen Shot 2015-06-20 at 2.19.56 PMGoogle

    Screen Shot 2015-06-20 at 2.20.21 PMGoogle

    Here are some before and after photos of buildings in the immediate neighborhood curtesy of Google Street View. Since the Google van has driven by a few times in the last decade it’s possible to see the same buildings from the perspective of different years. People have consistently been buying up cheap run down properties, fixing them up, and incrementally improving the neighborhood. This is no longer a place of permanent decline and disinvestment. The area hit bottom a few years back and it’s already on the way back up. It’s not entirely there yet, but it’s well on its way.

    Screen Shot 2015-06-20 at 1.17.02 PMGoogle

    Screen Shot 2015-06-20 at 1.17.35 PMGoogle

    In addition to recently renovated older buildings, vacant lots are sprouting quality new construction. These two homes are LEED certified for energy efficiency.

    Screen Shot 2015-06-20 at 2.30.02 PMGoogle

    GantryUAV21gantrylife.com / bayerbecker.com

    CornerView copy1_0csoinc.net / bayerbecker.com

    A few blocks away a larger vacant parcel is currently being redeveloped into a market rate multi-million dollar mixed use building by an out-of-state firm. I’ve noticed that local companies don’t always appreciate their own assets, but plenty of well funded ventures from other metro areas are taking advantage of the opportunities on offer in Cincinnati.

    Screen Shot 2015-06-20 at 4.57.52 PMGoogle

    Screen Shot 2015-06-20 at 4.56.41 PMGoogle

    unnamed-3

    unnamed-1

    Right next door is the American Can Lofts building which was completely transformed in 2011 after siting empty since 1978. I arrived in Cincinnati for the first time a few years ago just as this building was having its grand reopened. That takes me to how a guy from San Francisco ended up looking at property in Cincinnati in the first place. Which takes me to why I think Cincinnati is such a great investment.

    Screen Shot 2014-12-05 at 1.11.18 AM

    Screen Shot 2014-12-05 at 1.05.23 AM

    Screen Shot 2014-12-05 at 1.11.59 AM

    I have long time friends-of-the-family in Los Angeles. Their daughter graduated from university, got married, and promptly left California. She and her husband explored the country looking for a place to live that they both liked and could afford. (That ruled out nearly every inch of California.) They lived in Baltimore, Maryland for a while and then Portland, Oregon for a year before moving to Cincinnati. They could afford Baltimore and appreciated its gritty charm. But they really loved Portland – give or take the ridiculously high rent and real estate values. What they wanted was Portland at a Baltimore price.

    And then they moved to Cincinnati. Ahhhhhh. They bought a charming century old four bedroom house in perfectly good condition for $50,000. It was the best thing any young couple could have done, both financially and in terms of their quality of life. If they had stayed in Los Angeles or Portland they would still be renting (with room mates) and just scraping by. In Cincinnati they became comfortably middle class home owners at the tender age of twenty five. Their mortgage is $400 a month. And they’ve had no trouble finding good work or like minded friends. They aren’t the only young people making this kind of move. Which is probably why out-of-state developers are investing in the city.

    The odd thing about Cincinnati is that while the existing housing stock is very reasonably priced, good quality space is commanding fairly high rents. Apartments in the America Can building go for $610 for a one bedroom up to $1,480 for a three bedroom – and there’s a waiting lists. My inner capitalist sees a generous spread between affordable property and the potential for solid rent from solvent tenants. If I can provide a high quality building I believe I can find good people to occupy the space at a rent that’s reasonable for them and profitable for me. And I can do it without taking on debt and without being a slumlord. Try that in San Francisco and see how far you get…

    I just hired a young local architect to help with the reconstruction. This is going to be a fun little adventure. And I’m really happy that old guy who was trying to give me advice lives in the distant suburbs. He’d be a terrible neighbor.

    John Sanphillippo lives in San Francisco and blogs about urbanism, adaptation, and resilience at granolashotgun.com. He’s a member of the Congress for New Urbanism, films videos for faircompanies.com, and is a regular contributor to Strongtowns.org. He earns his living by buying, renovating, and renting undervalued properties in places that have good long term prospects. He is a graduate of Rutgers University.

  • Commuting in London

    According to the 2011 census, the London commuter shed — defined here as the of London (the Greater London Authority, or GLA) and the East and Southeast regions of England — had a 2013 population of 23.2 million, spread over an area of 15,400 square miles (39,800 square kilometers).

    For this analysis, the area is divided into five parts, including the central business district (CBD), the balance of Inner London, Outer London, the inner counties, which are largely adjacent to London and the outer counties. Counties are largely only ceremonial at this point and used for geographical convenience. In many counties, unitary local authorities have been established that replace part or all of the previous county geographic authority.

    The central business district is situated in a wide corridor on both sides of the Thames River. It is contained in five local authority areas, including the city of London, the city of Westminster and the boroughs of Camden, Southwark and Lambeth. All of central London’s eight largest rail stations are in these five areas, and central business district commuters rely to a substantial degree on its suburban rail system.

    Inner London roughly corresponds to the London County Council area as it existed before creation of the Greater London Council (GLC) in 1965. Outer London includes the boroughs that were added in the establishment of the GLC which was abolished in 1986. A new, London authority (the GLC) was created  in 2000, with a considerably scaled back portfolio of responsibilities, principally transport, police, fire, emergency services and planning. GLA has 33 local authorities, 32 of which are popularly referred to as boroughs, plus the City of London (the one square mile historic core). The local authorities which are responsible for a many local public services, and constituted London’s only local government between 1986 and 2000.

    The inner counties border on the metropolitan greenbelt, which surrounds London (Note). They are Berkshire Buckinghamshire, Essex, Hertfordshire, Kent and Surrey. The outer counties are Cambridgeshire, East Sussex, Hampshire, Isle of Wight, Norfolk, Oxfordshire, Suffolk and West Sussex.

    Distribution of Employment

    As of the 2011 census, the local authority areas containing the central business district had approximately 1.4 million jobs, or approximately 15 percent of the jobs in the London area. The rest of GLA, including the balance of inner London and Outer London has 25 percent of the employment. The outer counties have the largest number of jobs, at 2.7 million, comprising 30 percent of London area employment. The inner counties have nearly as many jobs, at 2.6 million, or 29 percent of employment. Thus, the suburban areas outside the Greenbelt have nearly 60 percent of the London area employment (Figure 1).

    Where People Live and Work

    The local authority areas containing the CBD have the greatest imbalance between resident workers and jobs. There are 3.35 jobs for each resident worker in these areas. The ratio of jobs to resident workers is much closer in the balance of Inner London, with a ratio of 1.04 jobs per employee. The least balanced is Outer London, with only 0.73 jobs per employee. The inner counties have the second highest ratio, at 0.93 jobs per employee. Surprisingly, the outer counties have the ratio closest to 1.00, at 0.99 jobs per employee (Figure 2). This parallels our findings of America’s only city with anything like London’s pedigree, New York.

    Most employees work in the sector of their residence. About 65 percent of CBD local authority area residents work in the CBD area (Figure 3). Outside-the-greenbelt commuters work in their own sector to a greater degree. In the outer counties 88 percent work in their home sectors, while 75 percent of inner counties commuters work in their own sectors. The balance of Inner London has the lowest percentage of employees working in their own sectors (41 percent), while Outer London is somewhat higher, at 50 percent.

    Commuting to Central London

    Despite its strong CBD, the London area is anything but monocentric. Approximately 85 percent of London area jobs are outside the central business district. Yet London comparative data from nearly two decades ago placed London’s CBD at fourth largest in the world, trailing Tokyo, New York and slightly behind Osaka. With London’s strong economic growth since that time, London has probably passed Osaka, which has faced more difficult economic times.

    The overwhelming majority of jobs in the London CBD are filled by GLA residents, with more than 75 percent of commuters living in the balance of Inner London or Outer London (Figure 4). This leaves only a quarter living in the exurban areas beyond the greenbelt. Approximately 17 percent of CBD commuters travel from the inner counties, adjacent to the Greenbelt. Only 5 percent travel from the outer counties. Less than three percent of CBD commuters travel from beyond the London area, which may be surprising given the plentiful higher speed (as opposed to genuine high speed) rail services.

    How Commuters Travel

    More than half of Londoners commute to work by car or other light vehicles (including car pools). Transit accounts for about a quarter of commuting, while about 10 percent of commuters walk to work. Approximately six percent usually labor mainly at or from home (Figure 5).

    Among mass transit commuters, suburban rail systems account for the largest share, at 37 percent, underground (metro) and light rail 33 percent and buses 30 percent. Over the past three decades there has been a substantial increase in bus ridership, principally from expanded services financed with savings from competitive tendering (also called competitive contracting) and additional services added later in conjunction with London’s inner congestion pricing zone. Competitive contracting involves use of competitively selected private companies to operate services. London’s "red bus" system — which is fully integrated in its fare, route structure and vehicle livery with its many double deck buses is virtually all operated by the private sector through competitive tendering.

    Minicentric London?

    In some ways, London is one of the world’s most dispersed cities, largely due to the discontinuous development encouraged by the greenbelt. The greenbelt imposes a substantial distance penalty for commuters from the inner and outer counties to the CBD, whether by car or train. This is in considerable contrast to Western Europe’s other megacity, Paris, which is far more compact in its metropolitan development, despite having a considerably weaker CBD. London also demonstrates that the age of the monocentric metropolitan area is largely a thing of the past in high income world cities. With less than one-sixth of metropolitan employment in the CBD, "minicentric" might be a more accurate characterization.

    Note: Housing development is prohibited on the metropolitan greenbelt, which surrounds London (GLA). The metropolitan greenbelt covers three times the land area of the GLA. Virtually all population growth over the past 85 years in the London area has occurred outside the greenbelt. The inner and outer counties have added more than 7 million residents over the since the 1931 census, while London itself has added approximately 500,000 residents.

    The metropolitan is a cornerstone of London’s urban containment policy, which also applies throughout the United Kingdom. Housing development is banned on the greenbelt and the U.K.’s urban containment policy has been associated with a substantial rise in house prices relative to incomes (see: The Barker Review of Housing Supply, the Barker Review of Land Use Planning and The Costs of Smart Growth: A 40 Year Perspective).

    Wendell Cox is Chair, Housing Affordability and Municipal Policy for the Frontier Centre for Public Policy (Canada), is a Senior Fellow of the Center for Opportunity Urbanism (US), a member of the Board of Advisors of the Center for Demographics and Policy at Chapman University (California) and principal of Demographia, an international public policy and demographics firm.

    He is co-author of the "Demographia International Housing Affordability Survey" and author of "Demographia World Urban Areas" and "War on the Dream: How Anti-Sprawl Policy Threatens the Quality of Life." He was appointed to three terms on the Los Angeles County Transportation Commission, where he served with the leading city and county leadership as the only non-elected member. He served as a visiting professor at the Conservatoire National des Arts et Metiers, a national university in Paris. 

    Photo: Traffic in London (by author)

  • Commuting in New York

    The New York commuter shed (combined statistical area) is the largest in the United States, with 23.6 million residents spread across 13,900 square miles in New York, New Jersey, Connecticut and Pennsylvania. It includes 35 counties, in eight metropolitan areas, including New York (NY-NJ-PA), Allentown-Bethlehem (PA-NJ), Bridgeport-Stamford (CT), East Stroudsburg (PA), Kingston (NY), New Haven (CT), Torrington (CT) and Trenton (NJ). The criteria for designation of combined statistical areas is here and Figure 1 is a map of the New York CSA.

    This article examines employment and commuting in the New York area by broad geographic sector. The core sector, of course, is Manhattan (New York County). The second sector is the balance of the city of New York, the outer boroughs of the Bronx, Brooklyn, Queens and Staten Island. The inner counties are Westchester and Nassau in New York as well as Bergen, Essex, Hudson, Middlesex, Passaic and Union in New Jersey. The balance of the CSA is in the outer counties.

    Distribution of Employment

    The New York CSA is home to the world’s second largest central business district (CBD). Only Tokyo’s Yamanote Loop has more employment. Overall, Manhattan (New York County) has 2.4 million jobs, with approximately 2.0 million jobs in the CBD, which covers virtually all of the area to the south of 59th Street. Yet, despite this impressive statistic, unmatched anywhere in the country, Manhattan contains only 22 percent of the employment in the New York area. The largest portion of employment is in the outer counties, with 32 percent (Figure 2). Combined, the inner and outer county suburbs represent 60 percent of the jobs in the New York commuting shed.

    Where People Live and Work

    The distribution of employee residences contrasts sharply with that of employment. Manhattan displays the most extreme imbalance between jobs and where people live. (Figure 3). There are nearly three times as many jobs as resident employees in Manhattan (2.8 jobs per resident employee). The most evenly balanced sector is the outer counties, which are at near parity, with 0.97 jobs for every resident employee. The outer counties are relatively balanced, with 0.87 jobs per resident employee. The balance of New York City has 2.7 million resident workers and only 1.9 million jobs. There are only 0.68 jobs per resident employee. When the entire city is considered, including Manhattan, there is a much closer balance, with 1.16 jobs per resident worker.

    Most employees work in their sector of residence. About 85 percent of Manhattan residents work in Manhattan. Nearly 79 percent of outer county residents work in the outer counties, while 71 percent of inner county residents work in the inner counties. Perhaps surprisingly, nearly two-thirds as many inner county residents work in the outer counties as work in Manhattan. Only 55 percent of resident workers in the four outer boroughs of New York City work in the outer boroughs (Figure 4)

    Commuting to Manhattan

    One of the most enduring urban myths is built around the idea of the monocentric city. This is the conception that most people work downtown (the CBD). This has been an inaccurate characterization for decades, even in New York. In New York, as noted above, the CBD accounts for little more than 20 percent of employment. By comparison, however, this is a substantial number compared to other large North American commuter sheds. The Chicago CSA, for example (the Loop) has about 11 percent of its employment downtown (the Loop), Toronto has less than 15 percent and Los Angeles is under two percent.

    The overwhelming majority of jobs in Manhattan are filled by local residents or nearby commuters. According to American Community Survey "flow" data for 2006-2010, 73 percent of Manhattan commuters live in Manhattan or in the balance of New York City. Another 18 percent of commuters travel from the inner counties. This leaves less than eight percent of commuters traveling from the outer counties. Less than two percent of commuters travel to Manhattan from outside the CSA (Figure 5).

    How Commuters Travel

    New York relies on transit far more than any other US commuter shed. Overall approximately 27 percent of work trip travel is on transit. However, the extent of transit use varies widely by sector. Transit accounts for 75 percent of work trip travel to Manhattan employment. Transit also has a significant market share to jobs in the outer boroughs (38 percent). Jobs in the city of New York account for 88 percent of the transit commuting in the CSA. Outside the city, transit carries a much smaller share. In the inner counties, transit captures nine percent of commuters, while accounting for a much smaller 2.6 percent in the outer counties. In the outer counties, transit’s market share is slightly more than one-half the national average (Table).

    Cars have the largest work trip market share in every commuter shed in the nation, including the New York area, where they provide 61 percent of trips. Again, however, there is a very wide variation between the sectors. Cars provide less than 15 percent of commute trips to jobs in Manhattan. They provide a larger 44 percent share in the outer boroughs. In the inner counties and outer counties, cars are strongly dominant, providing for 80 percent and 88 percent of the commutes respectively.

    The walking commuter share is lower than might be expected in famously pedestrian oriented Manhattan. Manhattan has by far the densest urbanization in the United States. With more than 70,000 residents per square mile (28,000 per square kilometer), Manhattan is nearly four times as dense as San Francisco, which has the highest density of any large municipality in the US outside New York. With such a high density, and a job density of more than 100,000 per square mile (nearly 40,000 per square kilometer), it may be surprising that workers in the outer boroughs rely on walking to work to a greater extent. Walking has a 7.4 percent commuting share in Manhattan, and a 9.6 percent share in the outer boroughs, despite their much lower population and employment densities.

    Table
    New York CSA Means of Transportation: Work Location: 2013
    Area Drive Alone Car Pool Transit Bicycle Walk Other Work at Home
    Manhattan 10.0% 2.7% 74.7% 1.0% 7.4% 1.8% 2.4%
    Balance: NYC 37.0% 7.3% 38.7% 1.1% 9.6% 1.4% 4.8%
    Inner Counties 71.6% 8.6% 9.4% 0.3% 4.2% 1.7% 4.2%
    Outer Counties 79.6% 8.6% 2.6% 0.3% 2.8% 1.1% 5.0%
    New York CSA 54.3% 7.1% 26.9% 0.6% 5.4% 1.5% 4.2%
    Exhibit: United States 76.4% 9.4% 5.2% 0.6% 2.8% 1.3% 4.4%
    Calculated from American Community Survey


    The faster work commute trips of cars is illustrated in the sectoral analysis. Automobile commuting is most dominant in the outer county suburbs, which have the largest number of resident workers and jobs. The average one-way work trip travel time is 24.7 minutes in the outer counties, little more than one half the 49.7 minute one way trip to jobs in Manhattan. The inner counties have the second shortest travel time, at 28.5 minutes. Jobs in the outer boroughs of New York City have an average work trip travel time of 36.4 minutes (Figure 7).

    A Dispersed Commuter Shed

    Despite its reputation for monocentricity, and its primacy in terms of the sheer numbers of core area employees, the New York combined statistical area remains surprisingly dispersed when it comes to jobs, contrary to popular accounts, although less so than others.

    —–

    Wendell Cox is Chair, Housing Affordability and Municipal Policy for the Frontier Centre for Public Policy (Canada), is a Senior Fellow of the Center for Opportunity Urbanism (US), a member of the Board of Advisors of the Center for Demographics and Policy at Chapman University (California) and principal of Demographia, an international public policy and demographics firm.
    He is co-author of the "Demographia International Housing Affordability Survey" and author of "Demographia World Urban Areas" and "War on the Dream: How Anti-Sprawl Policy Threatens the Quality of Life." He was appointed to three terms on the Los Angeles County Transportation Commission, where he served with the leading city and county leadership as the only non-elected member. He served as a visiting professor at the Conservatoire National des Arts et Metiers, a national university in Paris. 

    Photograph: Inner County New York CSA: City of Elizabeth, seat of Union County, New Jersey (by author)

  • America’s Largest Commuter Sheds (CBSAs)

    Core Based Statistical Area (CBSA) is the Office of Management and Budget’s (OMB) way of defining metropolitan regions.  The OMB (not the Census Bureau) defines criteria for delineating its three metropolitan concepts, combined statistical areas, metropolitan statistical areas, and micropolitan statistical areas. The CBSA has obtained little use since this adoption for the 2000 census. According to OMB:

    "A CBSA is a geographic entity associated with at least one core of 10,000 or more population, plus adjacent territory that has a high degree of social and economic integration with the core as measured by commuting ties."

    In this context, core means urban area. If an urban area has 50,000 or more population, OMB defines a metropolitan area around it. If an urban area has 10,000 or more population but fewer than 50,000 residents, OMB defines a micropolitan area around it.

    It is also important to understand that CBSAs, whether CSAs, metropolitan areas, or micropolitan areas are not urban areas. In fact, 94% of the area in CBSAs is rural — only 6% is urban (built-up urban cores and suburbs).

    Combined statistical areas (CSAs) are made up of adjacent CBSAs that have a significant amount of commuting between them, but less than required for a metropolitan area or a micropolitan area. In some cases the CSAs seem so obvious as to make the smaller metropolitan area definitions seem ludicrous. One keen observer, Michael Barone of the Washington Examiner, put San Francisco and San Jose, as well as Los Angeles and Riverside-San Bernardino together in his recent analysis of population growth, because, as he rightly pointed out, they seem to "flow together."

    Some CSAs are very large. For example the New York CSA is composed of 8 metropolitan areas (New York (NY-NJ-PA), Bridgeport (CT), New Haven (CT), Trenton (NJ), Allentown (PA-NJ), Kingston (NY). Torrington (CT) and East Stroudsburg (PA). On the other hand, many major metropolitan areas are not a part of a CSA, such as Phoenix and San Diego.

    Since the term CBSA seems unlikely to achieve popular usage, this article uses the term "commuter shed" to denote the highest local level of metropolitan definition.  The highest level for the largest regions are is the combined statistical area (CSA). In others they are defined as a metropolitan area or micropolitan area. The result is a consistent standard of economic geography defined by commuting. Yet such lists are rare or non-existent. A table of all 569 commuter sheds (over 1,000,000 population) is posted to demographia.com.

    10 Largest Commuter Sheds

    As a 2014, there were 60 commuter sheds in the United States with more than 1 million population (Table).

    Not surprisingly, the nation’s largest commuter shed is New York. New York stretches from New Haven and Bridgeport, and Connecticut which are separate metropolitan areas out to Allentown which is principally in Pennsylvania and Trenton in New Jersey. The New York commuter shed has a population of 23.6 million. In fact, given the extensive suburban rail transit service between Southwestern Connecticut and New York City, it may be surprising that New Haven and Bridgeport are separate metropolitan areas, both with nearly 1,000,000 population. Moreover, there is virtually no break in the continuously built-up area between New York and southwestern Connecticut (Fairfield and New Haven counties) — they "flow together" to use Barone’s term. Since 2010, the Allentown metropolitan area, with nearly 1,000,000 population, was added to the New York CSA.

    The second largest commuter shed is Los Angeles-Inland Empire, with 18.6 million residents. This includes the Los Angeles metropolitan area (Los Angeles and Orange Counties, Ventura County and the Riverside San Bernardino metropolitan area (Inland Empire, including Riverside and San Bernardino County), which is one of the largest in the nation, with more than 4 million population. Here, as in New York, there is virtually no break in the built-up urbanization between the two urban areas, Los Angeles and Riverside-San Bernardino.

    Chicago is the third largest commuter shed, though its adjacent metropolitan areas are far smaller than in New York and Los Angeles. Chicago is also growing very slowly, with its population increase over the last year so small that it will take nearly to 2020 to reach 10 million, even though it only has 72,000 to go.

    Just below Chicago, Washington and Baltimore combine to form nation’s fourth largest commuter shed. Already with more than 9.5 million residents and strong growth this decade, Washington-Baltimore could pass 10 million population and Chicago by 2020. Washington-Baltimore is unique in combining two of the nation’s historically largest and most intensely developed core municipalities along with the much more extensive suburbs (which contain 85% of the population). Washington-Baltimore now extends to Franklin County, Pennsylvania.

    The fifth largest metropolitan complex is the San Francisco Bay Area with a population of 8.6 million. This includes the San Francisco, San Jose, Vallejo, Santa Rosa, Santa Cruz metropolitan areas and the recently added Stockton metropolitan area.. There is no break in the urbanization between San Francisco and San Jose.  

    The Boston CBSA was enlarged during the last decade to include Providence, a major metropolitan area in its own right. Boston also includes the Worcester metropolitan area, which is nearing 1,000,000 population. Boston-Providence has a population of 8.1 million.

    The top 10 is rounded out by Dallas-Fort Worth (7.4 million), Philadelphia (7.2 million), Houston (6.7 million), and Miami (6.6 million).

    The largest metropolitan complex in the nation that is not a part of a CSA is Phoenix, which is ranked 14th. Only one other commuter sheds in the top 20 is not a CSA (San Diego) and only six of the 60 commuter sheds with more than 1,000,000 population is not a CSA.

    Fastest Growing Commuter Sheds

    The fastest commuter shed growth rates are in the South, which accounts for eight of the ten fastest growing commuter shed’s. Austin ranks number one in annual percentage growth between 2010 and 2014, a position it also holds among major metropolitan areas. Cape Coral (Florida) ranks second. Cape Coral also ranks as the fastest growing among the midsized metropolitan areas (from 500,000 to 1,000,000 population). Houston ranks third in growth rate. Houston and Dallas-Fort Worth are the only commuter sheds with more than 5 million population that are among the top 10 in growth. The two non-Southern top 10 entries are from the West: Denver and Phoenix (Figure 2).

    Slowest Growing Commuter Sheds

    All of the 10 slowest growing major commuter sheds are in the old industrial heartland of the Northeast and Midwest. Cleveland-Akron is the slowest growing, having lost approximately 0.1 percent of its population annually. Pittsburgh, Dayton, Buffalo and Detroit have also lost population.

    Continuing Dispersion

    The dispersion of US metropolitan areas continues, with perhaps the ultimate example of Portland (Oregon), which was recently combined with four other metropolitan areas (see: Driving Farther to Quality in Portland). The "flowing together" suggest that the combined statistical area may be an increasingly important in assessing regional trends.

    Core Based Statistical Areas (Commuter Sheds): United States
    Over 1,000,000 Population in 2014
    2014 Population Rank Metropolitan Area 2010 2014 Annual % Change: 2010-2014 Growth Rank
    1 New York-New Haven, NY-NJ-CT-PA CSA 23.077 23.633 0.56% 41
    2 Los Angeles-Inland Empire, CA CSA 17.877 18.550 0.87% 30
    3 Chicago, IL-IN-WI CSA 9.841 9.928 0.21% 50
    4 Washington-Baltimore, DC-MD-VA-WV-PA CSA 9.052 9.547 1.26% 18
    5 San Fransicsco-San Jose, CA CSA 8.154 8.607 1.28% 17
    6 Boston-Providence, MA-RI-NH-CT CSA 7.894 8.100 0.61% 38
    7 Dallas-Fort Worth, TX-OK CSA 6.818 7.353 1.79% 8
    8 Philadelphia, PA-NJ-DE-MD CSA 7.068 7.165 0.32% 47
    9 Houston, TX CSA 6.115 6.686 2.13% 3
    10 Miami-West Palm Beach, FL CSA 6.168 6.558 1.46% 14
    11 Atlanta, GA CSA 5.910 6.259 1.36% 16
    12 Detroit, MI CSA 5.319 5.315 -0.02% 56
    13 Seattle, WA CSA 4.275 4.527 1.36% 15
    14 Phoenix, AZ MSA 4.193 4.489 1.62% 9
    15 Minneapolis-St. Paul, MN-WI CSA 3.685 3.835 0.94% 26
    16 Cleveland-Akron, OH CSA 3.516 3.498 -0.12% 60
    17 Denver, CO CSA 3.091 3.345 1.88% 6
    18 San Diego, CA MSA 3.095 3.263 1.25% 20
    19 Portland-Salem, OR-WA CSA 2.921 3.060 1.10% 23
    20 Orlando-Daytona Beach, FL CSA 2.818 3.046 1.84% 7
    21 Tampa-St. Petersburg, FL MSA 2.784 2.916 1.10% 22
    22 St. Louis, MO-IL CSA 2.893 2.911 0.15% 52
    23 Pittsburgh, PA-OH-WV CSA 2.661 2.654 -0.06% 59
    24 Charlotte, NC-SC CSA 2.376 2.538 1.57% 11
    25 Sacramento, CA CSA 2.415 2.513 0.94% 27
    26 Salt Lake City-Ogden, UT CSA 2.272 2.424 1.54% 12
    27 Kansas City, MO-KS CSA 2.343 2.412 0.68% 36
    28 Columbus, OH CSA 2.309 2.398 0.90% 28
    29 Indianapolis, IN CSA 2.267 2.354 0.89% 29
    30 San Antonio, TX MSA 2.143 2.329 1.98% 4
    31 Las Vegas, NV-AZ CSA 2.195 2.315 1.26% 19
    32 Cincinnati, OH-KY-IN CSA 2.174 2.208 0.37% 46
    33 Raleigh-Durham, NC CSA 1.913 2.075 1.94% 5
    34 Milwaukee, WI CSA 2.026 2.044 0.21% 51
    35 Austin, TX MSA 1.716 1.943 2.97% 1
    36 Nashville, TN CSA 1.788 1.913 1.59% 10
    37 Norfolk-Virginia Beach, VA-NC CSA 1.779 1.819 0.53% 43
    38 Greensboro-Winston-Salem, NC CSA 1.589 1.630 0.60% 39
    39 Jacksonville, FL-GA CSA 1.470 1.543 1.14% 21
    40 Louisville, KY-IN CSA 1.460 1.499 0.62% 37
    41 Hartford, CT CSA 1.486 1.488 0.02% 55
    42 New Orleans, LA-MS CSA 1.414 1.480 1.09% 24
    43 Grand Rapids, MI CSA 1.379 1.421 0.71% 34
    44 Greenville, SC CSA 1.362 1.410 0.81% 33
    45 Oklahoma City, OK CSA 1.322 1.409 1.50% 13
    46 Memphis, TN-MS-AR CSA 1.353 1.370 0.29% 48
    47 Birmingham, AL CSA 1.303 1.317 0.27% 49
    48 Richmond, VA MSA 1.208 1.260 1.00% 25
    49 Harrisburg, PA CSA 1.219 1.240 0.39% 45
    50 Buffalo, NY CSA 1.216 1.215 -0.02% 57
    51 Rochester, NY CSA 1.175 1.177 0.05% 54
    52 Albany, NY CSA 1.169 1.174 0.10% 53
    53 Albuquerque, NM CSA 1.146 1.166 0.40% 44
    54 Tulsa, OK CSA 1.106 1.139 0.69% 35
    55 Fresno, CA CSA 1.081 1.121 0.84% 32
    56 Knoxville, TN CSA 1.077 1.104 0.58% 40
    57 Dayton, OH CSA 1.080 1.078 -0.05% 58
    58 Tucson, AZ CSA 1.028 1.051 0.53% 42
    59 El Paso, TX-NM CSA 1.013 1.050 0.85% 31
    60 Cape Coral, FL CSA 0.940 1.028 2.13% 2
    In millions
    Data from US Census Bureau
    Metropolitan Statistical Areas shown only if not in a Combined Statistical Area.


    Wendell Cox is Chair, Housing Affordability and Municipal Policy for the Frontier Centre for Public Policy (Canada), is a Senior Fellow of the Center for Opportunity Urbanism (US), a member of the Board of Advisors of the Center for Demographics and Policy at Chapman University (California) and principal of Demographia, an international public policy and demographics firm.

    He is co-author of the "Demographia International Housing Affordability Survey" and author of "Demographia World Urban Areas" and "War on the Dream: How Anti-Sprawl Policy Threatens the Quality of Life." He was appointed to three terms on the Los Angeles County Transportation Commission, where he served with the leading city and county leadership as the only non-elected member. He served as a visiting professor at the Conservatoire National des Arts et Metiers, a national university in Paris. 

    Photo: Albany (NY) City Hall (by author)