Category: Suburbs

  • Stack and Pack vs. Smear All Over

    I drove out to a distant suburb recently to attend to some business and I passed by a cluster of billboards on the side of the freeway that got me thinking. The general gist of the slogans asserted a conservative anti-government anti-urban rebellion. These are clearly people who don’t want density and public transit imposed on them by pointy headed liberal idiots. I have to admit I have some sympathy for this perspective, although probably not for the same reasons as the billboard people. Their knee jerk reaction makes clear what they don’t want, but offers no alternative response to the underlying difficulties faced by the inevitable urbanization of rural areas.

    Screen Shot 2015-06-06 at 1.45.36 AM

    Screen Shot 2015-06-06 at 1.44.07 AM

    Screen Shot 2015-06-06 at 1.44.23 AM

    Screen Shot 2015-06-06 at 1.43.24 AM

    Screen Shot 2015-06-06 at 1.43.47 AM

    Screen Shot 2015-06-06 at 3.07.22 AM

    Screen Shot 2015-06-06 at 3.05.57 AM

    Screen Shot 2015-06-06 at 3.05.27 AM

    Screen Shot 2015-06-06 at 3.06.59 AM

    Screen Shot 2015-06-06 at 3.06.43 AM

    Here’s the fantasy of how this particular area should remain: bucolic landscapes, family farms, charming old homes, and delicate churches with little graveyards out back. But these are all part of a heritage park. School children are brought here to learn what the place was like in the 1850’s.

    Screen Shot 2015-06-06 at 3.08.52 AM

    Screen Shot 2015-06-06 at 3.11.23 AM

    Screen Shot 2015-06-06 at 3.10.27 AM

    Screen Shot 2015-06-06 at 3.08.27 AM

    Screen Shot 2015-06-06 at 3.08.08 AM

    Screen Shot 2015-06-06 at 3.13.18 AM

    Turn the camera just slightly to the left or the right and the landscape is filled with gas stations, parking lots, drive-thru banks, and freeway traffic. And everywhere there’s new construction. Money (lots and lots of San Francisco Bay Area money) and a whole lot of people are inevitably going to be occupying what is now open space in these distant counties. No political force can stop it. There are two competing models for what that new growth is going to look like and neither is pretty as far as I’m concerned.

    Screen Shot 2014-11-17 at 5.42.47 PM

    Screen Shot 2014-11-17 at 5.43.17 PM

    Screen Shot 2014-11-17 at 5.41.57 PM

    Screen Shot 2014-11-17 at 5.42.34 PM

    First, there’s the compact, dense, transit oriented development favored by regional planners. (This is precisely the kind of thing the billboard people are so pissy about.) Now… I live in a compact, dense, transit oriented neighborhood in San Francisco that I think is amazing. But when I look at what’s being built in the far flung suburbs I find nothing to love about any of it. The scale is overwhelming. Each of these complexes occupies a massive super block. And it’s not just the size per se that I don’t like. It’s the fact that these buildings have all the drawbacks of density without any of the compensating urbanism. Where are the shops on the ground floor? Where’s the corner grocery? Where are the cafes and nightclubs? Where are the intimate little restaurants and pocket parks? Where are the vibrant walkable places? There just aren’t any. These places are as lifeless as any cul-de-sac, minus the space and privacy provided by a tract house with a yard. It’s not a good combination.

    Screen Shot 2015-06-05 at 5.43.30 PM

    Screen Shot 2015-06-05 at 5.41.17 PM

    Screen Shot 2015-06-05 at 5.38.59 PM

    Screen Shot 2015-06-05 at 5.42.04 PM

    Screen Shot 2015-06-06 at 2.54.54 AM

    Screen Shot 2015-06-05 at 5.42.41 PM

    Screen Shot 2015-06-06 at 2.55.35 AM

    Screen Shot 2015-06-06 at 3.13.37 AM

    Here’s the second option. Traditional American values brought to life in shiny new single family homes with three car garages as far as the eye can see. This is the alternative to big bad government and communist apartment blocks. Luxury homes chew up the countryside and load the freeway with an unmanageable amount of traffic. And by the way, these homes each cost $1.4M.

    I compare this political situation with the dilemma the country faced in the early 1980’s when Reagan came to power. Conservatives hated the idea that the government operated halfway houses and insane asylums. They wanted no part of drug treatment programs either. At the same time liberals insisted that it was inhumane to lock people up against their will in underfunded and uncaring institutions where they were likely to be mistreated. So the two opposing elements of society conspired to shut down such institutions. The problem, of course, is that the mentally ill, drug addicted, and penniless segment of American society didn’t just disappear. They now live on our streets and fill our prisons. Both sides got what they wanted, but the problems persist in slightly different forms. So it is with the battles over land use regulation. Happenstance brings us a funky world and we all just muddle through some how.

    John Sanphillippo lives in San Francisco and blogs about urbanism, adaptation, and resilience at granolashotgun.com. He’s a member of the Congress for New Urbanism, films videos for faircompanies.com, and is a regular contributor to Strongtowns.org. He earns his living by buying, renovating, and renting undervalued properties in places that have good long term prospects. He is a graduate of Rutgers University.

  • Small Regions Rising

    In the last 25 years there has been a huge change in the level of competitiveness of smaller urban areas – by which I mean the small end of the major urban scale, or metro areas of about one to three million people – that has put them in the game for people in residents in way they never were before.

    I recently gave the morning keynote at the Mayor’s Development Roundtable in Oklahoma City and talked a bit about this phenomenon, as well as how these generally younger and sprawling areas ought to be thinking about their future.

    If the video doesn’t display for you, click over to watch on You Tube (my segment starts at 4:36).


    Aaron M. Renn is a senior fellow at the Manhattan Institute and a Contributing Editor at City Journal. He writes at The Urbanophile, where this piece first appeared.

  • The California Dream has Moved Away

    Southern California faces a serious middle income housing affordability crisis. I refer to middle income housing, because this nation has become so successful in democratizing property ownership that the overwhelming majority of middle income households own their own homes in most of the country.

    Recently I had the privilege of participating in a forum on this subject sponsored by the Urban Land Institute, Los Angeles Housing Chapter in Century City. The forum also included a presentation from USC Professor Dowell Myers and was chaired by Ehud Mouchly, who chairs the Housing Chapter. This article is adapted from my presentation.

    I am a native Angeleno, having been born near Temple and Alvarado, less than two miles from City Hall. I was appointed to three terms on the Los Angeles County Transportation Commission (LACTC) by Mayor Tom Bradley, where I played a pivotal role in the establishment of the Los Angeles rail system. LACTC and SCRTD were the two predecessors to the current Los Angeles County Metropolitan Transportation Authority (MTA).

    In addition, for 11 years, Hugh Pavletich of Christchurch, New Zealand and I have published the Demographia International Housing Affordability Survey. The latest edition was released in January and included median multiple data for 86 major metropolitan areas and nearly 300 smaller metropolitan areas in nine nations. Finally, I publish the most comprehensive annual review of world urbanization, providing population, land area and density for world urban areas with over 500,000 population (See World’s 1,000 Largest Cities: World Urban Areas 2015 Edition).

    All of this makes housing in Southern California and urban development particularly interesting to me.

    The Imperative: A Rising Standard of Living and Less Poverty

    The title of the forum was "The Changing Demographics of Southern California and Their Impact on Housing," however I think that the reverse is more significant — the impact housing is likely to have on Southern California.

    My perspective is neither ideological nor tied to any political party. It is a fundamentally pragmatic view that domestic policy should principally seek to better people’s lives, by facilitating a rising standard of living and reducing poverty. These objectives were also referenced in the G20 nations communiqué in Brisbane and adopted a announcing a dedication to improving standards of living and eradicating poverty.

    The issue is particularly ripe in California, where public policies relating to housing are having virtually the opposite effect. Housing costs have already increased poverty and reduced the discretionary income of middle-income households.

    This is not an issue of suburbs versus the urban core. I could not be more pleased by the long overdue resurgence of downtown areas as residential locations, something made possible by the huge crime reductions that began with Mayor Rudy Giuliani’s policies in New York City and similar efforts in cities like Los Angeles. It is important to recognize that a vibrant core no more needs dying suburbs then vibrant suburbs need a dying core. Both urban cores and suburbs can prosper, creating a stronger urban area.

    The Housing Crisis

    Southern California’s biggest crisis relates to housing. Housing is important to the standard of living and alleviating poverty. It is the largest element of household budgets. When housing more expensive, it leaves households with less discretionary income to purchase other goods and services. This will, other things being equal, reduce economic output from levels that would be otherwise attained.

    This has been developing for more than four decades as house price to income ratios (such as the median multiple, the median house price divided by the median household income) have doubled and tripled above historical levels and well above those of other metropolitan areas. Attention is often focused on lower income affordable housing, a problem virtually everywhere, but most parts of the country do not suffer so severe a middle-income housing affordability problem. Low-income housing affordability is important and one of the best ways to minimize it is to ensure that there is middle-income housing affordability.

    A bit of historical perspective is appropriate. For centuries nations had little or no property-owning middle class. Huge progress has been made in the last century and particularly since World War II. Following the war, housing development innovation, combined with transportation advances, led to the development of owned middle income housing in the suburbs. It started with Levittown on Long Island and spread across the nation. The most fabled Southern California example is Lakewood (see D. J. Waldie’s Holy Land: A Suburban Memoir on this). The result was a massive increase in home ownership, rising from percentages from the low 40s to 65% in the final decades of the 20th century.

    Similar progress was made in other countries, especially in Canada, Australia and New Zealand, where middle-income households purchased homes with sufficient space. In each of these nations, the median multiples were around or below 3.0 as late as 1995.

    All of this represented progress toward what the late and renown British urbanist Peter Hall called the "ideal of a property owning democracy" (See: The Costs of Smart Growth Revisited: A 40 Year Perspective).

    Sadly, affordability has diminished greatly in many metropolitan areas around the world.  House prices relative to incomes have doubled or tripled in virtually all of the metropolitan areas of Australia and New Zealand, some metropolitan areas in Canada as well as in some key metropolitan areas in the United States, with the worst in California. In each of these places, this house price escalation occurred after implementation of urban containment policies (also called smart growth or growth management), which seriously reduce the amount of land that can be used for new housing.

    The Roots of Urban Containment Policy

    Urban containment has its roots in the British 1947 Town and Country Planning Act. This act created green belts around British cities and is a proximate cause of the present housing shortage and crisis. The general philosophy of the 1947 Act is evident throughout urban planning in the United States and has been implemented in Oregon, part of Washington and California. Urban containment policy was also enacted in Florida. There, house prices had escalated at rates — if not the price levels — to near that of California during the housing bubble. However, legislators took the opportunity to repeal Florida’s urban containment policies when housing prices dropped to historical median multiple levels.

    A recent California Legislative Analyst’s report indicated that much of the problem is California’s strict land-use laws and regulations (See:  How the California Dream Became a Nightmare). A dense mesh of "urban containment" and "smart growth"  regulations have severely limited the land available for new housing, especially on the periphery, where cities grow organically. This destroys the competitive market for land, driving up its cost. This makes house prices escalate in relation to incomes.

    California: 50% More Poverty Than Mississippi

    Today, California house prices are far higher than in the rest of the nation. This is taking a toll on the standard of living and increasing poverty. The Census Bureau’s supplemental poverty measure, which adjusts for housing costs shows California’s poverty rate to be the highest in the nation. It should be of concern that California’s poverty rate is 50% above that of perennial poverty leader Mississippi (Figure).

    Because so much poverty is concentrated among minority ethnic populations, California’s urban containment policy is particularly disadvantaging Hispanics and African-Americans. The Thomas Rivera Institute at USC published a detailed examination of California’s land-use regulations and found that "Far from helping, they are making it particularly difficult for Latino and African American households to own a home."

    The Need for Reform

    The bad news is that things are likely to get much worse. Under the Sustainable Communities Strategies required under Senate Bill 375 (2008), it is likely to become nearly impossible to build traditional suburban single-family housing in California’s metropolitan areas (See: California Declares War on Suburbia). Already, median multiples in San Francisco, San Jose, Los Angeles and San Diego are approaching the highs reached at the peak of the housing bubble. House prices are likely to continue rising relative to incomes, other things being equal.

    Allowing Supply to Meet Demand

    It is often asserted that diminishing land supply in California reflects not so much regulation, but physical limits. The state is sometimes seen as ‘built out’. Yet, in fact, there is plenty of land available for development. Despite its reputation for urban sprawl, the Los Angeles urban area is the most densely populated in the United States. It covers a bit more than one half the land area of the New York urban area. Like any urban area, the greenfield land that is available for development is on the periphery, which  includes areas like the northern Antelope Valley, the Victor Valley, and Southwestern California (Temecula to Hemet) and in some closer areas. Each of these areas is closer to the urban core than some parts of the New York commuter shed.

    These areas could easily accommodate the additional population expected in the area by 2060, including the single family housing generally preferred among middle-income households. Households are not likely to raise children on high rise balconies.

    Even so, the urban footprint would continue to be much smaller than that of New York. If sufficient land were opened to development, the city would expand geographically, but people would also have better access to middle class standards of living, and there would likely be a lot less poverty. The obvious choice would be to let the city expand, while improving real incomes and reducing poverty.

    The California Dream is Now in Denver?

    During the discussion period after my talk, perhaps the most prescient comment was made by an unidentified audience member said that the California dream is now in Denver. California’s unjustifiably and artificially high housing prices are the cause. Between 1993 and 2010, there was net out-migration from California to 42 of the 50 states and the District of Columbia. Immigration to Los Angeles and Orange from abroad has also declined, as immigrants too look for more affordable alternatives. People seeking sun, glamour or a good time will continue to flourish in southern California, but it seems likely that more families, and middle class households, will continue to ebb out, seeking somewhere else the dream that was once so closely identified with Southern California.

    Wendell Cox is principal of Demographia, an international public policy and demographics firm. He is co-author of the "Demographia International Housing Affordability Survey" and author of "Demographia World Urban Areas" and "War on the Dream: How Anti-Sprawl Policy Threatens the Quality of Life." He was appointed to three terms on the Los Angeles County Transportation Commission, where he served with the leading city and county leadership as the only non-elected member. He served as a visiting professor at the Conservatoire National des Arts et Metiers, a national university in Paris. Wendell Cox is Chair, Housing Affordability and Municipal Policy for the Frontier Centre for Public Policy (Canada), is a Senior Fellow of the Center for Opportunity Urbanism and is a member of the Board of Advisors of the Center for Demographics and Policy at Chapman University.

    Photo: Central Los Angeles and the San Fernando Valley (by author)

  • Are Suburbs Causing Crime?

    Reihan Salam, often an insightful critic, argues in Salon that poverty has come to the suburbs at a higher rate than it has grown in big cities because poorer service workers have followed the service jobs required in the suburbs. This has caused problems. Salam sees more civil strife in suburbs like Ferguson, Missouri today partly because the different kinds of family structures that have become so predominant, particularly those exhibited by the poor, cannot be accommodated in single-family, detached housing.

    There’s clearly some truth here but overall the policies he suggests do not hold water. Households led by singles are up to over 20 percent of all households in the most highly populated metropolitan areas, two-parent families with the manpower to take care of suburban homes and lawns has fallen, and single parent households have grown. His solution:  to build smaller, high-density attached housing units, not so much because they are more affordable for the poor; many of the suburban poor already live in rental housing units, and overall high density is generally more expensive than lower density. Salam sees density and its concomitant higher property assessments as  generating more  tax revenue, thus reducing local government aggressiveness in  levying traffic and loitering fines (administered mostly through an often distrusted police force), which have grown to become an enormous burden for the poor in the suburbs.  

    But Salam doesn’t seem to appreciate that much of the desperation for local tax dollars is driven by increases in the number of residents — all kinds of residents but including the poor — and especially the young and poor, who generate the demand for  expensive services like schools, special education, and law enforcement.  Salam is under the impression that higher density buildings produce more property tax revenue, but he doesn’t acknowledge that if these buildings are filled with more people per acre than a single family home, they will also require more services, and generate the need for more taxes.   One of the enduring political features of high-density urban areas is the lack of a tax base (or political willingness) to adequately fund big city school systems. By court order, New York State had to revamp its school aid formula in the early 2000s to channel billions in more funds to the New York City public school system, which State Supreme Court Justice Leland DeGrasse  ruled had for years neglected its constitutional obligation to ensure "the availability of a sound basic education to all children of the state."

    In fairness, one of the most perplexing issues in urban planning over the decades has been whether or not certain types of housing pay more or less in property taxes than their inhabitants require in government services. This question has not been answered to anyone’s satisfaction.

    There are broader questions raised by this article. If the poor (the majority of whom are single mothers) are poor at least in some respect to there being only one or no working adults in a household, wouldn’t a poor, single mother of three still be poor living in an attached apartment (as opposed to a basement of a single-family home)? If at least one social objective to alleviate poverty is to create two-income households, it is not clear how building smaller housing units would encourage this. As the University of Washington’s Richard Morrill  and others have repeatedly shown, our most densely populated areas (i.e. those with smaller housing units) exhibit the most severe forms of economic stratification.

    Nor is it clear how Salam’s recommendation would address the aspirations of the poor, most of whom still seek one day to acquire a piece of property and a single-family home. A recent Redfin study found that 92 percent of “Millenials” (those born during the early 1980s and now in their late 20s and 30s) who don’t own a home want to buy one in the future. And according to figures from the 2008 Current Population Survey, as reported by Thomas Tseng in Newgeography.com, 44 percent of Millenials belong to some racial or ethnic category other than "non-Hispanic white." It’s an unfortunate reality of American life that even into the second decade of the 21st century a disproportionate number of the poor are racial minorities. One must assume that a goodly portion of these young aspirants to homeownership must be poor racial minorities.

    How would forcibly filling the landscape with apartment buildings and crowding out single-family, detached homes (making them, therefore, more expensive) help the poor achieve that dream?

    Salam’s remedy of building smaller living units might even exacerbate another problem that some suburbs (and the nation as a whole) face: the “birth dearth”, or the decline, especially in older suburbs, of family formation and birth rates. As opposed to the “nursery” for America’s next generation that many of America’s sprawl suburbs still remain, urban centers today are among the most “child free” ‑ whether in Manhattan, San Francisco, Chicago, or Boston. But even in the old-line suburbs, since the 2008 recession, the number of new children has plummeted. The largest declines in the 5 to 14 cohort since 2000 have almost all occurred in the large coastal metropolitan regions, including their suburbs, led by Los Angeles where the child population has dropped by 303,000, or 15.3%, since 2000. In the New York metro area, the number of 5- to 14-year-olds has fallen by 238,000. This includes the Nassau-Suffolk region, America’s “oldest suburb,” which has experienced a decline of 71,834 residents in the 0-14 population group between 2000 and 2013.

    Today the number of households with children is 38 million, about the same as a decade ago, even as the total number of households has shot up by nearly 10 million. There are now more houses with dogs than houses with children.

    The decline in the numbers of potential young suburban residents suggests not some great urban revival, but a drain in the population of future taxpayers and workers. As demographer Wendell Cox and others have shown, localities with higher densities have considerably lower birth rates than areas with lower densities. With the push for higher density, are the suburbs slated next to become “child free zones”?

    Few would dispute that many suburban areas across the country lack sufficient housing options. But the seemingly ubiquitous assumption that high density housing will eradicate problems such as high taxes, increasing inequality, civil unrest, and lower birth rates may be invested with an unjustified sense of certainty.   

    Seth Forman, Ph.D, AICP, is author of American Obsession: Race and Conflict in the Age of Obama and Blacks in the Jewish Mind: A Crisis of Liberalism, among other books. His work has appeared in publications that include National Review, Frontpagemag.com, The Weekly Standard, and The American. He is currently Research Associate Professor at Stony Brook University, and the Chief Planner for the Long Island Regional Planning Council. His opinions are not associated with any of these institutions. He blogs at www.mrformansplanet.com.

  • Not so Unequal America?

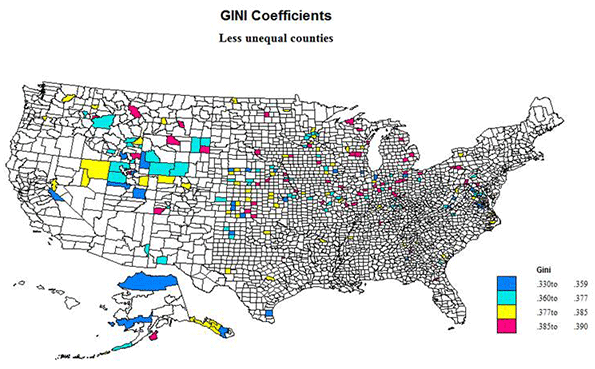
    The extreme and rising inequality of income and wealth in the United States has been exhaustively reported and analyzed, including by me. Incomes are strikingly unequal just about everywhere, but not to the same degree. To discover a more egalitarian America, I used US Census American Community Survey data (2007-2011) estimates of the Gini coefficients of all US counties and equivalents. The Gini coefficient is a measure of the percent departure of a line of accumulated population versus accumulated income, from the lowest to the highest and the straight line if everyone had the same equal income. 

    The index would be 0 if all were equal, 1.0 if only 1 person had all the income. The median US counties, dozens of them, have a Gini of .43, which is in fact pretty extreme, far higher than in 1974, when it was .37. But the overall US figure is .47 (.41 in 1975), because larger counties tend to be more unequal than smaller, skewing the average. Examples of a median .43 county are Winnebago, WI (Oshkosh!), Klamath, OR, and Arlington, VA, and a good example of the average US county is Jackson, MO (Kansas City!). The lowest Gini for the US is .33 (Yakutat, AK and Power, ID) and the highest is no surprise at .59, New York county (Manhattan). It is revealing and horrific that our lowest value of .33 is that of Sweden (and most of Scandinavia), Germany is only .35 and the lowest in the world is evidently Switzerland, despite those rich bankers, at .31.  

    Is this a Great Country or What?

    I mapped only the 208 counties with the lowest Gini indices, those under .39, in two ways, first by the Gini values and then by groups of these counties sorted by median incomes.  Only 10 have values below .35. In 1975, 11 counties had Ginis bellow .27.  States with the highest number or share of less unequal counties include Alaska, 10, Idaho, 11, Indiana, 15, Iowa, 10, Kansas, 18, Minnesota, 11, Nebraska, 17, Utah, 7, Virginia, 13 and Wyoming, 8. Except for Alaska, there is an evident north central bias: band of less unequal counties from Virginia to Idaho-Nevada, with epicenter at the junctions of Utah, Idaho and Wyoming. 

    States without any qualifying as less unequal counties (with Ginis under .39)  are Alabama, Connecticut, Delaware, Hawaii, Louisiana, Maine, Massachusetts, New Hampshire, New Jersey, Rhode Island  and South Carolina. Large California has only one, as does New York, and large Texas only 7.    

    Size of Counties

    A problem with the data is that small population size of many of the counties render the ACS estimates somewhat uncertain.  Thirteen have fewer than 500 households, 25 have fewer than 1000. It is reasonable that smaller rural counties, e.g., in the Plains states, might have less inequality because of the homestead settlement history and the absence of slavery, but there is still uncertainty due to small sample size. Of the counties with under 1000 households, 8 are in NE, 5 in AK, 3 in KS, 2 in CO, MT and TX, and 1 in ID, N and WA.  

    At the other end, 28 counties have more than 25,000 households, and 5 have over 100,000. The largest are an interesting set. All are suburban, or even exurban, and most are fairly high income, essentially homogeneously middle class. The six largest are Williamson, TX, King William, VA, St. Charles, MO, Anoka, MN, Loudoun, VA and Davis, UT. These are also among the richest counties on the list. 

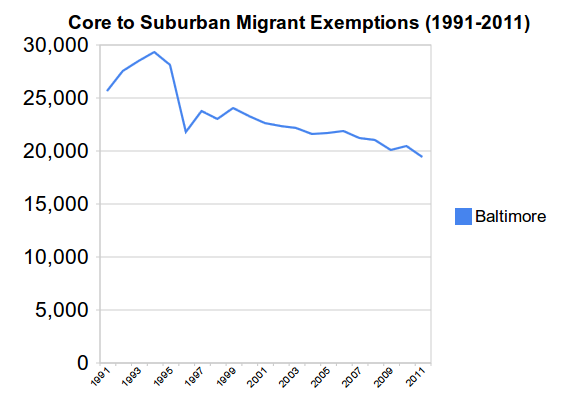
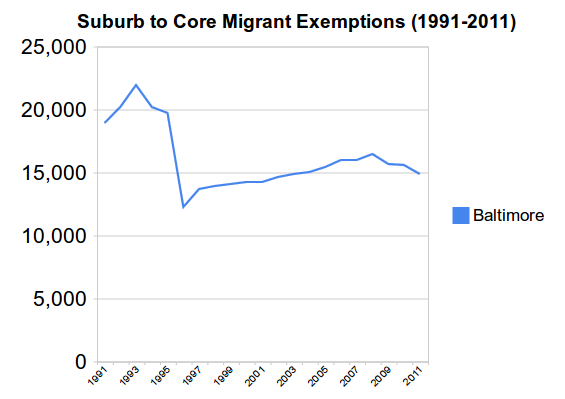
    It might be meaningful that some of these counties, as around Washington, DC, Baltimore and Austin, TX, have high levels of government employees, while their minority levels are quite low.

    Lower inequality, but High in Minorities

    This unlikely combination does occur, although only 7 of the 208 counties have minority shares (percentages) above .5: TX, 3, Kenedy, Moore and Reagan;  KS, 2, Ford and Seward; AZ 1, Greenlee, and AK, Aleutians 1. The TX, KS and AZ counties are all Hispanic, and high in energy development for TX and KS.  The AK county is Asian. No county has a black population majority. Surry county, VA, at 47% black, is highest share of black population, located and exurban between Richmond and Norfolk.  

    The Lowest Ginis, Under .36

    Thirty-one counties have Gini levels under .36 (Still high of course!) Only 10 are under .35. These vary in size from tiny Kenedy, TX (147 households) to Loudon, VA  with 105,000. The distribution by state is
    VA 7:  King William, Prince George, Surry, Craig, Greene, Loudon, King and Queen
    KS 4:   Meade, Wabaunsee, Wichita, Kearny
    AK 3:  Yakutat, Bristol Bay, North Slope
    UT 3: Morgan, Emery, Juab
    NE 3:   Blaine, Stanton, Grant
    TX 2: Kenedy and Carson.
    Several states with one county: CA, Mono,  GA, Chattahoochee,  ID, Power,  IL, Kendall,  IN, Jasper,  IA,  Cedar, KY, Spencer, OH, Putnam, and WY, Lincoln.

    These are distributed in a similar way to the 208 lower Gini counties, with the exception of the much larger number in VA, and not just in the WDC area!  UT and AK stand out, as do neighbor states of KS and NE.  The AK set is high in minorities (Native Americans, Asians), as is Kenedy, TX (Hispanic).  The VA set includes suburban Richmond and Washington DC counties, exurban to rural Chesapeake Bay counties, a tiny Allegheny mountain county and suburban Charlottesville. ID, UT, KY, KS, IL, IN and GA have suburban counties, KS and TX energy growth counties, and NE, WY, UT and CA fairly remote rural counties, the latter three recreational.

    Less unequal counties by income level

    Lower income counties: 27 counties have median household incomes below $40,000. By state these are
    NE 5: Garfield, Hooker, Blaine, Grant. Hayes
    ID 5: Idaho, Lewis, Power, Benewah, Clark
    KS 4: Cloud, Norton, Trego, Rush
    MI 2: Oscoda, Ontonagon        
    WV 2: Grant, Monroe
    WI 2: Adams, Florence
    Several states with one county, including PA, Forest: TX, Kenedy: MT, Golden Valley:  IN, Jay;
    IA, Osceola,;  ND, Griggs; and MO, Monroe,

    The dominance of neighboring KS and NE is noteworthy, as is the large number and share in Idaho. Eight of the counties are small, with under 1000 households, and only 4 have over 40,000. Thus most of the counties are rural and small town, resource oriented, and often with small manufactures. The counties in upper Michigan and Wisconsin are similar in character.

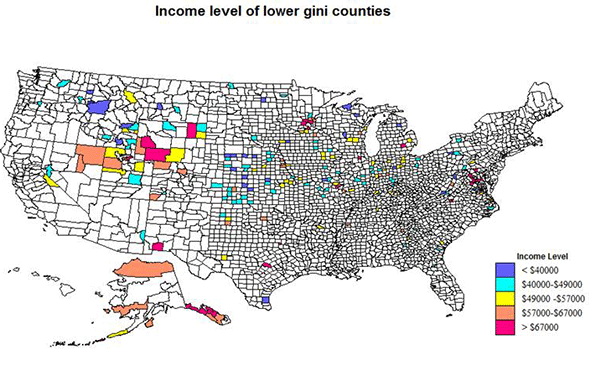
    Higher income counties at the other end comprise 28, with median household incomes above $67,000. By state these are:
    VA 7: Loudoun, Stafford, Prince William, Spotsylvania, Manassas Park, New Kent, King George
    AK 4: Juneau, Denali, Skagway, North Slope
    MN 4: Scott, Sherburne, Anoka, Wright
    MD 3: Calvert, Charles, Carroll 
    WY 3; Campbell, Sublette, Sweetwater
    TX 2; Rockwall,  Williamson
    Several with one county: NM, Los Alamos: UT, Morgan; MO, St Charles; MI, Livingston; IL, Kendall

    The 9 richest counties include 6 suburban or exurban around Washington DC and Baltimore, suggesting the importance of federal employment, and federal oriented Los Alamos, NM, Rockwall is suburban Dallas, Scott suburban Minneapolis.   Other suburban and exurban counties are in UT, MO, and MN (3 more!), VA (4 more), MI, IL, and TX. Higher income rural small town areas are in AK (4) and WY (3).

    Middle Income Less Unequal Counties

    The middle group of 52 counties with median household incomes between $49,000 and $57,000 are more varied and complex.  By state
    IN 6: Jasper, Ohio, Putnam, Spencer, Tipton and Whitley
    IA 5: Iowa, Lyon, Cedar, Mills, Benton                    
    KS 3: Jackson, Wabaunsee, Jefferson
    UT 3: Juab, Duchesne, Box Elder    
    OH 4: Mercer, Henry, Auglaize, Putnam
    WI 2: Kewaunee, Dodge, Columbia     
    MN 2: Le Sueur, Nicollet
    ID 2: Jefferson, Teton
    MO, 2, Clinton, Lincoln
    WY 2: Weston, Carbon,
    KY, 2, Anderson, Bullitt
    TX,  Reagan
    GA 2: Pike, Effingham
    VA 2: Surry, Greene  
    NE 2: Hamilton, Kearny
    AK, Aleutians, AR, Saline, CA, Mono, IL, Washington, MI, Lapeer
    MT Lewis and Clark. OR, Hood River, PA, Perry, TN, Cheatham, NC Currituck
    None have under 1000 households, and 21 have 10,000 or more. The largest, Saline, AR, has 41,000 (suburban Little Rock).

    These tend to prevail across the north central states from OH west to UT, and include many small town and small city regional centers. Several are free-standing small town counties, a few are suburban to larger cities, such as Nashville and Little Rock, but the most are far suburban or exurban to smaller metro areas. 

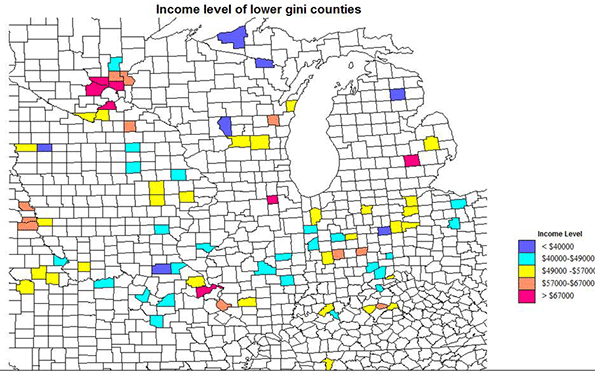
    The small map inset centered on Indiana illustrates these patterns.

    Conclusions                 

    The geography of these less unequal counties is unusual. Not one is a metropolitan core county, large or small. Not one is a majority black county. While there are many suburban counties, almost all are in a few clusters, VA-MD, ID-UT, or in the upper Midwest, especially MN. A large number are exurban, just beyond the official metro areas, mostly across the north, but with a few in the  south. And, most old-fashioned and reassuring, quite a number are freestanding small city and small town, micropolitan or smaller counties, most notably in the Northern Plains and Rocky Mountain states, and apparently doing well with a resource and small industrial economy.   

    Contrasting the  Most Unequal Counties

    OK, how different is the geography of the most unequal counties?  The US has 30 counties with Gini indices over .53, culminating in New York (Manhattan) at almost .6. These are indeed quite different, as race plays a dominant role, but not a universal one.

    23 of the 30 are in the south, and 17 of these have high black population shares, including core metropolitan counties, the District of Columbia, Fulton (Atlanta). Orleans (New Orleans), and Richmond, VA. Outside the south, 6 of the 8 counties also have a high minority share, New York (Manhattan), Westchester, Essex, NJ (Newark), Sioux, SD (reservation), and Harding, NM (Latino), leaving only tiny Mineral CO (recreation), and  Fairfield CT (super rich suburban-exurban NY).

    Six counties in the south do not have high minority shares,  Decatur, TN (west central on the Tennessee river), Baylor, TX , exurban Wichita Falls, Llano, TX , exurban Austin and tiny Borden, TX, Galax city, VA, far southwest, and Watauga, NC, home of Appalachian State University.

    Race clearly is the most common basis for extreme inequality, but exurban counties close to rich metropolitan centers may also have high class differentials, as do some recreation dependent areas.    

    Richard Morrill is Professor Emeritus of Geography and Environmental Studies, University of Washington. His research interests include: political geography (voting behavior, redistricting, local governance), population/demography/settlement/migration, urban geography and planning, urban transportation (i.e., old fashioned generalist).

  • Growth Concentrated in Most Suburbanized Core Cities

    An analysis of the just-released municipal population trends shows that core city growth is centered in the municipalities that have the largest percentage of their population living in suburban (or exurban) neighborhoods.

    Improved Urban Core Analysis

    There is considerable interest in urban core population trends, both because of recent increases in the interest of urban planning orthodoxy to restore living patterns more akin to the pre-World War II era. At that time, urban areas were considerably more densely populated, commuting travel was much more focused on downtowns (central business districts or CBDs) and automobile use accounted for far less of urban travel than today.

    Most previous analysis has equated historical core municipality (core city) data with the urban core. The core cities are generally the original settlements, as they have evolved by expanding their city limits. Around these core cities, suburbs and exurbs have developed, which combined with the core cities make up the metropolitan area. Metropolitan areas are the "economic" dimension of contemporary cities.

    However, even the most cursory analysis demonstrates that equating core cities with the urban core is far from ideal. Historical core municipalities vary greatly in their percent of their population living in traditional high density neighborhoods. For example, in core cities like New York, Boston and San Francisco, nearly all people live in neighborhoods that can be classified as urban core. In others of the largest core cities, virtually all of the population lives in neighborhoods that are suburban or exurban, in view of their low densities and overwhelming automobile orientation. These include examples like San Antonio, Phoenix and San Jose. Even core cities perceived to have a strong urban core, such as Portland and Miami, have considerably less than 50% of their population in urban core neighborhoods.

    Overall, historical core municipalities have little more than 40% of their population living in urban core neighborhoods. When non-core principal cities or primary cities are equated with core cities, there is even less association with the urban core. Overall, non-core principal cities have less than 10% of their population living in urban core neighborhoods.

    This has changed in recent years, with the introduction of the annual American Community Survey and its small area data, such as for ZIP Code analysis zones (ZCTAs). Even so, the comprehensive publication of small area data tends to lag approximately three years behind population estimates. Thus, the small area data that would make it possible to compare population trends to 2014 by functional urban sector within core cities will not be released until 2017.

    This article classifies 2010 to 2014 core city population growth by the percentage of urban core population according to the 2010 census. The classification was developed using my City Sector Model, which classifies every zip code in metropolitan areas as pre-War urban core (CBD and inner ring) or post-War suburban or exurban (Figure 1). Simplified, the City Sector Model classifies as urban core any small area with an employment density of 20,000 per square mile or more or a population density of 7,500 per square mile or more, with a transit, cycling and walking work trip market share of 20% or more (Note).

    Growth by Extent of Urban Core Population

    More than 50% of the growth between 2010 and 2014 has been in core municipalities that are more than 90% post World War II suburban or exurban (0 to 10% urban core). This growth share is nearly one-half higher than their population share of 35%.

    These findings are based on the City Sector Model (Figure 1 and Note), which classifies small areas (zip code tabulation areas) principally using population density and commuting market share data that attempts to replicate urban areas as they functioned before World War II.

    These most suburban of core cities grew the fastest, up 6.8% from 2010 to 2014. These municipalities had less than 10% of their population in urban core neighborhods, and include core cities that annexed substantial suburban or rural territory, such as Phoenix, San Jose, Charlotte, Tampa, Orlando and San Antonio. Those that were most heavily urban core in form grew 4,0 percent, which was slightly behind the national average of 4.7 percent. The core cities had less than 10% of their population living in urban core neighborhoods, and include New York, Buffalo, Providence, San Francisco and Boston (Figure 2)  

    The functionally suburban and exurban areas accounted for approximately 58% of the population in the core cities. This leaves approximately 42% of the population living in areas that are similar to the urban areas as they functioned in 1940.

    Approximately 70% of the growth was in the 33 historical core municipalities that are more than 60% suburban or exurban.

    At the same time, the five core cities with the largest urban core percentages accounted for nearly 20% of the growth, compared to their 22 percent of the population. Approximately 80% of this growth was in New York, which is estimated to have added the largest population (316,000) among the core cities.

    Ten Fastest Growing Core Municipalities

    Six of the ten fastest growing core cities had urban core shares of less than 10%, including Austin, Orlando, Charlotte, Raleigh, Atlanta and San Antonio. A seventh, Denver was less than 15% urban by function. Two more had more than 50% in urban core population, Washington and Seattle (Table). Eight of the 10 fastest growing core cities were in the South, including Washington.

    Table
    Population Growth: 2010-2014
    Core Municipalities in Major Metropolitan Areas
    Population Population in Pre-War Functional Urban Core
    Rank Historical Core Municipality Metropolitan Area 2010 2014 % Change Historical Core Municipality Metropolitan Area
    1 Austin Austin, TX     790,637      912,791 15.5% 4.8% 2.2%
    2 New Orleans New Orleans. LA     343,829      384,320 11.8% 37.9% 10.9%
    3 Denver Denver, CO     600,024      663,862 10.6% 13.1% 3.1%
    4 Orlando Orlando, FL     238,304      262,372 10.1% 0.0% 0.0%
    5 Charlotte Charlotte, NC-SC     735,780      809,958 10.1% 0.0% 0.0%
    6 Seattle Seattle, WA     608,660      668,342 9.8% 52.6% 10.5%
    7 Washington Washington, DC-VA-MD-WV     601,723      658,893 9.5% 83.7% 16.5%
    8 Raleigh Raleigh, NC     403,947      439,896 8.9% 0.0% 0.0%
    9 Atlanta Atlanta, GA     420,279      456,002 8.5% 9.2% 0.7%
    10 San Antonio San Antonio, TX  1,327,605   1,436,697 8.2% 0.1% 0.1%
    11 Miami Miami, FL     399,508      430,332 7.7% 23.0% 3.0%
    12 Oklahoma City Oklahoma City, OK     580,003      620,602 7.0% 6.1% 2.8%
    13 Dallas Dallas-Fort Worth, TX  1,197,833   1,281,047 6.9% 1.1% 0.5%
    14 Tampa Tampa-St. Petersburg, FL     335,709      358,699 6.8% 0.0% 0.0%
    15 Houston Houston, TX  2,097,217   2,239,558 6.8% 1.4% 0.5%
    16 Nashville Nashville, TN     603,527      644,014 6.7% 0.7% 0.2%
    17 Richmond Richmond, VA     204,237      217,853 6.7% 26.0% 4.5%
    18 San Jose San Jose, CA     952,562   1,015,785 6.6% 0.1% 0.2%
    19 Minneapolis Minneapolis-St. Paul, MN-WI     382,578      407,207 6.4% 86.0% 0.0%
    20 Boston Boston, MA-NH     617,594      655,884 6.2% 90.4% 35.5%
    21 Phoenix Phoenix, AZ  1,447,552   1,537,058 6.2% 0.0% 0.0%
    22 San Diego San Diego, CA  1,301,621   1,381,069 6.1% 2.8% 1.2%
    23 Portland Portland, OR-WA     583,778      619,360 6.1% 37.9% 10.0%
    24 Columbus Columbus, OH     788,577      835,957 6.0% 12.0% 5.0%
    25 Oakland San Francisco-Oakland, CA     390,719      413,775 5.9% 54.7% 0.0%
    26 San Francisco San Francisco-Oakland, CA     805,235      852,469 5.9% 94.4% 0.0%
    27 Las Vegas Las Vegas, NV     583,787      613,599 5.1% 7.8% 2.8%
    28 Stl Paul Minneapolis-St. Paul, MN-WI     285,068      297,640 4.4% 38.7% 0.0%
    29 Sacramento Sacramento, CA     466,488      485,199 4.0% 7.6% 1.6%
    30 New York New York, NY-NJ-PA  8,175,136   8,491,079 3.9% 97.3% 52.8%
    31 Jacksonville Jacksonville, FL     821,784      853,382 3.8% 0.0% 0.0%
    32 Los Angeles Los Angeles, CA  3,792,627   3,928,864 3.6% 30.1% 10.6%
    33 Indianapolis Indianapolis. IN     820,442      848,788 3.5% 11.0% 4.8%
    34 Grand Rapids Grand Rapids, MI     188,040      193,792 3.1% 19.1% 3.8%
    35 Louisville Louisville, KY-IN     597,336      612,780 2.6% 17.8% 8.7%
    36 San Bernardino Riverside-San Bernardino, CA     209,952      215,213 2.5% 0.0% 0.0%
    37 Kansas City Kansas City, MO-KS     459,787      470,800 2.4% 19.8% 5.4%
    38 Salt Lake City Salt Lake City, UT     186,443      190,884 2.4% 21.4% 3.7%
    39 Philadelphia Philadelphia, PA-NJ-DE-MD  1,526,006   1,560,297 2.2% 86.1% 25.8%
    40 Memphis Memphis, TN-MS-AR     646,889      656,861 1.5% 3.7% 1.8%
    41 Norfolk Virginia Beach-Norfolk, VA-NC     242,803      245,428 1.1% 2.8% 0.4%
    42 Chicago Chicago, IL-IN-WI  2,695,598   2,722,389 1.0% 76.6% 25.8%
    43 Milwaukee Milwaukee,WI     594,740      599,642 0.8% 55.4% 23.6%
    44 Providence Providence, RI-MA     178,036      179,154 0.6% 92.6% 26.2%
    45 Cincinnati Cincinnati, OH-KY-IN     296,950      298,165 0.4% 54.2% 10.1%
    46 Baltimore Baltimore, MD     620,961      622,793 0.3% 67.7% 16.2%
    47 Birmingham Birmingham, AL     212,288      212,247 0.0% 0.0% 0.0%
    48 Hartford Hartford, CT     124,775      124,705 -0.1% 88.5% 11.3%
    49 Pittsburgh Pittsburgh, PA     305,702      305,412 -0.1% 78.0% 15.9%
    50 Rochester Rochester, NY     210,512      209,983 -0.3% 51.7% 11.4%
    51 St. Louis St. Louis,, MO-IL     319,294      317,419 -0.6% 84.1% 11.7%
    52 Buffalo Buffalo, NY     261,310      258,703 -1.0% 96.0% 29.2%
    53 Cleveland Cleveland, OH     396,814      389,521 -1.8% 80.1% 22.2%
    54 Detroit Detroit,  MI     713,777      680,250 -4.7% 32.1% 6.5%
    Data from:
    US Census Bureau
    City Sector Model (2015)


    Austin has been the fastest growing historical core municipality over the four years. In 2010, Austin had 790,000 residents, and has increased 15.5% to 913,000.

    New Orleans was the second fastest growing, adding 11.8%, continuing its recovery from the huge population loss after Hurricanes Katrina and the related flood control failures, which the Independent Levee Investigation Team concluded was the "single most costly catastrophic failure of an engineered system in history." New Orleans has now recovered more than 70% of its population loss between 2005 and 2006. In 2005, the population was 455,000, which fell to 209,000 in 2006, before recovering to the 2014 figure of 384,000.

    The balance of the top five, Denver, Orlando and Charlotte also grew more than 10% between 2010 and 2014. The second five in population growth were Seattle, Washington (DC), Raleigh, Atlanta and San Antonio.

    Slowest Growing Core Municipalities

    Eight of the 10 slowest growing municipalities were in the Northeast and Midwest, including Detroit, Cleveland, Buffalo, St. Louis, Rochester, Pittsburgh, Hartford and Cincinnati. Two were in the South, Birmingham and Baltimore.

    Eight core municipalities lost population. The largest loss was in Detroit, which fell 4.7% to 680,000. This is a continuation of the catastrophic losses from 1950, when Detroit had 1,850,000 residents. It may be surprising, however, that Detroit has become the core municipality with the greatest loss only this year. Until 2013, St. Louis had lost the largest share of its population from 1950 (when its population was 857,000). By 2014, Detroit had lost 63.2% of its 1950 population, compared to the 63.0% loss in St. Louis). St. Louis also continued its losses, dropping 0.6% between 2010 and 2014.

    Cleveland and Buffalo had greater losses than St. Louis. Cleveland slipped 1.8% to 390,000, while Buffalo dropped 1.0% to 259,000. Losses of less than 0.5% were posted in Pittsburgh, Hartford and Birmingham.

    More-than-a-Million Municipalities

    The United States added its 10th municipality with more than 1,000,000 in the 2014 estimates. San Jose joins Los Angeles and San Diego as California’s third more-than-a-million city. As a result, California now equals Texas, which had led the nation, with three cities with more than 1,000,000 residents in previous years (Houston, San Antonio and Dallas).

    Texas, however, should soon reclaim the exclusive title. The city of Austin forecasts that its population will reach 1,000,000 population early in the 2020s, which would give Texas four more-than-a-million municipalities. This forecast, however, could be too conservative. If the Texas city continues to grow at its current rate, a population of more than 1,000,000 could be reached before the 2020 census.

    Yet, the core municipalities with more than 1,000,000 – particularly the new entrants – are not particularly dense, but are virtually suburban in form, that is, auto-oriented and generally low density.  Three have less than one percent of their population in urban core neighborhoods, including Phoenix, San Antonio and San Jose, Dallas and Houston have less than two percent of their population in urban core neighborhoods, while San Diego has less than three percent. Even in Los Angeles only 30% of residents live in urban core neighborhoods. Only three of the largest municipalities have most of their population in urban core neighborhoods, New York, (97%), Philadelphia (86%) and Chicago (77%).  

    Lower Density Growth Could be Dominant in Core Cities

    The new population estimates provide little indication how much core city growth since 2010 is urban intensification versus low density suburban development. However, the concentration of growth where urban cores are smaller implies that growth has been stronger at lower in the suburban portions of core municipalities. To know for sure will require waiting for later small area data.

    Related article: U.S. Population Estimate Accuracy: 2010

    Note: The analysis is based on the City Sector Model (Figure 1), which classifies small areas (ZIP codes, more formally, ZIP Code Tabulation Areas, or ZCTAs) in major metropolitan areas based upon their behavioral functions as urban cores, suburbs or exurbs. The criteria used are generally employment and population densities and modes of work trip travel. The purpose of the urban core sectors is to replicate, to the best extent possible, the urban form as it existed before World War II, when urban densities were much higher and when a far larger percentage of urban travel was on transit or by walking. The suburban and exurban sectors replicate automobile oriented suburbanization that began in the 1920s and escalated strongly following World War II.

    Wendell Cox is principal of Demographia, an international public policy and demographics firm. He is co-author of the "Demographia International Housing Affordability Survey" and author of "Demographia World Urban Areas" and "War on the Dream: How Anti-Sprawl Policy Threatens the Quality of Life." He was appointed to three terms on the Los Angeles County Transportation Commission, where he served with the leading city and county leadership as the only non-elected member. He served as a visiting professor at the Conservatoire National des Arts et Metiers, a national university in Paris. Wendell Cox is Chair, Housing Affordability and Municipal Policy for the Frontier Centre for Public Policy (Canada), is a Senior Fellow of the Center for Opportunity Urbanism and is a member of the Board of Advisors of the Center for Demographics and Policy at Chapman University.

    Photo: Newest more-than-a-million US core city, virtually all-suburban San Jose by Robert Campbell [GFDL or CC BY-SA 3.0], via Wikimedia Commons

  • Malls Washed Up? Not Quite Yet

    Maybe it’s that reporters don’t like malls. After all they tend to be young, highly urban, single, and highly educated, not the key demographic at your local Macy’s, much less H&M.

    But for years now, the conventional wisdom in the media is that the mall—particularly in the suburbs—is doomed. Here a typical sample from The Guardian: “Once-proud visions of suburban utopia are left to rot as online shopping and the resurgence of city centers make malls increasingly irrelevant to young people.”

    To be sure, there are hundreds of outmoded malls, long-in-the-tooth complexes most commonly found in working-class suburbs and inner-ring city neighborhoods. Some will never come back. By some estimates, something close to 10 to 15 percent of the country’s estimated 1,000 malls will go out of business over the next decade; many of them are located in areas where budgets have been very tight, with locals tending to shop at “power centers” built around low-end discounters such as Target or Walmart.

    But the notion that Americans don’t like malls anymore is misleading. The roughly 400 malls that service more-affluent communities—like those typically anchored by a Bloomingdale’s or Nordstrom—recovered most quickly from the recession, and now appear to be doing quite well.

    To suggest malls are dead based on failure in failed places would be like suggesting that the manifest shortcomings of Baltimore or Buffalo means urban centers are not doing well. Like cities, not all malls are alike.

    Looking across the entire landscape, it’s clear the mall is transforming itself to meet the needs of a changing society but is hardly in its death throes. Last year, vacancy rates in malls flattened for the first time since the recession. The gains from e-commerce—6.5 percent of sales last year, up from 3.5 percent in 2010—has had an effect, but bricks and mortar still constitutes upwards of 90 percent of sales. There’s still little new construction, roughly one-seventh what it was in 2006, but that’s roughly twice that in 2010.

    Shopping in stores, according to a recent study from A.T. Kearney, is preferred over online-only by every age group, including, most surprisingly, millennials, although many of them research on the web, then visit the store, and sometimes then order on line. The malls that are flourishing tend to be newer or retrofitted and are pitched at expanding demographic markets. These “cathedrals of commerce” in the past tended to reflect the mass sameness of mid-century America; those in the future focus on distinct niches—ethnic, income, even geographical—that are not only viable but highly profitable.

    This leaves us with a tale of two kinds of malls. One clear dividing line is customer base. In the ’80s and before, malls succeeded fairly universally, notes Houston investor Blake Tartt. But now it’s a matter of being in the right place. “Everything has changed and you have to be with the right demographics,” he suggests. “It’s not so much about the mall but the location that matters.”

    Old malls in declining areas, notes a recent analysis by the consultancy Costar, do truly face a “bleak future” and should look to be converted into apartments, houses, corporate headquarters, or churches.

    In contrast, affluent urban areas are becoming an unexpected hotspot for malls—even outlet malls are opening open in the urban core. You now see gigantic malls in places like Manhattan: the Shops on Columbus mall in Manhattan, the world’s fifth-most profitable mall, looks inside like it was teleported from Orange County, California, or, god forbid, Long Island.

    This is not unusual across the world. Malls are on the march in many of the world’s biggest cities, including Istanbul, Mumbai, Singapore, and Dubai. Today Asia is the site of seven of the world’s 10 largest malls, in places like Beijing, Dubai, and Kuala Lumpur.

    In the developing world, malls grow as local shopping streets either gentrify or decay. This is particularly true in fast-growing developing countries where malls are often seen as an escape from hot, humid, dirty and even dangerous urban environments. Indian novelist and Mumbai blogger Amit Varma suggests that these folks like malls “because they are relatively clean and sanitized” as opposed to the city’s pollution-choked, beggar-ridden and often foul-smelling streets.

    Ethnic Malls

    Within the U.S., demographic change is creating opportunities for a new breed of mall-maker. Across the country, savvy investors and developers have been buying older malls, which tended to serve either Anglo or African-American customers, and shifting them instead to focus on fast-growing ethnic markets. Such malls can now be found in traditional Latino areas such as Southern California and Texas, but they also exist in Atlanta, Las Vegas, Oklahoma City, and Charlotte, places that have recently become major hubs for immigrants.

    “We had a terrific recession,” notes Los Angeles-based mall maven Jose Legaspi, who has developed 12 such malls around the country. “You do well if you target specific niches that are growing. You can’t make it with a plain vanilla mall. We are creating in these places a Hispanic downtown.”

    Fort Worth’s 1.2 million-square-foot La Gran Plaza, which Legaspi manages, epitomizes the advantages of such marketing. When investor Andrew Segal bought the mall in 2005, it was a failing facility that primarily serviced a working-class Anglo population. Barely 15 percent of the mall’s tenants were both open and paying rent.

    Segal quickly recognized that the area around the mall—like much of urban Texas—was becoming more diverse, in this case largely Latino.

    Segal and Legaspi redid the once prototypical plain vanilla mall to look more like a Northern Mexican town plaza, a design pattern developed by Los Angeles architect David Hidalgo. Latino customers are drawn to amenities like large and comfortable family bathrooms, an anchor supermarket, mariachi music shows, and even Catholic masses. There is also a “swap meet” that accommodates small vendors, something that Legaspi sees as essential to creating “a carnival of retail experiences.” By 2008, when the face-lift was complete, the mall achieved 90 percent occupancy. Today La Gran Plaza is effectively “full,” says Segal, who is considering a further expansion of the mall.

    The viability of ethnic malls in hard times demonstrated their viability in better ones. When Dr. Alethea Hsu opened her Diamond Jamboree Center in Irvine, California, the state was reeling from the recession. Yet from the time she opened in 2008, her mall, which focuses on Orange County’s large and expanding Asian population, has been fully occupied. It includes various realty offices, hair salons, medical offices, a Korean supermarket, and a small Japanese department store, all primarily aimed at a diverse set of Asian customers. The biggest problem—for those interested in choosing among various kinds of Chinese, Vietnamese, Korean, or Japanese cuisine—is not that it’s deserted but that it’s often difficult to get a parking space.

    Be sure of this: The ethnic mall is no flash in the pan, at least as long as immigrants pour into this country. By 2000, one in five American children already were the progeny of immigrants, mostly Asian or Latino; today they make up as much as one-third of American kids. These kids, and their own offspring, not to mention Anglo or African-American friends, have been brought up with food and fashion tastes that often originate in Mexico, Taiwan, Japan, Korea, or China. When I was a kid growing up in New York, you went to Chinatown or Little Italy for an ethnic infusion. Now you get in your car, park, and get options not so dissimilar than what you would find—usually in a mall—in Mexico City, Mumbai, or Singapore.

    The World According to Rick

    For most of America, says Los Angeles developer Rick Caruso, the future lies in replicating the function that Main Street once served. Rather than simply a center for instant consumption and transactions, the mall is a social meeting point, says Caruso, who has 10 developments under his belt. To make it all work means adding often unconventional amenities such as live entertainment or the lighting of Christmas trees and the Chanukah menorah.

    This is part of a broader mall trend in which developers see their properities as community and entertainment centers, an approach adopted now by mainstream mall developers such as Westfield, whose projects are increasingly open-air and built around amenities such as health clubs and trendy restaurants and cafes.

    The ultimate example may be the Caruso-owned Grove, a giant open-air mall that lies next to the Farmers’ Market, one of the oldest and beloved shopping areas in Los Angeles. The world’s eighth-most profitable mall, the Grove is laid out like a Disneyesque Main Street and is particularly appealing to families and tourists. Overall, the Grove now ranks among L.A.’s leading tourist attractions. This reflects both the development’s pleasant, pedestrian-oriented design as well as proximity to the Farmer’s Market, which remains, as has been traditional, largely a collection of small, idiosyncratic stalls.

    A sense of place is what makes the Grove—and, to a lesser extent, Caruso’s other developments—work. Located in the Miracle Mile district of L.A., it attracts a huge urban population that includes old Jewish shoppers from the immediate area as well as the growing ranks of hipsters, tourists, and the rest of the vast diversity that is Los Angeles. Caruso’s other centers, like the Commons in suburban Calabasas and The Promenade in Westlake, may lack global appeal but they succeed as anchors of their communities. Without developed, large historic downtowns, these communities still need a central place, and for them, the malls, however imperfectly, come closest to delivering it.

    In today’s environment, Caruso suggests, a mall has to offer something that online retailers, power centers, or catalogs cannot provide: a social experience. “You have to differentiate yours, offer a place for people to gather for holidays. People are yearning for a place to connect with each other. We are not building just town centers, but the centers of towns.”

    Ironically these malls are fulfilling a role that some urbanists have denounced the suburbs for lacking. “What do most urbanists want?,” asks David Levinson, director of the Networks, Economics, and Urban Systems Research Group. “A lively, pedestrian realm, clean, free of automobiles, with a variety of activities, the ability to interact with others and randomly encounter friends and acquaintances. This is what the shopping mall gives.”

    The New Town Center: With Suburban Revival, New Hope for Malls

    The notion of dead malls has been connected to a similar idea about the inevitable demise of the suburbs, which appeared possible at the height of the recession, but has since been shown to be largely false. Suburbs may not be booming as in the ’90s, but they are now growing as fast as core cities, and constitute more than 70 percent of all new population and 80 percent of new job growth since 2010.

    Surprisingly, the most recent numbers suggest that the outer suburbs and exurbs, once consigned to Hades by the new urbanist crowd, have begun to roar back. Millennials, as they get older, notes Jed Kolko, now seem to be moving to what he calls “the suburbiest” areas farther out on the periphery. 

    It is in these areas that malls may have their greatest future. In communities like Irvine, where the Spectrum development has become the de facto downtown, or Sugar Land, a highly diverse outer suburb of Houston, the “town center” is essentially a mall in brick, made to look like an old Main Street but filled with chain stores and specialty restaurants. Many residents of fast-growing communities like Sugar Land, which has 83,000 residents, are relative newcomers, and for them such town centers are the focus of their communities.

    It is time to dispense with the twin memes of mall- and suburb-bashing, and begin appreciating and improving how most Americans live and shop. The malls of the future indeed may be very different in many ways—more segmented by income and ethnicity, more entertainment- and experience-oriented. But they will continue to serve an important focus for most American communities. And at a time when many of our most celebrated cities have themselves become giant malls (is there any place on Earth more boring than the area around Times Square?), the future of malls may prove brighter, and even more transformative, than commonly imagined.

    This piece first appeared at The Daily Beast.

    Joel Kotkin is executive editor of NewGeography.com and Roger Hobbs Distinguished Fellow in Urban Studies at Chapman University, and a member of the editorial board of the Orange County Register. He is also executive director of the Houston-based Center for Opportunity Urbanism. His newest book, The New Class Conflict is now available at Amazon and Telos Press. He is also author of The City: A Global History and The Next Hundred Million: America in 2050.  He lives in Los Angeles, CA.

    Photo: “Thegrove“. Licensed under CC BY-SA 3.0 via Wikipedia.

  • Better Suburbs = Better Cities: Employment and the Importance of the Suburban Economy

    Australia’s inner city areas and CBDs are a focus of media and public policy attention, with good reason. But it’s also true that the real engines of employment are outside the inner city areas and that the dominant role of our suburban economy as an economic engine is grossly understated, even ignored. This is not good public policy. It’s not even common sense. 

    I have a view that the focus on urban renewal and inner urban economic development has become a policy obsession of late. It’s the trendy thing to quote Richard Florida’s ‘creative class’ theories which become the excuse to increasingly spoil inner city workers with transport, cultural and other forms of taxpayer funded infrastructure. There was a time when inner city areas, if not recapitalised, risked pockets of blight. But those days have passed. Today, it is the suburban landscape – much derided in fashionable inner city policy circles – that risks pockets of blight if not brought back to the attention of policy makers and strategically recapitalised.

    The imperative is simple: the suburban economy is so much larger than inner city areas. As a rule of thumb, between 8 and 9 out of ten jobs in our major metro regions of Brisbane, Sydney and Melbourne are suburban. Only one in ten or at most two in ten, are found in the inner city areas. Achieving a 10% improvement in the suburban economic engine is hypothetically equivalent to achieving an 80% improvement in the economic performance of the inner cities. 

    So why this preoccupation with the inner cities to the detriment of the suburbs?

    First, a quick review of the evidence as provided in the Census. 

    In Brisbane, the CBD itself accounts for 12.5% of the Brisbane region’s employment numbers – one in eight. The combined CBD and inner city areas – including the CBD – account for around 170,000 jobs.  That’s not a very big number.  As a proportion of state-wide jobs, it’s less than 9%. As a proportion of the 925,000 jobs across the metro region of Brisbane, it’s less than one in five – and that’s with including the near city areas like South Brisbane, Fortitude Valley and Spring Hill. 

    In Sydney in 2011, the CBD accounted for only 8.3% of all jobs in New South Wales, and for only 13.4% of all jobs in wider metropolitan Sydney. Including the surrounding areas of Pyrmont, Ultimo, Potts Point, and Woolloomooloo raises this share to just 9.7% of all jobs in the state and 15.6% of jobs in metropolitan Sydney. So one in ten state-wide jobs and one in every six or seven metro wide jobs. 

    In Melbourne, the CBD is home to just 7.6% of the state’s total employment, and to just 10.6% of all jobs in greater Melbourne. Including the ‘fringe’ locations of Docklands and Southbank sees this share rise to only 10.3% of the state and 14.3% of greater Melbourne, which is one in ten of all jobs in the state and one in seven metro wide jobs.

    In none of these centres is the concentration of inner city jobs close to one in four metro wide jobs. Yet if you asked a room full of people – industry and planning experts included –a significant proportion will think the figures are much higher. I’ve done this several times at workshops and presentations and there are a worrying proportion of people who seem to think the figure is more than 50%. A wider survey of the general public might even put the figure higher – it would be an interesting exercise to find out.

    Suburban employment centres are by nature much more widely dispersed. Teachers, doctors, dentists, tradies, factory workers, shop workers and so on do not rely on close proximity to each other to perform their work, as do CBD employment markets. In the suburban business districts of our metro regions, workforce concentrations typically fall into a band somewhere between 3,000 and 5,000 jobs per square kilometre. Places with super-regional shopping centres will tend to be at the upper end of that scale while industrial areas at the lower end. CBDs, by contrast, can easily have pockets where the employment density sails past 10,000 or 20,000 jobs per square kilometre.

    But however dispersed these suburban jobs may be, it doesn’t make them any less important to the economy – particularly given their dominant role as employment and economic engines.

    So why then the preoccupation with the inner cities and why the dearth of policy interest in the suburbs? 

    Perhaps the inner cities are seen as more glamorous? There are more higher paying jobs and more CEOs to the square mile than anywhere else. It’s where cultural facilities and seats of government are found. It’s where the most expensive real estate is. Basically, any concentration of money plus power is always going to grab attention. It’s an age when celebrity tweets capture more media and public attention than important issues of economic policy. The CBDs and inner city areas are widely seen as ‘where it’s at’ and where the cool people are. ‘Nuff said?

    Sadly, even policy makers seem to have fallen for the inner city bling over suburban substance. The importance of transport workers, freight workers, teachers, doctors, tradies or suburban white collar employment to the economy receives next to no policy comment. The performance of suburban transport systems, the need to promote higher employment density in key centres, the pathways by which property owners could be encouraged to partner with public sector agencies for suburban centre improvement – none of these seem to appear as workshop or forum topics promoted by any of the leading industry groups. 

    I suspect there’s also a strong element of cultural cringe as it applies to our suburban heritage. Frequently mocked as a cultural wasteland or ‘home of the bogan’, there’s an almost desperate desire to prove we’re an advanced society by focussing on the lifestyles and achievements of our inner city areas and the people who live and work there, to the exclusion of all else. ‘Urbanists’ grab headlines and appear as keynotes at any number of planning conferences. Sub urbanists (and there are plenty of them) are evidently persona non grata.

    It’s as if a prosperous, successful and highly efficient suburban economy simply doesn’t cut it in the global race for attention and status amongst cities, which seems almost exclusively focussed on the how much like downtown New York or downtown Paris every other city can pretend to be. 

    The reality is that the inner city economy is reliant on – not divorced from – the performance of the suburban economy. In the same way that there can be no public sector without a profitable private sector, I suggest that a strong and prosperous inner city economy relies heavily on a strong and prosperous suburban economy. And in the same way that strategic infrastructure and policy decisions are needed for the inner city to operate at optimum efficiency, the exact same applies to suburban economies.  

    The question is whether this balance is being achieved.

    Ross Elliott has more than 20 years experience in property and public policy. His past roles have included stints in urban economics, national and state roles with the Property Council, and in destination marketing. He has written extensively on a range of public policy issues centering around urban issues, and continues to maintain his recreational interest in public policy through ongoing contributions such as this or via his monthly blog The Pulse.

  • Celebrating Strips Malls: Strength in Standardization

    Our current urbanized form has become remarkably homogenous. Anywhere in Florida, and in much of the United States, one now experiences a new sense of sameness in the texture and the pace of places. America has entered a period of uniform buildings, roads, and infrastructure, differing only in the details. We live in a very standardized America today.

    To witness the new homogeneity, look no farther than the commercial strips that have come to dominate the 21st century experience. These strips are our marketplace, our town square writ large, and are a study in careful, intentional uniformity. In commercial America, from New York to California, these strips are smoothly uniform in both their scale and their details to a startling degree, differentiated only by local geography.

    This is the quiet strength of our country. Our commercial environment, although criticized for its aesthetic monotony, unifies our national experience. The endless asphalt strip expresses the contemporary American lifestyle, a way of ordering our space that represents our participation in the high-energy global economy. It’s ugly, but it works; so goes consumerism.

    Businesses that compete for the customer dollar ensure familiarity and efficiency, and the uniformity extends to the design of the store, both inside and out. From the front door to the street, a precise series of moves are choreographed around the invisible practices of safety, security, and barrier-free flow from the car door to the cash register. All of these dictate uniformity of design, a certain monolithic character, which moves the customer effortlessly from merchandise to the point of sale to the driveway.

    The driveway leads to the street. While we yearn for alternatives to the car, we still cling to its super mobility. Its influence results in a rigid, standardized design for all pavement. Lights, signs, intersections, and the pulse and rhythm of the road all become one. Gone, for the most part, are local eccentricities such as stoplights turned sideways; in their place are broad, well-lit roadways with the same signals everywhere, built with the future in mind. This, again, is a strength. Americans have always tended towards mobility, and standardization enables freedom of movement and a state of supermobility that is imagined, if not quite achieved.

    Because America’s building industry climbed a series of regulatory steps in the last several generations, today’s built environment is more uniform and less specific to its particular locale, with a vague, broad national character that is barrier-free and safe. Starting with the 1992 Americans with Disabilities Act (ADA), and continuing today with the International Building Code, standardization has become a quiet but powerful force.

    The ADA sought to remove the localized, obstacle-ridden geography that restricted a large population with sensory or mobility difficulties from having access to buildings and places. Since its passage, a substantial portion of our constructed world has been built under these rules, and older buildings have been adjusted to remove barriers. The result of this act has been to cause much of America to look the same, from the way our sidewalks rise up from the street to the size of our public bathrooms.

    Building codes became standardized, too. In the 1990s, three regional codes converged into one International Building Code. With the real estate development economy normalized at a national scale, it has become more efficient to deliver the same product everywhere, rather than customize an office or a store to local eccentricities. Building codes, which go back to Hammurabi’s time, have evolved into exquisitely complicated texts, annotated like the Talmud and as complex as the tax code. This sameness, again, allows super-mobility and comparisons of sales and productivity metrics from one place to another. It smooths the evolution of a new, migratory America. This again is a strength, if efficiency is any measure.

    Local codes still customize structures to particular locales; California requires resistance to seismic activity, and Florida protects against hurricanes. A lot of idiosyncratic localisms — nuances that did little to protect anybody — have been done away with, however. A wood building in the Midwest, for example, was called a Type Five building, while in the South it was Type Six, with accompanying detailed descriptions differing in little details. These were all melded into one, wood-frame building type by the new code, simplifying national-scale construction and design, and eliminating wastefulness. This convergence of codes promotes a common system of definitions and measures of firmness and safety.

    Intertwined with this rather massive regulatory convergence is, of course, the globalization of the economy. Standardization of materials is critical for manufacturers importing key products from overseas, and for assuring national real estate developers of similar costs from coast to coast. Sameness is a virtue, from an accounting perspective.

    Should this sameness be doubted, interview any offshore visitor about their American experience. While American behavior may generate complaints, the American built environment inspires awe and respect. “Why can’t we have this in our country,” more than one international guest has bitterly questioned me, usually pointing to a clean, well-ordered aspect of place that we take for granted. “America,” stated one South American to me recently, “is still the safest place to buy real estate, because of your standardization.” Monotony and safety features make for a dull sense of place, but great property values.

    How this came about is a study in our faith in the future. America has always had faith that things will get better, even in the darkest of times. This belief in the future seems lost today if one focuses merely on the surface, and the general deterioration of our national conversation. Our actions, however, are different than our words, and our actions – widening roads, consolidating codes, standardizing infrastructure – are those of a people in the process of perfecting our built environment. Only a people that cares about the future would be doing this.

    American roads and buildings are not precious; we are not a sentimental people, by and large, when it comes to our physical environment. The American style of place is a product of our society’s character. It is barrier-free, safe, and guarded well against disaster. Our character transcends the superficial notion of “style” and is expressed in a uniform, shared sense of place. Monotonous, yes; as all standardization tends to become, but with a great value placed upon planning and design.

    A positive byproduct of this style of place is equity. Roads (except toll roads) can be travelled by all, and buildings are built safely for all. Another is efficiency, speeding up the process of rolling out new infrastructure. A final byproduct is the future; we are giving our children’s generation a simplified infrastructure with one operating manual.

    What our progeny does with our standardized environment is up, of course, to them. Uniformity is a tacit scaffold upon which a unique, more localized future can be built, celebrating the specific geography and society of each individual place. Suffocating monotony can perhaps give way to flexibility, creativity, and a character that expresses our diversity as we move ahead.

    Richard Reep is an architect with VOA Associates, Inc. who has designed award-winning urban mixed-use and hospitality projects. His work has been featured domestically and internationally for the last thirty years. An Adjunct Professor for the Environmental and Growth Studies Department at Rollins College, he teaches urban design and sustainable development; he is also president of the Orlando Foundation for Architecture. Reep resides in Winter Park, Florida with his family.

    Flickr photo by Payton Chung, Meanwhile in Ethnoburbia: the new Chinatown in California’s San Gabriel Valley.

  • Suburban Migration In Baltimore

    One unique aspect of Baltimore is that it is a so-called “independent city” that is not part of any county. Because of this, migration data from the IRS allows us to look specifically at the city of Baltimore. So I wanted to take a quick look at migration between Baltimore and its suburbs.

    As you might expect, there’s been a net outflow of people from the city for quite some time. From 1990 to 2011 (the most recent year the IRS has released), Baltimore lost almost 151,000 people on a net basis to its suburbs. Here’s the chart:


    You see here that Baltimore had an accelerating net loss of people, but then showed a steep drop in net loss through the 2000s. This is consistent with county level migration I’ve seen in other regions.

    When people leave, they take their money with them. Baltimore’s cumulative net loss of annual income to its own suburbs from departing residents is about $2.75 billion from 1992 to 2011. (Income data isn’t available for 90-91 and 91-92 movers). That’s annual income, so this loss in effect recurs every single year. That’s a lot of money. Here’s the chart on adjusted gross income loss (in thousands of dollars):


    What was a small post-recession bump in the people numbers is a more sizable one in the money figures.

    Since we can, let’s also look at the individual flows of people leaving and people coming in. Here are people moving from Baltimore to the suburbs:


    And here are people moving from the suburbs to the city of Balitmore – and yes, lots of people do that:


    Here we see that the decline in Baltimore’s net loss was driven both by a decline in the number of people leaving and by an increase in the number of people coming in. This is similar to what I’ve seen in other similar places. The uptick in the recession is due to a drop off in the number of in movers.

    There are some pretty dramatic movements in the early 90s, which were an interesting time in urban America to put it mildly. I’m not familiar with the specifics of Baltimore in that era. Some other regions I looked at – including St. Louis, which is also an independent city – show higher early 90’s migration, but nothing like the swing in Baltimore.

    We will have to see what happens in post-2011 years. The IRS is delayed in issuing data, and has been trying to kill off this data program entirely, so who knows when more data will be available. 2012 data should in theory be out right about now, but we are some years away at best from finding out what impact this year’s riots might have had.

    I should caveat this data by noting that it is based on tax returns that can be matched from year to year, so there are some movers who aren’t captured. As you can see, this is a pretty large data set, however.

    Aaron M. Renn is a senior fellow at the Manhattan Institute and a Contributing Editor at City Journal. He writes at The Urbanophile, where this piece first appeared.