Category: Suburbs

  • How the California Dream Became a Nightmare

    Important attention has been drawn to the shameful condition of middle income housing affordability in California. The state that had earlier earned its own "California Dream" label now limits the dream of homeownership principally to people either fortunate enough to have purchased their homes years ago and to the more affluent. Many middle income residents may have to face the choice of renting permanently or moving away.

    However, finally, an important organ of the state has now called attention to the housing affordability problem. The Legislative Analyst’s Office (LAO) has published "California’s High Housing Costs: Causes and Consequences," which provides a compelling overview of how California’s housing costs have risen to be by far the most unaffordable in the nation. It also sets out the serious consequences.

    The LAO says that:

    Today, an average California home costs $440,000, about two-and-a-half times the average national home price ($180,000). Also, California’s average monthly rent is about $1,240, 50 percent higher than the rest of the country ($840 per month).

    LAO describes the evolution:

    Beginning in about 1970, however, the gap between California’s home prices and those in the rest country started to widen. Between 1970 and 1980, California home prices went from 30 percent above U.S. levels to more than 80 percent higher. This trend has continued.

    Much of the LAO focus is on California’s coastal counties, where:

    ….community resistance to housing, environmental policies, lack of fiscal incentives for local governments to approve housing, and limited land constrains new housing construction.

    These causes result from conscious political decisions. While California’s coastal counties do not have the vast stretches of flat, appropriately developable land that existed 50 years ago, building is increasingly  prohibited on that which remains (for example, Ventura County, northern Los Angeles county and the southern San Jose metropolitan area).

    Demonstrating an understanding of economic basics not generally shared by California policymakers or the urban planning community, LAO squarely places the blame on the public policy limits to new housing construction:

    This competition bids up home prices and rents.

    In other words, where the supply of a demanded good is limited, prices can be expected to rise, other things being equal. LAO describes the impact of so-called "growth control" policies, which are also called "urban containment" or "smart growth:"

    Many Coastal Communities Have Growth Controls. Over two-thirds of cities and counties in California’s coastal metros have adopted policies (known as growth controls) explicitly aimed at limiting housing growth. Many policies directly limit growth—for example, by capping the number of new homes that may be built in a given year or limiting building heights and densities. Other policies indirectly limit growth—for example, by requiring a supermajority of local boards to approve housing projects. Research has found that these policies have been effective at limiting growth and consequently increasing housing costs.

    According to LAO, the problem is exacerbated by voter initiatives: "More often than not, voters in California’s coastal communities vote to limit housing development when given the option." It is hard to imagine a more sinister disincentive to aspiration, under which voters can deny equality of opportunity in housing to others by artificially driving up the price.  Because new housing further from coast is also limited, options for a middle income living standard are also diminished.

    These public policies have consequences.

    Notable and widespread trade-offs include (1) spending a greater share of their income on housing, (2) postponing or foregoing homeownership, (3) living in more crowded housing, (4) commuting further to work each day, and (5) in some cases, choosing to work and live elsewhere

    Each of these consequences is described below.

    LAO Consequence #1: Spending a Greater Share of Income on Housing

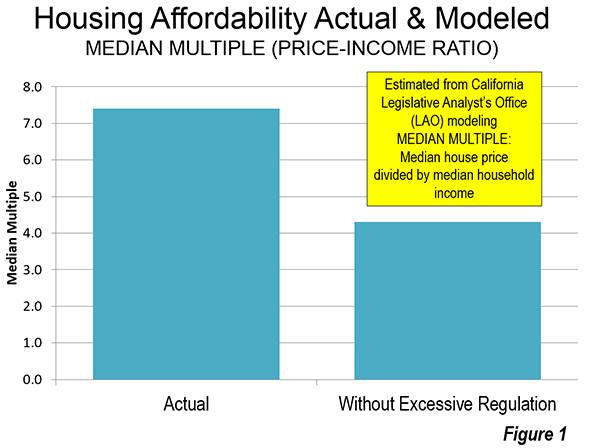
    LAO models the market situation from 1980 to 2010 to estimate the prices that would have prevailed if the regulatory environment had permitted building sufficient to satisfy customer demand at previous lower price levels. In both years, LAO estimates that the median priced house would have cost 80% more than in the rest of the nation (actual data in 1980, modeled data in 2010). This would have kept California house price increases at the national level. I think it would have been better to have modeled from 1970, before the huge house prices before 1980 described by Dartmouth economist William Fischel.

    I have applied this LAO model estimate to the median multiple for California’s six major metropolitan areas (Los Angeles, San Francisco-Oakland, Riverside-San Bernardino, San Diego, Sacramento, and San Jose) to identify how much better middle income housing affordability would be without California’s excessive regulation. Using the LAO estimates the median multiple (median house price divided by median household income) in 2014 would have been at least 40% lower than the actual level in each of the metropolitan areas (Figure 1).

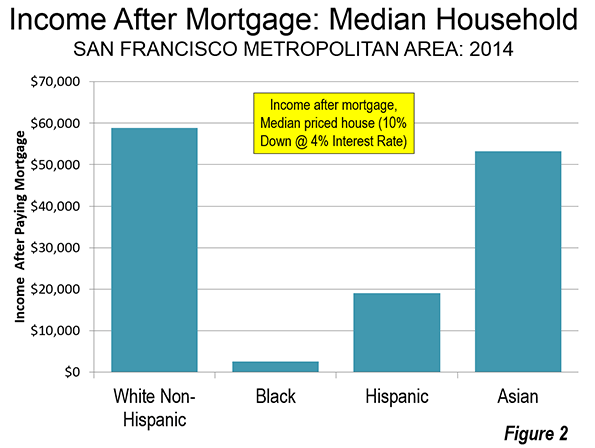
    Many California households already have been priced out of the market. In the worst case, it is estimated that in the San Francisco metropolitan area, a median income White Non-Hispanic household will have nearly $60,000 annually left over after paying the mortgage on the median priced house. This is less than they would have if house prices had remained reasonable, but it’s enough to live on. The median income Asian household would do almost as well, with about $50,000 left over. The median income Hispanic household would have less than $20,000 left, which is considerably less than is likely to be needed for other essentials. The median income Black household would have less than $3,000 left over (Figure 2). If the price ratios of 1980 were controlling, that amount would rise by $16,000.

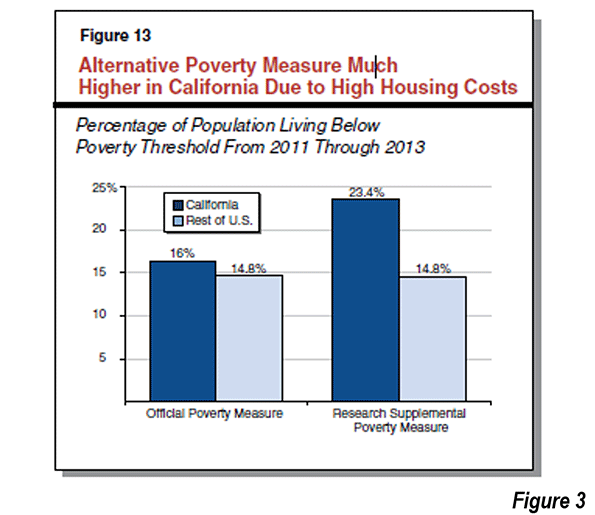
    LAO also points out that the Golden State has the highest housing cost adjusted poverty rate in the nation. The latest data shows housing-adjusted poverty rate is far higher even than that in states with a reputation for grinding poverty. California’s housing adjusted poverty rate is more than 50% higher than that of Mississippi and approaches double that of West Virginia (Figure 3, LAO Figure 13)

    LAO Consequence #2:  Postponing or Forgoing Homeownership

    LAO indicates that California ranks 48th in homeownership percentage, behind only New York and Nevada. LAO emphasizes the value of home ownership:

    Homeownership helps households build wealth, requiring them to amass assets over time. Among homeowners, saving is automatic: every month, part of the mortgage payment reduces the total amount owed and thus becomes the homeowner’s equity. For renters, savings requires voluntarily foregoing near-term spending. Due to this and other economic factors, renter median net worth totaled $5,400 in 2013, a small fraction of the $195,400 median homeowner’s net worth.

    Californians are buying their first houses later. LAO indicates that the average first home buyer in California is three years older than the national average.

    LAO Consequence #3:  Living in More Crowded Housing

    The nation’s worst overcrowding is an unfortunate result of California’s housing policies.

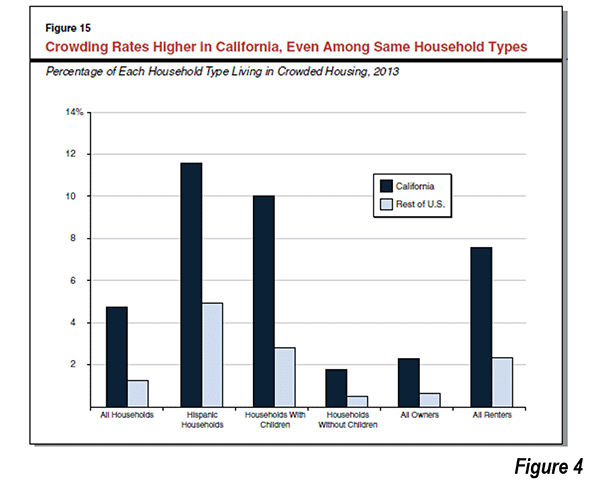
    LAO indicates that California’s overcrowding rate is well above that of the rest of the nation’s rate. Among Hispanics, which were expected to exceed the White-Non-Hispanic population in 2014, to become the state’s largest ethnic group, California overcrowding is more than 2.5 times the Hispanic rate elsewhere. Among households with children, overcrowding in California is four times the national households with children rate. Among renters, overcrowding in California is more than three times the national renter rate (Figure 4, LAO Figure 15).

    This has important negative social consequences. According to LAO, research indicates that overcrowding retards well-being and educational achievement:

    Individuals who live in crowded housing generally have worse educational and behavioral health outcomes than people that do not live in crowded housing. Among adults, crowding has been shown to increase stress and aggression, lead to social isolation, and weaken relationships between parents and their children. Crowding also has particularly notable effects on children. Researchers have found that children in crowded housing score lower on standardized math and reading exams. A lack of available and distraction-free studying space appears to affect educational achievement. Crowding may also result in sleep interruptions that affect mood and behavior. As a result, children in crowded housing also displayed more behavioral problems at school.

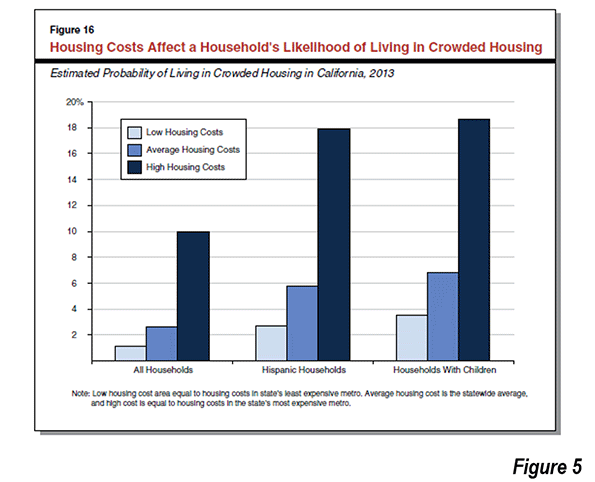
    Overcrowding is particularly acute in the higher cost coastal metropolitan areas of Los Angeles, San Francisco, San Diego, and San Jose. There, overcrowding among households with children reaches 10%, and among Hispanic households, overcrowding reaches 18%. Among households with children the figure is slightly higher (Figure 5, LAO Figure 16). Overcrowded housing is generally worse, according to LAO, in areas with higher house prices.

    In a state with a political establishment that prides itself in watching out for low income citizens and ethnic minorities, the need to reform the responsible policies could not be clearer.

    LAO Consequence #4: Commuting Farther to Work

    LAO finds that California’s average work trip commuting times are only moderately above the national average. However, LAO suggests that the commute lengthening impact of higher house prices may be reduced by California’s widespread (I call it dispersed) development pattern, its freeway system and the "above-average share of commuters who drive to work. (Driving commutes are generally fast, and therefore metros with higher shares of driving commuters tend to have shorter commute times.)"

    Nonetheless, according to LAO:

    …our analysis suggests that California’s high housing costs cause workers to live further from where they work, likely because reasonably priced housing options are unavailable in locations nearer to where they work.

    LAO Consequence #5:  Choosing to Work and Live Elsewhere

    LAO also indicates that California’s high housing prices are likely to have reduced its population (and economic) growth. LAO sites the strong net outmigration of California households to other states. LAO also finds in its national metropolitan area analysis that counties with higher growth rates tend to have better housing affordability than counties with lower growth rates.

    There has also been strong net outmigration from the coastal counties to inland counties. This is most evident in the growth of the Riverside-San Bernardino metropolitan area (the Inland Empire) between 2000 and 2010. The Inland Empire captured more than two thirds of the population growth of the Los Angeles Combined Statistical Area (Los Angeles, Orange, Riverside, San Bernardino and Ventura counties). LAO notes the impact of the excess of demand in the coastal counties, again recognizing the nexus between overzealous regulation and the loss of housing affordability:

    This competition bids up home prices and rents. Some people who find California’s coast unaffordable turn instead to California’s inland communities, causing prices there to rise as well.

    LAO also refers to the difficulty that employers have in retaining and recruiting staff. LAO cited survey data from the Silicon Valley, which has for years been California’s economic "Golden Goose" in recent years:

    In a 2014 survey of more than 200 business executives conducted by the Silicon Valley Leadership Group, 72 percent of them cited “housing costs for employees” as the most important challenge facing Silicon Valley businesses.

    In addition, there has been a strong movement of California companies to other parts of the nation, where more liberal regulations foster a better business climate.

    Restoring Housing Affordability

    LAO indicates the importance of fundamental reform and calls for putting "all policy options on the table."

    Major changes to local government land use authority, local finance, CEQA (California Environmental Quality Act), and other major polices would be necessary to address California’s high housing costs.

    In addition:

    The greatest need for additional housing is in California’s coastal urban areas. We therefore recommend the Legislature focus on what changes are necessary to promote additional housing construction in these areas.

    Perhaps the only weakness of the report deals with densification, particularly in coastal counties. For example, LAO suggests that without the housing restrictions the city of San Francisco is population would be 1.7 million, rather than the approximately 800,000 who live there today. In fact that would be unprecedented beyond belief. No core city that had become fully developed and reached 500,000 people by 1950 has achieved growth of this magnitude. The greatest growth was less than 10%, in this category of 60 core cities (which includes the city of San Francisco). Even less likely would be public support for such huge population growth in the second densest major municipality in the nation.

    While LAO does not indicate the additional population that its estimates would have placed in the core of Los Angeles, given the scale of the San Francisco increase, this could be a number of up to 3 million. This area, the broadest expanse of over 10,000 population per square mile density in the nation outside New York City is in the middle of the urban area with the nation’s worst traffic congestion, according to the Texas A&M Transportation Institute. It is doubtful that residents would have the "stomach" to expand roadway capacity to keep the traffic moving. Transit could not have made much difference. Even with its now extensive rail network that has opened since the early 1990s, driving alone accounted for 85% of the additional travel to work from 2000 to 2013 in the city of Los Angeles. Yet, the city of Los Angeles has the most extensive transit in the metropolitan area, including service by all rail lines.

    In reality, core densification is likely to be modest. Keeping housing affordability from getting worse requires regulatory liberalization throughout California, including coastal and inland areas
    The reality is that if California had permitted growth, it would naturally occurred mostly on the periphery. Even with the restrictions on building, the preference for suburban living (largely in detached housing) could not be repressed between 2000 and 2010. Less than 10% of the population growth in the Los Angeles and San Francisco Bay areas occurred in the cores.

    The Challenge

    Should the state of California begin to seriously discuss housing affordability, it will be important to ease restrictions throughout the state, not just in the coastal counties. There are serious barriers to placing the appropriate priority on improving the standard of living and minimizing poverty rates among California’s diverse population. Perhaps the biggest impediment is Senate Bill 375, which is being interpreted by the state and its regional planning agencies to require even more stringent land-use regulation.

    In this environment, LAO rightly raises this concern:

    If California continues on its current path, the state’s housing costs will remain high and likely will continue to grow faster than the nation’s. This, in turn, will place substantial burdens on Californians—requiring them to spend more on housing, take on more debt, commute further to work, and live in crowded conditions. Growing housing costs also will place a drag on the state’s economy.

    It is to be hoped that California’s distorted policy priorities will be righted to restore the California Dream.

    Photograph: Dense suburban development: Inland Empire (San Bernardino Freeway with Uplard toward the top and Ontario toward the bottom) – By author

    Wendell Cox is an international public policy consultant and principal of Demographia in St. Louis. He is a native Los Angelino, having been born within two miles of City Hall. He was appointed to three terms on the Los Angeles County Transportation Commission by Mayor Tom Bradley. Full biography is here.

  • The Evolving Geography of Asian America: Suburbs Are New High-Tech Chinatowns

    In the coming decades, no ethnic group may have more of an economic impact on the local level in the U.S. than Asian-Americans. Asia is now the largest source of legal immigrants to the U.S., constituting 40% of new arrivals in 2013. They are the country’s highest-income, best-educated and fastest-growing racial group — their share of the U.S. population has increased from 4.2% in 2000 to 5.6% in 2010, and is expected to reach 8.6% by 2050.

    Some Asian immigrant groups tend to struggle, notably Hmong, Laotians and Bangladeshis,,but on average, Indians, Chinese and Koreans do at least as well as Anglos, and in some cases better. In the 52 major metropolitan areas, Asians’ median household income is $70,600, compared to $66,100 for White non-Hispanics.

    Widening the focus to smaller cities, for the most part, the most heavily Asian communities in America tend to be prosperous, and many are tech oriented. They also tend to be overwhelmingly suburban, often in places that have good public schools.

    Shift To The Suburbs

    In the past Asians, like other immigrants, tended to cluster in “gateway cities” and often in the densest urban neighborhoods, like New York’s Chinatown. Now the center of gravity has shifted to the suburbs. Between 2000 and 2012, the Asian population in suburban areas of the nation’s 52 biggest metro areas grew 66.2% while those in the core cities expanded by 34.9%. In 2000 three large cities ranked among the 20 most heavily Asian cities with populations over 50,000: Honolulu, San Francisco and San Jose. In 2012, only the Hawaiian capital made the grade (Hawaii is the only state with an Asian majority).

    As of 2012, 18 of the 20 most heavily Asian communities were suburban, all but one of them are in California. Not surprisingly quite a few are the smaller cities of Silicon Valley, where Asians constitute roughly half of all tech employees. Cupertino, a city of 59,700 that is home to Apple’s headquarters, takes the title of the most Asian city in the U.S., with a population that was 65% Asian as of 2012, up from 45.9% in 2000. Other suburban cities around the Bay that are majority Asian include No. 2 Milpitas (64.5% Asian), Daley City, Sunnyvale, Fremont , Santa Clara and Union City. Of them, only Daley City and Milpitas were majority Asian in 2000.

    Most of the other top California cities are clustered in the San Gabriel Valley east of Los Angeles, including No. 3 Rosemead (62% Asian), No. 4 Monterey Park (61.1%), Arcadia, Alhambra and Diamond Bar. Many, like once solidly middle class Arcadia, are being “mansionized” by new immigrants into what some suggest is an Asian version of Beverly Hills. The other hot spot is Orange County, long seen as more a place for right-wing politics and surfers, which now has several cities in the top 20 of our list of the cities of the most Asian-dominated cities, including Westminster, Irvine and Garden Grove.

    Shifts Beyond California

    California has long been is the natural place for Asian immigrants to land, with 4.8 million currently residing in the state, almost the population of Singapore. New York, with 1.4 million Asians, ranks  second while Texas, with 964,000, ranks third. But Asian populations are increasing quickly in the Sun Belt. Texas’ Asian population increased by 71.5% from 2000 through 2010, adding a net 402,277, second most in the country over that span behind California’s  1.1 million gain. Texas is home to the only city outside California and Hawaii in the top 20 of our list of the most heavily Asian U.S. cities: the Houston suburb of Sugar Land, where 37.1% of the 82,000 residents are Asian. The area, not known as an immigrant hub in the past, now boasts the second largest Hindu temple in the country. In Plano, a suburb of Dallas, the Asian population rose 123% between 2000 and 2012 to 50,160, the highest growth rate in the nation among cities over 50,000 in population. It’s now 18.5% Asian.

    A number of states in the Southeast posted fast growth from 2000-10. Florida’s Asian population increased 70.8% to 266,256, while Georgia’s rose 81.6% to 314,467.

    Positioning For The Asian Century

    One clear trend here is that Asian populations are growing in areas that are on the cutting edge of the economy — in tech centers like Silicon Valley, and near New York’s global service firms (across the river from Manhattan, Jersey City is now 25% Asian, and New Jersey’s Asian population expanded 51% in the first decade of the century to 480,270). Around the manufacturing and technology companies of the Detroit and Seattle areas, Asian communities are growing. Troy, Mich., the center of “automation alley,” has attracted a small but expanding Asian population, and in Washington, the Boeing-dominated town of Renton and Bellevue, near Microsoft, have taken on more of an Asian flavor in the past decade.The fact that many Asians are well-educated and ideally suited to these critical industries is likely to enhance this correlation over time, whether engineering cars or tech gear, or getting into the guts of the global transactional economy.

    Asian growth is slower in areas less integrated into the emerging global economy, notably in places like small town Florida, the rural south and parts of the still hard-hit Rust Belt. These are generally not the hot-spots for Asian investment today. What these communities may want to consider in the future is how to enhancetheir attractiveness to Asians and Asian investors, who likely will play an ever-expanding role in shaping the country’s economic future.

    No. 1: Cupertino, Calif.

    Overall Population, 2012: 59,701
    Percentage Asian: 65.1%
    Percentage Change In Asian Population Since 2000: +71.9%

    No. 2: Milpitas, Calif.

    Overall Population, 2012: 44,226
    Percentage Asian: 64.5%
    Percentage Change In Asian Population Since 2000: +34.9%

    No. 3: Rosemead, Calif.

    Overall Population, 2012: 33,686
    Percentage Asian: 62.0%
    Percentage Change In Asian Population Since 2000: +29.9%

    No. 4: Monterey Park, Calif.

    Overall Population, 2012: 37,192 
    Percentage Asian: 61.1%
    Percentage Change In Asian Population Since 2000: +1.4%

    No. 5: Arcadia, Calif.

    Overall Population, 2012: 34,158 
    Percentage Asian: 59.8%
    Percentage Change In Asian Population Since 2000: +42.3%

    No. 6: Daly City, Calif.

    Overall Population, 2012: 60,137
    Percentage Asian: 58.0%
    Percentage Change In Asian Population Since 2000: +15%

    No. 7: Honolulu, Hawaii

    Overall Population, 2012: 186,940
    Percentage Asian: 54.2%
    Percentage Change In Asian Population Since 2000: +10.1%

    No. 8: Diamond Bar, Calif.

    Overall Population, 2012: 29,883
    Percentage Asian: 53.2%
    Percentage Change In Asian Population Since 2000: +25.3%

    No. 9: Fremont, Calif.

    Overall Population, 2012: 115,948
    Percentage Asian: 52.4%
    Percentage Change In Asian Population Since 2000: +55.1%

    No. 10: Union City, Calif.

    Overall Population, 2012: 36,374
    Percentage Asian: 50.8%
    Percentage Change In Asian Population Since 2000: +23.5%

    This piece first appeared at Forbes.

    Joel Kotkin is executive editor of NewGeography.com and Roger Hobbs Distinguished Fellow in Urban Studies at Chapman University, and a member of the editorial board of the Orange County Register. He is also executive director of the Houston-based Center for Opportunity Urbanism. His newest book, The New Class Conflict is now available at Amazon and Telos Press. He is also author of The City: A Global History and The Next Hundred Million: America in 2050.  He lives in Los Angeles, CA.

    Wendell Cox is principal of Demographia, an international public policy and demographics firm. He is co-author of the “Demographia International Housing Affordability Survey” and author of “Demographia World Urban Areas” and “War on the Dream: How Anti-Sprawl Policy Threatens the Quality of Life.” He was appointed to three terms on the Los Angeles County Transportation Commission, where he served with the leading city and county leadership as the only non-elected member. He was appointed to the Amtrak Reform Council to fill the unexpired term of Governor Christine Todd Whitman and has served as a visiting professor at the Conservatoire National des Arts et Metiers, a national university in Paris.

    Photo “asian american” by flicker user centinel.

  • Urban Core Millennials? A Matter of Perspective

    Yes, millennials are moving to the urban cores but not in significant numbers when view from the context of larger city (metropolitan area) trends. That’s the updated story, based on new small area data that approximates the year 2011 (Note: ACS 5-Year Data).

    Small area trends are important to understanding developments in metropolitan areas, because conventional municipal jurisdiction based analysis obscures the extent of large suburban areas within the boundaries of most core municipalities. In 2010, approximately 58% of the population in core municipalities lived in small areas that were essentially suburban, with much lower population densities than areas that developed before World War II, and where nearly all motorized travel is by car.

    Even worse, "principal cities," have been equated to core municipalities in some analyses, despite their overwhelming suburban, single family nature, such as Staten Island in New York to the broad expanses of Phoenix, Denver, and Portland. Excepting the core municipalities, the principal cities designated since 2000 are polycentric business centers, the metropolitan area criteria adopted by the Office of Management and Budget (OMB). Marking the transition of American cities from being monocentric to polycentric, principal cities are 92% suburban and exurban.

    This analysis uses my City Sector Model, which classifies small areas (ZIP codes, more formally, ZIP Code Tabulation Areas, or ZCTAs) in metropolitan areas in the nation based upon their function as urban cores, suburbs, or exurbs. The criteria used are generally employment and population densities and the extent of transit use versus car use. The purpose of the urban core sectors is to replicate, to the best extent possible, the urban form as it existed before World War II, when urban densities were much higher and a far larger percentage of urban travel was on transit. The suburban and exurban sectors replicate automobile-oriented suburbanization that began in the 1920s and escalated strongly following World War II.

    A recent revision to the model divided the urban core into two classifications, the downtown or central business district ("CBD") and the "inner ring." The CBD is the locus of the most important urban revitalization in the core municipalities, while the inner ring includes the remaining part of the urban core that resembles the outlying parts of the pre-World War II city in its travel patterns and population densities (the City Sector Model criteria are described in the note below).

    The Anecdotal Evidence

    Seemingly endless stories are covered in both the print and electronic media describing how younger adults have been attracted to the urban core. Press organs like The New York Times and the Los Angeles Times can readily send their reporters to nearby cafes, bars, and restaurants. Much rarer are the anecdotes from the suburban strip malls and even a "Starbucks" on Long Island, Sugarland, outside Houston, or in the San Fernando Valley. But data, not anecdotes, are the most reliable indicators of actual trends.  

    From Anecdotes to Data

    The new data reinforces the reality that the story of millennials in the urban core is more nuanced than often suggested. This analysis compares population data for younger adults in the age range of 20 to 29 years old.

    Data: The Urban Core

    The "good news" relates to part of the city, the urban core. Millennials are concentrating to a greater degree than before in the urban core. Millennials have a larger share of the total population in the CBD then in any of the other for city sectors. In 2011, millennials represented 24.4% of the CBD population. By comparison, millennials are a much smaller 14.1% of the overall metropolitan population and the share in the exurbs is only 12.1%, less than one half that in the CBD. The associated inner ring has the second highest millennial component, at 18.1%, well above the shares in the outer sectors. Further, the millennial composition of the CBD increased between 2000 and 2011 from 22.4% to 24.4%. The inner ring millennial composition also increased, from 17.0% to 18.1% (Figure 1).

    So there is no question that the urban core millennial population is increasing beyond the general population increase.

    Data: City-Wide

    The other, often neglected, reality is that the gains in the urban cores are small compared to overall city (urban area or metropolitan area) trends. And millennial urban core gains may well have reached a peak, as has been suggested by Trulia’s Jed Kolko. Over the last year the millennial population in the CBDs has dropped a modest 25,000 (an amount that is probably within the margin of error, since all of these data are from surveys).

    Only 2.3% of millennials lived in the CBDs in the most recent year for which there is data (2011). This is up, but only from 2.2% in 2000. That gain was offset by a troubling loss in the inner core from 18.6% to 17.5%. The millennial share increases were all in the suburbs and exurbs (Figure 2).

    In numbers, the population aged 20 to 29 increased in the suburbs 20 times that of the CBD and the increase in the exurbs was nearly 9 times as high. Altogether, more than 90% of this cohort’s growth took place outside the urban core in the major metropolitan areas (Figure 3). Overall, the millennial gains in the CBD were approximately 80,000, while the gains in the inner ring were approximately 240,000. By contrast, the millennial gains in the suburbs and exurbs amounted to more than 2.75 million (Figure 4).  

    A Matter of Perspective

    The story on millennials is simply a matter of perspective. Those most interested in the small but influential urban core, depict a rising tide of millennials, with some justification. Those most interested in all the entire metropolitan area, are compelled by the overwhelming numbers to recognize that the story of millennials in the urban core is less significant in the larger context. But we are far from, and may well never achieve, a return to the imminent "Nirvana" of restoring pre-World War II cities or even a substantially smaller role for cars, which continue to drive the urban form in much of the world.

    Continued progress in the urban cores does not depend upon the "death" or decline of the suburbs. If cities are to best perform their crucial role of providing better standards of living and enabling lower poverty rates, they could boost prosperity throughout the city from the urban core through the suburbs to the exurbs.

    Note: ACS 5 Year Data: The data were collected by the American Community Survey of the US Census Bureau from 2009 to 2013. One fifth of the survey is completed each year, and therefore the data most closely approximates the middle of the period,  2011.

    Note: City Sector Model Criteria: This article continues a series examining the 52 major metropolitan areas (those with more than 1,000,000 residents) using the City Sector Model, which allows a more representative functional analysis of urban core, suburban, and exurban areas, by using smaller areas, rather than using municipal boundaries. The City Sector Model thus eliminates the over-statement of urban core data that occurs in conventional analyses, which rely on historical core municipalities, most of which encompass considerable suburbanization.

    The City Sector Model classifies 9,000 major metropolitan area zip code tabulation areas using urban form, density, and travel behavior characteristics. There are five functional classifications: the CBD, the inner ring, all will earlier suburbs, later suburbs, and exurban areas.

    The general criteria is as follows: The CBDs include any small area with an employment density of 20,000 or more per square mile. The inner ring has lower employment density, with high residential densities, older housing and substantially greater reliance on transit. The CBD and inner ring together form the urban core, which resembles the population density and travel patterns of the pre-World War II city. The suburbs constitute the balance of the built-up urban areas and the exurbs are beyond the built-up urban areas.

    The revised City Sector Model criteria are illustrated in the Figure: "City Sector Model Criteria: 2015," below.

    Wendell Cox is principal of Demographia, an international public policy and demographics firm. He is co-author of the "Demographia International Housing Affordability Survey" and author of "Demographia World Urban Areas" and "War on the Dream: How Anti-Sprawl Policy Threatens the Quality of Life." He was appointed to three terms on the Los Angeles County Transportation Commission, where he served with the leading city and county leadership as the only non-elected member. He was appointed to the Amtrak Reform Council to fill the unexpired term of Governor Christine Todd Whitman and has served as a visiting professor at the Conservatoire National des Arts et Metiers, a national university in Paris.

    Photo:  The revitalizing CBD of St. Louis (by author)

  • Misunderstanding the Millennials

    The millennial generation has had much to endure – a still-poor job market, high housing prices and a generally sour political atmosphere. But perhaps the final indignity has been the tendency for millennials to be spoken for by older generations, notably, well-placed boomers, who often seem to impose their own ideological fantasies, without actually finding out what the younger cohort really wants. The reality, in this case, turns out far different than what is bespoken by others.

    Nowhere is this tendency clearer than in the perception of what kind of life – and what places – will millennials find attractive. Generally, the narrative goes like this: Millennials are different, they don’t care about owning homes, detest the suburbs and would prefer to spend their lives in dense apartment blocks, riding the rails or buses to whatever work they might be able to find.

    Urban theorists, such as Peter Katz, insist that millennials (the generation born after 1983) have little interest in “returning to the cul-de-sacs of their teenage years.” Manhattanite Leigh Gallagher, author of “The Death of Suburbs,” asserts with certitude that “millennials hate the suburbs” and prefer more eco-friendly, singleton-dominated urban environments.

    Such assessments thrill the likes of real estate speculators, such as Sam Zell, who welcomes “reurbanization” as an opportunity to cash in by housing a generation of Peter Pans in high-cost, tiny spaces unfit for couples and unthinkable for families. Others of a less-capitalistic mindset see in millennials a post-material generation, not buying homes and cars and, perhaps, not establishing families. Millennials, for example, are portrayed by the green magazine Gris as “a hero generation” – one that will march, willingly, even enthusiastically, to a downscaled and, theoretically, greener future.

    Read the entire piece at The Orange County Register.

    Joel Kotkin is executive editor of NewGeography.com and Roger Hobbs Distinguished Fellow in Urban Studies at Chapman University, and a member of the editorial board of the Orange County Register. He is also executive director of the Houston-based Center for Opportunity Urbanism. His newest book, The New Class Conflict is now available at Amazon and Telos Press. He is also author of The City: A Global History and The Next Hundred Million: America in 2050.  He lives in Los Angeles, CA.

    New home photo by BigStockPhoto.com.

  • What’s This Place For?

    I was recently asked by Gracen Johnson (check out her site here) to elaborate on the possible future of suburbia. How are the suburbs likely to fare over time? This coincided with a city planner friend of mine who asked a more poignant question about the suburban community he helps manage. “What’s this place for?” If we can answer that question we might be able to get a handle on the possible trajectories of various suburbs.

    unnamed-2 unnamed-1 unnamed-5 unnamed-3

    For example, we all understand what a farm town is for. Small rural towns produce food. The people who live in the countryside are actively engaged in the business of feeding society. They take soil, water, plants and animals and convert it all into breakfast, lunch and dinner. For the people who want to live this way there are tremendous benefits: fresh air, open space, privacy, independence, a direct connection to nature, strong family bonds, tradition, and so on. Whatever else we might say about farm country we can be certain that it will carry on one way or another or else civilization will grind to a halt pretty quickly.

    IMG_0126 (800x533) IMG_0085 (800x533) IMG_0093 (800x533)

    We also know what industrial cities are for. They take the raw materials from the surrounding countryside and transform them into finished goods. Grain becomes flour and bread. Timber becomes lumber, then homes and furniture. Iron ore and coal become machinery and power. Crude oil becomes gasoline, petrochemicals, and plastics. There are obvious trade offs for industrial workers, but for many people it’s a pretty good arrangement. If we expect to have manufactured goods in the future these cities will have to continue somehow.

    Screen Shot 2015-01-31 at 6.49.37 AM Screen Shot 2015-01-31 at 6.54.26 AM Screen Shot 2015-01-31 at 6.56.05 AM Screen Shot 2015-01-31 at 6.55.40 AM

    The new post-industrial locus is a bit trickier to pin down. The service economy doesn’t actually produce any “thing” so the workforce is liberated to live just about anywhere in a way that farmers and factory workers can’t. Oddly, well educated highly paid people don’t actually spread out and inhabit a million cabins in the woods as you might expect. Instead they clump up in a handful of regions that provide abundant cultural amenities. At the same time the post-industrial economy exists in a physical world and all those people and electronic components rely on the underlaying farms, factories, and raw resources that support them. The so-called dematerialization of the economy still requires a serious amount of real “stuff” to function.

    Screen Shot 2015-01-29 at 6.18.31 AM Screen Shot 2015-01-29 at 6.05.55 AM Screen Shot 2015-01-29 at 6.06.18 AM

    So what does this all mean for the suburbs? The nature of suburbia has always been consumptive rather than productive. People move to the suburbs in order to purchase and enjoy things: a spacious home, a good school district, security, a clean environment, more respectable neighbors, and so on. The majority of the commercial activity is actually in service to suburbia itself. The mortgage brokers, insurers, real estate agents, landscapers, school teachers, firefighters, orthodontists, pancake houses, and auto body shops are all there to help keep the suburbs humming along. But they’re all consumptive in nature. No one is making the tennis shoes sold at the mall or growing the oranges at the supermarket. This is compounded by the fact that the suburbs are maintained largely through debt. Private debt is required for all the mortgages, car loans, credit cards, student loans, and business loans while municipal bonds prop up many essential suburban government functions. The fact that many people don’t understand the difference between production and consumption is one of the big problems the suburbs are going to have to sort out in the future.


    Screen Shot 2015-01-28 at 9.22.31 PM Screen Shot 2015-02-03 at 2.12.50 AM

    I’m going to get a lot of push back on this concept. I’m sure many of you think that your suburb is full of productive enterprises: the Krispy Kreme, the Jiffy Lube, the dozen Shell and Exxon stations, the Applebee’s, the Foot Locker, the Honda dealership, and the Kroger’s. But these are merely outlets for things that were produced elsewhere. Let me offer another example from my own life. I spent a chunk of my childhood in the San Fernando Valley in Los Angeles. Back in the 1960’s and 1970’s nearly everyone had some connection to companies like Rocketdyne, Litton, and General Dynamics. Those were the engines of the local economy for decades. And they did in fact produce real physical things. But they were all funded entirely by the federal government. Tax money was skimmed off the national productive economy (all those farms and factories) and then spent on missile guidance systems, satellites, and fighter jets. The same was true in Huntsville, Alabama and Marietta, Georgia. Remember what happened to all those places when the feds turn off the spigot during budget cuts? Money flowed in, not out. There’s a reason Peru doesn’t have a space program. The underlying national economy isn’t productive enough to support such extravagant government spending.

    As the material abundance we enjoyed in the Twentieth Century tightens up suburbs will have to become much more efficient places that provide things the outside world needs and is willing to pay for. At the same time internal consumption and debt are going to have to be pulled back. That doesn’t necessarily mean a lower quality of life, but it does demand that suburbs retool and ask themselves, “What’s this place for?”

    John Sanphillippo lives in San Francisco and blogs about urbanism, adaptation, and resilience at granolashotgun.com. He’s a member of the Congress for New Urbanism, films videos for faircompanies.com, and is a regular contributor to Strongtowns.org. He earns his living by buying, renovating, and renting undervalued properties in places that have good long term prospects. He is a graduate of Rutgers University.

  • The New New Thing: Suburban Bunker Buildings

    I have a theory about where the next culturally dynamic neighborhoods are likely to emerge and which building types will be the engine of that transformation. It may not be exactly what most people expect.

    As American industry receded in the later half of the Twentieth Century it left behind an alluvial delta of redundant buildings that sat vacant for years, no longer useful or productive. All effort was focused on building the new suburbs. These abandoned inner city warehouse districts became so cheap and run down that they were eventually colonized by artists, immigrants, and bohemians seeking cheap rent and an environment where landlords and municipal authorities looked the other way. They weren’t necessarily safe, or clean, or attractive, but they provided a kind of freedom for the people who lived there.

     Screen Shot 2015-02-10 at 8.38.05 PM  Screen Shot 2015-02-10 at 8.39.46 PM Screen Shot 2015-02-10 at 8.40.07 PM  unnamed-2 unnamed
     unnamed-3 unnamed-1 

    The photos above are of friends in their 8,000 square foot live/work space in Philadelphia. The general dismissive attitude of many suburbanites is that such people exist outside the mainstream and are irrelevant to the lives of “real” people. Contrary to this common misconception all the creative types I know are highly skilled and hold down jobs as welders, carpenters, accountants, and technicians of various kinds. I know a couple who spend half the year in video production making car commercials and then pursue their art during the long hiatus. I know another guy who worked like a dog for a few years after college at a prototype lab for the pharmaceutical industry in order to pay off all his student loans and other debts. Now he’s free to do what he really wants without the burden of debt. These folks simply choose not to spend their money on a mortgage on a suburban home with multiple car payments, but their lives and economic productivity are very real.

    Technically, living in an old warehouse involves breaking a hundred different rules and regulations, but they’ve been there for years and no one cares. It’s that kind of space and that kind of neighborhood. Unfortunately, the area is rapidly gentrifying and they may be priced out of the space soon as nearby warehouses are being converted to luxury lofts. That begs the question – where are the cheap funky emerging neighborhoods these days? You can’t live and work this way in a suburban tract home. Neither the physical space nor the local culture will allow it.

    unnamed-1 unnamed

    A couple of years ago I was in Salt Lake City having lunch with a prominent well-connected real estate agent. She’s the kind of charming knowledgable person I always seek out so it was a pleasure to see her again. I had explored various parts of Salt Lake from the downtown core all the way out to Daybreak in the distant suburbs. She spoke of the urban renaissance, the new streetcar system, and the many new developments in previously blighted areas. But I explained that the part of town that really interested me was the neglected and undervalued areas in the lackluster middle distance just beyond downtown that were neither sophisticated and urbane nor verdant and domestic. These semi-commercial, vaguely industrial, half-assed residential zones were neither fish, nor flesh, nor fowl. But they had the two qualities that fascinate me: they’re relatively inexpensive and generally ignored by the Upright Citizens Brigade. They’re close enough to downtown and the university that you could still ride a bicycle to access culture and employment, but just a short drive to suburban conveniences farther out. It’s the wrong combination for people with conventional tastes, but the perfect sweet spot for a certain kind of subculture that needs to be left alone in order to thrive. They need wiggle room that doesn’t exist in the highly supervised downtown or manicured suburbs. And many of these brick and concrete buildings are little bunkers where you could do just about anything within the raw space. They offer the one thing that’s in terribly short supply. Slack. 

    unnamed-2 unnamed-3 unnamed-1

    I sent these photos over to her and explained that these nondescript aging suburban bunker buildings were the next great building type. She was gracious and polite, but she obviously thought I was insane. Now granted, she isn’t the only person to come into contact with me to come to this conclusion – and not just because of my irregular taste in property.

    Screen Shot 2015-02-09 at 5.01.50 PM  Screen Shot 2015-02-09 at 5.05.02 PM Screen Shot 2015-02-09 at 5.04.39 PM

    This conversation came back to me this afternoon as I walked past a building that used to house a discount bakery outlet. As a much younger and poorer person twenty years ago I used to frequent this establishment myself to buy day old bread and not-quite-expired donuts. This month the bunker building was transformed into an upscale furniture store with in-house designer services. I poked around and explored the shop. I had no particular interest in the furniture itself and don’t think this kind of business could succeed anyplace other than a prosperous part of town. But it was the bones of the building itself that fascinated me.

    Screen Shot 2015-02-09 at 5.01.18 PM Screen Shot 2015-02-09 at 5.01.02 PM Screen Shot 2015-02-09 at 4.54.42 PM Screen Shot 2015-02-09 at 5.02.40 PM Screen Shot 2015-02-09 at 4.55.46 PM

    It’s a big flexible durable space like the old inner city industrial buildings. The walls and floor are concrete and the ceilings are exposed wood and steel. The former loading docks make perfectly segmented rooms with high ceilings and the ability to adapt to many uses including indoor/outdoor applications. Paint and some inexpensive drywall partitions transform the space very quickly. The front room was mostly glass and open to the parking lot, but the vast majority of the building was entirely private. This is a perfect example of the new new thing. This is where the starving bohemians will end up if they want to continue doing their work in a big, affordable, mostly unregulated spot. In an expensive real estate market people will colonize any vacant building and make their luxury furniture showroom work. But in depressed suburban markets these buildings are ripe for economically displaced artists. Gather enough interesting and entrepreneurial types in one such neighborhood and it could be the social and cultural engine that pulls up an entire dying suburban strip.

    John Sanphillippo lives in San Francisco and blogs about urbanism, adaptation, and resilience at granolashotgun.com. He’s a member of the Congress for New Urbanism, films videos for faircompanies.com, and is a regular contributor to Strongtowns.org. He earns his living by buying, renovating, and renting undervalued properties in places that have good long term prospects. He is a graduate of Rutgers University.

  • The Emerging New Aspirational Suburb

    Urban form in American cities is in a constant state of evolution. Until recent years, American suburbia was often built without an appreciation for future evolution. This has left many older suburbs in a deteriorated state, and has accelerated claims of a more generalized suburban decline.

    The Indianapolis suburb of Carmel represents a response to this historic pattern. While responding to today’s market demands with a new aspiration level designed to make it nationally competitive, it’s also trying to position itself for success tomorrow and over the longer term.

    This is a critical issue for many suburbs. Like big cities before them, many older suburbs have now aged, and no longer necessarily meet the requirements of the marketplace.  

    There are many reasons for this.  The early, usually small-scale Cape Cod-style housing common to many 50s vintage suburbs is not what today’s market is demanding. It’s the same for older enclosed malls – today “lifestyle centers” and other formats are preferred – many of which are now vacant, their grim remains featured on web sites such as DeadMalls.com. Many suburban areas were also built out with “infrastructure light” without upgraded streets, sidewalks, etc. leaving a big backlog of infrastructure need.

    Across the country many of these older districts have fallen into decay and become increasingly poor, taking on many of the characteristics of the inner city. As the Brookings Institution noted  over a decade ago, they “are experiencing some signs of distress—aging infrastructure, deteriorating schools and commercial corridors, and inadequate housing stock.”1 Today, the public is more aware of the trend, and events in Ferguson, MO recently gave a wakeup call to newer and still-thriving suburbs that they too may be troubled at some point.

    Like other American cities, Indianapolis has many of these older, struggling suburban areas. In its case, many of them are within the core city limits due to a 1970 city-county merger. As regional growth continues to expand outside the central urban county, newer generation suburbs have a chance to learn from the struggles of many of their predecessors.

    Carmel – pronounced like the Biblical Carmel – is the first suburb directly north of the city of Indianapolis. It is an upscale residential and business suburb similar to many others around the country such as Dublin, OH; Naperville, IL; and the Cool Springs, TN area.  Its 2013 population of 83,573 made it the 5th largest municipality in the state. While not monolithically wealthy, its 2013 median household income of $100,358 is the 14th highest in the United States among communities of 65,000 people or more.2 It’s a preferred area for the estate homes of wealthy Indianapolis area residents, such as Indianapolis Colts owner Jim Irsay. But it’s not just a bedroom suburb; real estate brokerage Cassidy Turley reports that the Carmel submarket has over six million square feet of office space.3

    Being located in the center of the favored quarter of the Indianapolis region, Carmel grew as an upscale area. This gives it a leg up in long term sustainability out of the gate.  

    Yet Carmel has not relied just on its wealth to insure against decline. Rather, it has embarked on a transformation program now nearly 20 years old from which three major themes emerge:

    1. Responding to current market forces to build a “state of the art” community that is competitive globally, not just within the Indianapolis region.

    2. Building a full spectrum of amenities and infrastructure to create a “complete city” with a high quality of life and intrinsic appeal that is a) not based solely on newness or low costs, and b) which has broad demographic appeal.

    3. Attempting to create unique cultural and regional attractions  to turn Carmel into a destination in its own right, as much city as suburb.

    The primary driver of this transformation has been Mayor Jim Brainard, a Republican currently in his fifth term.  Carmel long had top performing schools – it’s the top rated district in the state   – houses with generous yards, low taxes, and other standard attractors of suburbia. Previous administrations had put in place key policies such as reserving the Meridian St. corridor for high end office space and banning billboards. But Brainard brought numerous changes in Carmel during his tenure including:

    Annexation. Carmel has undertaken a series of annexations – nearly 20,000 acres since 2001 alone.4 With over 47 square miles of territory, Carmel has now largely achieved its desired geographic scale.

    Parks. Carmel’s park acreage increased from 50 to 1000 acres and it has spent heavily on building out its parks. This includes building a $55 million Central Park, which includes a showplace community and fitness facility called the Monon Center.5 And the popular Monon Trail, a rail-trail through the length of the city that extended a previous project built by the City of Indianapolis.


    Monon Trail at Main St.

    Road Infrastructure. Carmel has invested heavily in upgrading the legacy network of county roads that it overgrew. This includes an aggressive deployment of modern roundabouts. Carmel now has over 80 of these, more than any community in the United States.6 It has upgraded miles of collector roads to urban standards with enclosed drainage, curbs, extra-wide travel lanes, landscaped medians, eight foot multi-use side paths on both sides of the street protected by a landscaped buffer zone, and decorative street signs and other detailing.

    Roundabout at Main St. and Illinois St. in the fall


    An upgraded segment of River Rd. in early winter

    Two major state highways passed through the town, Meridian St. (US 31) and Keystone Ave. (SR 431). These were designed as rural style divided surface highways as is common in Indiana. Carmel convinced the state to relinquish Keystone Ave. to the city and give it $90 million for upgrades and future maintenance. Carmel converted this into a mostly free flowing parkway by spending $108 million to replace stoplight intersections with roundabout interchanges. These not only dramatically improved traffic flow, the bridges over the busy highway provided a high quality, safe connection – especially for pedestrians and bicyclists – connecting eastern and central Carmel, which had previously been separated by this “great wall” of a road. The state is currently performing a similar freeway upgrade on Meridian St., the principal office corridor.


    Roundabout interchange at 126th St. and Keystone Parkway.

    Water and Sewer Upgrades. Part of Carmel previously received water from the Indianapolis water utility. The City of Indianapolis had privatized this utility but sought to repurchase it. Carmel intervened in the process to pressure Indianapolis into selling it the water lines inside Carmel. Carmel has since undertaken significant infrastructure upgrades such as new wells and pumping stations. During a recent summer drought, Carmel, unlike Indianapolis, did not put in place a mandatory restriction on lawn watering.7

    New Urbanism. Beyond core infrastructure, Carmel under Brainard has sought to change its style of development to embrace some of the more positive aspects of New Urbanism such as creating more urban nodes and walkability.

    Unlike some traditional railroad suburbs or county seats, the historic center of Carmel was very tiny, and its Main Street populated mostly with one story buildings and empty lots. This was the first focus area, and started with fixing the physical infrastructure.  

    The city rebranded the area as the “Arts and Design District” and utilized Tax Increment Financing to promote multi-story, mixed use development. The result is a mostly occupied and often well-patronized Main Street district. The surrounding historic residential blocks have seen significant redevelopment activity as well.


    Main St. at western fountain and gateway arch entryway to rebranded “Arts and Design Distrct.”

    Beyond the historic downtown, Carmel has also implemented multiple New Urbanist style zoning overlays, including on Old Meridian St. and Range Line Rd. (the city’s original suburban commercial strip). These promote mixed use development, buildings that front the street, and multi-story structures. Infrastructure improvements and TIF have been used in these areas as well. There’s also a major New Urbanist type subdivision in western Carmel called the Village of West Clay.

    Strip mall and traditional suburban development along Range Line Rd.


    New Urbanist style development along Range Line Rd.


    New Urbanist development and street improvements under construction on Old Meridian St.

    The historic downtown was deemed too small to function effectively as the downtown of a city the size of Carmel today. The city thus decided to create a new downtown area called City Center. The location for this is an area south of the historic downtown area in an older suburban industrial zone that had fallen into a blight pattern. Much of it was vacant and what’s now the principal City Center development was built on the site of a failed strip mall. TIF was aggressively used here as well to redevelop the area.

    The City Center development is only partially complete. A veterans memorial and other civic spaces are complete, as are several small office buildings, apartments, and a large mixed use complex. The anchor is a publicly funded $175 million concert hall called the Palladium and an associated theater complex with three stages.8 While these are complete, significant development remains to complete the City Center vision. The city also wants to redevelop the area between City Center and the old downtown, which they now label Midtown, but very little has been done to date.


    Interior street of City Center development.

    The goal of all this development is not the full urbanization of Carmel; this city does not aspire to be dense metropolis, or even Indianapolis. It’s rather about creating more town center type districts with the walkable feel that’s increasingly in favor, but without compromising the fundamental suburban character of the city. It’s also designed to create a city with options. Having a diversity of development styles within the city is part of a strategy of appealing to a more diverse demographic base, including singles and retirees, not just the stereotypical younger family with kids. Traffic flow has been improved, but short trips are now easier to undertake by foot or bicycle, not just by car.

    Retro Architecture. Carmel has de facto mandated traditional architectural styles. There’s no one consistent style. Major buildings have been done in Georgian, Second Empire, and Neoclassical type designs. But modernism has been rejected, further differentiating suburban Carmel from urban areas that frequently elect for starchitecture that is unapologetically “of the now.”

    The city has also attempted to prevent large corporations from building their standard architectural templates. Brick is effectively mandated, even for big box retailers like Lowes. Retailers like CVS and Kentucky Fried Chicken were forced to build second stories on their structures to locate in certain areas. Another Carmel CVS has an art deco façade.

    The city wants high quality aesthetics and a unique sense of place. They also want “timeless” design, though like much New Urbanism architecture it can sometimes come across as pastiche.

    Arts and Culture. As part of the attempt to appeal to more arts minded middle aged consumers, as well as members of the  so-called “Creative Class,” Carmel has heavily invested in the arts. The City Center performing arts center was paid for almost entirely with public funds (TIF), an investment in the arts dwarfing even that of Indianapolis. The city has also paid for an extensive public art program, mostly statues by Seward Johnson. And it makes operating grants to local arts organizations such as the Carmel Symphony Orchestra.


    Interior of the Palladium concert hall. Photo by Zach Dobson.

    Seward Johnson is not a favorite of urban sophisticates. His statutes illustrate the type of play it safe art generally featured by Carmel. More sophisticated or cutting edge fare is not as prevalent. And there have even been some complaints by a limited number of citizens about items such as the classical nudes featured on the door handles of the Evan Lurie Gallery.

    Brainard is thinking about the long term when Carmel is no longer the shiny new thing. As he put it, “Because we are designing a new city that will be in place for hundreds of years, the responsibility of doing it right falls to this generation…Carmel is a young city – we are still building our parks, trails, roads and sanitary sewer and water systems that will be here for centuries.”9

    He’s also keenly aware of global economic competition and the fact that Indiana lacks the type of geographic and weather amenities of other places. He frequently uses slides to illustrate this point. In one talk he said, “Now this picture, guess what, that’s not Carmel; but this picture is the picture of some of our competition. Mountains – that’s San Diego of course, mountains, beautiful weather, you know I think they have sunshine what, 362 days out of the 365…. What we’ve tried to do is to design a city that can compete with the most beautiful places on earth. We’ve tried to do it through the built environment because we don’t have the natural amenities.”10  While the claims to want to equal the most beautiful places in the world may be grandiose, the key is that mayor believes Carmel’s undistinguished natural setting and climate requires a focus on creating aesthetics through the built environment.

    What have the results been to date?  Economically and demographically, the city has performed well. It has managed to create an environment that is proving competitive for business opportunities that might have previously bypassed Indiana. For example, American Specialty Health relocated its headquarters to Carmel from San Diego, with the CEO of the company personally making the move from La Jolla to Carmel.11 Geico also recently expanded. Numerous other corporations are either based in Carmel or have major white collar facilities there. The income levels are very strong, as noted above.

    The city’s demographics have also expanded to become much more diverse. The minority population grew 295% between 2000 and 2010, adding 9,630 people and growing minority population share from 8.7% to 16.3%.12 12% of the city’s households speak a language other than English at home.13 Many of these are highly skilled Chinese and Indian immigrants working for companies like pharmaceutical giant Lilly. Even black professionals are increasingly moving to Carmel, with the black population growing 324% in the 2000s and black population share doubling to 3%.14 Carmel is not a polyglot city today, but it’s far more diverse than in the past.

    Carmel has also attracted both national press and national awards. Money magazine ranked Carmel as the #1 best small city to live in 201215, and it’s scored highly in other surveys as well. Drew Klacik of the Indiana University Public Policy Institute notes that in an echo of the transformation of the city of Indianapolis since the 1970s, “Carmel has transformed itself from a desirable community within Indiana to a desirable and competitive community nationally.”16

    However, it’s hard to argue that Carmel’s results materially outperform peer cities in other regions. Places like Dublin, OH and Cool Springs, TN have significantly more office space, for example. Many of those places are, however, implementing policies similar to those in Carmel . Most Carmel New Urbanist development continues to require TIF subsidies and is not yet sustainable at market rates. The city has obtained better financial terms in some recent deals, however.  And despite major public investment and construction in the central city, many central area census tracts lost population during the 2000s.

    The changes have also attracted significant criticism and opposition in some quarters.  While the public remains largely positive on the results, there have been many critiques of the way they were done, some of them legitimate.  A number of the projects had significant cost overruns. The mayor originally said that the Keystone project could be completed for the $90 million the state gave it. The actual cost was nearly $20 million higher.17 The Palladium was originally sold as an $80 million facility, but ended up costing $175 million. The city also said it planned to pay for ongoing operations by raising a $40 million endowment, but was unable to raise the funds, leaving it on the hook for $2 million in annual operating costs. These are not small misses.

    Critics also pointed to state figures showing Carmel with nearly $900 million in total debt.18 While it is a wealthy community that can afford the payments, in a conservative state like Indiana, a suburb accumulating nearly a billion dollars in debt raises eyebrows. Carmel’s tax rates remain among the lowest the state, however.

    The way the debt was accumulated has been criticized as well. The Palladium was paid for with TIF funds. Rather than bonds, the Carmel Redevelopment Commission – the authority that manages the TIF program and which was controlled by mayoral appointees – structured the Palladium debt as Certificates of Participation to circumvented the need for city council approval, incurring higher interest rates in the process. The city council later refinanced the debt at a lower rate using a general taxing power guarantee in what some called a bailout. In return for the refinancing, the council obtained more oversight over TIF activity.19

    Though some controversy is inevitable and some criticisms are legitimate, ultimately the change program in Carmel has proven popular with the public and the city is booming, a boom that’s lending an increasingly bitter tone to the longstanding hostility Carmel has enjoyed from the region due to its status as the highest profile “rich suburb” in the region.

    Yet for all the controversy, many regional suburbs are copying some aspects of Carmel’s approach, with roundabouts now a regular feature in area communities and major park programs and New Urbanist style town center developments as well. This includes the massive sports-oriented Grand Park in Westfield and the Nickel Plate District in next door Fishers’ town center.20

    It’s also clear that peer type suburbs around the country are adopting similar strategies, such as Dubin, OH’s Bridge Street Corridor proposal21 or Sugar Land, TX’s $84 million performing arts center.22 Imitation, they say, is the sincerest form of flattery. Carmel represents the leading edge of the emergence of a new type of post-Edge City aspirational suburb. It’s something we may be seeing a lot more of in the future.

    Aaron M. Renn is a senior fellow at the Manhattan Institute and a Contributing Editor at City Journal. He writes at The Urbanophile.

    ————————————-

    1 Robert Puentes and Myron Orfield. “Valuing America’s First Suburbs: A Policy Agenda For Older Suburbs in the Midwest,” Brookings Institution, 2002.

    2 U.S. Census Bureau, “American Community Survey 2013 1-yr”, Table B19013.

    3 Cassidy Turley, Indianapolis Office Market Snapshot (Third Quarter 2014), 3.

    4 Ellen Cutter. “Explaining the annexation process,” Greater Fort Wayne Business Weekly, June 12, 2014. Accessed January 8, 2015. http://www.fwbusiness.com/opinions/columnist/businessweekly/article_f42da036-6182-575a-8445-274cd82ca296.html

    5 Matthew VanTryon. “Carmel then and now: World’s Apart,” IndianapolisNewsBeat.com, December 16, 2014. Accessed January 8, 2015. http://blogs.butler.edu/multimedia-journalism/2014/12/16/carmel-worlds/

    6 James Brainard, transcript of speech at 2014 International Making Cities Livable Conference, June 23-27, 2013.

    7 “Why no watering ban in Carmel,” WISH-TV News, July 12, 2012. Accessed January 8, 2015. https://www.youtube.com/watch?v=y51BJYM4Fgc

    8 David Hoppe. “The Palladium’s boffo budget,” Nuvo Newsweekly, June 20, 2011. Accessed on January 8, 2015. http://www.nuvo.net/indianapolis/the-palladiums-boffo-budget/Content?oid=2275080

    9 James Brainard, notes for 2014 State of the City Address.

    10 James Brainard, transcript of speech at 2014 International Making Cities Livable Conference, June 23-27, 2013.

    11 Andrea Muirragui Davis. “Wellness provider beefing up new Carmel office,” Indianapolis Business Journal, October 29, 2014. Accessed on January 8, 2015. http://www.ibj.com/blogs/11-north-of-96th/post/50241-wellness-provider-beefing-up-new-carmel-office?id=11-north-of-96th

    12 U.S. Census Bureau, calculations by author from Census 2000 and Census 2010.

    13 U.S. Census Bureau, “American Community Survey 2013 1-yr”, Table B05007.

    14 U.S. Census Bureau, calculations by author from Census 2000 and Census 2010.

    15 “CNNMoney Ranks Americas Best Places to Live,” Daily Finance, August 20, 2012. Accessed January 8, 2015. http://www.dailyfinance.com/2012/08/20/cnn-money-ranks-americas-20-best-places-to-live/

    16 Drew Klacik, telephone interview with author, December 29, 2014.

    17 “Brainard seeks bonds to finish Keystone,” The Indianapolis Star, October 18, 2009. Accessed January 8, 2015. http://archive.indystar.com/article/20091018/LOCAL/910180409/Brainard-seeks-bond-finish-Keystone

    18 Indiana Department of Local Government Finance. “Local Government Debt Report,” September 21, 2012, 15.

    19 Kathleen McLaughlin. “Brainard seeks deal on maxed-out TIF,” Indianapolis Business Journal, March 31, 2012. Accessed January 8, 2015. http://www.ibj.com/articles/33569-brainard-seeks-deal-on-maxed-out-tif

    20 Cara Anthony. “New look for the Nickel Plate District in Fishers,” The Indianapolis Star, June 28, 2014. Accessed January 16, 2015. http://www.indystar.com/story/news/local/hamilton-county/fishers/2014/06/27/new-look-nickel-plate-district-fishers/11537251/

    21 Brent Warren. “Dublin Moves Ahead With Bridge Street Corridor Plans, Connecting Across River,” Columbus Underground, March 23, 2013. Accessed January 8, 2015. http://www.columbusunderground.com/dublin-moves-ahead-with-bridge-street-corridor-plans-looks-to-connect-across-river-bw1

    22 Rebecca Elliott. “Sugar Land breaks ground on $84 million performing arts center,” Houston Chronicle, December 9, 2014. Accessed January 12, 2015. http://www.houstonchronicle.com/neighborhood/fortbend/news/article/Sugar-Land-breaks-ground-on-84M-performing-arts-5946247.php

  • Go East, Young Southern California Workers

    Do the middle class and working class have a future in the Southland? If they do, that future will be largely determined in the Inland Empire, the one corner of Southern California that seems able to accommodate large-scale growth in population and jobs. If Southern California’s economy is going to grow, it will need a strong Inland Empire.

    The calculation starts with the basics of the labor market. Simply put, Los Angeles and Orange counties mostly have become too expensive for many middle-skilled workers. The Riverside-San Bernardino area has emerged as a key labor supplier to the coastal counties, with upward of 15 percent to 25 percent of workers commuting to the coastal counties.

    In a new report recently released by National Core, a Rancho Cucamonga nonprofit that develops low-income housing, I and my colleagues, demographer Wendell Cox and analyst Mark Schill, explored the challenges facing the region. Although we found many reasons for concern, the region’s overall condition and its long-term prospects may be better than many might suspect.

    Population trends

    The region’s once-explosive growth has slowed considerably. From 1945-2010, the area’s population soared from 265,000 to 4.25 million. Already the nation’s 12th-largest metropolitan area, the I.E. could pass San Francisco and Boston by 2020 (unless faster-growing Phoenix does so first).

    Yet, contrary to expectations (and, perhaps, hope among anti-sprawl campaigners), the area continues to be a beacon for people from the rest of the region. There is a notion, widely expressed in the mainstream media, that Southern California’s growth will now focus more on the urban core around Downtown Los Angeles. Yet, as is often the case, what planners and pundits desire is not widely shared by the vast majority of people.

    People continue to vote for the Inland Empire – and other peripheral areas – with their feet. Census Bureau data indicates that, from 2007-11, nearly 35,000 more residents moved from Los Angeles County to the Inland Empire than moved in the other direction. There was also a net movement of more than 9,000 from Orange County and more than 4,000 net migration from San Diego County.

    Several long-standing demographic trends favor a continued shift to the Inland region, according to Cox and Schill. Immigrants and their offspring may prove the critical factor. Over the past decade, the Inland region dramatically increased its population of foreign-born residents, more than three times the number and at nearly 18 times the rate of the coastal counties.

    The influx of immigrants and their children is largely responsible for the region’s relatively young population, compared with the rest of Southern California. As recently as 2000, the proportion of population ages 5-14 in Los Angeles and Orange counties stood at 16 percent, the sixth-highest level among the nation’s 52 largest metropolitan areas. Thirteen years later, that proportion had dropped to 12.8 percent, 33rd among the 52 largest metropolitan areas. In terms of a dropping share of youngsters, the area experienced a 20 percent reduction, the largest in the nation.

    In contrast, the Inland Empire remains a bastion of familialism, with 15.3 percent of the population aged 5-14, among the highest levels in the nation. This follows a general pattern; according to recent analysis of Census data, high-cost areas tend to repel families. Of the nation’s most expensive areas, such as the Bay Area, New York and Boston, all tend to have well below national norms in terms of families among their populations.

    Perhaps more surprising, younger educated workers also are heading to the region. In fact, from 2011-13, according to American Community Survey data, Riverside-San Bernardino witnessed the 12th-largest increase among the 52 major metro areas in the share of college-educated residents ages 25-34. No major California metro area, including Silicon Valley, could match it. From 2000-13, the Inland region experienced a 91 percent jump in population with bachelor or higher degrees, just less than twice the increase for either Orange or Los Angeles counties.

    Overall, the I.E. has become something of a growth area for millennials – basically, adults ages 20-29. San Bernardino-Riverside ranked second among 52 metro areas, adding 50,000 millennials, an 8.3 percent increase since 2010. Los Angeles and Orange counties – older, settled areas with far lower population growth – together registered 18th.

    Economic Restructuring

    These trends also may reflect improving prospects for the region’s economic recovery. The area remains some 30,000 jobs below its 2007 level, notes California Lutheran University economist Dan Hamilton, but is now growing faster than the rest of the Southland. The region created jobs over the past year at a 2.2 percent rate, well above the 2.0 percent increase in Orange County and almost twice that of L.A.’s 1.3 percent. Foreclosures have diminished to the lowest levels since 2007 and appear back to something resembling normalcy.

    One important source of new employment is grass-roots entrepreneurship. Overall, the Inland Empire accounted for a large proportion of the new businesses created statewide from 2012-13 – despite hosting only 7.4 percent of the total businesses in California. A recent report by Beacon Economics suggested that growth will accelerate over the next five years.

    At the same time, some of the core industries – such as manufacturing and warehousing – have shown signs of recovery. Industrial vacancy rates have fallen from nearly 12 percent in 2009 to roughly half that level today.

    Much of the growth has been for “middle-skilled jobs,” paying $14 to $21 per hour, including positions in medical services, trucking and customer service. Overall, according to one recent survey, the Inland Empire ranked 13th among the nation’s large metropolitan areas in creating such positions. These jobs, notes economist John Husing, are critical to a region where almost half the workforce has a high school education or less.

    Even the housing sector, the driver of the post-crash employment decline, has improved considerably. Today, the Inland Empire is experiencing a far greater increase in construction permits than either Los Angeles or Orange counties. This has also helped boost construction employment, although not to anything like the levels experienced a decade before. Construction employment, although up recently, still totals barely half the people it did in 2006.

    Some, such as University of Redlands economist Johannes Moenius, express concern that important industries, like warehousing and manufacturing, are increasingly using part-time workers. Positions paying $15,000 to $30,000 annually constitute nearly half of all new jobs.

    The ambiguity in the recovery is reflected in a recent survey by Cal State San Bernardino, which found the percentage of those saying the economy was excellent or good had almost doubled since 2010, from 9 percent to 17 percent, but this was considerably below the 40-plus percent seen before the crash.

    The Path Ahead

    The fate of the Inland Empire remains in the balance. The recovery of the region depends largely on continued widespread population growth, largely stimulated by the production of affordable housing. Yet, at the same time, state regulations, spurred on by the environmental lobby, which seeks to slow, or even eliminate, single-family construction, threaten to force up prices and drive young families outside the state.

    Many other core industries of the area – such as warehousing and manufacturing – also face growing regulatory barriers. High taxes and energy costs originating from Sacramento are particularly difficult for industries that require power to operate. Southern California Edison’s rates, for example, are almost twice those found in Salt Lake City, Seattle or Albuquerque.

    Some may celebrate these policies that encourage people to say “good riddance” to a region too sprawling and insufficiently cultured. Yet, it’s hard to see how Southern California can continue to add workers – notably, younger middle-class families – without a vibrant Inland Empire. It remains the one Southern California region with the land, and the housing cost structure, to accommodate much of the hard-pressed middle class. Without growth inland, Southern California will be largely relegated to a torpid economy and rapidly aging demographics, a fate that would compromise the aspirations of future generations.

    This piece originally appeared in The Orange County Register.

    Joel Kotkin is executive editor of NewGeography.com and Roger Hobbs Distinguished Fellow in Urban Studies at Chapman University, and a member of the editorial board of the Orange County Register. He is also executive director of the Houston-based Center for Opportunity Urbanism. His newest book, The New Class Conflict is now available at Amazon and Telos Press. He is also author of The City: A Global History and The Next Hundred Million: America in 2050.  He lives in Los Angeles, CA.

  • Military Memorials: Is This Really the Best We Can Do?

    I was researching material for a blog post about the town I grew up in (Toms River, New Jersey) and accidentally stumbled on something completely unrelated that I find deeply disturbing on multiple levels. It was a roadside memorial dedicated to a fallen soldier. I looked up his name and realized that he had gone to my high school and his family lived very near the house I had once lived in. United States Navy SEAL Denis Miranda was twenty four years old when he perished in Qalat, Afghanistan. He has two surviving brothers on active duty.

    Screen Shot 2015-01-18 at 1.38.54 AM
     Google

    Screen Shot 2015-01-18 at 1.57.25 AM
    Google

    Screen Shot 2015-01-18 at 1.39.40 AM
    Google

    Screen Shot 2015-01-18 at 1.39.13 AM
    Google

    Denis Miranda is currently being “honored” by a cheap metal highway sign at the back of a ShopRite supermarket next to the employee parking lot and a storm water retention ditch. The chain link fence behind the sign is used to pin up banners advertising cold beer on sale. It isn’t dignified enough to commemorate the death of a native son. What exactly is his mom supposed to think as she drives past this sign on the way home from church? Is it comforting? Do his father and brothers meet at the sign to have a solemn moment of prayer and remembrance while summer traffic backs up at the intersection waiting for the light to turn green? Is the placement of the sign meant to inspire passing motorists to think deep thoughts about the nature of war and patriotism? And what does this kind of monument say about the way our society values its fallen? What does it say about the fact that this might actually be the best spot in town to express public gratitude or collective loss?

    Screen Shot 2015-01-18 at 1.57.59 AM
     www.njrunforthefallen.org

    Then I realized there was an entire state wide trail of these memorial signs all along the New Jersey coast, each marker representing a veteran who never returned home. The tragedy of all those lost lives and family sacrifices worked on me and I got angry at the memorials themselves. Is this really the best we can do?

    NJ WAR DEAD
     The Star-Ledger Archive

    Screen Shot 2015-01-18 at 1.15.48 AM
    Google

    Screen Shot 2015-01-18 at 1.16.36 AM
    Google

    Screen Shot 2015-01-18 at 1.17.28 AM
    Google

    This is the sign commemorating the loss of Marine Private First Class Vincent Frassetto who died in Al Anbar Province, Iraq. His memorial is on the side of a cloverleaf intersection near the Ocean County Mall. This same roadside spot is also favored by people placing signs advertising rug sales and warnings about pedophiles who may be lurking in public places. Will anyone ever make a pilgrimage to this sign by parking on the edge of the mall and walking across the grassy cloverleaf with loved ones to ponder the life and death of Vincent Frassetto? Or is the public assumed to be too busy to get out of the car so we better catch them while they’re trapped at a red light? Again, the quality and location of the memorial simply isn’t in keeping with the scale of the sacrifice.

    1866432_orig
     marines.togetherweserved.com

    Screen Shot 2015-01-18 at 4.40.01 AM
    Google

    Screen Shot 2015-01-18 at 4.23.03 AM
    Google

    Major James Weis of the U.S. Marine Corps died in Helmand Province, Afghanistan. Here’s his home town roadside war hero monument. It got me thinking about the people who organized these memorials – all devoted and well intentioned no doubt. Did they truly believe that these arrangements were appropriate? Were the folks on the committee looking around for a sacred place of honor and decide, “Hey, how about we put these cheap highway signs next to the left hand turn lane by the muffler shop and the Krispy Kreme.”?

    So… where exactly should we put memorials to fallen veterans these days? What form should those monuments take? We used to live in the kinds of towns were there were obvious places to erect an obelisk or a bronze statue. Now most of us live in tract home subdivisions, work in office parks on the side of a highway, and shop at strip malls. Could it be that these flimsy sheet metal markers reflect our true values and who we really are? Am I the only one who thinks this is weird and distasteful?

    John Sanphillippo lives in San Francisco and blogs about urbanism, adaptation, and resilience at granolashotgun.com. He’s a member of the Congress for New Urbanism, films videos for faircompanies.com, and is a regular contributor to Strongtowns.org. He earns his living by buying, renovating, and renting undervalued properties in places that have good long term prospects. He is a graduate of Rutgers University.

  • World Megacities: Densities Fall as they Become Larger

    There is an impression, both in the press and among some urban analysts that as cities become larger they become more densely populated. In fact, the opposite is overwhelmingly true, as Professor Shlomo Angel has shown in his groundbreaking work, A Planet of Cities. This conclusion arises from the fact that, virtually everywhere, cities grow organically so that they add nearly all of their population on the urban fringe, which has considerably less expensive land. As their physical form of cities (the urban area) expands, the residents per unit of developed area generally falls.

    Previous Analysis

    Two years ago, we analyzed growth patterns among the 23 world megacities that had been described in the Evolving Urban Form series. Megacities are urban areas with more than 10 million residents. This article extends the analysis to the other 11 megacities that will be included in the soon to be published 11th edition of Demographia World Urban Areas.

    Sadly, historical data is simply not available for the most urban areas. Urban areas are designated in some countries, such as the United States, Canada, the United Kingdom, France, India, and the Scandinavian countries. The census authorities in only a few countries, such as the United States and France have produced reliable information over a number of decades.

    Perhaps the most notable historical international effort was that of Kenworthy and Laube, whose global project produced estimates from 1960 through 1990 for a number of urban areas. In some cases, academic efforts have produced consistent urban land area and urban population data for specific cities, such as Lahore, one of the new megacities described below.

    Estimating the Density Dynamics of Cities

    Where historic urban area data is not available, an effective alternative is to compare core area population growth to areas outside the core in the corresponding metropolitan areas. Areas outside the core typically have lower population densities and the addition of more people outside the cores will normally indicate that the urban density is falling. In some cases, this can be indicated by huge core area losses, such as has occurred for decades in London and Paris, as well as Osaka and Mexico City, described in the previous article (see Table).

    Table
    SUMMARY OF MEGACITY URBAN POPULATION TRENDS
    MEGACITY General Growth Pattern
    Bangkok 10 Years: 55% of growth outside core municipality
    Beijing 10 Years: 99% of growth outside core districts
    Buenos Aires 60 Years: 100%+ of growth outside core municipality
    Cairo 16 Years: 2/3 of growth outside core governate
    Chengdu 10 Years: 55% of growth outside core districts
    Delhi 10 Years: 90% of growth outside core districts
    Dhaka 10 Years: 50% of growth outside core municipalities
    Guangzhou-Foshan 10 Years: 75%+ of growth outside core districts
    Istanbul 25 Years: 100%+ growth outside core districts
    Jakarta 20 Years: 85% of growth outside core jurisdiction
    Karachi 20 Years: Estimated density decline 15%
    Kinshasa 20 Years 65% of growth outside core districts
    Kolkata 20 Years: 95% of growth outside core municipality
    Lagos 15 Years: 90% of growth outside core districts
    Lahore 40 Years: 70% urban density decline
    Lima 15 Years: 100%+ of growth outside core districts
    London 110 Years: core districts decline 30% (Inner London)
    Los Angeles 60 Years: 95% growth outside core municipality
    Manila 60 Years: 95% growth outside core districts
    Mexico City 60 Years: 100%+ of growth outside core districts
    Moscow 8 Years: 95% of growth outside core districts
    Mumbai 50 Years: 98% of growth outside core districts
    Nagoya 40 Years 90% of growth outside core municipality
    New York 56 Years: 45% urban area density decline
    Osaka-Kobe-Kyoto 50 Years: 95% of growth outside core municipalities
    Paris 50 Years: 25% urban area density decline
    Rio de Janeiro 10 Years: 95% of growth outside core districts
    Sao Paulo 20 Years: 2/3 of growth outside core municipality
    Seoul 20 Years: 115%+ of growth outside core municipality
    Shanghai 10 Years: 99% of growth outside core districts
    Shenzhen 10 Years: 70%+ of growth outside core districts
    Tehran 15 Years >95% of growth outside core districts
    Tianjin 10 Years: 85%+ of growth outside core districts
    Tokyo 50 Years: 95% of growth outside core municipalities


    Many core municipalities have been expanded to include areas that are functionally suburban, rather than the intense urbanization that was more usual in pre-automobile sectors of the city. This is not just an American phenomenon. In Canada, there are large areas of functional suburbanization (lower residential densities and majority automobile use for motorized transport) in core municipalities, such as Toronto, Ottawa, and Calgary. There are other examples elsewhere in the world, such as Auckland, London, and Rome.

    As a result, functional urban core and suburban characteristics are poorly defined by analyses using municipal jurisdiction boundaries (such as core municipalities versus suburban municipalities).
    Urban core populations and densities are best analyzed using functional urban core and suburban characteristics, such as higher residential densities and unusually high reliance on transit, walking and cycling, as opposed to automobiles.

    The use of census tracts for this finer grained analysis has been undertaken for the metropolitan areas of Canada by Gordon and Janzen. Following their general model, I have applied functional urban core and suburban characteristics at the Zip Code Tabulation Area (ZCTA) level in the United States, see From Jurisdictional to Functional Analysis of Urban Cores & Suburbs). A number of issues have been covered in articles (City Sector Model index). One article shows that, among the core municipalities of the major metropolitan areas, those with more than 1,000,000 population, only 42 percent of residents live in functionally urban core districts. Virtually the entire core municipality is functionally urban core in New York, Buffalo, and San Francisco. A number of core municipalities simply have no functional urban core (such as Phoenix and San Jose).

    Megacity Density Trends

    The previous article indicated that population densities were falling in each of the 23 megacities analyzed. A similar conclusion applies to the 11 additional megacities analyzed in this article. All of these trends are indicated in the table.

    Paris: It may come as a surprise that the ville de Paris (the core municipality) accounts for little more than one-fifth of the urban area population and less than 1/20th of the continuously built up land area. Further, the ville de Paris has experienced a population decline as significant as many American core municipalities, dropping from over 2.9 million in 1921 to 2.3 million today. The population density of the Paris urban has dropped by more than one-half since 1954 and by nearly 85 percent since 1900. The inner four districts (arrondissements) have lost nearly three-quarters of their population since 1861. The losses may have started earlier, but comparable earlier data is not available.

    London: The London urban area has just achieved megacity status. London forced much of its post-World War II population growth outside its newly created greenbelt following World War II. Between World War II and the 1990s, the London urban area lost population. Most, but not all of the London urban area is composed by the Greater London Authority (GLA), over which Ken Livingstone and Boris Johnson have famously presided.

    However there has been a significant population increase since the 1990s. The Greater London Authority recently celebrated a "peak population" day to note having exceeded its 1939 population peak.  Virtually all of London’s metropolitan area (Note 1) growth has occurred outside the greenbelt, in the exurban areas. Approximately 3.3 million residents have been added to the first ring counties abutting the greenbelt between 1951 and 2011. Inner London, which roughly corresponds to the pre-1964 London County Council area, lost more than 450,000 residents in the same period, while Outer London (also in the GLA and inside the green belt) gained more than 400,000.

    However, even with the greenbelt, today’s London urban area covers more land area. At the 2011 census, the London urban area had fallen to nearly 15 percent below the Kenworthy and Laube estimate for 1961. Since 1900, London’s density is estimated to have dropped by two-thirds. Inner London, which roughly corresponds to the pre-1964 London County Council area, remains approximately one-quarter below its 1901 population, even with recent growth. All of the GLA growth has been in outer London.

    Other Megacities: Pakistan’s two largest urban areas, Karachi and Lahore are growing at among the fastest rates in the world, averaging approximately three percent annually. Interpolation of data from academic papers indicates declining population densities in both cities.

    Lagos continues to grow rapidly. More than 90 percent of its recent growth has been in suburban districts, with their lower, but still high, densities. Kinshasa, one of the new megacities, has the fastest growth rate according to United Nations data. Kinshasa is growing over four percent per year, with nearly two-thirds of its recently reported growth outside the densest areas in the core districts.

    Tehran’s core districts are now experiencing only modestly increasing population. Nearly all growth (98 percent) has been outside the core districts.

    China has recently added two cities to the megacity list, Tianjin and Chengdu. Approximately 85 percent of Tianjin’s recent growth has been outside the core districts. In Chengdu, the areas outside the core districts have captured 55 percent of the growth.

    Over the past 40 years, 90 percent of Nagoya’s growth has been outside the core municipality.

    Lima is another new megacity. In Lima, core district population is declining and all growth has occurred in suburban districts over the latest 15 years for which there is data.

    The Limits to Urban Density Declines

    There are limits to urban density declines. As people become more affluent and car use increases, city densities decline toward those of automobile orientation. Once that has occurred, there may be modest density increases, but not sufficient to restore the much higher urban area densities from the past and now found only in pre-automobile urban cores.

    However, as lower and middle income cities, from Lagos to Sao Paulo grow and achieve greater affluence, urban growth is likely to continue to be on the lower density periphery.

    Note: The metropolitan area is the economic form of the city. The metropolitan area includes rural and urban territory from which commuters are drawn to employment in the principal urban area.

    Wendell Cox is principal of Demographia, an international public policy and demographics firm. He is co-author of the "Demographia International Housing Affordability Survey" and author of "Demographia World Urban Areas" and "War on the Dream: How Anti-Sprawl Policy Threatens the Quality of Life." He was appointed to three terms on the Los Angeles County Transportation Commission, where he served with the leading city and county leadership as the only non-elected member. He was appointed to the Amtrak Reform Council to fill the unexpired term of Governor Christine Todd Whitman and has served as a visiting professor at the Conservatoire National des Arts et Metiers, a national university in Paris.

    Photo: Depiction of Lagos built-up urban area