Category: Suburbs

  • The New Donut

    Former Indianapolis Mayor Bill Hudnut used to like to say that “you can’t be a suburb of nowhere.” This is the oft-repeated notion has been a rallying cry for investments to revitalize downtowns in America for three decades or so now. The idea being that you can’t have a smoking hole in your region where your downtown is supposed to be. This created a mental based on a donut. You can’t let downtown become an empty hole. For reason that will become apparent soon, I call this model “the old donut”.

    Filling in the hole became every city’s mission. Pretty much any city or metro region of any size has pumped literally billions of dollars into its downtown in an attempt to revitalize them. This took many forms ranging from stadiums to convention centers to hotels to parking garages to streetcars to museums and more. It’s popular today to subsidize mixed use development with a heavy residential component.

    These efforts have paid off to a certain degree. Most big city downtowns have done very well as entertainment and visitor districts, eds and meds centers, etc. More recently we’ve seen an influx of residents, even in places where the overall city or even region has struggled or declined. Cleveland added about 4,000 net new downtown residents in the 2000s. St. Louis added 3,000. With most cities in some stage of an apartment building spree consisting of a few thousand units, these numbers should only improve.

    Key weaknesses remain in private sector employment (declining in most places) and retail (not enough high income residents yet). And other than the tier one types of cities like Chicago, few places seem to have reached a sustainable market rate development level yet – pretty much everything is getting public assistance. Yet its pretty evident that most larger downtowns have made huge strides and are experiencing overall reasonable health.

    In short, the donut hole has been filled in. Where does that leave us? I’d argue with a paradigm I call “the new donut”:


    In this model, the old donut is inverted. What used to be the ring of health – the outer areas of the city and the inner suburban regions – are now struggling. Whereas the downtown is in pretty good shape, and the newer suburban areas are booming. (You might add in a fourth outer ring with troubles – these were the exurbs where very low-end housing proliferated because development standards were very low).

    You see this in the population figures. Wendell Cox cranked the numbers and found that major metro areas gained 206,000 residents in the two mile radius from the center, but lost 272,000 residents from the 2-5 mile ring. Growth picked up strongly beyond that arc. This is the new donut area, though the start and end of it vary by metro and some have thicker rings of challenge than others.

    We’ve got three decades of experience in downtown revitalization, but much less in dealing with this newer challenge zone. I’ve said that suburban revitalization may prove to be the big 21st century “urban” challenge. This is where it is happening in many cases. These areas have an inferior housing stock (often small post-war worker cottages or ranches), sometimes poor basic infrastructure, and are sometimes independent municipalities that, like Ferguson, MO, are often overlooked unless something really bad happens. Unlike the major downtown, they are often “out of sight, out of mind” for most regional movers and shakers.

    What’s more, while downtown provides a concentrated location for massive public investment, this more spread out area is too big to fix by throwing money at it. And how many stadiums and convention centers does a region need in any event?

    This is where we need to be doing a lot of thinking about how to bring these places back, look at what’s being done, etc. And also, given the inequality in the country, to try to think about ideas that don’t involve gentrification. One project that appears to be in this kind of zone, for example, is Atlanta’s Beltline project, though there’s a gentrifying aspect to this one. Regions that figure this one out will be at a big advantage going forward.

    Aaron M. Renn is an independent writer on urban affairs and the founder of Telestrian, a data analysis and mapping tool. He writes at The Urbanophile, where this piece originally appeared.

  • Seniors Dispersing Away from Urban Cores

    Senior citizens (age 65 and over) are dispersing throughout major metropolitan areas, and specifically away from the urban cores. This is the opposite of the trend suggested by some planners and media sources who claim than seniors are moving to the urban cores. For example, one headline, "Millions of Seniors Moving Back to Big Cities" is at the top of a story with no data and anecdotes ranging that are at least as much suburban (Auburn Hills, in the Detroit area) and college towns (Oxford, Mississippi and Lawrence, Kansas), as they are big city. Another article, "Why Seniors are Moving to the Urban Core and Why It’s Good for Everyone," is also anecdote based, and gave prominence to a solitary housing development in downtown Phoenix (more about Phoenix below).

    Senior Metropolitan Growth Trails National

    Between 2000 and 2010, the nation’s senior population increased approximately 5.4 million, an increase of 15 percent. Major metropolitan areas accounted for approximately 50 percent of the increase (2.7 million) and also saw their senior population increase 15 percent. By contrast, these same metropolitan areas accounted for 60 percent of overall growth between 2000 and 2010, indicating that most senior growth is in smaller metropolitan areas and rural areas.

    Senior Metropolitan Population Dispersing

    The number of senior citizens living in suburbs and exurbs of major metropolitan areas (over 1,000,000 population) increased between 2000 and 2010, according to census data. The senior increases were strongly skewed away from the urban cores. Suburbs and exurbs gained 2.82 million senior residents over the period, while functional urban cores lost 112,000. The later suburbs added 1.64 million seniors. The second largest increase was in exurban areas, with a gain of 0.88 million seniors. The earlier suburbs (generally inner suburbs) added just under 300,000 seniors (Figure 1).

    During that period, the share of senior citizens living in the later suburbs increased 35 percent. The senior citizen population share in the exurbs rose nearly 15 percent. By contrast, the share of seniors living in the functional urban cores declined 17 percent. Their share in the earlier suburbs declined 11 percent.

    This is based on an analysis of small area data for major metropolitan areas using the City Sector Model.
    City Sector Model analysis avoids the exaggeration of urban core data that necessarily occurs from reliance on the municipal boundaries of core cities (which are themselves nearly 60 percent suburban or exurban, ranging from as little as three percent to virtually 100 percent). It also avoids the use of the newer "principal cities" designation of larger employment centers within metropolitan areas, nearly all of which are suburbs, but are inappropriately joined with core municipalities in some analyses. The City Sector Model" small area analysis method is described in greater detail in the Note below.

    Pervasive Suburban and Exurban Senior Gains

    The gains in functional suburban and exurban senior population were pervasive. Among the 52 major metropolitan areas, there were gains in 50. In two areas (New Orleans and Pittsburgh), there were losses. However, in each of these cases there was an even greater senior loss in the functional urban cores. In no case did urban cores gain more or lose fewer seniors than the suburbs and exurbs. Eight of the functional urban cores experienced gains in senior population, while 44 experienced losses (Figure 2)

    Largest Urban Cores

    The major metropolitan areas with the largest urban cores (more than 20 percent of the population in the functional urban cores),  would tend to be the most attractive to seniors seeking an urban core lifestyle. But they  still saw their seniors heading  to the suburbs and exurbs (Figure 3). Senior populations declined in the functional urban cores of all but two of these nine areas, New York and San Francisco. However, in both of these metropolitan areas, the increases in suburban and exurban senior populations overwhelmed the increases in the urban cores. All of these nine major metropolitan areas experienced increases in their suburban and exurban senior populations.

    Moreover, the Phoenix anecdote cited above is at odds with the reality that the later suburbs and exurbs gained 165,000 seniors between 2000 and 2010. The earlier suburbs lost 7,000 seniors (No part of Phoenix has sufficient density or transit market share to be classified as functional urban core).

    Consistency of Seniors Trend with Other Metropolitan Indicators

    As has been indicated in previous articles, there continues to be a trend toward dispersal and decentralization in US major metropolitan areas. There was an overall population dispersion from 1990 to 2000 and 2000 to 2010, which continued trends that have been evident since World War II and even before, as pre-automobile era urban cores have lost their dominance. Jobs continued to follow the suburbanization and exurbanization of the population over the past decade away as cities became less monocentric, less polycentric and more "non-centric." As a result, work trip travel times are generally shorter for residents where population densities are lower. Baby boomers and Millennials have been shown to be dispersing as well, despite anecdotes to the contrary (Figure 4). The same applies to seniors.

    Note: The City Sector Model allows a more representative functional analysis of urban core, suburban and exurban areas, by the use of smaller areas, rather than municipal boundaries. The more than 30,000 zip code tabulation areas (ZCTA) of major metropolitan areas and the rest of the nation are categorized by functional characteristics, including urban form, density and travel behavior. There are four functional classifications, the urban core, earlier suburban areas, later suburban areas and exurban areas. The urban cores have higher densities, older housing and substantially greater reliance on transit, similar to the urban cores that preceded the great automobile oriented suburbanization that followed World War II. Exurban areas are beyond the built up urban areas. The suburban areas constitute the balance of the major metropolitan areas. Earlier suburbs include areas with a median house construction date before 1980. Later suburban areas have later median house construction dates.

    Urban cores are defined as areas (ZCTAs) that have high population densities (7,500 or more per square mile or 2,900 per square kilometer or more) and high transit, walking and cycling work trip market shares (20 percent or more). Urban cores also include non-exurban sectors with median house construction dates of 1945 or before. All of these areas are defined at the zip code tabulation area (ZCTA) level.

    —-

    Wendell Cox is principal of Demographia, an international public policy and demographics firm. He is co-author of the "Demographia International Housing Affordability Survey" and author of "Demographia World Urban Areas" and "War on the Dream: How Anti-Sprawl Policy Threatens the Quality of Life." He was appointed to three terms on the Los Angeles County Transportation Commission, where he served with the leading city and county leadership as the only non-elected member. He was appointed to the Amtrak Reform Council to fill the unexpired term of Governor Christine Todd Whitman and has served as a visiting professor at the Conservatoire National des Arts et Metiers, a national university in Paris.

    Photo: Later Suburbs of Cincinnati (where most senior growth occurred from 2000 to 2010). By Author

  • The Death of Nassau Coliseum: A Harbinger of Suburban Decline?

    Nassau Veterans Memorial Coliseum is one of the last remaining old time hockey rinks. But this will be the last year that the New York Islanders play there. The old barn has long been slated for replacement. It is an old building that requires expensive repairs. Many attempts were made to reach an agreement for a new arena with Nassau County. Sadly, the team’s new location will be at the Barclay’s Center in Brooklyn; on Long Island physically, but not a part of the island’s suburban tradition. The team will retain the name, but Long Island effectively is losing its team.

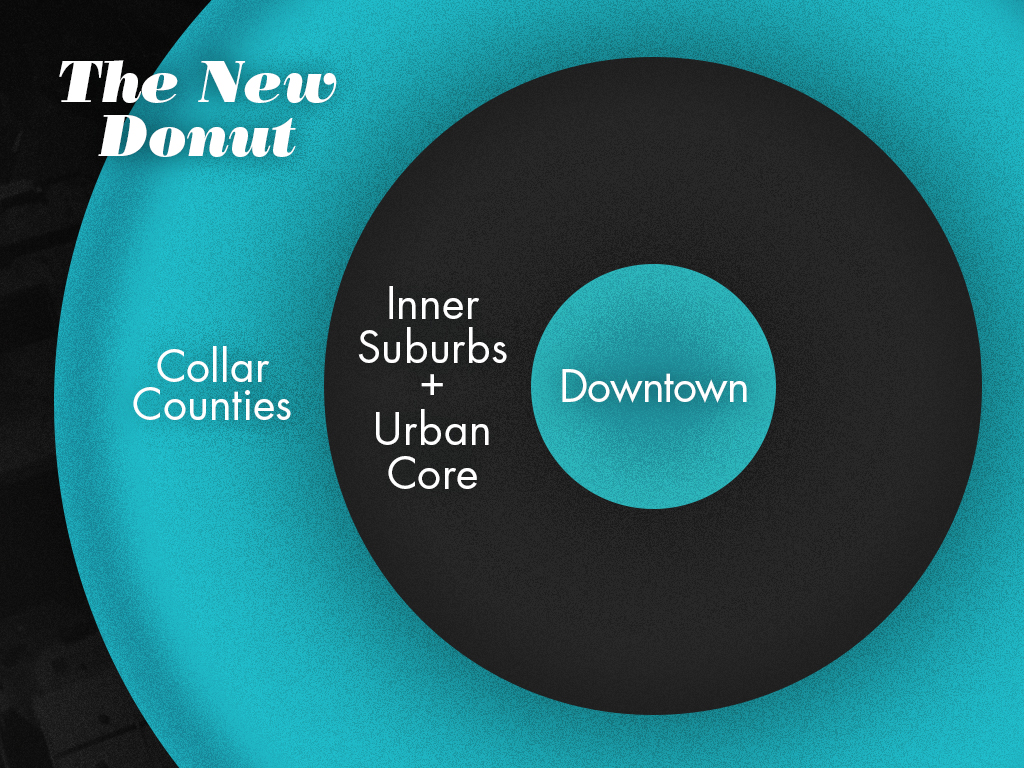
    Suburban Decline, Urban Ascent?

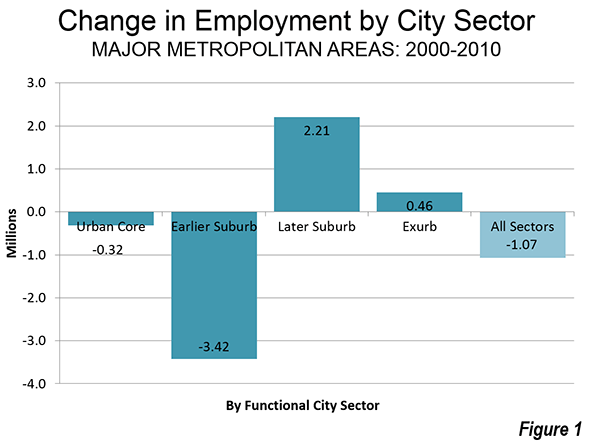
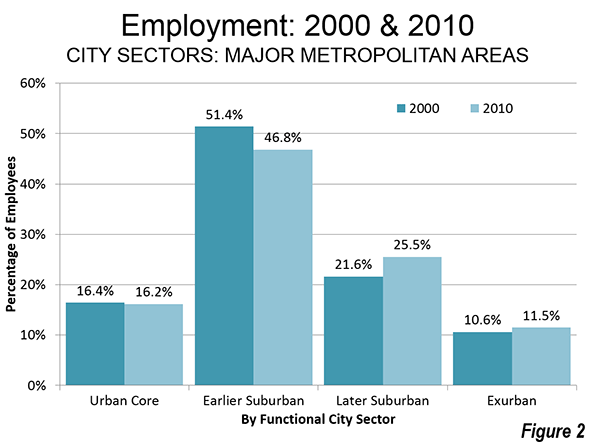
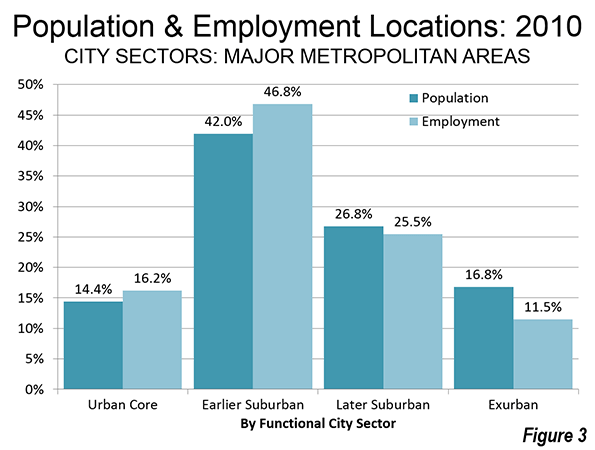
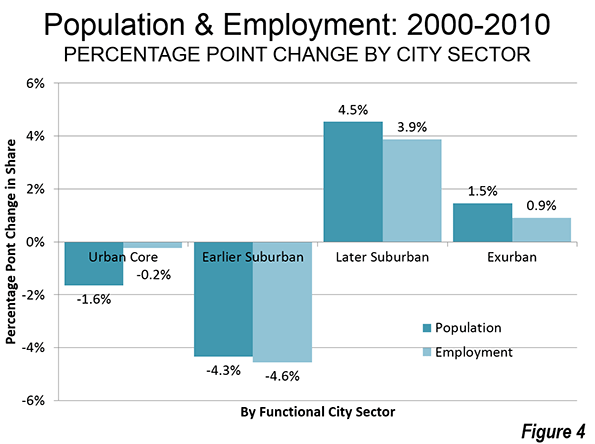
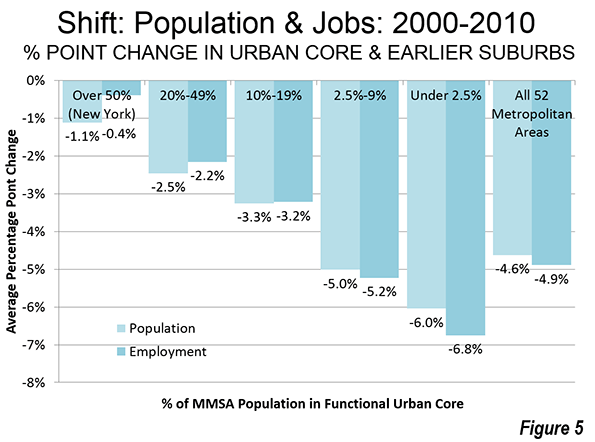
    Some observers, like Mark Byrnes in CityLab, see this shift as further evidence of suburban life and the elevation of the urban core.1 But instead it is another frustrating case of a small, highly visible not in my backyard (NIMBY) movement in suburbia on one hand, and, on the other, an unwanted development foisted upon urban residents without due process through eminent domain.

    Two Arenas

    The New York Islanders haven’t been very newsworthy for the last decade – save for their volatile ownership situation, but their transition from one of the National Hockey League’s oldest buildings in Long Island to a new building in Brooklyn has been a very public ordeal. It’s a story that involves local politicians thwarting construction of a new arena that would have cost taxpayers nothing, a failed referendum to finance an alternative proposal that would have required public funding, and ends with the Islanders moving out of Long Island into the controversial Barclay Centre. Even if the Barclay Centre proves to be a viable and enjoyable venue for the Islanders, it will forever remain one of the most disastrous developments in the history of professional sports.

    The Old Barn

    Nassau Coliseum is the second oldest active building in the National Hockey League. The arena was built on the site of decommissioned Army/Air force base Mitchell Field.2 Nassau County acquired the land in 1960, a year after closure. Nassau Coliseum officially opened on February 11, 1972.3 The cost of the project was $32 million ($179 million, adjusted for inflation).4 The Coliseum sits on 5 acres of a 77-acre plot in Uniondale, the rest of which is mainly surface parking.5

    The site is intersected by two major roadways, and is across the street from Hofstra University and a golf course. It is right down the street from Levittown, the prototypical post-war American suburb. It is the type of place where one might assume that building large scale projects should be relatively simple.

    The Lighthouse Project

    In 2000, software billionaire Charles Wang bought the Islanders for $190 million.6  High end estimates suggest that Wang might have lost as much as $208 million between 2000 and 2009 on the team in large part due to   having one of the least favourable lease agreements in professional sports.7.8 “The need to refurbish the ageing building provided a perfect opportunity to put the team on a solid financial footing.

    Wang proposed a plan to develop the area surrounding the arena. The Lighthouse Project was expected to take 8-10 years to complete at a cost of roughly $3.74 billion.9 The plan included a renovation of the Coliseum, a 60-story tower designed to look like a lighthouse, housing, athletic facilities, a new minor league baseball stadium, restaurants, and a new hotel.10 The transformation of the Coliseum would have entailed lowering the floor of the ice rink to accommodate additional seats, increasing capacity from 16,300 to 17,500 during hockey games, 18,500 for basketball games and 20,000 for concerts, while adding 50 luxury boxes.11

    The proposal would also have brought a 125,000-square-foot athletic complex including two ice rinks (a practice rink for the Islanders, and another for the public), a basketball court, and a fitness club where the Islanders and the Arena Football League’s New York Dragons (also owned by Wang) would have trained.12

    The project would also have included moderately priced housing, which is lacking in Long Island. Long Island County was also exploring enhanced public transportation to the future development, including bus rapid transit.13

    Phase two of the project would have included a conference center, a sports technology building, residences, and the 60-story lighthouse (including a 500 room luxury hotel).14

    Building a new arena on such a large parcel of land surrounded by sparse, low density development should have theoretically faced few obstacles, given that the owner was willing to finance the entire project. Unfortunately, the project drew the ire of some local residents. Robert Zafonte, president of the 3500 member East Meadow Civic and Community Association, had this to say:

    ”The high-rise disturbs me,” he said. ”It seems to be totally out of character with the nature of the suburban area here. It is not consistent with what Long Island is all about – residential, small homes. I don’t think it belongs here.15

    The Lighthouse Project was approved by the county in 2006, but stalled when Wang was unable to secure zoning approvals from the Town of Hempstead.16 Republican Town of Hempstead Supervisor Kate Murray, lobbied intensely by a small group of local residents, decided that the project would result in too much traffic.

    Not in My Backyard

    In an attempt to salvage the project, Charles Wang and the Lighthouse Development Group partnered with Rexcorp to create a scaled down version of the project. The most notable change was that the Lighthouse would now be 30 stories, rather than 60.17

    But as Pearl M. Kamer, chief economist of the Long Island Association pointed out, “When you cut density on any project, you cut revenue.” He argued that under the proposal, scaled back to meet Murray’s demands, it would be difficult if not impossible to generate enough revenue to finance the project.18 This meant that the new proposal would likely require public funding, in contrast to the original proposal which would have been entirely privately funded.

    Wang eventually reached an agreement with Nassau County to build a scaled down version of the Lighthouse Project, pending an August 2011 referendum. Since the stripped down project would have yielded less revenue than the original proposal, the project would only have been viable with $400 million in public financing.19 The funding would have necessitated a 4 percent property tax increase. Voters rejected the proposal by a 57-43 margin.20

    The End of the Lighthouse Project

    With the end of the Lighthouse Project, Wang entered into a 25 year lease with the Barclay Centre soon after. The Islanders will begin playing at the building in 201521, though they already played their first exhibition game at the arena on September 21st, 2013.

    Losing the Islanders will result in significant economic losses to the county. Nassau County’s comptroller estimated that had last year’s NHL lockout lasted a full season, the county would have lost $62.2 million in economic activity, and the Nassau County treasury would have lost $1.1 million in  of ticket taxes, as well as a share of concessions and parking fees.22  Those are substantial loses for a county of less than 1.4 million residents.

    While Charles Wang has frequently been blamed for the relocation, NHL Commissioner Gary Bettman lays the blame squarely at the feet of local politicians.

    "This is a situation that is not of the Islanders’ making,” he said. “The responsibility for what’s happened really lies with Nassau County and the Town of Hempstead. For the fans in Nassau, not just of the Islanders, but of circuses and rock concerts and the like, it’s a shame.23

    The Uncertain Future of the Coliseum

    Though this seems like the end of the Nassau Coliseum saga, the future of the arena is still up for debate. Barclay Centre part-owner Bruce Ratner has proposed a $229 redevelopment plan for the arena. The project would include renovating the Coliseum, building restaurants, an ice rink, bowling alley, movie theater and other facilities.24  

    The Ratner proposal faces many hurdles, including luring an American Hockey League (NHL farm team) club to replace the Islanders. The Islanders AHL affiliate, the Bridgeport Sound Tigers (also owned by Wang), could potentially move from Connecticut to fill that void. Additionally, the Islanders are still slated to play 6 home games (out of 41) per year at the Coliseum.25 One columnist at Forbes has speculated that Ratner, who would own both the Nassau Coliseum and part of the Barclay Centre, might well decide to keep the Islanders in Long Island after all if he can secure approval for the new project.26  

    Imposing an Arena on Brooklyn

    The Barclay Centre differs dramatically from the failed Lighthouse Project. The Barclay Centre was part of the $4.9 billion Atlantic Yards project built in run down commercial area of Brooklyn, despite local opposition. Mayor Bloomberg used eminent domain to seize the “blighted” land to allow for construction.

    Brooklyn had been without a sports franchise since 1957, when the Brooklyn Dodgers moved to Los Angeles.  

    The Barclay Centre was initially proposed in 2004 when real estate developer Bruce Ratner purchased the New Jersey Nets for $300 million. Ratner planned to move the franchise out of New Jersey and into the lucrative Brooklyn market. The project was initially projected to open in 2006.

    The attempt to use eminent domain to seize the land was brought before the New York Supreme Court, delaying the process. The court eventually ruled in Ratner’s favour.

    Ratner’s years of frustration with the project lead him to sell a majority share of the Nets to Russian businessman Mikhail Prokhorov for $200 million.

    Due to construction delays, the Nets signed a deal to play in Newark at the Prudential Centre until the Barclay’s Centre was complete.

    Construction of the $1 billion arena began in January of 2010. The Barclay’s Centre was open to the public on September 21, 2012. Just over a month later, the Islanders announced their agreement to play at the Barclay’s Centre.

    The Barclay Compromise

    The Barclay’s Centre wasn’t a bad solution to the stalemate in Nassau County. The arena is new, and Brooklyn is a lucrative sports market. The Long Island Railroad provides direct service to Atlantic Terminal, meaning it will be more convenient for many Long Island residents to access the Barclay’s Centre than Nassau Coliseum. However, the 15,813 seating capacity is far short of most modern NHL arenas, and many seats have partially obstructed views.

    At the same time, the failed Lighthouse Project was a missed opportunity for Nassau County. The community still hasn’t rebounded to its 1970 population, which fell by 100,000 during the 1970s. Estimates suggest that the $4.4 billion of private investment into the Lighthouse project would have created 75,000 construction jobs and 19,000 permanent jobs thereafter.27 Moreover, it would have resulted in expanded public transit options on Long Island. Lawrence Levy, executive director of the National Centre for Suburban Studies at Hofstra University in a 2009 interview described the project as “potentially a game-changer.”

    Even ignoring the direct economic losses, the failure of the Lighthouse Project sent a clear message to businesses that Long Island will only accept investment on its own terms. The fallout is impossible to measure.

    Wither Suburbia?

    There is an ongoing dialogue between observers over whether suburbia is a “market outcome”, or whether it is an artificial creation of government policy. The truth is likely in the middle. Suburban communities are regulated, subsidized, and taxed in many different ways. Zoning restricts the ability to build corner stores and cafes in residential neighbourhoods. Wasteful road projects connect many uneconomic housing developments to cities. Land-use regulations drive up land prices, which are passed on to homebuyers. Suburbia is certainly a market outcome in the sense that decreased transportation costs, dispersed entertainment and communications options, and preferences for larger backyards mean that many people would happily pay the market cost of suburban housing. But its particular shape is not a market outcome. Neither, for that matter, is the shape of any geographical area.  

    There are good reasons for regulating land-use. Separating factories that emit noxious odours from residential communities makes sense. The trouble is that land-use planning has gone from a health and safety measure to an economic tool. In Uniondale it was used to ensure that additional traffic didn’t impose costs on drivers, who would prefer not to bear the costs of congestion. In Brooklyn, it was used to ensure that developers and the municipal government could extract value from property that wasn’t on the market. The market outcome would have been allowing the Lighthouse Project to proceed, and the New Jersey Nets to remain in New Jersey (or perhaps to move to Uniondale). The Barclay’s Centre doesn’t represent a triumph of the city. It is the net result of contrasting political meddling in two different jurisdictions.

    Perhaps There Are No Real Lessons Here

    While we shouldn’t read too much into isolated incidents, there does seem to be an increasing propensity for suburban communities to prevent dense development – from the Bay Area to suburban Toronto –  and for cities to use eminent domain to ram through those same types of developments.  

    This is a story about politics, not economics. And sometimes politics leads to some really bad outcomes. That may well be all there is to it. Either way, the Islanders will be moving to Brooklyn next year. Fans should enjoy the old barn while it lasts. It is the last of a dying breed.

    Steve Lafleur is a public policy analyst with the Frontier Centre for Public Policy, an independent think tank based in Winnipeg, Manitoba. His primary research interests are housing and land use policies, transportation and infrastructure, criminal justice policy, immigration, inter-governmental fiscal relations, and municipal finances. His work has been featured in most Canadian newspapers including the Toronto Star and the National Post.

    1 http://www.citylab.com/politics/2012/11/islanders-move-harbinger-suburban-decline/3826/

    2 http://nysea.bizland.com/nysea/publications/proceed/2012/Proceed_2012_p221.pdf

    3 http://nysea.bizland.com/nysea/publications/proceed/2012/Proceed_2012_p221.pdf

    4 http://nysea.bizland.com/nysea/publications/proceed/2012/Proceed_2012_p221.pdf

    5 http://query.nytimes.com/gst/fullpage.html?res=9D01E5DD1538F930A35753C1A9629C8B63

    6 http://nysea.bizland.com/nysea/publications/proceed/2012/Proceed_2012_p221.pdf

    7 http://nysea.bizland.com/nysea/publications/proceed/2012/Proceed_2012_p221.pdf

    8 http://sports.espn.go.com/nhl/news/story?id=4129484

    9 http://en.wikipedia.org/wiki/The_Lighthouse_Project

    10 http://en.wikipedia.org/wiki/The_Lighthouse_Project

    11 http://query.nytimes.com/gst/fullpage.html?res=9D01E5DD1538F930A35753C1A9629C8B63

    12 http://query.nytimes.com/gst/fullpage.html?res=9D01E5DD1538F930A35753C1A9629C8B63&pagewanted=2

    13 http://query.nytimes.com/gst/fullpage.html?res=9D01E5DD1538F930A35753C1A9629C8B63&pagewanted=2

    14 http://query.nytimes.com/gst/fullpage.html?res=9D01E5DD1538F930A35753C1A9629C8B63&pagewanted=2

    15 http://query.nytimes.com/gst/fullpage.html?res=9D01E5DD1538F930A35753C1A9629C8B63

    16 http://www.newsday.com/long-island/nassau/inside-the-deal-to-remake-nassau-coliseum-1.6115950?utm_medium=twitter&utm_source=twitterfeed

    17 http://en.wikipedia.org/wiki/The_Lighthouse_Project

    18 http://www.nytimes.com/2010/07/25/realestate/25lizo.html?adxnnl=1&adxnnlx=1379883639-wcQ7dfnu7u1PMJZCGW8k9g

    19 http://www.nytimes.com/2011/08/02/nyregion/nassau-voters-reject-proposal-to-overhaul-coliseum.html?_r=0

    20 http://www.nytimes.com/2011/08/02/nyregion/nassau-voters-reject-proposal-to-overhaul-coliseum.html?_r=0

    21 http://www.nydailynews.com/sports/hockey/ice-job-brooklyn-nhl-islanders-leave-15-article-1.1191783

    22 http://nysea.bizland.com/nysea/publications/proceed/2012/Proceed_2012_p221.pdf

    23 http://www.newsday.com/sports/hockey/islanders/gary-bettman-says-he-likes-future-islanders-owners-1.9230790

    24 http://www.newsday.com/long-island/nassau/inside-the-deal-to-remake-nassau-coliseum-1.6115950?utm_medium=twitter&utm_source=twitterfeed

    25 http://www.lighthousehockey.com/2013/5/2/4293850/ratner-brooklyn-islanders-games-nassau-coliseum

    26 http://www.forbes.com/sites/tomvanriper/2013/08/16/brooklyn-islanders-not-so-fast/

    27 http://www.nytimes.com/2009/06/18/nyregion/18towns.html?_r=0

  • Millennials: A Powerful, Suburban Living Generation

    The latest survey data on the  living preferences of the Millennial generation (born 1982-2003) once again validates the picture of a cohort  that, contrary to urban legend, actually prefers the suburbs, even as they prepare to shape the suburbs in their own image. We and others have previously made this data-based point on this website. The results of the survey challenges the often wishful thinking of academics and ideologues who yearn for a more urbanized, denser America. 

    The Demand Institute commissioned the Nielsen company, to survey 1000 Millennial households about where and how they plan to live over the next five years, The results suggest a major transformation of the country’s housing markets is about to take place that will benefit those who know and understand Millennials and respond to their desires.

    There are 13.3 million households headed by Millennials today. During the next five years that number is projected by the Demand Institute to increase by over 60% to 21.6 million as many Millennials take their first steps toward marriage and family formation. While only 30% of the 18-29 year olds interviewed were now married, seven out of ten said they expected to be within the next five years. A majority (55%) also anticipate becoming parents during this period. As a result, 71% of those interviewed said, that over the next five years, they planned on moving to a  better home or apartment; about half expect to “own, not rent” their new home.   

    This burst of family formation, of course, is quite typical for thirty-year olds, a plateau that millions of Millennials will reach in the next half-decade. And, rather than diverge from the pattern, Millennials are following it in their own way. This is good news long term for the economy since their major lifestyle changes will lead to a burst of spending by Millennials. The Demand Institute’s report suggests that, between now and 2018 the generation will spend $1.6 trillion on home purchases and $600 billion in rent. The big questions are where will they spend all that money and what will they spend it on?

    The Suburbs is the clear answer to the first question. Forty-eight percent of the Millennials interviewed said they planned on moving to the suburbs, while only 38% said they would be moving into large urban areas.  A scant 14% planned to move to rural environments.

    The type of suburban living these Millennials favor, however, is a little different than many of the developments builders are planning to offer. Sixty-one percent say they are looking for more space in their next home than they currently enjoy. An additional 24% want at least the same amount of space. A mere 15% express a desire to live in less space, something often assumed by retro-urbanists, in a presumably more crowded urban environment. Furthermore, although substantial numbers prefer having major amenities within walking distance, most Millennials say they are willing to take a “short drive” to restaurants (54%), grocery stores (61%), and even shopping centers (57%). This suggests that new “walkable” suburbs, including large planned developments on the fringe and Millennial-“gentrified” close in suburbs, all with single family homes, are likely to be the places that benefit most from this wave of Millennial family formation and spending on housing.  

    The single biggest barrier to the country enjoying this burst of new spending remains the Millennial generation’s unique burden of student debt. While three-fourths of Millennials believe home ownership is both an important long term goal and a good investment, only 36% believe they will be able to buy their next home, rather than rent. The impact of student debt on this purchasing decision can clearly be seen in the current behavior of 30-35 year old Millennials.  Only half of those with student debt now own homes, while two-thirds of those lucky enough to graduate college without such debt are home owners. This clearly indicates that student debt reform is the single most important issue facing realtors and home builders future success. It should be their priority in Washington.

    In the meantime, there may be some creative ways to confront this problem; 69% of the four-in-ten Millennials who believe they could not qualify for a traditional mortgage are open to leasing a new home with an option to buy it later.  

    The results of this survey make it clear that the nation’s housing future remains in its suburbs. Those communities which can offer Millennials the type of lifestyle they desire will be rewarded with growth. Those that cling to outdated notions of what constitutes urban or suburban living will find it difficult to compete for the Millennial generation’s housing dollar and the vibrant economic activity that will flow from their choices.

    Morley Winograd and Michael D. Hais are co-authors of the Kindle book Millennial Majority, along with Millennial Momentum: How a New Generation is Remaking America and Millennial Makeover: MySpace, YouTube, and the Future of American Politics and fellows of NDN and the New Policy Institute.

  • Why Suburbia Irks Some Conservatives

    For generations, politicians of both parties – dating back at least to Republican Herbert Hoover and Democrat Franklin Roosevelt – generally supported the notion of suburban growth and the expansion of homeownership. “A nation of homeowners,” Franklin Roosevelt believed, “of people who own a real share in their land, is unconquerable.”

    Support for suburban growth, however, has ebbed dramatically, particularly among those self-styled progressives who claim FDR’s mantle. In California, greens, planners and their allies in the development community have supported legislation that tends to price single-family homes, the preference of some 70 percent of adults, well beyond the capacity of the vast majority of residents.

    Less well-noticed is that opposition to suburbs – usually characterized as “sprawl” – has been spreading to the conservative movement. Old-style Tories like author-philosopher Roger Scruton do not conceal their detestation of suburbia and favor, instead, European-style planning laws that force people to live “side by side.” Densely packed Paris and London, he points out, are clearly better places to visit for well-heeled tourists than Atlanta, Houston or Dallas.

    There may be more than a bit of class prejudice at work here. British Tories long havedisliked suburbs and their denizens. In a 1905 book, “The Suburbans,” the poet T.W.H. Crossland launched a vitriolic attack on the “low and inferior species,” the “soulless” class of “clerks” who were spreading into the new, comfortable houses in the suburbs, mucking up the aesthetics of the British countryside.

    Not surprisingly, many British conservatives, like Scruton, and his American counterparts frequently live in bucolic settings, and understandably want these crass suburbanites and their homes as far away as possible. Yet, there is precious little concern that – in their zeal to protect their property – they have also embraced policies that have engendered huge housing inflation, in places like greater London or the San Francisco Bay Area, that is among the most extreme in the high-income world.

    Of course, the conservative critique of suburbia does not rest only on aesthetic disdain for suburbs, but is usually linked to stated social and environmental concerns. “There’s no telling how many marriages were broken up over the stress of suburb-to-city commutes,” opines conservative author Matt Lewis in a recent article in The Week. In his mind, suburbs are not only aesthetically displeasing but also anti-family.

    What seems clear is that Lewis, and other new retro-urbanist conservatives, are simply parroting the basic urban legends of the smart-growth crowd and planners. If he actually researched the issue, he would learn that the average commutes of suburbanites tend to be shorter, according to an analysis of census data by demographer Wendell Cox, than those in denser, transit-oriented cities. The worst commuting times in America, it turns out, to be in places such as Queens and Staten Island, both located in New York City.

    Other conservatives also point to the alleged antisocial aspect of conservatism, a favored theme of new urbanists everywhere. A report co-written by the late conservative activist Paul Weyrich supported forcing “traditional designs for the places we live, work and shop,” which “will encourage traditional culture and morals,” such as community and family.

    Once again, however, a serious examination of research – as opposed to recitation of planners’ cant – shows that suburbanites, as University of California researchers found, tend to be more engaged with their neighbors than are people closer to the urban core. Similarly, a 2009 Pew study recently found that, among the various geographies in America, residents in suburbia were more “satisfied” than were either rural or urban residents.

    In working against suburbia, these conservatives are waging a war on middle-class America, not necessarily a smart political gambit. Overall, conventional suburban locations are home to three-quarters of the metropolitan population. And even this number is low, given that large parts of most large American cities – such as Los Angeles, Phoenix, Dallas, Kansas City and Houston – are themselves suburban in character, with low transit use and a housing stock primarily made up of single-family residences built during the auto-dominated postwar period. Only approximately 15 percent of residents in major metropolitan areas actually live in dense, transit-oriented communities.

    Given these numbers, one might think conservatives would take issue with progressive plans to circumvent preferences and market forces by constraining suburban and single-family home growth. They might spot a strategic opening to secure the urban periphery, the one area still up for grabs in American politics. In contrast, the blue core cities and red countryside have, for the most part, chosen sides, and both return huge consistent majorities to their preferred party.

    Lured by their own class prejudice, some conservatives nevertheless seem willing to abandon market forces, a supposed conservative virtue. In reality, imposing Draconian planning is not even necessary for the growth of density. In places that are have both liberal planning regimes and economic growth, such as Houston and Dallas, there has been a more rapid increase in multifamily housing than in such cities such as Boston, Los Angeles, San Francisco or New York. The cost is just much lower.

    Unfortunately, few mainstream conservatives apparently bother to study such things, and, as prisoners of the conventional wisdom, embrace the notion that, on economic grounds, suburbs are becoming irrelevant. Some, such as the libertarian economist Tyler Cowen, suggest that a stagnating post-recession America has to adjust to what has been described as a “new normal” of declining expectations.

    With middle-class opportunity seen as largely moribund, many financial interests see America becoming a “rentership” society; for these rent-seeking capitalists, the death of suburbs would be not only morally correct, but also economically advantageous.

    It’s hard for me, even as a nonconservative, to see how this trajectory works for the Right.

    Renters, childless households, highly educated professionals, as well as poor service workers, clustering in dense cities are not exactly prime Republican voters. Without property, and with no reasons to be overly concerned with dysfunctional schools, the new urban population tilts increasingly, if anything, further to the left.

    Meanwhile, the middle-class homeowner, and those who aspire to this status, increasingly find themselves without a party or ideology that champions their interests. In exchange for the approval of the cognitive elites in the media, in academia and among planners, conservatives will have, once again, missed a chance to build a broad popular coalition that can overcome the “upstairs, downstairs” configuration that increasingly dominates the Democratic Party.

    Yet, there remains a great opportunity for either party that will appeal to, and appreciate, the suburban base. Conservative figures such as Ronald Reagan and Margaret Thatcher understood the connection between democracy and property ownership and upward mobility. Much the same could be said for traditional Democrats, from Roosevelt and Harry Truman, all the way to Bill Clinton.

    For all their faults, suburbs represent the epitome of the American Dream and the promise of upward mobility. That they can be improved, both socially and environmentally, is clear. This is already happening in new, mostly privately built, developments where the “ills” of suburbia – long commute distances, overuse of water and energy – are addressed by building new town centers, bringing employment closer to home, the use of more drought-resistant landscaping, promoting home-based business and developing expansive park systems. This seems more promising than following a negative agenda that seeks simply to force ever-denser housing and create heat-generating concrete jungles.

    The abandonment of the suburban ideal represents a lethal affront to the interests and preferences of the majority, as well as their basic aspirations. The forced march towards densification and ever more constricted planning augurs not a return to old republican values, as some conservatives hope, but the transformation of America from a broadly based property-owning democracy into something that more clearly resembles feudalism.

    This piece originally appeared at The Orange County Register.

    Joel Kotkin is executive editor of NewGeography.com and Distinguished Presidential Fellow in Urban Futures at Chapman University, and a member of the editorial board of the Orange County Register. His newest book, The New Class Conflict is now available at Amazon and Telos Press. He is author of The City: A Global History and The Next Hundred Million: America in 2050. His most recent study, The Rise of Postfamilialism, has been widely discussed and distributed internationally. He lives in Los Angeles, CA.

  • Are Cool Downtowns the Solution to Suburban Ennui?

    Recently, former Nassau County Executive Tom Suozzi took a turn answering The Foggiest Five, a new segment that asks influential Long Islanders five questions regarding the future of the Nassau-Suffolk region. His answers gave an interesting look at our issues, and I appreciate the time he took answering the questions.

    Suozzi served Nassau’s County Executive from 2002 to 2009. Since Nassau is an older, first ring suburb, the County has limited opportunities for a complete overhaul of its physical imprint. In recent years, their redevelopment efforts have been skewed towards infill and revitalizing already-existing areas.

    His answers reflected Suozzi’s unique experience gained thanks to the years he ran Nassau County. When asked about the biggest change he’s witnessed on Long Island, Suozzi highlighted property taxes as a “root of all evil” of sorts concerning our regional problems. Suozzi gave five causes to our tax problem:
    1)Waste, Fraud and Abuse, 2) Long Island residents pay much more in income taxes to the federal and state governments that we get back in federal and state aid, 3) unfunded state mandates, 4) too many governments, and 5) lack of growth.

    It’s hard to argue with the realities Suozzi laid out. While we often squabble about our local land usage, the reality is that our costs are unsustainable. Further – we are getting diminishing return on our sky-high costs of living. Our infrastructure is still crumbling and inadequate, and our water quality is still being degraded.

    One possible solution, according to Suozzi, lies in his “cool downtowns” approach, building off  of the clusters, corridors and centers theory that has been mentioned for Long Island — and much of the nation — since the 1960s and early 70s. Suozzi writes:
    We have a few cool downtowns now but not enough. Rockville Centre, Garden City, Westbury and Great Neck have downtown rentals, offices, restaurants and shops that are all near train stations. Long Island residents flock to these parts for entertaining and relaxation. Mineola, Farmingdale, Glen Cove, Hempstead, Freeport and Long Beach are trying to create cool downtowns but to be successful, we need more of them. We need to create at least 20 cool downtowns so it will make sense to link them by bus and mass transit. 

    The planning theory behind Suozzi’s solution makes some sense, given the existence of numerous village-like nodes through the county. In Nassau, his vision for cool downtowns works easier than it does in neighboring Suffolk, mainly because of their limitations in infrastructure and generally later development. Further, economic and housing realities must be addressed.

    Simply put, Nassau is where the infrastructure is more conducive to mini-downtown intensification. However, what Suffolk lacks in infrastructure, it gains the advantage in sheer space. Suffolk’s developmental destiny isn’t fully charted yet as it is in Nassau. This means two things: it’s not too late to execute sound land use planning, and that we still have the opportunity to take action to reverse our fortunes, which would resonate across Route 110 into Nassau as well.

    It is important to realize that Suozzi’s downtown solution in of itself should not be an excuse to merely increase density on Long Island for the sake of increasing density. There will always be pressure from developers to densify well beyond local wishes, and seek subsidies to do so. These “cool downtowns” must mesh with comprehensive and regional strategies for attracting jobs to these targeted areas that take advantage of Long Island’s educated workforce.

    Also we should look at the quality of the density. Urban-like density alone does not create the atmosphere of a village; anyone who has spent time in the dense suburbs of cities like Seoul or even Los Angeles can tell you that. Tall structures and related commercial developments tend to be inhabited by generic stores with little resonance with the history and culture of their communities. Village systems work best when they develop organically, and grow, as much as possible, within the confines of already existing architecture or in new buildings that fit with local styles.

    Form also matters. There is a difference between the “little” downtown areas of Long Island that have charm, which is in a direct contrast to dense, almost urban centers. In our pursuit for suburban renewal, we cannot lose sight of what makes Long Island special, it terroir, if you will, of small communities that in many cases have been in existence for well over a century. Long Island may be expensive by national standards, but the staggering price increases in New York City for similarly appointed residential units, makes the Island comparatively affordable, and with excellent access to the city.

    While New York City has a variety of urban centers, Long Island’s approach to suburban revitalization should build off of Suozzi’s cool downtowns, but in a suburban manner. Part of the Island’s charm isn’t so much its Queens-like centers, but rather, villages such as Rockville Centre, Babylon and Patchogue – low slung, vibrant areas with good access to transit and the infrastructure needed to support their growth. By just blindly throwing density at Long Island’s regional issues, we are at risk of creating urban problems in a suburban environment.

    Long Island has other assets, particularly in terms of better schools. Many people who live in the city in their twenties and early thirties tend to look towards areas with good public schools, ample parks, and high levels of public safety. This is already leading to the much discussed growth of “hipsturbia” in the Hudson Valley river towns. Long Island could be a strong competitor for these people if it understands its’ primary appeal. 

    Finally for “cool downtowns” to work you must address the fundamental economic and demographic challenges facing the region. Although it can’t hope to compete head-to-heard with Manhattan for some very high end jobs, the area should be attractive to a lot of back office and specialized companies. If employment opportunities expand, then you might be able to more easily persuade younger workers to move to the Island, creating a consumer market for cool downtowns. Being “hip” isn’t enough, but getting more competitive and richer might work.

    Richard Murdocco writes regularly on land use, planning and development issues for various publications. He has his BA in both Political Science and Urban Studies from Fordham University, and his MA in Public Policy from Stony Brook University, and studied planning under Dr. Lee Koppelman, Long Island’s veteran planner. You can follow Murdocco on Twitter @TheFoggiestIdea, Like The Foggiest Idea on Facebook, and read his collection of work on urban planning at TheFoggiestIdea.org.

    "19 Main St Roslyn jeh" by Jim.henderson – Own work. Licensed under Creative Commons Zero, Public Domain Dedication via Wikimedia Commons

  • Urbanist Goals Will Mean Fewer Children, more Seniors Needing Government Help

    America’s cognitive elites and many media pundits believe high-density development will dominate the country’s future.

    That could be so, but, if it is the case, also expect far fewer Americans — and far more rapid aging of the population.

    This is a pattern seen throughout the world. In every major metropolitan area in the high-income world for which we found data — Tokyo, Seoul, London, Paris, Toronto, New York, Los Angeles, and the San Francisco Bay area — inner-core total fertility rates are much lower than those in outer areas.

    For example, inner London, notes demographer Wendell Cox, has a fertility rate of 1.6 children per female, which is well below the replacement rate of 2.1.

    The total fertility rate is the average number of children born to women between 15 and 44 years old. In the outer reaches of London, this rate hits 2.0, one-fourth higher.

    In Sydney, Australia, where increasing population density is a sworn goal of planners, the inner city now has a fertility rate of 0.76, compared to 2.0 or more in the outer suburbs.

    Nowhere is the confluence of high density and high prices more evident than East Asia. This region is now home to some of the lowest fertility rates on Earth.

    Take Seoul, South Korea, a paragon of high-density development where high-rise buildings dominate even on the periphery.

    Seoul’s fertility rate is about 1.2, similar to rates found in Tokyo, Singapore and Hong Kong. This is the kind of place urban planners often cite as a role model.

    A recent glowing report in Smithsonian Magazine heralded Seoul as “the city of the future.” Architects, naturally, join the chorus. In 2010, the International Council of Societies of Industrial Design named Seoul the “world design capital.”

    Yet the real frontier of ultra-low fertility may now be coastal China. Both Shanghai and Beijing have fertility rates of roughly 0.7, almost one-third of the replacement rate. Overall, China’s cities have a fertility rate under 0.9.

    Gavin Jones, a leading demographer of Asia, suggests that despite recent easing of China’s one-child policy, the world’s second leading economic power is experiencing a dramatic slowdown in its birthrate.

    In places such as Taiwan, Hong Kong, Tokyo and Singapore, more than one-quarter of women will never marry and even more will never have children.

    The result, Jones suggests, will be a society made up increasingly of single people, one-child families and very old people.

    In less than four decades, according to United Nations projections, Japan will have more people over 80 than under 15.

    This may present more of a challenge to Japan in the future, one professor suggests, than the rise of China. Indeed, over time, notes Jones, the same process will be seen across East Asia, as well as parts of Europe, as the anti-marriage and post-familial trends accelerate.

    “This won’t get better in the future,” he suggests. “The decline is just starting and it’s expanding to other areas, and the process seems inexorable.”

    For now, America, with a fertility rate of 1.89, stands in somewhat less distress, but that could be changed by increasing urban density — the very policy widely adopted by pundits and planners and broadly endorsed by urban developers.

    As Cox has shown, localities with higher densities and higher prices — the two are often coincident — have considerably lower birth rates than areas with lower prices.

    This becomes even more evident when one considers the segment of the population between 5 and 14 years old, when children enter school.

    In 2012, urban areas with the highest percentage of children are predominately lower density and lower cost, including Houston, Dallas-Fort Worth, Riverside-San Bernardino, Atlanta, and Phoenix.

    Urban areas with the lowest percentage of people in these age groups were also the New Urbanist exemplars, such as Boston, San Francisco, New York, and Seattle.

    The geographical nature of low fertility becomes even more clear in maps developed by demographer Ali Modarres.

    These maps show the percentage of households without children present. In regions such as New York, San Francisco, Seattle, D.C. and Chicago, the message is clear: much lower fertility rates in the denser urban cores.

    Maps Source: Demographer Ali Modarres, chair of urban studies at the University of Washington at Tacoma, using data from U.S. Census American Community Survey 2010

    In virtually every case, family size expands the closer one gets to the periphery; in contrast, some of the inner rings show fertility rates that approximate those seen in the hyper-dense Asian regions.

    What this suggests is that a continued focus on forcing Americans to abandon their suburban lifestyles will have a profound impact on the nation’s future competitiveness.

    An aging America will lose much of its current advantage in terms of vitality of our markets and labor force, and will be forced, like many East Asian and European countries, to invest ever more resources to take care of an aging population.

    Yet don’t expect this to affect the planners, environmentalists and their allies in real estate development, who hope to harvest windfall profits by urging and even forcing people to embrace high-density living.

    Their gain will not be to America’s advantage and will consign future generations to persistent slow growth, greater debt and a kind of societal malaise as the family fades in the face of ever greater emphasis on individualism.

    At the same time, an expanded state will be needed to keep the old folks alive in the absence of traditional networks of children and relatives.

    This piece originally appeared at The Washington Examiner.

    Joel Kotkin is executive editor of NewGeography.com and Distinguished Presidential Fellow in Urban Futures at Chapman University, and a member of the editorial board of the Orange County Register. His newest book, The New Class Conflict is now available for pre-order at Amazon and Telos Press. He is author of The City: A Global History and The Next Hundred Million: America in 2050. His most recent study, The Rise of Postfamilialism, has been widely discussed and distributed internationally. He lives in Los Angeles, CA.

    Crossing the street photo by Bigstock.

  • Beyond Polycentricity: 2000s Job Growth (Continues to) Follow Population

    The United States lost jobs between 2000 and 2010, the first loss between census years that has been recorded in the nation’s history. The decline was attributable to two economic shocks, the contraction following the 9/11 attacks and the Great Recession, the worst financial crisis since the Great Depression. Yet, even in this moribund job market, employment continued to disperse in the nation’s major metropolitan areas.

    This is the conclusion of a small area analysis (zip code tabulation areas) of data from County Business Patterns, from the Census Bureau, which captures nearly all private sector employment and between 85 and 90 percent of all employment (Note 1). 

    The small area analysis avoids the exaggeration of urban core data that necessarily occurs from reliance on the municipal boundaries of core cities (which are themselves nearly 60 percent suburban or exurban, ranging from as little as three percent to virtually 100 percent). This "City Sector Model" small area analysis method is described in greater detail in Note 2.

    Distribution of Employment in Major Metropolitan Areas

    County Business Pattern data indicates that employment dropped approximately 1,070,000 in the 52 major metropolitan areas (those with more than 1,000,000 population) between 2000 and 2010. The inner city sectors (the functional urban cores and earlier suburbs) were hard-hit. Together the inner sectors, the functional urban cores and the earlier suburbs, lost 3.74 million jobs. The outer sectors, the later suburbs and the exurbs, gained 2.67 million jobs (Figure 1).

    There were job losses of more than 300,000 in the functional urban cores, and even larger losses (3.2 million) in the earlier suburbs. The functional urban cores are defined by the higher population densities that predominated before 1940 and a much higher dependence on transit, walking and cycling for work trips. The earlier suburbs have median house construction dates before 1980.

    The share of major metropolitan area employment in the functional urban cores dropped from 16.4 percent in 2000 to 16.2 percent in 2010. This compares to the 8 percent of major metropolitan employment that is downtown (central business district) areas. The notion, however, that metropolitan areas are dominated by their downtowns is challenged by the fact that 84 percent of jobs are outside the functional urban cores.

    The largest percentage of major metropolitan areas is clustered in the earlier suburbs, those with median house construction dates from 1946 to 1979. In 2010, 46.8 percent of the jobs were in the earlier suburbs, a decline from 51.4 percent in 2000.

    These losses in employment shares in the two inner city sectors were balanced somewhat by increases in the outer sectors, the later suburbs (with median house construction dates of 1980 or later) and the exurbs, which are generally outside built-up urban areas. The increase was strongest in the later suburbs, where, where employment increased by 2.6 million. The share of employment in the later suburbs rose to 25.5 percent from 21.6 percent. There was also a 600,000 increase in exurban employment. The exurban share of employment rose to 11.5 percent from 10.6 percent (Figure 2).

    The Balance of Residents and Jobs

    There is a surprisingly strong balance between population and employment within the city sectors, which belies the popular perception by some press outlets and even some urban experts that as people who farther away from the urban core, they have to commute farther. In fact, 92 percent of employees do not commute to downtown, and as distances increase, the share of employees traveling to work downtown falls off substantially. As an example, only three percent of working residents in suburban Hunterdon County, New Jersey (in the New York metropolitan area), work in the central business district, Manhattan, while 80 percent work in relatively nearby areas of the outer combined metropolitan area.

    It is to be expected that the functional urban core would have a larger share of employment than population. However the difference is not great, with 16.2 percent of employment in the functional urban core and 14.4 percent of the population. The earlier suburbs have by far the largest share of the population at 42.0 percent. They also have the largest share of employment, at 46.8 percent. The later suburbs have 26.8 percent of the population, slightly more than their 25.5 percent employment share. The largest difference is, as would be expected, is in the exurbs, with 16.8 percent of major metropolitan area residents and 11.5 percent of employment (Figure 3). It is notable, however, that the difference between the share of population and employment varies less than 15 percent in the three built-up urban area sectors (urban core, earlier suburbs and later suburbs), though the difference was greater in the exurbs.

    How Employment Followed Population in the 2000s

    The outward shifts of population and employment are between in the city sectors. In the earlier suburbs, where the population and employment is the greatest, the population share declined 4.3 percentage points, while the employment share declined a near lockstep 4.6 percentage points. The later suburbs had a 4.5 percentage point increase in population share, followed closely a near lockstep 3.9 percentage point increase in employment share. In the exurbs, a 1.5 percentage point increase in the population share was accompanied by a 0.9 percentage point increase in the employment share. The connection is less clear in the functional urban core, where a 1.6 percentage point drop in the population share was associated with a 0.2 percentage point reduction in the employment share (Figure 4).

    The similarity in population and employment shares between the city sectors is an indication that employment growth has been geographically tracking population growth for decades, as cities have evolved from moncentricity to polycentricity and beyond.

    "Job Following" by Relative Urban Core Size

    Similar results are obtained when cities are categorized by the population of their urban cores relative to the total city population. Each category indicates an outward shift from the functional urban cores and earlier suburbs to the later suburbs and exurbs, in both the population share and the employment share. However, the shift is less pronounced in the cities with larger relative urban cores, which tend to be in the older urban regions  (Figure 5). Out of the 18 cities with functional urban cores amounting to more than 10 percent of the metropolitan area, 16 are in the Northeast (including the Northeastern corridor cities of Washington and Baltimore) and the Midwest, where strong population growth ended long ago.

    As usual, New York is in a category by itself, New York, has a functional urban core with more than 50 percent of its population. New York experienced an outward shift of 1.1 percent in its population, and a 0.4 percent outward shift of its employment (the total shift in share, from the urban core and earlier suburbs to the later suburbs and exurbs, expressed in terms of percentage points).

    Generally speaking, the stronger the functional urban core, the less the movement of jobs and people from the center. The actual percentages of functional urban core population by city are shown in From Jurisdictional to Functional Analysis of Urban Cores and Suburbs (Figure 6).

    On average, there was a shift of nearly five percent from the inner sectors (functional urban cores and earlier suburbs) to the outer sectors (later suburbs and exurbs)

    Commute Times: Less Outside the Urban Cores

    The earlier suburbs are generally between the functional urban cores and the later suburbs geographically. As a result, jobs are particularly accessible to residents from all over the metropolitan area. A further consequence is that commute times are shortest (26.3 minutes) in the earlier suburbs, where approximately half of the people also live. Commute times are a bit higher in the later suburbs (27.7 minutes). The exurbs have the third longest commutes, at 29.2 minutes. Finally, commute times are longest in the functional urban cores (31.8 percent), both because traffic congestion is greater (to be expected, not least because of their higher densities), and more people take transit, which is slower (Figure 7).

    The dispersed, and well coordinated location of jobs and residences is one reason that United States metropolitan areas have shorter commute times and less traffic congestion than its international competitors in Europe, Australia, and Canada. All this is testimony to the effectiveness with which people and the businesses established to serve them have produced effective labor markets, which are the most affluent in the world, in which the transaction related impacts of work trip travel time are less than elsewhere.

    Beyond Polycentricity

    These are not new concepts, despite the continuing tendency to imagine the city as a monocentric organism where everyone works in downtown skyscrapers and lives in suburban dormitories. The lower density US city has not descended into the illusion of suburban gridlock that some planners have declared so stridently. Indeed, traffic congestion is considerably less intense in US cities than it is in the other parts of the high income world for which there is data.

    A quarter century ago, University of Southern California economists Peter Gordon and Harry Richardson said that "the co-location of firms and households at decentralized locations has reduced, not lengthened commuting times and distances. Decentralization reduces pressures on the CBD, relieves congestion and avoids ‘gridlock.’"  In 1996 they Los Angeles as "beyond polycentricity" Both of these observations fit well as a description of trends in the 2000s. Most US major metropolitan areas are now "beyond polycentricity," not just Los Angeles.

    Wendell Cox is principal of Demographia, an international public policy and demographics firm. He is co-author of the “Demographia International Housing Affordability Survey” and author of “Demographia World Urban Areas” and “War on the Dream: How Anti-Sprawl Policy Threatens the Quality of Life.” He was appointed to three terms on the Los Angeles County Transportation Commission, where he served with the leading city and county leadership as the only non-elected member. He was appointed to the Amtrak Reform Council to fill the unexpired term of Governor Christine Todd Whitman and has served as a visiting professor at the Conservatoire National des Arts et Metiers, a national university in Paris.

    ——

    Note 1: The Census Bureau describes "County Business Pattern" data as follows: "Statistics are available on business establishments at the U.S. level and by State, County, Metropolitan area, and ZIP code levels. Data for Puerto Rico and the Island Areas are available at the State and county equivalent levels. County Business Patterns (CBP) covers most NAICS industries excluding crop and animal production; rail transportation; National Postal Service; pension, health, welfare, and vacation funds; trusts, estates, and agency accounts; private households; and public administration. CBP also excludes most establishments reporting government employees.

    Note 2: The City Sector Model allows a more representative functional analysis of urban core, suburban and exurban areas, by the use of smaller areas, rather than municipal boundaries. The more than 30,000 zip code tabulation areas (ZCTA) of major metropolitan areas and the rest of the nation are categorized by functional characteristics, including urban form, density and travel behavior. There are four functional classifications, the urban core, earlier suburban areas, later suburban areas and exurban areas. The urban cores have higher densities, older housing and substantially greater reliance on transit, similar to the urban cores that preceded the great automobile oriented suburbanization that followed World War II. Exurban areas are beyond the built up urban areas. The suburban areas constitute the balance of the major metropolitan areas. Earlier suburbs include areas with a median house construction date before 1980. Later suburban areas have later median house construction dates.

    Urban cores are defined as areas (ZCTAs) that have high population densities (7,500 or more per square mile or 2,900 per square kilometer or more) and high transit, walking and cycling work trip market shares (20 percent or more). Urban cores also include non-exurban sectors with median house construction dates of 1945 or before. All of these areas are defined at the zip code tabulation area (ZCTA) level.

    —–

    Photo: Beyond Polycentric Houston (by author)

  • Boomers: Moving Further Out and Away

    There have been frequent press reports that baby boomers, those born between 1945 and 1964, are abandoning the suburbs and moving "back" to the urban cores (actually most suburban residents did not move from urban cores). Virtually without exception such stories are based on anecdotes, often gathered by reporters stationed in Manhattan, downtown San Francisco or Washington or elsewhere in urban cores around the nation. Clearly, the anecdotes about boomers who move to suburbs, exurbs, or to outside major metropolitan areas are not readily accessible (and perhaps not as interesting) to the downtown media.

    Yet there is a wide gulf between the perceived reality of the media stories and what is actually occurring on the ground, as is indicated by comprehensive sources. The latest available small area data shows that baby boomers continue to leave the urban cores in large numbers. They have also left the earlier suburbs in such large numbers that their population gains in the later suburbs and exurbs have been insufficient to stem boomer movement out of the major metropolitan areas to smaller cities and rural areas.

    These conclusions are drawn from an analysis of population at the zip code tabulation area (ZCTA) among those 35 to 54 years of age in 2000 and the same cohort in 2010 (then 45 to 64 years of age). This small area analysis avoids the exaggeration of urban core data that necessarily occurs from reliance on the municipal boundaries of core cities (which are themselves nearly 60 percent suburban or exurban, ranging from as little as three percent to virtually 100 percent). This is described in further detail in the "City Sector Model" note below.

    Overall Trend

    The national population of the baby boomer generation declined 1.82 million between 2000 and 2010, a 2.2 percent loss (the result of an inevitably increasing death rate from the aging of cohorts). A small increase of 350,000 (1.0 percent) outside the largest cities was more than offset by a 2.17 million loss in the major metropolitan areas (over 1 million population), where the decline was of 4.7 percent.

    Boomers and the Urban Core

    The largest percentage loss occurred in the functional urban cores, which experienced a decline of 1.15 million baby boomers, a reduction of 16.7 percent. The functional urban cores are defined by the higher population densities that predominated before 1940 and a much higher dependence on transit, walking and cycling for work trips (further details are provided in the "City Sector Model" note below). In 2000, baby boomers accounted for 14.9 percent of the major metropolitan area population, a figure that declined to 13.0 percent by 2010 (Figure 1).

    The losses were pervasive. Among the 24 major metropolitan areas with functional urban core populations above 100,000, all experienced reductions in their baby boomer population shares. The average share reduction was approximately 12 percent.

    Not surprisingly, the leading urban core magnets of New York and San Francisco did the best, losing 4.3 percent and 5.8 percent of their boomer population share between 2000 and 2010. Providence, Los Angeles,and Boston rounded out the best five.

    Among the 24 metropolitan areas with the largest functional urban cores, Detroit experienced the largest proportional boomer loss, at 21.2 percent. Kansas City, Washington, and Minneapolis-St. Paul lost from 17 percent to 19 percent, proportionally, of their boomer urban core populations. Despite its reputation for core renewal, Portland experienced an approximate 15 percent proportional loss of its urban core boomers, along with Milwaukee and Cleveland (Figure 2).

    Boomers and the Earlier Suburbs

    The reduction in baby boomer population was even greater in the earlier suburban areas (those with median house construction dates of 1979 or before). The 2.33 million earlier suburban population loss was double that of the functional urban core loss, but because of this population is much larger than the functional cores, the overall drop was a smaller 11.1 percent. Nonetheless, the earlier suburbs continue to house the largest share of major metropolitan boomers. This fell, however, from 45.3 percent in 2000 to 42.2 percent in 2010.

    Combined, the urban cores and earlier suburbs lost 3.48 million boomers between 2000 and 2010.

    Boomers and the Later Suburbs and Exurbs

    In contrast, the later suburban areas (median house construction date 1980 or later) added approximately 750,000 baby boomers, for an increase of 6.8 percent. The later suburbs also experienced an increase in their share of major metropolitan boomers, rising from 24.0 percent in 2000 to 26.9 percent in 2010.

    The exurban gain was greater than the later suburbs in percentage terms (7.7 percent) but less in population gain (560,000). This was enough to increase the exurban share of boomers from 15.8 percent in 2000 to 17.9 percent in 2010. Indeed, the exurban areas of the 24 major metropolitan areas with urban cores over 100,000 population all did better in attracting or retaining boomer populations than both the urban cores and the earlier suburbs.

    Overall there was a 5.0 percentage point transfer of boomer share from the functional urban cores and earlier suburbs to the later suburbs and exurbs, reflecting their more than 1.3 million gain between 2000 and 2010.

    Boomers and the Nation

    Moreover, the data indicates that boomers are leaving the major metropolitan areas to move to smaller cities or even to rural areas. In contrast with the 2.17 million major metropolitan area loss, areas outside the major metropolitan areas added 350,000 boomers between 2000 and 2010. In 2000, smaller cities and rural areas housed 44.4 percent of the boomer population. By 2010, the smaller city and rural share had risen to 45.8 percent (Figure 3). By contrast, over the same period, the major metropolitan areas increased their proportion of the US population, from 54.5 percent in 2000 to 54.9 percent in 2010.

    America’s downtowns (generally a smaller area than the larger urban cores), have done much better in recent years, as they have become safer and as a "100 year flood" of economic retrenchment has reduced many to renting rather than buying. Yet, overall, urban cores have done less well, with Census Bureau data showing that the population gains within two miles of largest municipality city halls being more than offset by losses in the two to five mile radius between 2000 and 2010. These loses are not limited to the overall population, but extend to share losses among Millennials and population losses among the boomers.

    Wendell Cox is principal of Demographia, an international public policy and demographics firm. He is co-author of the "Demographia International Housing Affordability Survey" and author of "Demographia World Urban Areas" and "War on the Dream: How Anti-Sprawl Policy Threatens the Quality of Life." He was appointed to three terms on the Los Angeles County Transportation Commission, where he served with the leading city and county leadership as the only non-elected member. He was appointed to the Amtrak Reform Council to fill the unexpired term of Governor Christine Todd Whitman and has served as a visiting professor at the Conservatoire National des Arts et Metiers, a national university in Paris.

    ———–

    City Sector Model Note: The City Sector Model allows a more representative functional analysis of urban core, suburban and exurban areas, by the use of smaller areas, rather than municipal boundaries. The more than 30,000 zip code tabulation areas (ZCTA) of major metropolitan areas and the rest of the nation are categorized by functional characteristics, including urban form, density and travel behavior. There are four functional classifications, the urban core, earlier suburban areas, later suburban areas and exurban areas. The urban cores have higher densities, older housing and substantially greater reliance on transit, similar to the urban cores that preceded the great automobile oriented suburbanization that followed World War II. Exurban areas are beyond the built up urban areas. The suburban areas constitute the balance of the major metropolitan areas. Earlier suburbs include areas with a median house construction date before 1980. Later suburban areas have later median house construction dates.

    Urban cores are defined as areas (ZCTAs) that have high population densities (7,500 or more per square mile or 2,900 per square kilometer or more) and high transit, walking and cycling work trip market shares (20 percent or more). Urban cores also include non-exurban sectors with median house construction dates of 1945 or before. All of these areas are defined at the zip code tabulation area (ZCTA) level.

  • What College Gowns Bring to Towns

    The college town, one of America’s most appealing and unique features, grew out of the Age of Reason, and the concept of a regional, liberal-arts college nurtured by a small town has been intertwined with American history. Today, with enrollment dropping, the small, private college seems to be going the same way as the typewriter, the newspaper and the independent bookstore. While some colleges struggle to survive, the institution of the college town lives in suspended animation, ready to support whatever form its major employer may take. One thing’s for sure: the reinvention of the post-college town is coming.

    Here in Central Florida, the tradition of a liberal-arts college entwined with a small or medium-sized municipality is alive and well, for the moment. But trouble is brewing. While private institutions in Central Florida may not advertise their funding problems, the truth is plain to see. Rapid expansion of athletic programs, sure-fire profit centers for most schools, is underway at Rollins College, Stetson, and University of Tampa, and all are exploring other ways to reach more students, as well.

    Florida’s public universities are not immune to budget problems, either. And their response to the financial crisis says much about the future of college towns everywhere.

    Reinvention of the liberal arts college itself has been a cottage industry for the last several years. Student body diversification into “lifelong learning” (read: the lucrative retiree demographic), extensions, outreach campuses, and summer programs for primary and secondary schools has surged, as colleges try to open new markets. Bloated administrative costs have given rise to urgent fundraising and athletic programs, while an army of poorly paid adjunct professors shoulder an increasing burden of responsibility for the actual work of teaching. But, as Moody’s analyst Susan Fitzgerald has said about small, tuition-dependent colleges, they are in “a death spiral – this continuing downward momentum for some institutions [means] we’ll see more closures than in the past.”

    The Economist magazine has compared colleges to newspapers. If their analogy were to hold true, of the 4,700 colleges and universities in the world, “more than 700 institutions would shut their doors.” Citing the rise of massive, open, online courses or MOOCS, the magazine suggested that the idea of a professor interacting face-to-face with students will become a luxury. Colleges seem destined to end up in the same tiresome boat as the rest of the digital world, where everything, ultimately, becomes a product on Amazon.

    Uncertainty about the future has hastened the liberal arts school’s demise. In the darkest days of the recession we were told there was a STEM crisis: science, technology, engineering and mathematics were the fields that would get you a job. People ditched their liberal arts pursuits for more practical, employable ones, swearing off the indulgent frivolity of a philosophy course for a computer programming class. Panicking parents and students stampeded out of the gothic halls of the English department as fast as they could.

    Here in Florida, to pay for a new state campus in Lakeland, the Governor gutted the operational budget of Florida’s 11 other institutions of higher education. The new campus, located on rural land adjacent to Interstate 4, is far from any sort of population center. It’s a soulless commuter school; any form of a college town to accompany it lies far, far in the future.

    USF Polytechnic is being billed as a “destination campus”. Its showy new structure nearly complete, it lies naked to the Florida scrub and Interstate 4, with a few lonely stucco buildings and portable classrooms marking a kind of desperate, treeless sense of place in the hot Florida sun. No flip-flop-shod students strumming guitars, debating the meaning of Proust or the relevance of Marx will ever be found under its oak trees or in front of its bohemian coffee shops, because there aren’t any. Instead, there’s a harsh, asphalt parking lot and a long, hot trudge to the endpoint, another signal that one’s college years are just like a shopping trip to Wal-mart.

    If the one-in-seven death rate holds true, then one of the seven college towns in Central Florida will not have a future either. Gainesville, DeLand, Winter Park, St. Augustine, Tampa, Lakeland, and St. Petersburg are seven places with streets, residences, and businesses that each have grown up around colleges, public and private, and that enjoy a thriving sidewalk life.

    Ironically, at least two of these colleges were born in another desperate time, the Great Depression. The University of Tampa, across the Hillsborough River from downtown Tampa, started in a failed hotel when the city took it over from owner Henry Plant’s railroad empire. Likewise, Flagler College in St. Augustine began in a resort hotel built by New York railroad magnate Henry Flagler. The small, private, liberal-arts college was a perfect solution. A grand old structure was re-inhabited, and a struggling city was bolstered.

    Towns that grew up around these places have different, more informal qualities than other towns. In Gainesville, for example, churches, temples, student centers, and other non-profit institutions occupy prominent positions within the urban core. There’s a diversity of old houses with garage apartments, lean-tos, and enclosed porches. Wood apartment buildings have side stairs, outdoor beer kegs, and bicycle racks. They sit under huge, mature trees, clad in subtropical philodendron vines, and are connected by narrow dirt pathways carved independent of sidewalks. A sense of grown-over-time pervades within and around campus, its boundaries softened by sneaker and bicycle traffic, concert posters and poetry reading notices.

    Gainesville, with nearly fifty thousand students, will probably survive, but other, smaller towns may struggle. As conversion to digital learning reduces costs, the college town may disappear. Anonymous reviews, posted online, replace conversations in bookstores. University Avenue may be deleted, just like yesterday’s term paper.

    Our bookshelves are crowded with titles about the urban future, but in all of this furious scribbling it seems no one has noticed that sidewalks have all but emptied out in many of our cities. Chicago, New York, San Francisco, and a few more still march to the pedestrian beat. But a fairly thorough survey of peninsular Florida yields few sidewalks with any kind of street life — and the few that still operate as shared, social space all belong to our college towns.

    Students, with one foot in childhood and one in adulthood, still walk on sidewalks. They shop online, too, but they still patronize businesses for the sake of the social interaction, and still have use for the physicality of the street… for a street life that seems to be endangered.

    College towns, living on today in a shadow of their former bohemian selves, will be reinvented, just as education systems will. But for now, deprived of street life, we breed a different sort of citizen and thinker than an old college town once did. This new digital citizen will construct social space in ways yet to be foreseen.

    Richard Reep is an architect with VOA Associates, Inc. who has designed award-winning urban mixed-use and hospitality projects. His work has been featured domestically and internationally for the last thirty years. An Adjunct Professor for the Environmental and Growth Studies Department at Rollins College, he teaches urban design and sustainable development; he is also president of the Orlando Foundation for Architecture. Reep resides in Winter Park, Florida with his family.

    Photo of downtown Gainesville by the author. This scene is typical of the streets surrounding the campus of the University of Florida.