Category: Suburbs

  • Millennial Boomtowns: Where The Generation Is Clustering (It’s Not Downtown)

    Much has been written about the supposed preference of millennials to live in hip urban settings where cars are not necessary. Surveys of best cities for millennials invariably feature places like New York, San Francisco, Chicago and Boston, cities that often are also favorites of the authors.

    Yet there has been precious little support for such assertions. I asked demographer Wendell Cox to do a precise, up-to-date analysis of where this huge generation born between 1983 and 2003 actually resides. Using Census American Community Survey data, Cox has drawn an intriguing picture of millennial America, one that is often at odds with the conventional wisdom of many of their elders.

    The Hidden Millennials

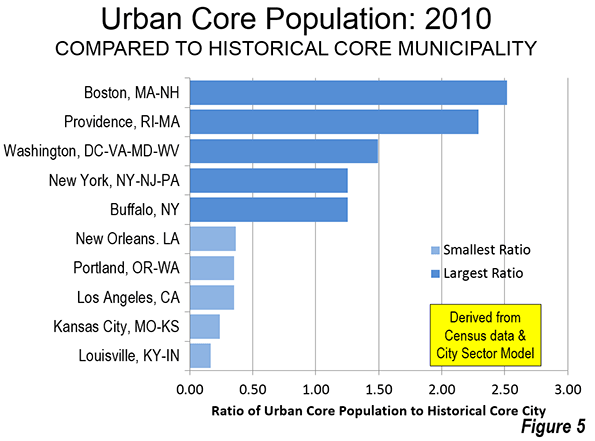
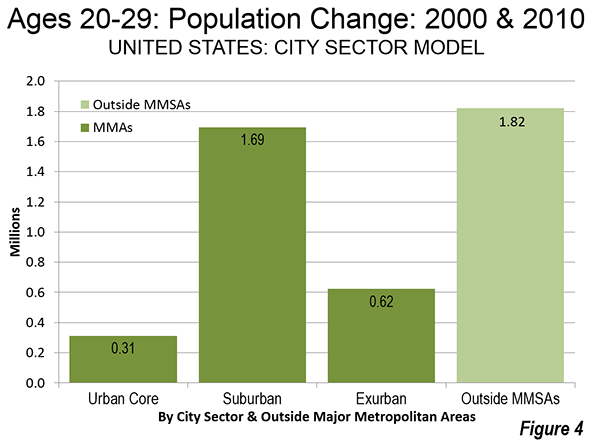
    We focused on individuals aged 20 to 29, which represents most of the millennial generation that is finishing post-secondary education and getting established in the workforce. Much of the writing about millennials focuses on their impact on downtowns and urban cores. And to be sure, the numbers of millennials living in urban cores has grown, as downtowns and inner-city neighborhoods have gentrified, particularly in cities such as Boston, Seattle, San Francisco, New York and Chicago. Overall, from 2010 to 2013, the population of 20- to 29-year-olds in core counties (which in most cases are identical to the core city of the metropolitan area) rose by 407,400, or 3.2%.

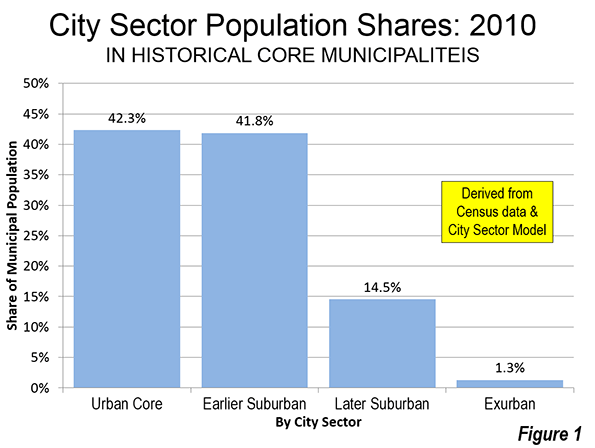
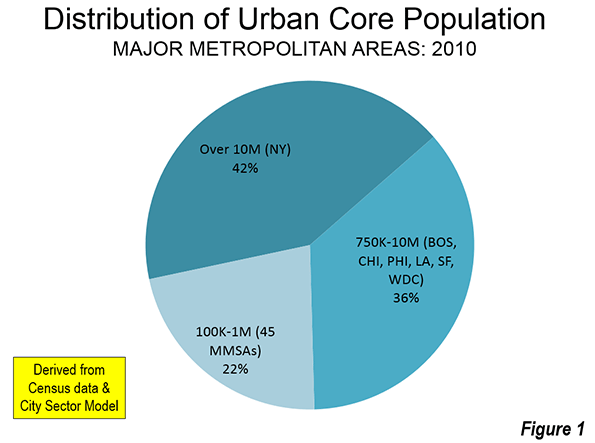
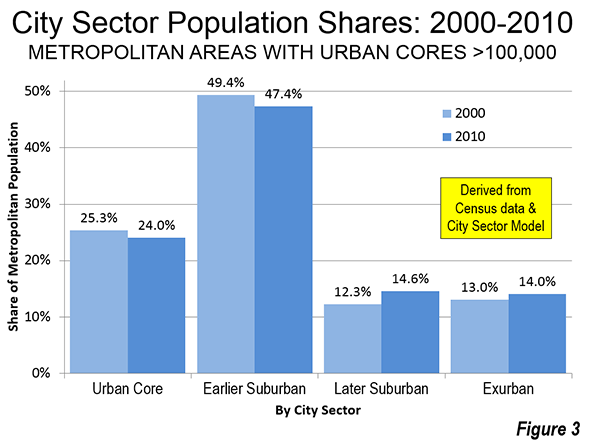
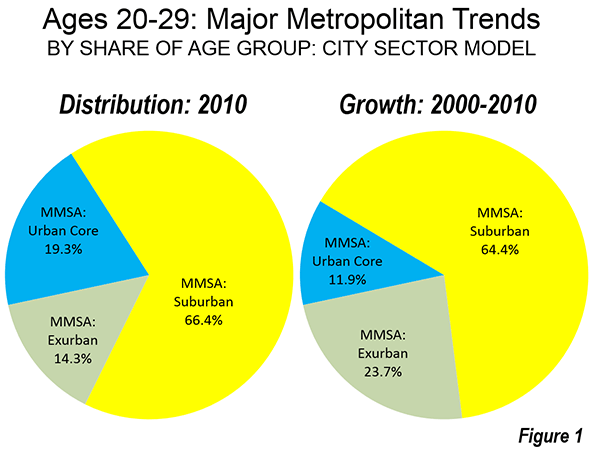
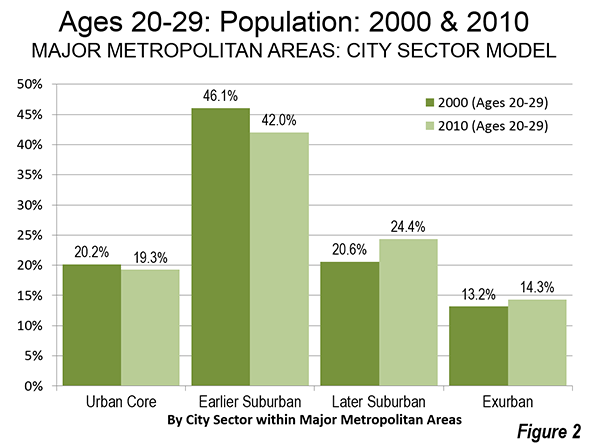
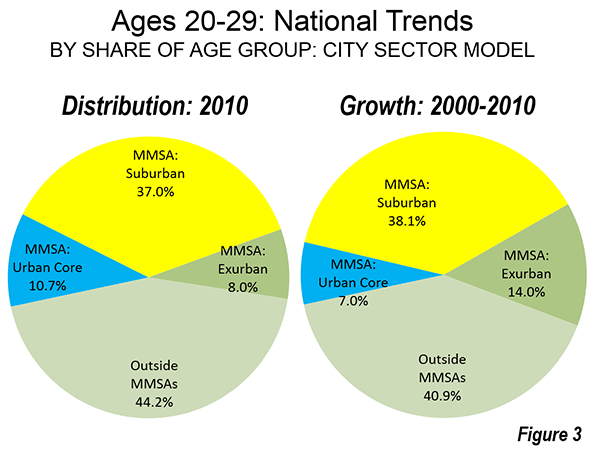
    However, that must be put in the context of the overall increase nationwide of that age group in that time span: 4%. Despite the growth in raw numbers of 20- to 29-year-olds living in core counties, the share of the age group living in these areas actually declined slightly, by 0.78%, compared to 2010. Meanwhile, the share of the age group living in the less dense portions of metropolitan and micropolitan statistical areas  increased. Overall roughly 30% of all millennials live in core counties, which means 70% live somewhere else. In the last three years, the number of millennials outside core counties increased by 1.28 million. In 2010, the functional urban cores, characterized by higher density and higher reliance on transit, were home to 19% of the 20-29s in major metropolitan areas, down from 20% in 2000.

    In contrast to the constantly reported on urban hipsters, the vast majority of this generation, who get precious little attention from the media or marketing gurus, might be best described as “hidden millennials.” We have to assume some of these young people are still living, primarily in suburbia, with their parents; a recent Pew study put the percentage of people 18 to 31 living at home at 36%, up from 32% before the recession, as well as the 34% level registered in 2009.

    This constitutes a population of over 20 million and not all are hopeless slackers — the vast majority have at least some college education. But they are also disproportionately unemployed or out of the workforce, and, living in their parents’ homes, they are pretty much ignored by everyone except perhaps their friends and relatives. Other millennials may well be living in suburban apartments, which tend to be somewhat less expensive, and others, perhaps the oldest of the group, have begun to “launch” starting families and buying houses, which would tend to put them in the suburbs and smaller cities as well.

    Millennial Boomtowns

    Equally surprising are those cities that have seen the largest increases in their millennial population. It is dogma among greens, urban pundits, planners and developers that the under 30 crowd doesn’t like what Grist called “sprawling car dependent cities.” Too bad no one told most millennials. For the most part, looking at America’s largest metro areas (the 52 metropolitan statistical areas with populations over a million) the fastest growth in millennial populations tend to be in the Sun Belt and Intermountain West. Leading the way is, San Antonio, Texas, where the 20 to 29 population grew 9.2% from 2010-13, an increase of 28,600.

    Right behind it, also in the Sun Belt, are Riverside-San Bernardino, Calif. (8.3%); Orlando, Fla. (8.1%); and Miami (7.7%).

    Surprisingly Detroit, long considered a demographic basket case, comes in it at No. 5 in our study, with an impressive 6.8% increase. Given the implosion in the population in the city of Detroit, this growth is likely to have taken place almost entirely in the region’s suburbs, which have done far better both economically and demographically than the core.

    The Hipster Capitals Lag

    For the most part the “capitals of cool” allegedly so irresistible to millennials rank further down the list. The only two arguable hipster magnets to make the top ten were the Denver metro area (seventh) and  Seattle (ninth). The New York metro area ranks 39th with a 3.2% increase, lagging the national expansion in this age group of 4%. The San Francisco-Oakland region, despite the tech boom, places 37th, while the Portland area, renowned as a place where millennials supposedly “go to retire,” ranks 44th. The Chicago metro area’s 20-29 population was essentially unchanged, putting it 49th on our list.

    One reason may be that core urban areas are not experiencing the surge in millennials widely asserted. Indeed the millennial populations of the five core counties (or boroughs) of New York grew only 2%, half the national rate of increase and below that of the metro area as a whole.

    The same pattern can be seen in the cores of such attractive hipster magnets as San Francisco and Boston, both of which have seen negligible growth among millennials. It appears these areas always attract young people, but also lose them over time. Even more shocking, the 20-29 populations have actually declined since 2010 in the core areas of such much celebrated youth magnets as Chicago (-0.6%) and Portland(-2.5%). Besides Seattle and Denver, the only hip core city showing expanding appeal to millennials is the anomaly of resurgent New Orleans, where the ranks of 20-29 old has grown over 5% since 2010.

    The Future of Millennial America

    What emerges from this survey is a  picture of a millennial America that does not much mirror the one suggested in most media and pundit accounts. The metro areas with the highest percentages of millennials tend, for the most part, to be not dense big cities but either college towns — Austin, Texas; Columbus, Ohio, for example — or Sun Belt cities. Virginia Beach leads the pack, with 17% of its population aged 20 to 29, compared to 14% nationwide.

    But overall  the towns with the biggest share of millennials today are also those growing this population the fastest:  Southern or Intermountain West cities. One big contributing factor is their large Hispanic communities, which for the last three decades have had a far higher birthrate than whites. Latinos constitute 20% of all millennials. This may help explain the large presence of millennials in places like Orlando, Riverside-San Bernardino, and Los Angeles. Other factors may be places where there tend to be high numbers of children, such as Mormon-dominated Salt Lake City.

    What these results suggest is that marketers, homebuilders and politicians seeking to target the increasingly important millennial population need to look beyond urban cores. The vast majority of millennials do not live in dense inner city neighborhoods — in fact less than 12% of the nation’s 20-29s did in 2010. Rather than white hipsters, many millennials are working class and minority;  in 2012, Hispanics and African-Americans represented 34% of the 20-29 population. Presumably many of them are more concerned with making a living than looking out for “fair trade” coffee or urban authenticity.

    Like most of America, the millennials are far more suburban, more dispersed and less privileged than what one sees on shows such as “Girls” or read about in accounts in theNew York Times and the Wall Street Journal. Reality is often more complex, and less immediately compelling, than the preferred media narrative. But understanding the actual geography of this generation may provide a first step to gaining wisdom how to approach and understand this critically important generation.

    20-29 Population Change: Major Metropolitan Areas: 2010-2013
    Rank Major Metropolitan Area (MMSA) 2010 2013 Change
    1 San Antonio, TX         311        340 9.2%
    2 Riverside-San Bernardino, CA         605        655 8.3%
    3 Orlando, FL         322        348 8.1%
    4 Miami, FL         716        771 7.7%
    5 Detroit,  MI         506        541 6.8%
    6 Houston, TX         856        909 6.2%
    7 Denver, CO         357        378 6.0%
    8 Charlotte, NC-SC         288        304 5.8%
    9 Seattle, WA         499        528 5.7%
    10 Virginia Beach-Norfolk, VA-NC         274        290 5.6%
    11 Buffalo, NY         153        162 5.4%
    12 Jacksonville, FL         187        197 5.3%
    13 Grand Rapids, MI         141        148 5.2%
    14 Tampa-St. Petersburg, FL         341        359 5.1%
    15 Rochester, NY         146        153 4.8%
    16 Dallas-Fort Worth, TX         911        954 4.7%
    17 Raleigh, NC         154        161 4.7%
    18 Los Angeles, CA      1,941     2,032 4.7%
    19 Richmond, VA         167        174 4.6%
    20 Nashville, TN         242        253 4.6%
    21 Indianapolis. IN         253        264 4.5%
    22 Phoenix, AZ         592        618 4.3%
    23 Sacramento, CA         307        321 4.3%
    24 Cleveland, OH         242        252 4.3%
    25 Austin, TX         295        307 4.2%
    26 Boston, MA-NH         663        690 4.1%
    27 Memphis, TN-MS-AR         182        189 4.1%
    28 Oklahoma City, OK         195        203 4.0%
    29 Atlanta, GA         719        747 4.0%
    30 Hartford, CT         154        160 3.9%
    31 San Jose, CA         254        263 3.9%
    32 Pittsburgh, PA         293        305 3.8%
    33 Providence, RI-MA         217        224 3.6%
    34 San Diego, CA         521        540 3.5%
    35 Baltimore, MD         381        394 3.5%
    36 Washington, DC-VA-MD-WV         818        846 3.4%
    37 San Francisco-Oakland, CA         605        625 3.4%
    38 New Orleans. LA         176        181 3.3%
    39 New York, NY-NJ-PA      2,740     2,828 3.2%
    40 Columbus, OH         283        291 3.0%
    41 Louisville, KY-IN         159        164 3.0%
    42 Philadelphia, PA-NJ-DE-MD         823        848 3.0%
    43 Las Vegas, NV         277        285 2.9%
    44 Portland, OR-WA         306        311 1.8%
    45 Cincinnati, OH-KY-IN         280        285 1.7%
    46 Kansas City, MO-KS         263        267 1.3%
    47 St. Louis,, MO-IL         371        372 0.2%
    48 Chicago, IL-IN-WI      1,326     1,328 0.2%
    49 Minneapolis-St. Paul, MN-WI         470        471 0.2%
    50 Birmingham, AL         151        151 -0.4%
    51 Milwaukee,WI         216        215 -0.4%
    52 Salt Lake City, UT         178        177 -0.5%
    MMSAs    23,827   24,780 4.0%
    Outside MMSAs    18,862   19,595 3.9%
    United States    42,688   44,376 4.0%
    In thousands

    Analysis by Wendell Cox.

    This story originally appeared at Forbes.

    Joel Kotkin is executive editor of NewGeography.com and Distinguished Presidential Fellow in Urban Futures at Chapman University, and a member of the editorial board of the Orange County Register. He is author of The City: A Global History and The Next Hundred Million: America in 2050. His most recent study, The Rise of Postfamilialism, has been widely discussed and distributed internationally. He lives in Los Angeles, CA.

  • Urban Cores, Core Cities and Principal Cities

    Many American cities, described commonly as urban cores, are functionally more suburban and exurban, based on urban form, density, and travel behavior characteristics. Data from the 2010 census shows that 42.3 percent of the population of the historical core municipalities was functionally urban core (Figure 1). By comparison, 56.3 of the population lived in functional suburbs and another 1.3 percent in functionally exurban areas (generally outside the urban areas). Urban cores are defined as areas that have high population densities (7,500 or per square mile or 2,900 per square kilometer or more) and high transit, walking and cycling work trip market shares (20 percent or more). Urban cores also include non-exurban sectors with median house construction dates of 1945 or before. All of these areas are defined at the zip code tabulation area (ZCTA) level, rather than by municipal jurisdiction. This is described in further detail in the "City Sector Model" note below.

    The Varieties of Central Cities

    Of course the “urbaneness” of central cities vary greatly. Some, like New York, Boston, Chicago, and San Francisco experienced much of their growth before the 20th century, well before the great automobile oriented suburbanization that occurred after World War II. Others, that experienced early growth, such as Milwaukee and Seattle, annexed substantial areas of suburbanization after World War II, so that their comparatively large functional urban cores have been overwhelmed by suburbs within the city limits. Los Angeles, with a large functional urban core, annexed huge swaths of agricultural land that later became suburban. Finally, a number of other central cities, such as Phoenix and San Jose, have developed since World War II and are virtually all suburban,

    Moreover, central cities comprise very different proportions of their respective metropolitan areas (the functional or economic definition of "city"). For example, the central city of San Antonio comprises 62 percent of the San Antonio metropolitan area population. Conversely, the city of Atlanta comprises only 8 percent of the Atlanta metropolitan area population. Obviously, with such a large differential, the term central city describes jurisdictions that are radically different.

    This difference is caught by examining the functional urban cores by historical core municipality classifications. The Pre-World War II Core & Non-Suburban central cities have functional urban cores comprising 72 percent of their population. The Pre-World War II Core & Suburban central cities have functional urban cores that are only 14 percent of their populations. The Post-World War II Suburban central cities have very small urban cores, representing only 2 percent of their population (Figure 2).

    Among the 54 historical core municipalities, the share of central city population in the functional urban cores varies from a high of more than 97 percent (New York) to virtually zero (Birmingham, Charlotte, Dallas, Jacksonville, Orlando, Phoenix, Raleigh, San Bernardino, San Jose, and Tampa).

    Core Cities with the Strongest Urban Cores

    It is not surprising that the central cities with the largest share of their populations in the functional urban cores are in the older, established are concentrated in the Northeast Corridor (Washington to Boston) and the Midwest. Only one of the 14 central cities with the highest population share in functional urban cores is outside these areas is San Francisco, the first large city to be built on the American West Coast Among the 25 central cities with the highest functional urban core share, only seven are outside the Northeast Corridor or the Midwest (San Francisco, Oakland, Seattle, New Orleans, Portland, Los Angeles and Salt Lake City).

    It is not surprising that the city of New York has the largest function urban core population share, at 97.3 percent. Nearly one-third of the total urban core population in the 52 major metropolitan areas lives in the city of New York (nearly 8,000,000 residents).

    Two other central cities have functional urban core population percentages above 90 percent. Buffalo ranks second, at 94.5 percent. San Francisco is third at 94.0 percent.

    The next three highest ranking cities are in New England. Boston has an 89.7 percent functional urban core population, followed by Hartford (87.4 percent), and Providence (86.5 percent). These are all of the major metropolitan areas in New England.

    Three Midwestern central cities have more than 80 percent of their populations in functional urban cores, including St. Louis (84.1 percent), Minneapolis (83.5 percent), and Cleveland (80.1 percent). Washington (83.4 percent) and Philadelphia (83.4 percent), in the Northeast Corridor also have greater than 80 percent functional urban core shares.

    Pittsburgh (76.9 percent) and Chicago (76.6 percent) have functional urban core population shares between 70 percent and 80 percent. At 67.7 percent, Baltimore (67.7 percent) is the only central city in the Northeast Corridor that with less than 70 percent of its population in the functional urban core.

    Oakland (54.7 percent), at 15th, is the highest ranking central city outside the Northeast Corridor and the Midwest other than San Francisco. Cincinnati, Rochester, and Milwaukee also have more than 50 percent of their population in functional urban cores.

    The top 25 is rounded out by Seattle (37.5 percent), New Orleans (36.8 percent), St. Paul (36.7 percent), Portland (35.2 percent), Detroit (31.3 percent), Los Angeles (29.9 percent) and, somewhat unexpectedly, Salt Lake City (27.1 percent).

    The central cities with the largest functional urban core percentages have overwhelmingly suffered large population losses. Among the 25 with the largest urban core shares, only seven were at their peak populations at the 2010 census, and only two of the top 18 (New York and San Francisco). Overall the cities with large functional cores lost more than 35 percent of their population and 8 million residents.

    "Other" Principal Cities

    Starting in 2003, the Office of Management and Budget (OMB) retired the term "central city" and replaced it with "principal city," which includes the 54 former historical core municipalities and approximately 160 additional cities. The adoption of principal city terminology recognized as OMB described it, that metropolitan areas were no longer monocentric, but had become polycentric. OMB specifically rejected the use of geographical terms other than "principal city" within metropolitan areas, including "suburb." Indeed, the very employment of polycentricity that justified abandonment of the central city designation was the suburbanization of employment. Yet some popular usage (even in some Census Bureau documents), considers any area that is not a principal city as suburban. The more appropriate term would be "not principal city."

    Some principal cities that are not historical core municipalities ("other" principal cities) have strong urban cores, especially in metropolitan areas where the urban core stretches well beyond the core municipality’s city limits, especially in New York and Boston. Four such principal cities have urban cores larger than 100,000 and urban core population shares exceeding 90 percent, including Cambridge in the Boston area (97.0 percent, and the New York area’s Newark (94.7 percent) and Jersey City (100.0 percent), which is higher even than New York City itself. None of these cities was at its population peak in 2010.

    Even so the vast majority of the "other" principal cities are overwhelmingly suburban, comprising less of the functional urban core population than areas that are not principal cities (1.5 million compared to 4.1 million outside the principal cities). Overall, the other principal cities are 7.9 percent urban core (compared to 42.3 percent for the historical core municipalities). If the 11 municipalities with cores larger than 50,000 are excluded, the share living in functional urban cores for the remaining more than 150 cities is 1.5 percent. (Figure 4).

    Crude Measurement

    The perhaps stunning conclusion is that the average difference between the historical core municipality population and the functional urban core population is 73 percent. Core cities — themselves 57 percent suburban and exurban — are a crude basis for classifying urban cores and suburbs. Principal cities — 92 percent functionally suburban or exurban — are even worse. The bottom line: America is fundamentally more suburban in nature than commonly believed.

    —–

    City Sector Model Note: The City Sector Model allows a more representative functional analysis of urban core, suburban and exurban areas, by the use of smaller areas, rather than municipal boundaries. The nearly 9,000 zip code tabulation areas (ZCTA) of major metropolitan areas are categorized by functional characteristics, including urban form, density and travel behavior. There are four functional classifications, the urban core, earlier suburban areas, later suburban areas and exurban areas. The urban cores have higher densities, older housing and substantially greater reliance on transit, similar to the urban cores that preceded the great automobile oriented suburbanization that followed World War II. Exurban areas are beyond the built up urban areas. The suburban areas constitute the balance of the major metropolitan areas. Earlier suburbs include areas with a median house construction date before 1980. Later suburban areas have later median house construction dates.

    —–

    Wendell Cox is principal of Demographia, an international public policy and demographics firm. He is co-author of the "Demographia International Housing Affordability Survey" and author of "Demographia World Urban Areas" and "War on the Dream: How Anti-Sprawl Policy Threatens the Quality of Life." He was appointed to three terms on the Los Angeles County Transportation Commission, where he served with the leading city and county leadership as the only non-elected member. He was appointed to the Amtrak Reform Council to fill the unexpired term of Governor Christine Todd Whitman and has served as a visiting professor at the Conservatoire National des Arts et Metiers, a national university in Paris.

    Photo: Downtown Houston (by author)

  • Agrarianism Without Agriculture?

    The ever-surprising Ralph Nader has recently been reading some paleo-conservative sources, and has written a book entitled Unstoppable; the Emerging Left-Right Alliance to Dismantle the Corporate State. In the Acknowledgements at the end, he specifically thanks Intercollegiate Studies Institute, a conservative think tank, for keeping in print a tome from the 1930s called Who Owns America? A New Declaration of Independence. Nader devotes the seventh chapter of his book to a discussion of this volume. He quotes Edward Shapiro’s 1999 foreword at some length:

    In his 1999 foreword to the reissued edition, historian Edward S. Shapiro called Who Owns America? “one of the most significant conservative books published in the United States during the 1930s” for its “message of demographic, political, and economic decentralization and the widespread ownership of property” in opposition “to the growth of corporate farming, the decay of the small town, and the expansion of centralized political and economic authority.” ……

    In this mix, there was espoused a political economy for grass-roots America that neither Wall Street nor the socialists nor the New Dealers would find acceptable. It came largely out of the agrarian South, casting a baleful eye on both Wall Street and Washington, D. C. To these decentralists, the concentrated power of bigness would produce its plutocratic injustices whether regulated through the centralization of political authority in Washington or left to its own monopolistic and cyclical failures. They were quite aware of both the corporate state fast maturing in both Italy and Nazi Germany and the Marxists in the Soviet Union ……

    Nor did they believe that a federal government with sufficient political authority to modestly tame the plutocracy and what they called “monopoly capitalism” could work, because its struggle would end either in surrender or with the replacing of one set of autocrats with another. As Shapiro wrote in the foreward, “while the plutocrats wanted to shift control over property to themselves, the Marxists wanted to shift this control to government bureaucrats. Liberty would be sacrificed in either case. Only the restoration of the widespread ownership of property, Tate said, could ‘create a decent society in terms of American history.’”

    Although the decentralists were dismissed by their critics as impractical ….. their views have a remarkable contemporary resonance given today’s globalized gigantism, absentee control, and intricate corporate statism, which are undermining both economies and workers. They started with the effects of concentrated corporate power and its decades-long dispossession of farmers and small business. They rejected abstract theories by focusing instead on such intensifying trends as the separation of ownership from control; the real economy of production in contrast to the manipulative paper economy of finance; and the growth of “wage slavery,” farm tenancy, and corporate farming. One can only imagine what they would say today! (Nader, pp. 139-141.)

    I apologize for the long quote. These people advocated doing away with the “joint stock corporation” for the most part, to be replaced by cooperatives. I’m not sure about the liability of members of these cooperatives, but that’s a major issue. Without limited liability, I would hesitate to co-invest in any project unless all the partners were as liquid and wealthy as myself, otherwise guess who ends up holding the bag! And it is to be noted that many insurance companies, and some savings and loans, including, until the 1980s, all federally chartered ones, were in fact “mutual” and owned by their depositors or policy holders.

    They did not succeed as far as agricultural land was concerned. The concentration of agricultural land under fewer and fewer owners, and even more the oligopolies of processing food through such entities as Cargill, Tyson, and Archer Daniels Midland, proceeded apace. But “widely distributed property ownership” resurfaced on another front; the urban-suburban one. The New Deal first chartered the Federal Housing Administration to underwrite and guarantee loans for homes, and in Truman’s time the Veterans Administration and other reforms brought this regime into full flower. So instead of their forty acres and a mule, people got their ¼ acre and an automobile, the only practical way to travel from their ¼ acre to wherever they wanted to go.

    Eventually people came to see their ¼ acre with a house on it as an “investment,” and further, a “source of wealth.” But this was not a truly agrarian source of wealth. Farms depend for their value on the quality of their soil and their productivity as farms. They are truly commercial real estate. But residences depend for their value only to a minor degree on what is on the property itself, but rather on what is around it; and suburbanites demanded that covenants, or the Government in the form of City Hall or County Hall, control their neighbors and what is around them. Part of the reason for living in the suburbs, after all, is the presence of trees and green space. (The suburbanites have therefore been friendly to the environmental cause, as long as it did not touch their automobiles.) There was also the factor that just as printing money dilutes its value, “printing” a large number of houses in an area dilutes their value as well. And, the more development, the more traffic comes to resemble that of the centralized portion of the city and one’s automobile gets stuck in it. Fact: the borough of Irvine, where my office is, imposes a “cap and trade” system on those who would desire to build or repair commercial structures, and what one buys in this marketplace is not carbon or pollution, but potential car trips that one’s project might be potentially using. The suburban model, in the end, demanded that to preserve suburban values, that the building of suburbs be stopped! That’s the irony of the whole thing.

    Howard Ahmanson of Fieldstead and Company, a private management firm, has been interested in these issues for many years.

  • Don’t be so Dense About Housing

    Southern California faces a crisis of confidence. A region that once imagined itself as a new model of urbanity – what the early 20th century minister and writer Dana Bartlett called “the better city” – is increasingly being told that, to succeed, it must abandon its old model and become something more akin to dense Eastern cities, or to Portland or San Francisco.

    This has touched off a “density craze,” in which developers and regulators work overtime to create a future dramatically different from the region’s past. This kind of social engineering appeals to many pundits, planners and developers, but may scare the dickens out of many residents. They may also be concerned that the political class, rather than investing in improving our neighborhoods, seems determined to use our dollars to subsidize densification and support vanity projects, like a new Downtown Los Angeles football stadium. At same time, policymakers seek to all but ban suburban building, a misguided and extraordinarily costly extension of their climate-change agenda.

    This effort works against the region’s basic DNA. Our Downtown, for all its promotion, is not a dominant business or cultural center. It accounts for barely 1/10th the share of regional employment that Manhattan – at more than 20 percent – provides for its region and less than one-sixth the share of regional jobs accounted for by San Francisco, less than one-third that of much-maligned, spread-out Houston.

    Some people contend that, by investing heavily in mass transit, we can re-engineer our region towards a more-19th century model, which Los Angeles, as a 20th century city, never had. Some, like economics and political blogger Matt Yglesias, suggest Los Angeles’ $8 billion-plus investment in rail is making it the “the next great transit city.”

    Well, after 30 years of relentless spending on subways and light rail, the share of transit commuters in the region (comprising Los Angeles and Orange counties, the Inland Empire and Ventura County) is about where it was in 1980 – roughly 5 percent – compared with greater New York’s 27 percent or Chicago’s 11 percent.

    Village people

    Transit has limited effect in Southern California because this region functions best as a network of “villages,” some more urban than others, connected primarily by freeways and an enviable arterial street system. Inside our villages, we can find the human scale and comfort that can be so elusive in a megacity. This arrangement allows many Southern Californians to live in a quiet neighborhood that also is within one of the world’s most diverse – and important – cities.

    These villages span all the vast diversity of Southern California. Some areas, like Downtown Los Angeles, increasingly appeal to young professionals who seek a version of dense urban living. They share a universe with cohorts found in many older cities: young hipsters, a small sample of empty nesters and a sizable population of homeless who live on the edges of the gentrification zone.

    But Downtown hardly provides a template for the rest of the region. Mostly we live in lower-density villages, many of which – in the San Gabriel Valley, East Los Angeles, Santa Ana, Westminster and L.A.’s Leimart Park, for example – reflect largely ethnic cultures with deeply established roots.

    Even newer areas, like Irvine – which still ranks among America’s fastest-growing cities – are now majority Asian and Latino. Irvine’s appeal is largely the much- dissed suburban virtues of clean streets, good parks and excellent schools.

    Some areas are almost insanely eclectic. My neighborhood in the San Fernando Valley – sometimes referred to as Valley Village or Valley Glen – includes many people in the film and television business, but is increasingly dominated by Orthodox Jews, Armenians and Israelis. In summer, barely clad acting folk pass Orthodox haredim dressed in impossibly warm black suits and hats.

    Walk one direction from my house, and you run into Armenian businesses, including alavash bakery and several kabob restaurants. Walk the other direction, and you enter akashrut world, with signs in both English and Hebrew; you even can get panhandled by an odd Jewish beggar, something you encounter in Israel and parts of Brooklyn but not too often in California.

    Outdoor living

    What holds these neighborhoods together is a desire for a particular quality of life, usually associated with the single-family home. These, along with modestly sized garden apartments, long have been the primary choice of Southern Californians. Such housing facilitates enjoying this region’s arguably greatest asset: its weather. Residents value a place for backyard barbecues, swimming pools, small soccer pitches for the kids and an element of seclusion.

    Unable to afford the pricier L.A. or O.C. neighborhoods, many Southern Californians, to the consternation of the urban planners and some developers, head for a newer village on the regional periphery. Indeed, more than 99 percent of the region’s growth has taken place far from central L.A. For every yuppie who moves Downtown, or into now-fashionable closer-in neighborhoods, a hundred or more move out to Rancho Cucamonga, Valencia, Mission Viejo or scores of other outlying communities.

    This article first appeared in the Orange County Register.

    Joel Kotkin is executive editor of NewGeography.com and Distinguished Presidential Fellow in Urban Futures at Chapman University, and a member of the editorial board of the Orange County Register. He is author of The City: A Global History and The Next Hundred Million: America in 2050. His most recent study, The Rise of Postfamilialism, has been widely discussed and distributed internationally. He lives in Los Angeles, CA.

  • Showing the Flag: The Transit Policy Failure

    David King has a point. In an article entitled "Why Public Transit Is Not Living Up to Its Social Contract: Too many agencies favor suburban commuters over inner-city riders," King, an assistant professor of urban planning in the Graduate School of Architecture, Planning and Preservation at Columbia University notes that transit spends an inordinate share of its resources on suburban riders, short changing the core city riders who cost transit agencies far less to serve and are also far more numerous. He rightly attributes this to reliance on regional (metropolitan area) funding initiatives. Many in transit think it is necessary to run near empty buses in the suburbs to justify the use of transit taxes to suburban voters (what I would refer to as "showing the transit flag")

    King asks: "So does public transit serve its social obligations?" He answers: "Increasingly the answer is no." King is rightly concerned about the disproportionate growth in spending on commuter rail lines that carry transit’s most affluent riders from deep in the suburbs to downtown. Transit policy has long been skewed in favor of the more affluent suburban dwellers in the United States.

    My Experience in Los Angeles

    I saw this first-hand as a member of the Los Angeles County Transportation Commission (LACTC). When we placed what was to become the first regional transit tax on the ballot (Proposition A in 1980), the shortage of transit service was critical in the highest demand, largely low-income areas of Los Angeles such as Los Angeles and East Los Angeles. I described the situation in a presentation to the annual conference of the American Public Transportation Association: "Often waiting passengers are passed at bus stops by full buses" Approximately 40 percent of the local bus services between the Santa Monica Mountains, Inglewood, Compton, Montebello and Santa Monica reached peak loads of 70 passengers, well above seating capacity

    At the same time, suburban area buses were usually less than half-full. In connection with this concern, I produced a policy paper, Distribution of Public Transit Subsidies in Los Angeles County, which was published in by the Transportation Research Board. The abstract follows: 

    "Public transit today is faced with the challenge of serving its clientele while subsidies are failing to keep pace with increasing operating costs. In Los Angeles County, there are service distribution inequalities–overcrowding and unmet demand in some areas and, at the same time, surplus capacity in other areas. To use subsidy resources efficiently requires that the effects of present subsidy allocation practices be understood–that is, how subsidies are translated into consumed service, both by type of service and by geographic sector within the urban area. An attempt is made to provide a preliminary understanding of that distribution in Los Angeles County. It is postulated that significantly more passengers are carried per dollar of subsidy in the central Los Angeles area than in other areas and local services require a lower subsidy per passenger than do express services. A number of policy issues are raised, the most important being the very purpose of public transit subsidies."

    Generally, transit operating subsidies per passenger were far higher in the suburbs than in the central area (where incomes are the lowest, and poverty rates the highest), and subsidies were much higher for commuter express services than for local bus services.

    I attempted to address this problem by proposing a "Mobility Policy" that would have reallocated service based on customer needs, giving precedence to areas where mobility was restricted due to limited automobile availability and lower incomes. Some colleagues whose constituents were disadvantaged by this inequity objected,  feeling compelled, it appeared, to rally about the “transit flag”

    On a Siding: Transit Policy in Recent Decades

    Since that time, Los Angeles and other major metropolitan areas have built expensive rail and busway systems. Despite the promises of attracting people out of their cars (routinely invoked during election campaigns for higher taxes), the reality is that single occupant commuting has risen from 64 percent in  1980 to 76 percent in 2012. Over the same period, transit’s share of urban travel has fallen, though stabilized in recent years at very low levels in most metropolitan areas. Indeed, when New York, Chicago, Philadelphia, Washington, Boston, and San Francisco are excluded (with their "transit legacy cities"), the 46 major metropolitan areas have a transit commute share of just three percent. Overall, more people work at home than commute by transit in 38 of these metropolitan areas and more people walk or cycle to work in 27, according to American Community Survey 2012 data.

    Yet the politically driven inequality in transit spending continues. Transit subsidies continue to be far higher for services that are patronized by more affluent riders. For example, subsidies (operating and capital expenditures minus fares) are three times as high for the commuter rail services, with their higher income riders, than for buses, with their lower income riders (Figure).

    The difference can be stark, as an example from the New York area indicates. A Fairfield County, Connecticut commuter rail rider with the median family income of $102,000 would be subsidized to the extent of $4,500 per year (assuming the national subsidy figure). By comparison a worker from the Bronx or Hudson County, New Jersey, with a poverty level family income of $18,500 per year (or less) would be subsidized only $1,500 per year. In fact, the bus subsidy would likely be even lower, because transit in lower income areas is much better patronized and thus less costly for the public. My Los Angeles research found inner city services to be subsidized approximately half below the average of all bus services (Note).

    Where Transit Works

    The functional urban cores contain the nation’s largest downtowns (central business districts). Their population densities are nearly five times that of the older suburbs and nine times that of the newer suburbs. The functional urban cores have transit market shares six times that of the older suburbs and 15 times that of the newer suburbs. Yet, it is in these poorer, denser areas where overcrowding is most acute and the need for more service is most acute. In Los Angeles, for example, the greatest potential for increasing transit ridership is where ridership is already highest.

    The vast majority of suburban drivers are not plausible candidates for transit, simply because it cannot compete well with automobiles, except, for example, for some trips to the downtowns of the six transit legacy cities (which account only one of seven jobs in their respective metropolitan areas).

    Where transit makes sense, people ride. Where it doesn’t, they don’t. Allocating resources inconsistent with this reality impairs the mobility of lower income residents, wastes resources and relegates transit to an inferior role in the city. Charging the affluent fares well below the cost of service compromises opportunities to serve more people in the community.

    Better allocation of transit resources would likely improve core area unemployment rates by increasing the number of jobs that can be accessed by lower income workers. Further, because the better used services would require lower subsidies, there would be funding available for additional service expansions.

    The principal fault is not that of transit management. It’s the politics.

    —–

    Note: These data (expenditures per boarding) are estimated from Federal Transit Administration and American Public Transportation Association data for 2012. Commercial revenues other than fares are excluded (the most important such source is advertising). Debt service is also excluded because it is not reported in the annual reports of either organization. The subsidy ratios between lower income and more affluent riders would be changed by including transfers (though the subsidies would still be considerably higher for the more affluent). Some low income riders use more than one bus or rail vehicle for their trip, while some commuter rail riders transfer to bus or rail services at one or both ends of their trips. No readily available data is available to make such an adjustment. The New York area example assumes 225 round trips per year.

    —–

    Wendell Cox is principal of Demographia, an international public policy and demographics firm. He is co-author of the “Demographia International Housing Affordability Survey” and author of “Demographia World Urban Areas” and “War on the Dream: How Anti-Sprawl Policy Threatens the Quality of Life.” He was appointed to three terms on the Los Angeles County Transportation Commission, where he served with the leading city and county leadership as the only non-elected member. He was appointed to the Amtrak Reform Council to fill the unexpired term of Governor Christine Todd Whitman and has served as a visiting professor at the Conservatoire National des Arts et Metiers, a national university in Paris.

    Photo: Bart A car Oakland Coliseum Station

  • Large Urban Cores: Products of History

    Urban cores are much celebrated but in reality most of the population living in functional urban cores is strongly concentrated in just a handful of major metropolitan areas in the United States. This conclusion is based on an analysis using the City Sector Model, which uses functional characteristics, rather than municipal jurisdictions, to analyze urban core and suburban components of metropolitan areas.

    Functional Classifications of Metropolitan Areas

    The City Sector Model allows a more representative functional analysis of urban core, suburban and exurban areas, by the use of smaller areas, rather than municipal boundaries.

    The nearly 9,000 zip code tabulation areas of major metropolitan areas are categorized by functional characteristics, including urban form, density, and travel behavior. There are four functional classifications, the urban core, earlier suburban areas, later suburban areas and exurban areas. The urban cores have higher densities, older housing and substantially greater reliance on transit, similar to urban cores that existed before the post-World War II automobile oriented suburbanization. Exurban areas are beyond the built up urban areas. The suburban areas constitute the balance of the major metropolitan areas. Earlier suburbs include areas with a median house construction date before 1980. Later suburban areas have later median house construction dates.

    Concentrating in New York and A Few Other Areas

    As is so often the case on dense urbanization, the statistics are dominated by New York urban core which accounts for 42 percent of the total urban core population for the whole country. The New York metropolitan area, with 19.6 million people represents roughly six percent of the country’s population but its urban core –some 10.2 million strong – is larger than the total population of every metropolitan area in the nation other than Los Angeles (12.8 million).

    New York’s dominance is not surprising, reflecting its unique history and development.  Four of the core city’s five boroughs (Brooklyn, Queens, Manhattan, and the Bronx) have higher population densities than any municipality more than one-one hundredth its size in the United States. Significantly, unlike most major metropolitan areas, New York’s functional urban core stretches well beyond the core city, and includes more than 2,000,000 residents outside New York City.

    Another 36 percent of the nation’s urban core population is in six metropolitan areas, though none reaches a population close to that of New York (Figure 1). Chicago is second, with an urban core population of 2.4 million. Four other urban cores exceed 1,000,000 population, including Boston (1.6 million), Philadelphia (1.5 million), Los Angeles (1.3 million) and San Francisco (1.1 million). The seventh largest urban core is in Washington, at 900,000. These seven metropolitan areas include the six transit legacy cities (municipalities), which account for 55 percent of the transit work trip destinations and 99 percent of the increase in urban core transit commuting in the United States over the past 10 years.(Los Angeles is not classified as a transit legacy city).

    After Washington, the size of urban cores drops off markedly with the next 45 largest metropolitan areas accounting for only 22 percent of the urban core population. Cleveland ranks eighth at 460,000, Baltimore is ninth at 440,000, and Minneapolis-St. Paul is 10th with 420,000 urban core residents. Perhaps surprisingly, Providence, which is the nation’s 38th largest metropolitan area, ranks 11th in urban core population, at 410,000 residents. Pittsburgh, Milwaukee, Buffalo, and St. Louis round out the top 15, with between 320,000 and 370,000 urban core residents (Figure 2).

    Another 9 metropolitan areas have urban core populations exceeding 100,000:Detroit, Seattle, Cincinnati, Portland, Hartford, New Orleans, Rochester, Kansas City, and Louisville.

    Urban Cores over 100,000 Population

    Approximately 97 percent of the urban core population lives in the 24 major metropolitan areas with more than 100,000 urban core residents. Between 2000 and 2010, the urban core populations in these areas dropped from 25.3 percent to 24.0 percent of their respective metropolitan populations. The continued decentralization of these metropolitan areas is illustrated by a loss in the earlier suburban areas and gains in the later suburban areas and exurban areas (Figure 3).

    By comparison, only one percent of the population was in the urban cores of the other 28 major metropolitan areas (fewer than 100,000 residents in the urban core).

    New York had by far the largest percentage of its total metropolitan population in the urban core, at 52 percent. Boston ranked second, with 34 percent of its population in the urban core. Buffalo, which was ranked only 47th in metropolitan area population, was third in urban core population share (29 percent). Chicago and San Francisco had 26 percent of their population in the urban cores, followed by Providence and Philadelphia at 25 percent (Figure 4).

    Description of the Largest Urban Cores

    There is substantial variation in the geographical extent of the largest urban cores relative to their corresponding historical core municipalities. This is described below and illustrated in the just published Demographia City Sector Model Metropolitan Area Maps.

    As would be expected, New York’s urban core includes nearly all of the city of New York. Virtually all of Brooklyn, Manhattan, the Bronx, and Queens are in the urban core, though only parts of Staten Island are included. The urban core extends into New Jersey, with nearly all of Hudson County (including Jersey City) included, the core of Essex County (including Newark) and the city of Elizabeth (in Union County). The urban core and extends into Long Island’s Nassau County, including Hempstead, Valley Stream, Rockville Center and other areas. To the north, the urban core extends to parts of Westchester County (such as Yonkers, Pelham, Mount Vernon and New Rochelle). Interestingly, many of these areas, such as in western Nassau County, parts of Essex County and southern Westchester County are also suburban in form, but are classified as urban core because of high transit market shares, higher densities or pre-war development.

    Chicago’s urban core, the second largest, extends beyond but also excludes parts of the city of Chicago. The urban core extends into adjacent areas, such as older “suburban” Evanston, Oak Park and Cicero. There is also a significant urban core in northwestern Indiana, centered on East Chicago and Hammond.

    Boston’s urban core extends far outward from the city of Boston, including much of the area inside Route 128 (Interstate 95). This area also includes cities such as Cambridge, Everett, Somerville, Quincy, Medford, Waltham, and Lynn.

    Philadelphia’s urban core is largely confined to the city of Philadelphia, with extensions into Delaware County, Pennsylvania and Camden County, New Jersey.

    The urban core of Los Angeles is principally in the area extending from Hollywood to parts of East Los Angeles and south to the Interstate 105 freeway. However, much more of the city of Los Angeles is not in the urban core. The urban core also includes parts of Beverly Hills, West Los Angeles, Pasadena and Glendale.

    The urban core of San Francisco includes most of the cities of San Francisco and Oakland, as well as much of Berkeley, Albany, and Emeryville.

    Washington’s urban core includes most of Washington (the District of Columbia) and extends into Arlington and Alexandria in Virginia and has a large extension into Montgomery County, Maryland, including areas such as Bethesda and Silver Spring.

    Urban Cores Compared to Historical Core Municipalities

    A comparison of functional urban core populations to the populations of historical core municipalities indicates the problem of relying on jurisdictional (municipal) boundaries for urban core analysis. Functional urban core and historical core municipality populations vary significantly (Figure 5). The greatest differences are in Boston and Louisville. Boston’s functionalurban core population is 2.52 times that of the historical core municipality (Boston). Louisville’s functional urban core population is only one-sixth that of the historical core municipality (Louisville).

    Providence is second to Boston in its ratio of urban core population to that of historical core municipality at 2.29. The city of Providence had only 178,000 residents in 2010. (Among historical core municipalities, only Hartford was smaller at 125,000). Washington has an urban core population 1.49 times that of the historical core municipality, while New York and Buffalo had urban cores 1.25 times the population of their historical core municipalities.

    Among urban cores with more than 100,000 population Kansas City, Los Angeles, Portland, and New Orleans follow Louisville with the lowest ratios to historical core municipality populations (from 24 percent to 37 percent). In each of these cases, the urban core’s low ratio is the result of substantial annexations or large areas or the settling of large rural territories that had been previously included in the municipal limits (such as Los Angeles and New Orleans).

    Urban Cores: Products of History

    Indeed, nothing distinguishes the major metropolitan areas with larger urban core populations from the rest than history, In1940, just before the great mobility and suburbanization revolution, there were 23 metropolitan areas in the United States with wore than 500,000 population. The major metropolitan areas with the 19 largest urban cores in 1940 were all among the 23 with more than 500,000 population in 1940. Out of the 24 major metropolitan areas with more than 100,000 urban core residents in 2010, 21had more than 500,000 population in 1940 (only Hartford, Rochester and Louisville had smaller populations).

    Conversely, only two of the 28 major metropolitan areas in 2010 with fewer than 100,000 functional urban core residents had more than 500,000 residents in 1940, and they were among the smaller (Houston with 528,000 and Atlanta with 518,000).

    Urban cores were not planned, but rather were the result of consumer trendsin a time of much lower household incomes and much more restricted personal mobility. Many of the very centers of urban cores are reviving, but overall core growth continues to lag behind that of metropolitan areas. Moreover, there are no significant new ones.Urban cores, as much as anything, are a product of history.

    ————

    Wendell Cox is principal of Demographia, an international public policy and demographics firm. He is co-author of the "Demographia International Housing Affordability Survey" and author of "Demographia World Urban Areas" and "War on the Dream: How Anti-Sprawl Policy Threatens the Quality of Life." He was appointed to three terms on the Los Angeles County Transportation Commission, where he served with the leading city and county leadership as the only non-elected member. He was appointed to the Amtrak Reform Council to fill the unexpired term of Governor Christine Todd Whitman and has served as a visiting professor at the Conservatoire National des Arts et Metiers, a national university in Paris.

    ————

    Illustration: Core of the New York metropolitan area (City Sector Model map)

  • Demographia City Sector Maps Available

    Maps have been published illustrating the City Sector Model functional urban classifications for the 52 major metropolitan areas in the United States. The maps are available at Demographia City Sector Model Metropolitan Area Maps.

    Functional Classifications of Metropolitan Areas

    The City Sector Model allows a more representative functional analysis of urban core, suburban and exurban areas, by the use of smaller areas, rather than municipal boundaries.

    The nearly 9,000 zip code tabulation areas of major metropolitan areas are categorized by functional characteristics, including urban form, density and travel behavior. There are four functional classifications, the urban core, earlier suburban areas, later suburban areas and exurban areas. The urban cores have higher densities, older housing and substantially greater reliance on transit, similar to the urban cores that preceded the great automobile oriented suburbanization that followed World War II. Exurban areas are beyond the built up urban areas. The suburban areas constitute the balance of the major metropolitan areas. Earlier suburbs include areas with a median house construction date before 1980. Later suburban areas have later median house construction dates.

  • Dispersing Millennials

    The very centers of urban cores in many major metropolitan areas are experiencing a resurgence of residential development, including new construction in volumes not seen for decades. There is a general impression, put forward by retro–urbanists (Note 1) and various press outlets that the urban core resurgence reflects a change in the living preferences of younger people – today’s Millennials – who they claim are rejecting the suburban and exurban residential choices of their parents and grandparents.

    There is no question that the millennial population has risen in urban cores in recent years. Yet the growth in the younger population in urban cores masks far larger increases in the same population group in other parts of major metropolitan areas and in the nation in general.

    Functional Analysis of Metropolitan Areas

    This article continues a series examining the 52 major metropolitan areas (those with more than 1,000,000 residents) using the City Sector Model, which allows a more representative functional analysis of urban core, suburban, and exurban areas, by using smaller areas, rather than using municipal boundaries. The City Sector Model thus eliminates the over-statement of urban core data that occurs in conventional analyses, which rely on historical core municipalities, most of which encompass considerable suburbanization.

    The City Sector Model classifies 9,000 major metropolitan area zip code tabulation areas using urban form, density, and travel behavior characteristics. There are four functional classifications: the urban core, earlier suburban areas, later suburban areas, and exurban areas. The urban cores have higher densities, older housing and substantially greater reliance on transit, similar to the urban cores that preceded the great automobile oriented post-World War Two suburbanization. Exurban areas are beyond the built up urban areas. The suburban areas constitute the balance of the major metropolitan areas. Earlier suburbs include areas with a median house construction date before 1980. Later suburban areas have later median house construction dates (Note 2).

    20-29s and the Urban Core

    The age band best approximating millennials for the period of 2000 to 2010 is people of from 20 to 29 years of age.

    Between 2000 and 2010, the total population of 20-29’s living in the functional urban cores increased by 300,000, from 4.3 million to 4.6 million from 2000 to 2010. Yet, the share of 20-29s living in the urban cores actually declined over the decade.

    In 2000, 20.2 percent of the major metropolitan area 20- to 29-year-old population was in the urban core. By 2010, it had dropped to 19.3 percent, a 4.4 percent share reduction. This happened because the 300,000 increase in 20-29s in the urban core was dwarfed by the overall 2.6 million increase in the same age group throughout the major metropolitan areas. As a result, only 12 percent of the 20-29 population growth was in the urban core, 40 percent below its 2000 share.

    While 80 percent of the 20-29s lived outside the urban cores in 2000, 88 percent of the 20-29 population growth was outside the urban core between 2000 and 2010 (Figure 1). Overall, the suburban and exurban millennial population grew nearly 8 times than in the urban core.

    The 20-29s and the Balance of Major Metropolitan Areas

    The trend among the 20-29s also tended away from the areas adjacent to the urban cores. These tend to be   earlier suburban areas (generally with median house construction dates before 1980). Between 2000 and 2010, the share of 20-29s living in the earlier suburbs fell from 46.1 percent to 42.0 percent. This was double the urban core loss noted above (4.4 percent), at 8.9 percent.

    At the same time, millennials, long said to hate suburbs, have embraced dispersion. The more recently built suburban areas saw their share of 20-29s rise from 20.6 percent to 24.4, an 18 percent gain. A smaller gain was registered in exurban areas, where the share of 20-29s rose from 13.2 percent to 14.3 percent; an 8 percent share gains (Figure 2).

    The net effect from 2000 and 2010: a full five percent more of all 20-29s in major metropolitan areas lived in the later suburban and exurban areas, while 5 percent fewer lived in the urban cores and earlier suburbs. The later suburbs and exurbs added 1,500,000 more 20-29s than the urban core and earlier suburbs.

    Millennials and the Nation

    The numbers of 20-29s continued to increase in the rest of the nation’s small towns and cities, as well as rural areas. In 2000, approximately 44.6 percent of the 20-29 population lived outside the major metropolitan areas. In the next decade, these areas added 20-29s at a lower rate (40.9 percent of the increase), yet this was enough to keep the share of 20-29s at 44.2 percent. In 2010, more than four times as many 20-29s lived outside the major metropolitan areas as lived in the urban cores. Between 2000 and 2010, the growth in 20-29’s living outside the major metropolitan areas was almost six times the growth in the urban cores (Figure 3).

    Overall, only 7 percent of the growth in the 20-29 age group was in the functional urban cores between 2000 and 2010. That left 93 percent of the growth to be outside the urban core (Figure 4).

    Consistency with Other Research

    The trend among the 20-29s in the urban core may seem surprising. However, it is consistent with an analysis of 2000-2010 data by the US Census Bureau, which indicated that the population gains within two miles of the city halls of the largest cities were more than offset by losses in the ring between two and five miles from City Hall. While the gains in the course of the urban cores are impressive, they are much smaller when considered in the context of the entire urban core and even smaller in the context of the entire metropolitan area.

    More recent data suggests the dispersion of Millennials is continuing. According to Jed Kolko, Chief Economist at Trulia.com Millennials located in larger numbers in suburban areas  than in the urban cores between 2012 and 2013 (more recent data for the city sector analysis is not yet available) 

    Dispersing, But Not Quite as Quickly

    Essentially what we see here is myopic prejudices of contemporary journalism. More than 300,000 new 20-29 residents in the urban cores was more than enough to be noticed by analysts and reporters, since that’s where many of them spend much of their time. Moreover, the share of 20-29s living in urban cores dropped less than one-half the rate for all ages in the urban core.

    Simply put, despite the conventional wisdom, 20-29s are not abandoning the suburbs and exurbs for the urban core. The data indicates that the 20-29s have been more inclined to choose the urban core than other age groups, but not enough to prevent their overwhelming numbers living in suburban and exurban communities. Nor has this inclination been sufficient to counter the continuing relative decline in the urban core among the 20-29s.

    ————-

    Wendell Cox is principal of Demographia, an international public policy and demographics firm. He is co-author of the "Demographia International Housing Affordability Survey" and author of "Demographia World Urban Areas" and "War on the Dream: How Anti-Sprawl Policy Threatens the Quality of Life." He was appointed to three terms on the Los Angeles County Transportation Commission, where he served with the leading city and county leadership as the only non-elected member. He was appointed to the Amtrak Reform Council to fill the unexpired term of Governor Christine Todd Whitman and has served as a visiting professor at the Conservatoire National des Arts et Metiers, a national university in Paris.

    Note 1: The term retro-urbanist is applied to the currently popular strain of urban planning that favors urban cores over the rest of the urban area and metropolitan area (the suburbs and exurbs).

    Note 2:. The previous articles in this series are:
    From Jurisdictional to Functional Analyses of Urban Cores & Suburbs
    The Long Term: Metro American Goes from 82 percent to 86 percent Suburban Since 1990
    New York, Legacy Cities Dominate Transit Urban Core Gains
    Functional v. Jurisdictional Analysis of Metropolitan Areas
    City Sector Model Small Area Criteria

  • Urban Renewal Needs More than ‘Garden City’ Stamp to Take Root

    Every few years the ideals of Ebenezer Howard’s garden city utopia are resurrected in an attempt by the UK government to create new communities, and address the country’s housing crisis. Sometimes this takes the form of new towns or eco-towns, and sometimes proposals for an actual garden city are put forward – as in the last budget.

    Rather than just rolling out this romantic terminology, we should take a closer look at garden city ideals and how they can be adopted to make the proposed Ebbsfleet development a success.

    Several years ago my colleague Michael Edwards presciently forecast the current problems in the Thames Gateway where Ebbsfleet falls, with a dominance of private development that does little to provide for local employment and walkable communities.


    Ebenezer Howard’s utopian vision

    He outlined the need to return to funding principles similar to the garden city model, where development trusts retain freeholds on the land. This model, based on investment in infrastructure and services, is a fundamental principle that shifts from short-term returns to a long-term relationship created between the collective or public landowner and local inhabitants.

    Lessons From History

    Despite the fact that the garden city was a highly influential model throughout the first half of the 20th century, ultimately leading to the establishment of some key settlements in the UK, US and elsewhere in the world, it has had few genuine successes. After World War II, similar utopian dreams of creating model communities, with decent housing surrounding a well-designed centre, met with the reality. British reformer William Beveridge famously summed them up for having “no gardens, few roads, no shops and a sea of mud”.

    You’d be forgiven for thinking that past lessons would be applied to the next generation of housing. But, even the post-war housing plans – though inspired by the garden city movement of the interwar periods – failed to plan the new housing in relation to transport, employment and public services such as shops and schools. While UK government reports have tried to draw lessons from both their positive and negative aspects, they have also been criticised in more recent reports, for lacking a sense of community – although it should also be said that “community” takes time to develop and cannot be “designed” as such.

    Many of the challenges of creating new communities are bound up in the spatial separation between newcomers and older inhabitants, a lack of social infrastructure, such as doctor’s surgeries and schools, and difficulties that stem from long commutes, such as lower net income and the strain this has on families. Ruth Durant found this in her 1939 study of Burnt Oak on the outskirts of London.

    Early post-war new towns were similarly criticised for their very slow build-up of health services, higher schooling, cultural facilities and decent shopping facilities, although some did better with the provision of local employment, due to many people moving to the towns with a local job linked to their housing. With shifts in the industrial economy, such beneficial connections between home and work (one of the tenets of the garden city) reduced over time.

    Modern Twist

    The challenges today are slightly different, however. People live more mobile and fragmented lives and are arguably less likely to be tied to place as was the case for the primarily working-class (and manual labouring) communities of the past. This poses the risk that community will be lost because of how transient people can be.

    But increased mobility and social interaction don’t have to be mutually exclusive. Indeed, a lack of mobility is the worst problem that can be imposed on a community: both work and leisure must be accessible to people. Plus, with the advent of the internet and grass-roots activism, connections can traverse space more easily. This has allowed movements such as the Transition Network, which brings communities together around sustainable issues, to blossom.

    Adapting to Change

    UCL’s EPSRC funded Adaptable Suburbs project has studied the evolution of London’s outer suburban towns over the past 150 years, providing some clues on what has made for the relative success of the original garden cities over other planned settlements. It is clear that their success has been dependent on excellent transport connections, coupled with the provision of local employment and access to employment at a commutable distance.

    Also important is the provision of a mixed-use town centre, giving a destination for a wide variety of activities in addition to retail: community activities, schools, leisure and cultural uses. Centres work well when connected to the street network, accessible by foot, bicycle, public and private transport. This multi-functional design has helped even the smallest of centres to sustain themselves through the most recent economic recession.

    A recent government report, “Understanding High Street Performance”, also found that successful town centres are “characterised by considerable diversity and complexity, in terms of scale, geography and catchment, function and form … [as] a result, the way in which they are affected by and respond to change is diverse and varied”.

    It is almost impossible to predict how society will change in the future, particularly as new technologies have the power to change how people connect and build community. But what is evident is that here lies another essential aspect of building successful communities: in allowing for places to adapt to change.

    This needs to be a foundational aspect of the government’s new cities – simply invoking the phrase “garden city” is not enough. By building places with sufficient flexibility of buildings, infrastructure and uses, coupled with links that allow for local and wider-scale trips to take place, with the necessary long-term financial investment, we can start to create places that will successfully weather the future.

    This article was originally published on The Conversation.

    Dr Laura Vaughan is Professor of Urban Form and Society at the Bartlett, University College London. She has been researching poverty and prosperity in cities, suburbs and the space between them for the past dozen years using space syntax – a mathematical method for modelling social and economic outcomes. Her edited book ‘Suburban Urbanities’ is due to come out in UCL Press in 2015.

    Photo: Which way are the flower beds? Matt BuckCC BY-SA

  • Dallas: A City in Transition

    I was in Dallas this recently for the New Cities Summit, so it’s a good time to post an update on the city.

    I don’t think many of us realize the scale to which Sunbelt mega-boomtowns like Dallas have grown. The Dallas-Ft. Worth metro area is now the fourth largest in the United States with 6.8 million people, and it continues to pile on people and jobs at a fiendish clip.

    Many urbanists are not fans of DFW, and it’s easy to understand why. But I think it’s unfair to judge the quality of a city without considering where it is at in its lifecycle. Dallas has been around since the 1800s, but the metroplex is only just now starting to come into its own as a region. It is still in the hypergrowth and wealth building stage, similar to where a place like Chicago was back in the late 19th century. Unsurprisingly, filthy, crass, money-grubbing, unsophisticated Chicago did not appeal to the sophisticates of its day either. But once Chicago got rich, it decided to get classy. Its business booster class endowed first rate cultural institutions like the Art Institute, and tremendous efforts were made to upgrade the quality of the city and deal with the congestion, pollution, substandard housing, and fallout from rapid growth, which threatened to choke off the city’s future success. At some point in its journey, Chicago reached an inflection point where it transitioned to a more mature state. One can perhaps see the 1909 Burnham Plan as the best symbol of this. In addition to addressing practical concerns like street congestion, the Burnham Plan also sought to create a city that could hold its own among the world’s elite. And you’d have to argue the city largely succeeded in that vision.

    The DFW area is now at that transition point. They realize that as a city they need to be about more than just growth and money making. They need to have quality and they need to address issues in the system. Much like Burnham Plan era Chicago, this perhaps makes DFW a potentially very exciting place to be. It’s not everyday when you can be part of building a new aspirational future for a city that’s already been a successful boomtown. The locals I talked to were pretty pumped about their city and where it’s going.

    How true this is I don’t know, but some people have attributed a change in mindset to the loss in the competition to land Boeing’s headquarters. Boeing ended up choosing Chicago over Dallas. In part this was because Chicago bought the business with lavish subsidies that far outclassed what Dallas put on the table. But it was also because Boeing saw Chicago as a more congenial environment for global company C-suite and other top executives to be, both from a lifestyle perspective and that of access to other globally elite firms and workers available in Chicago.

    Meanwhile, the cracks in the DFW growth model were becoming apparent, especially in the core city of Dallas. Ten years ago the Dallas Morning News ran a series called “Dallas at a Tipping Point: A Roadmap For Renewal.” This series was underpinned by a report prepared by the consulting firm Booz Allen. This report is well worth reading by almost anyone today as it is a rare example of a city that was able to get insight and recommendations from the type of tier one strategy firm used by major corporations. Booz Allen was direct in their findings, though perhaps with a bit of hyperbole in the Detroit comparison:

    Dallas stands at the verge of entering a cycle of decline…On its current path, Dallas will, in the next 20 years, go the way of declining cities like Detroit – a hollow core abandoned by the middle class and surrounded by suburbs that outperform the city but inevitably are dragged down by it.
    ….
    If the City of Dallas were a corporate client, we would note that it has fallen significantly behind its competitors. We would warn that its product offering is becoming less and less compelling to its core group of target customers…We would further caution the management that they are in an especially dangerous position because overall growth in the market…is masking the depth of its underlying problems. We would explain that in our experience, companies in fast growing markets are often those most at risk because they frequently do not realize they are falling behind until the situation is irreversible.

    Put into the language of business, we would note that Dallas is under-investing in its core product, has not embraced best practices throughout its management or operations, and is fast becoming burdened by long term liabilities that could bankrupt the company if the market takes a downturn.

    The city responded in a number of ways, some of which were similar to Chicago at its inflection point. Many of these involve various urbanist “best practices” or conventional wisdom type trends.

    By far the most important of these was adopting modern statistically driven policing approaches. As crime plummeted in places like New York during the 1990s, Dallas did not see a decline of its own. But with the expansion of police headcount and adoption of new strategies by new police chief David Kunkle in 2004 – and no doubt some help from national trends – crime fell steeply during the 2000s. The Dallas Morning News says that the city’s violent and property crime rates fell by a greater percentage than any other city with over one million residents over the last decade. In 2013, Dallas had its overall lowest crime rate in 47 years.

    This is critical because nothing else matters without safe streets. I’ve had many a jousting match with other urbanists on discussion boards about where crime falls on the list of priorities. In my view it’s clearly #1 – even more so than education. It’s simply a prerequisite to almost any other systemic good happening in your cities. Students can’t learn effectively if they live and attend school in dangerous environments, for example. NYU economist Paul Romer made this point forcefully in his New Cities keynote, saying that fighting crime is the most important function of government and that if you don’t deliver on crime control your city will go into decline. Fortunately, Dallas seems to have gotten the message.

    But there’s been attention to physical infrastructure as well. The area has built America’s largest light rail system (which was in the works since the early 1980s).


    Dallas Area Rapid Transit (DART) light rail train. Source: Wikipedia

    Both the city and region remain fundamentally auto-centric, however, and this is unlikely to change.

    There’s been a significant investment in quality green spaces. A major initiative called theTrinity River Project is designed to reclaim the Trinity River corridor through the city as a recreational amenity. This is underway but proceeding slowing. Among the aspects of the project is a series of three planned signature bridges designed by Santiago Calatrava. The only one completed is the Margaret Hunt Hill Bridge.


    The Margaret Hunt Hill Bridge in Downtown Dallas. Designed by Santiago Calatrava. Source: Wikipedia

    The single bridge tower is quite an imposing presence on the skyline. However, the size of the bridge creates an awkward contrast with the glorified creek that is the Trinity River. It looks to me like they significantly over-engineered what should have been a fairly straightforward flood plain to span just so they could create a major structure.

    Another green space project – and the best thing I saw in my trip to Dallas – is Klyde Warren Park, which is built on a freeway cap. About half the cost came from $50 million donations. I’ll be going into more detail on this in my next installment, but here’s a teaser photo:


    Klyde Warren Park. Source: Wikipedia

    The Calatrava bridge shows that Dallas has embraced the starchitect trend. This was also on display in the creation of the Dallas Arts District. Complementing the Dallas Museum of Art are a billion dollars worth of starchitect designed facilities including Renzo Piano’s Nasher Sculpture Center, IM Pei’s symphony center, Norman Foster’s Winspear Opera House, and OMA’s Wyly Theatre.


    Dee and Charles Wyly Theatre. Designed by OMA’s Joshua Prince-Ramus (partner in charge) and Rem Koolhaas

    This arts district – which naturally Dallas boasts is the world’s largest – along with the other major investments that were funded with significant private contributions show a major advantage Texas metros like DFW and Houston have: philanthropy. These are new money towns on their way up and local billionaires are willing to open their wallets bigtime in an attempt to realize world class ambitions, exactly the way Chicago’s did all those decades back.

    By contrast many northern tier cities are dependent on legacy philanthropy, such as foundations set up in an era when they were industrial power houses. This is a dwindling inheritance. What’s more, what wealthy residents they do have are as likely to be taking money out of their cities through cash for cronies projects than they are to be putting it in. Thus they can be a negative not positive influence.

    This shows the importance of wealth building in cities. Commercial endeavors can appear crass or greedy at times, and deservedly so. But without wealth, you can’t afford to do anything. There’s a reason Dallas could build America’s largest light rail system – it had the money to do so. Similarly with this performing arts district. To be a city of ambition requires that a place also be an engine of wealth generation.

    I’m sure that Dallas’ moneyed elite are well taken care of locally and exert outsized influence on decision making. I don’t want to make them out to be puristic altruists. But they’ve shown they are willing to open their wallets in a serious way, something that’s not true everywhere.

    This is a flavor of what Dallas has been up to. It’s too early to say whether the city will make the same transition Chicago did. Its greatest challenge also awaits some time in the future. When DFW’s hypergrowth phase ends and the city must, like New York and Chicago before it, reinvent itself for a new age, that’s when we will find out if DFW has what it takes to join the world’s elite, or whether it will fade like a flower as Detroit and so many other places did.

    Toyota did just announce it’s moving 3,500 jobs to north suburban Plano. But corporations have long seen Dallas a place for large white collar operations. Boeing was what I call an “executive headquarters” – a fairly small operation consisting of only the most senior people. I haven’t seen Dallas win any of these as of yet.

    The Dallas Morning News takes a somewhat mixed view on the city itself. They just did a special section called “Future Dallas: Making Strides, Facing Challenges,” the title of which sums it up. Dallas has put a lot of pieces on the board and made major progress on areas like crime, but it’s failed to make a dent in others, such as Booz Allen’s call to make the city more attractive to middle class families. Poverty is actually up since then, and the city is increasingly unequal in its income distribution. Dallas is not unique in that, but that’s cold comfort.

    Despite gigantic regional growth, the city’s population has been nearly flat. Despite the vaunted Texas and DFW jobs engine, Dallas County has lost about 100,000 jobs since 2000. The core is clearly continuing in relative decline, and the Dallas County job losses are particularly troubling. I’m no believer in this idea that everybody is going to abandon the suburbs and head back to the city. But as former Indianapolis Mayor Bill Hudnut put it, you can’t be a suburb of nowhere. If the core loses economic vitality, the entire DFW regional will take a hit to its growth.

    Aaron M. Renn is an independent writer on urban affairs and the founder of Telestrian, a data analysis and mapping tool. He writes at The Urbanophile, where this piece originally appeared.

    Dallas photo by Bigstock.