Category: Suburbs

  • Suburb Hating is Anti-Child

    Sure, suburbs have big problems. Their designs force their inhabitants to drive in cars, instead of walking and bicycling. This diminishes face-to-face interactions, physical health, and the quality of the environment. Aesthetically, many of them, particularly those dreaded “planned communities,” are quite boring. People who live there tend not to have much contact with people who aren’t like them, so suburbs reinforce racial, religious, and class segregation.

    A large proportion of intellectuals and politicians, including President Obama, decry these problems with suburbs as reason to hate them and advocate for their elimination, in favor of dense, big cities.

    Yeah, I get it. I agree that all these problems exist, and they bother me a lot.

    There’s just one big problem with suburb hating. The alternative to suburbs in metropolitan areas, cities, are much worse for children. Sure, adults can have a great time in hip, dense city centers like Manhattan or San Francisco. In fact, if my wife and I never had kids, we’d still be living in San Francisco, going out practically every night.

    However, it’s clear that cities are worse for kids than suburbs.

    Why do I say this?

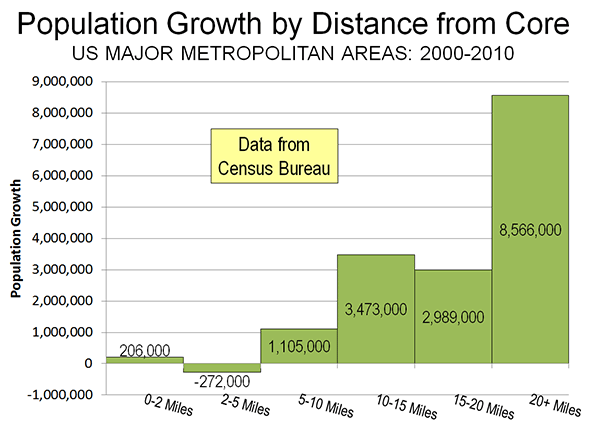
    First, just look at where newly married urbanites choose to live once they have children. They leave cities in droves. The hipper and denser the city, the more likely are parents to flee to the suburbs.

    20-29_table

    Richard Florida made his name over a decade ago writing about how cities should attract the “creative class” – a code name for childless urban hipsters. In his book, Who’s Your City?: How the Creative Economy Is Making Where to Live the Most Important Decision of Your Life, he lists cities he thinks are best for different groups of people. The table here shows the percentage of total population in the United States that is school-aged children (age 5-17) versus that for large cities that Florida lists as best for 20-29 year-olds.

    The only two cities that are even close to the national average of 17.5% are Los Angeles and New York. Los Angeles covers an awful lot of land area, and I suspect that if I could get data for what Florida really means by “Los Angeles,” the percentage would be much lower.

    NYC_boroughs

    New York is also quite large and diverse, but there, fortunately, I have data for what Florida really means by “New York.” I’m sure he’s thinking of Manhattan when he thinks of “creative class.” There, as you can see on the table here, Manhattan’s percentage of the population that is school-aged is 11.8%, far below the national average.

    In her suburb-hating book, The End of the Suburbs: Where the American Dream Is Moving, Leigh Gallagher gushes that Manhattan “has become overloaded with families.” To back up this assertion, she points to US Census data that there were 2,600 more married families with children 0-18 in 2010 than in 2000. Actually, that’s unimpressive for two reasons. First, the census data show that Manhattan’s total population actually increased by more than the population of children, so children as a percentage of the total population actually dropped. Second, even if the percentage of children had increased, the 11.8% figure for school-aged children is horrifically low.

    The New York Times contributed to this gushing sentiment for children in Manhattan in a 2005 article. It pointed to a small surge in children under 5 in Manhattan’ census data between 2000 and 2004. Unfortunately, this trend did not extend to school-aged kids.

    This disparity hints at the major reason why families leave big cities: public schools in large cities are, by and large, awful. So, for the most part, families that have the means to move out of cities when their children reach school age flee to the ‘burbs. Most middle and upper-middle class families that do stay send their children to private schools. 30% of San Francisco children go to private schools, and my guess is that the figure for Manhattan and other dense, hip urban centers is close to that.

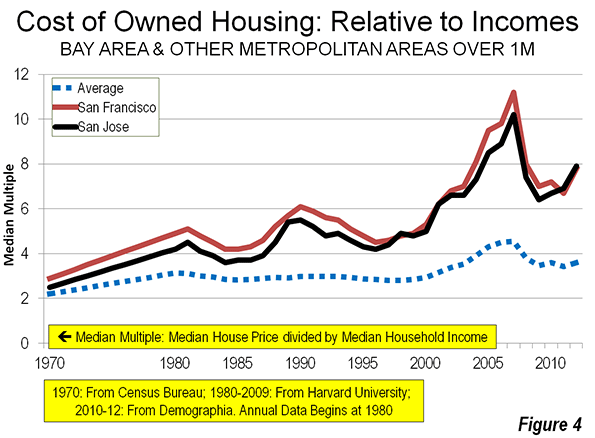
    So, to some extent, when you hear people complain that cities are too expensive for families, they are calculating private school into the cost of living there.

    But private schools not only cost a lot of money. They also destroy neighborhood life for children. In big city neighborhoods where many or most children go to private schools, children who live on the same street hardly know each other because they tend to go to different schools that their parents choose.

    Beyond running bad schools that force families with the means to go to private school, some big city school systems put the final dagger into neighborhoods by forcing or enticing children to go to a school outside their neighborhoods.

    For example, San Francisco has done this for decades in an effort to forcibly integrate students of different races and backgrounds, but instead, what it’s done is destroy neighborhoods and push more families into private schools than any other city in America. In the last year or two, that city has made a small change in its policy in an apparent effort to make it more possible for children to go to school in their own neighborhood, but this change hasn’t gone nearly far enough to pull neighborhoods together.

    So, big cities are left with neighborhoods where children spray out to all parts of the city to go to school every day. When school’s over at the end of the day, playing in their neighborhoods isn’t an option because children there don’t know one another.

    The families that do flee for the suburbs leave a diverse place where parents like them have a small amount of political power and huge teachers’ unions dominate, to a more homogeneous place where most residents are like them, in terms of socio-economic status, and parents wield great power over schools. Left behind are the less fortunate kids, with their families.

    The other primary problem that families have with cities is space. Yes, while it’s trendy these days for urban planners to advocate for dense development, families with children flee from density. Every large city in the United States that has high density – including those in the Richard Florida list above and other dense cities like Miami and Philadelphia – have very low percentages of school-aged children.

    To put it simply, play requires space. If all kids have outside their crowded apartment building is a sidewalk, they can’t play a game of soccer, nor can they play even less formal games like hide and seek or tag. Also, sidewalks are a lot less complex, and therefore they’re a lot more boring for kids, than yards that have grass and bushes with hiding spaces.

    As Richard Louv writes so eloquently in his book Last Child in the Woods, children really do love being in nature. They’re drawn to play among trees, bushes, grass, and creeks rather than sidewalks and brick walls.

    Those who tout the attractiveness of city life for children always cite the importance of public parks. Parks are great for families that live right next to them, but unfortunately, we’re never going to put a park in every other block. The fact is that children don’t roam very far on their own these days. In fact, most preteen children don’t roam on their own more than a few feet from their front doors, whether those front doors are to their single family homes or to their apartment buildings. So, parks are of very limited use, even to most city dwellers. While kids and caregivers go there together, kids hardly every go there on their own to play freely.

    Clearly, children can get a great deal of value from a yard outside a single family home, which is one important reason why so many families aim to move to the suburbs. Yes, most families don’t exploit their yards nearly enough once they move there, but that’s a problem with how families live in suburbs. It’s not a blanket condemnation of suburbs.

    So, we need to fix suburbs and the way families utilize them. They should be far more pedestrian friendly, and not favor cars so much. Residential yards should be used as social hangouts, not merely admired from afar for their manicured shrubs and flower beds. I’ve written a great deal about these fixes on my blog and in my book Playborhood.

    But what we shouldn’t do is try to force families to live in dense city centers. Most families don’t like it there, with good reason.

    Suburb hating hurts children. Politicians who advocate anti-suburb policies are hurting children. They are, dare I say, anti-child.

    Mike Lanza is author of the parenting book Playborhood: Turn Your Neighborhood Into a Place For Play, and blogs at Playborhood.com.

    Suburbs photo by Bigstock.

  • Cities Don’t Consume Resources, People Do

    Urban form or urban consumers? If we want to reduce the environmental impacts of modern society let’s prioritize consumption, not city form.  The evidence suggests that large cities (and especially city centres) are associated with a bigger environmental footprint than modest cities or suburbs. 

    This post looks at incomes and consumption, especially the consumption of housing and transport services, asking how far can local regulation really influence environmental impacts?

    What can local governments do about the environment?
    Local governments have two core roles.  One is to ensure that the infrastructure and services necessary to sustain everyday life and commerce are in place and working well.  In fulfilling this role they should aim to enhance the quality of the urban environment and limit any environmental impacts of infrastructure. 

    The other role is to plan and manage development in a way that reduces conflict among land uses. In doing that they should aim to contain or control adverse spill-over impacts. 

    However, for councils to use their investment in infrastructure and land use regulation to determine in detail how and where people should live and consume pushes the boundaries of these roles, particularly when they try indirectly to reshape household behavior by reshaping the city.

    The key to understanding the environmental impacts of urbanized society is not urban form but household consumption, a function of income, not city plans.

    Urbanization and environmental impacts
    In a recent piece I showed how policies to increase residential densities around city and town centres assume a relationship between urban form and environmental impacts that is not supported by the evidence. In Australia, for example, residents of the New South Wales state capital, Sydney, particularly central Sydney, have by far the largest environmental impact per head.  Much lower levels are recorded in suburbs, smaller cities, and towns. (The same pattern is evident in all Australian states: have a look using the Australian Consumption Atlas).

    The environmental impacts of intensive urban living outweigh any advantages of increasing scale and density. This means that policies that push agglomeration and intensification will increase rather than lower the impacts of urban living.

    Household spending is the issue
    The Australian study confirms that a city’s environmental impacts simply comprise the collective impacts of its residents.  Income is the driver of their consumption and thereby their demands on the environment. 

    If we really believe city form can in some way over-ride income- and consumption-driven environmental impacts, then we should heed the evidence and plan for modest, small scale, dispersed urban settlement. 

    Spending on housing and transport in New Zealand
    Household Expenditure Survey data for New Zealand (and elsewhere) provide an opportunity to explore the role of income in consumption generally. 

    First, take a look at the distribution of spending on housing, transport, and discretionary goods (recreation and cultural services is used to represent the latter category) according to household incomes in 2010. Average spending levels have been organized by income decile for this purpose, each group containing 10% of households. Average incomes increase from decile 1 (the lowest earning 10% of households) to decile 10 (the highest earning 10%).

    The pattern is pretty predictable.  Housing dominates the spending of low decile households.  It accounts for 34% in the lowest decile, falling to 22% in the ninth.  It rises again (to 24%) in the highest earning decile (10). This lift between decile 9 and 10 households no doubt reflects higher discretionary spending in the latter group by way of additional space, the quality of fit-outs, and second homes. 

    Shares of Household Spending to Selected Categories, by Income Band
    http://3.bp.blogspot.com/-9RfoZrWOqJk/UdklonCl_xI/AAAAAAAAAY0/AX1r49MtdJE/s640/Share+of+hhold+spend+by+category.jpg

    Do lower housing costs lead to higher transport spending?
    Rent theory suggests that lower household spending is offset by higher transport spending.  This is because low income households can only afford cheaper, less accessible properties and so end up commuting further at a higher cost than high income households. 

    It turns out that it’s not that simple.  Contrary to the theory, higher income households actually spend more of their income on transport.  That makes sense when we realize that commuting accounts for only around 25% of time spent travelling by New Zealanders.  The capacity to take discretionary trips is a bigger determinant of transport consumption than non-discretionary commuting and work-based trips.

    The Relationship Between Spending on Housing and Transport

    http://4.bp.blogspot.com/-8sGLN4_gTfo/UdyUskoSpgI/AAAAAAAAAZk/WEqMSQNRZM4/s640/Transport+Housing+Relationship.jpg


    Lower incomes leave a lot less to spend on discretionary goods and services once housing and essential transport spending are covered. [1] Higher income households can and do travel more and consume more.  Their behavior is unlikely to be significantly influenced by changing city form. 

    Who spends how much?
    Not surprisingly total consumption in New Zealand is dominated by higher income households: the 20% highest earning households (deciles 9 and 10) account for 35% of total spending on goods and services, while the lowest earning 20% (deciles 1 and 2) account for just 20%.

    And decile 10 households account for 7 times more spending on transport than decile 1 households.  They spend 5.5 times more on recreation and cultural services, and 3.5 times as much on food.


    The Contribution of Household Total Expenditure by Income Band, Selected Categories
    http://2.bp.blogspot.com/-OXL5hMRRw-Q/UdklqCO8CjI/AAAAAAAAAZA/o2GweAb3nTc/s640/Contributinm+to+totalmspoend+by+decile.jpg

     
    The highest income households spend three times more on housing than low income households, an average of $476 per week compared with $161.
    If refurbished housing in high amenity inner city living is expensive, guess which income groups will be living there?  The high consumers, obviously.  And in Auckland, at least, it seems that city planners and policy-makers are keen to deliver them the high order consumer services that will promote ever-more discretionary spending around the CBD(although much of central city resident travel may be taken up with recreational and social trip-making away from there).  

    A high social cost for little environmental benefit?
    The conclusion is straightforward: higher incomes mean more expenditure on additional housing, transport, and discretionary goods and services with correspondingly high environmental impacts.  If incomes are higher in cities, then their collective impacts will be high too.

    Planning policies won’t change that much – except to the extent that they erode consumption by inflating the basic costs of living, something that impacts most heavily on lower income households.  

    Fiddling with city form is unlikely to significantly reduce the impact of higher incomes and associated spending on the environment.  Increasing dwelling and living costs by promoting larger cities, higher residential densities, and uneconomic transit systems simply penalizes low income households already committing substantial shares of their spending to housing and transport.  And this is the group that, by dint of constrained consumption, has the lowest impact on the environment. 

    Better to address environment issues directly
    From a policy perspective, environmental issues are better tackled directly.  This may mean promoting environmentally friendly goods and services, promoting low impact technologies (including low impact housing, fuel efficient vehicles, and the like), and encouraging responsible consumption. If we are really serious about environmental threats, we need to examine the efficiency of current pricing practices and even taxation measures, rather than leaning so heavily on clumsy, indirect, and ultimately spurious urban planning policies. 

    Phil McDermott is a Director of CityScope Consultants in Auckland, New Zealand, and Adjunct Professor of Regional and Urban Development at Auckland University of Technology.  He works in urban, economic and transport development throughout New Zealand and in Australia, Asia, and the Pacific. He was formerly Head of the School of Resource and Environmental Planning at Massey University and General Manager of the Centre for Asia Pacific Aviation in Sydney. This piece originally appeared at is blog: Cities Matter.

    Photo by Pat Scullion

  • Plan Bay Area: Telling People What to Do

    The San Francisco area’s recently adopted Plan Bay Area may set a new standard for urban planning excess. Plan Bay Area, which covers nearly all of the San Francisco, San Jose, Santa Rosa, Vallejo and Napa metropolitan areas, was recently adopted by the Metropolitan Transportation Commission (MTC) and the Association of Bay Area Governments (ABAG). This article summarizes the difficulties with Plan Bay Area, which are described more fully in my policy report prepared for the Pacific Research Institute (Evaluation of Plan Bay Area).

    Plan Bay Area would produce only modest greenhouse gas emissions reductions, while imposing substantial economic costs and intruding in an unprecedented manner into the lives of residents. The Plan would require more than three quarters of new residences and one third of net additional employment to be located in confined "priority development areas." These measures have been referred to as “pack and stack” by critics. The net effect would be to virtually ban development on the urban fringe, where the organic expansion of cities has occurred since the beginning of time.

    Irrational Planning

    Violating perhaps the most fundamental requirement of a rational plan, Plan Bay Area begins with a situation that no longer exists. Further, it is based on exaggeration, systematic disregard of official federal government projections and overly optimistic planning assumptions.

    Exaggerated Population Projection: The Plan assumes that the Bay Area will grow 55 percent more rapidly between 2010 and 2040 than official California state Department of Finance population projections indicate. These state-produced estimates have tended themselves to be on the high side (Figure 1). The planners scurried about to resolve these differences, but there is no indication that the state will be revising its projections. Plan Bay Area’s population projection would require growth in the Bay Area to increase by more than one-half from the 2000-2010 annual rate. The exaggeration of population growth has its uses: it leads to a higher greenhouse gas emissions projection for 2040, providing a rationale for stronger policy interventions.

    Ignoring Current Greenhouse Gas Emissions Projections: The Plan also ignores the new, more favorable DOE fuel economy projections (Figure 2). These projections were issued in December, well before the publication of the draft plan in April and the adoption of the final plan in July. Indeed, if the new DOE projections had been published the day before, Plan Bay Area should have been placed on hold and revised. In short, Plan Bay Area was out of date when adopted.

    Overly Optimistic Planning Assumptions: The Plan assumes that travel by light vehicle (automobiles, sport utility vehicles and pickups) would be reduced by substantial increases in transit ridership. Plan Bay Area presumes that expanding transit service 27 percent over the next 30 years will lead to a near doubling of transit ridership. This is stupefying, since over the last 30 years, transit ridership remained virtually the same, while service was expanded nearly twice as much as would be planned from 2010 to 2040.

    The plan also assumes that residents forced into the priority development areas will use transit and walking much more, materially reducing their use of light vehicles. This research behind this assumption is skewed toward transit oriented developments located on rail lines with good access to downtown. But nearly nine out of 10 employees in the Bay Area work outside the downtowns of San Francisco and Oakland, and that number is increasing (according to Plan Bay Area).

    Given recent history, it seems wishful thinking to believe that small transit service expansions and downtown oriented transit development can do much to attract drivers from cars. The modest gains greenhouse gas emissions reductions projected in Plan Bay Area are likely exaggerations.

    Plan Bay Area’s “pack and stack” densification is likely to produce even less than the modest substitution of transit and walking for driving (see The Transit-Density Disconnect). Traffic congestion, in this already highly congested area, is likely to be worsened, which could nullify part or all of the greenhouse gas emission reductions expected from reduced vehicle use.

    Correcting Plan Bay Area Forecasts

    Plan Bay Area would only modestly reduce light vehicle travel and greenhouse gas emissions. This is illustrated in Figure 3, which shows that the “pack and stack” strategies that would force most new residents and jobs into priority development areas, Plan Bay Area would reduce greenhouse gas emissions by 2 percent (“Plan Bay Area” line compared to the “Trend” or “doing nothing” line).

    By contrast, correcting the Plan Bay Area 2040 population estimates to reflect the state population projections would reduce greenhouse gas emissions more than eight times as much (17 percent), without the “pack and stack” strategies. A further correction of the Plan Bay Area 2040 estimates to reflect the latest DOE fuel economy projections, would reduce greenhouse gas emissions 22 percent, 11 times as much as the “pack and stack” strategies.

    Heavy Costs for Households and Businesses

    The Plan’s “pack and stack” strategies seem likely to exacerbate the Bay Area’s already high cost of living. Currently, the San Francisco and San Jose metropolitan areas have the worst housing affordability among the nation’s 52 metropolitan areas with more than 1 million residents. San Jose’s median house price relative to its median household income was 7.9 last year, according to the Demographia International Housing Affordability Survey. San Francisco’s median multiple was 7.8. This severely unaffordable housing results from recent decades of urban containment or smart growth policies, which have severely restricted the land on which development can occur. This drives up prices (other things being equal), consistent with economic principle. This has been made worse by house and apartment impact fees imposed on developers that are far above the national average.

    By comparison, in major metropolitan areas that have not implemented strong urban containment policies, the median multiple has typically been 3.0 or less since World War II, including the Bay Area before its adoption (Figure 4). The “pack and stack” strategies would largely limit new development to small parts of the Bay Area, an even more draconian prohibition than the long standing restrictions on urban fringe development. This further rationing of land could be expected to drive land prices even higher, making it even more difficult for households and businesses to live within their means.

    The problem is already acute. The new US Census Bureau housing cost adjusted data shows California to have the highest poverty rate among the states and the District of Columbia (metropolitan area data is not available). An early 2000s Public Policy Institute of California report showed Bay Area poverty to be nearly double the official rate, adjusted for the cost of living. Ultra pricey San Francisco had among the ten highest poverty rates – over twenty percent – of any urban county in the country.

    Unaffordable housing has also fueled an exodus to the San Joaquin Valley (Central Valley). Now more than 15 percent of the workers in the Stockton metropolitan area commute to the Bay Area, which led the Federal Office of Management and Budget adding Stockton to the San Jose-San Francisco combined metropolitan area (combined statistical area). In addition, the greater traffic congestion is likely to lengthen work trip travel times. This is likely to further increase emission while also burdening job creation and economic growth (see Traffic Congestion, Time and Money).

    Ignoring the Economy and Poverty

    Plan Bay Area effectively ignores these costs (despite rhetoric to the contrary), by failing to subject its strategies to a cost per ton metric. According to the United Nation’s Intergovernment Panel on Climate Change (IPCC), sufficient greenhouse gas emissions reductions can be achieved at a cost between a range of $20 to $50 per ton. The previous regional plan (through 2035) included such estimates. Only highway strategies achieved the IPCC range. Transit and land use strategies cost from four to more than 100 times the top of the IPCC range. Even those estimates did not include the prohibitively higher housing costs that result from urban containment policies. The cost metric is crucial, because spending more than necessary to reduce greenhouse gas emissions limits job creation and economic growth, which leads to reduced household affluence and greater poverty. This is the very opposite of the economic objectives of public policy. Virtually all political jurisdictions around the world seek greater prosperity for their residents and less poverty. A legitimate regional plan requires subjecting its strategies to economic metrics.

    Opposition

    There is opposition to Plan Bay Area. A citizen movement worked for rejection and has now filed suit claiming that the Plan violates the California Environmental Quality Act. The suit also alleges that MTC and ABAG used a questionable interpretation of state law and regulation to justify the irrational Plan outcomes.

    Recorded Votes

    Opponents were also successful in obtaining a rare recorded vote at ABAG. The governing board (General Assembly) is composed of selected elected officials from cities and counties who are not elected to their ABAG positions. ABAG adopts virtually all of its actions by consensus, rather by recorded votes, as occurs in many of the nation’s regional planning boards.

    Consensus decision making seem especially odd in California, where inability to obtain sufficient votes in the legislature for the state budget required a constitutional amendment. Neither do city councils and county commissions operate on a consensus basis on controversial issues.

    There is no shortage of controversial issues, at ABAG or other regional planning agencies. A good first reform would be for recorded votes to be the rule, rather than the exception. Consensus decision making may be appropriate for clubs, but it is not for representative bodies in a democracy.

    Impeding the Quality of Life

    Plan Bay Area was outdated when approved and reflects a world that no longer exists. Drafters have insisted on extravagantly expensive and intrusive policies that produce only minimal greenhouse gas reductions, and at great cost, using, among other things, unreasonably bloated population forecasts to bolster their approach. Unless changed, the Plan will likely be more successful in driving up housing prices, limiting options for households, and further congesting traffic than meeting its stated goal of reducing   greenhouse gas emissions.

    Wendell Cox is a Visiting Professor, Conservatoire National des Arts et Metiers, Paris and the author of “War on the Dream: How Anti-Sprawl Policy Threatens the Quality of Life.

    Photo: San Francisco (by author)

  • Children and Cities

    Central cities are not likely to regain their former population. However, some of them may have reached an important inflection point—population growth has returned to at least some of the largest (and longest-declining) cities. For example, New York City’s population has increased by more than one million since 1990, after declining by about one million between 1950 and 1980. Over the past decade, nine of the ten largest (and 17 of the 20 largest) cities in the United States have gained population.

    Many observers attribute the population turnaround to changes in the residential attractiveness of the city, although cause and effect are blurry since new residents themselves have instigated many changes to the urban landscape.   Prominent urban researchers have described particular features of urban areas that have attracted households back to the core. These features include new housing in city centers, amenities such as specialized restaurants and night life, restoration of architectural gems, and myriad cultural activities. Such features are enticing increasing numbers of (mostly young) college-educated singles to call city centers home.

    If one goes back in time, studies on urban household location tended to focus on the tradeoff in the cost of commuting from suburban areas and the lower price of land and housing in suburban communities.  Research indicated that about half of the suburbanization in the post-World War II period was driven by higher income that increased the demand for suburban housing relative to city housing.  It is still the case that suburbanization is partly driven by the demand for larger, detached houses that are more prevalent in suburban communities.   

    To be sure, amenities alone do not explain recent trends. Other studies have documented the ability of urban cores to foster jobs and businesses characterized by intense information exchange and creativity, thereby attracting college-educated workers to live in nearby neighborhoods. In a recent study, we show that central cities are an increasingly important work site for the most highly educated workers in all of the metropolitan areas that we examined, even bankrupt Detroit.¹

    Income, education, and human capital are all important elements in city revival. In a recent study, Alan Ehrenhalt calls the return to city living the “great inversion” that reverses trends present in cities since the mid-twentieth century. He hypothesizes that some American metropolitan areas are beginning to resemble nineteenth century European cities, where the more affluent lived in city centers and households of more modest means lived in the suburbs. Some of the reasons that he offers for the heightened attractiveness of many central cities as a place to live are the decline of manufacturing in cities (making them more livable); lower crime rates; growth in the single, never-married population; lower fertility rates; and a bulging cohort of relatively affluent and educated seniors.

    Although many cities still have a disproportionately number of the poor, poverty has become more suburban over the past decade.  For example, the number of poor in suburbs of Chicago about doubled over the past decade.  Thus, although the poverty rate in cities such as Chicago remains much higher, it has declined relative to suburban areas.

    Conspicuously absent from recent discussion is the role and attractiveness of central cities for families with children. In the past, research and observation both indicated that suburbs provided families with cheaper land and housing, as well as safer neighborhoods and higher quality schools.

    In many MSAs, the central city’s share of college-educated adults approaches or exceeds the city’s share of all persons aged 25 and older, with the exception of some older industrial cities, such as Detroit, Milwaukee and Philadelphia (see table). But for educated adults with children, only Seattle and Charlotte buck the trend, or come close to it.                                  


    Percent of MSA residents aged 25 years and older living in central cities, 2009


    All Persons Age 25+


    All College- Educated


    Parents with School-Age Kids

    College-Educated Parents with School-Age Kids

    Baltimore

               17

               14

              17

                6

    Boston

               19

               20

              13

                8

    Charlotte

               31

               38

              28

              33

    Chicago

               30

               30

              27

              16

    Cincinnati

               13

               16

                 9

                7

    Detroit

               22

               12

              24

                9

    Milwaukee

               25

               19

              27

              11

    Minneapolis

               19

               22

              16

              13

    NYC

               49

               46

              47

              36

    Philadelphia

               33

               24

              30

              13

    Pittsburgh

               12

               14

                 8

                8

    Seattle

               24

               33

              14

              21

    St. Louis

               16

               14

              13

                7

    San Francisco

               22

               27

              14

              12

    Washington, D.C.

               14

               16

                 8

                5

    Source: American Community Survey 2009.


    Yet today, central cities undoubtedly have more to offer households with children. Many cities have made significant strides in improving their public safety, or they have simply benefitted from general trends toward lower criminal activity. However, with regard to public education, it is unclear whether most cities have achieved much traction in this regard, though efforts towards these ends are widespread.  In the case of the city of Chicago, more affluent and educated families with school-age children continue to migrate to suburban communities.  This has resulted in a 16.5% decline in the school-age population in the city of Chicago over the past decade.

    Urban school improvement initiatives range from a host of teacher pay-for-performance reforms, to “small schools” reconfiguration, to charter school choice and high-achieving academies.  In some instances, where highly educated parents with children have chosen to live in the city, parents have opted out of the public school system. For example, in Manhattan about 1 in 4 school-age children attend private schools. In the more affluent areas within Manhattan the percentage is much higher — about 1 in 2 children in families that live in either the Upper East Side or Upper West Side.

    As they aim to encourage further population growth in city centers, policy leaders would do well to understand the residential choices being made by affluent and educated households with children and work to provide the amenities and services important to these families. They represent a population segment that may be significant in attracting jobs and building a tax base to provide public services for all city residents.  Otherwise, working parents who must commute from suburb to city may demand higher wages as compensation for the additional time and cost of getting to work, thus having a negative effect on employment and investment in the city.

    The recent influx of young (mostly well-educated) adult singles represents an opportunity for central cities. These urban homesteaders begin with a preference for urban living; policymakers might want to consider ways to keep them in the city as they marry and raise children.

    In a current study, we are exploring the relationship between higher education, income, and the location of families with school-age children within a city-suburban area context for 15 large metropolitan areas in the United States, including Chicago, New York City, Philadelphia, and San Francisco.² In particular, we highlight the effects of various levels of higher education on household location and how education effects vary for different types of households. We compare our results with estimates for married respondents without school-age children and for never-married respondents without school-age children. Thus, we are able to highlight the heterogeneity in the effects of education on household location by household type and city-suburb location.

    A key variable in our study is whether adults have at least a bachelor’s degree. In about half of the metropolitan areas we examine, educational attainment levels of householders are higher in central cities than in suburban areas. In some cases, the differences are relatively large—for example, the share of population with a college degree is 15 percentage points higher in the city of Seattle than in the suburbs. However, the share is 18 percentage points higher in the suburbs of Detroit than in the city.

    But when it comes to college-educated parents, the apparent residential advantage of the city mostly evaporates. In most cases, college-educated parents with school-age children are far less concentrated in central cities relative to all parents with school-age children, with the exceptions of Charlotte, Pittsburgh, and Seattle. For example, 30 percent of college graduates in the Chicago MSA live in the city of Chicago, but only 16 percent of college-educated parents with school-age children live in the city. About half of these parents send their children to private schools.

    On the face of it, the key reason that parents live in central cities is the location of their work. A high percentage of parents who work in central cities also live there. For example, 59 percent of parents with school-age children who work in the city of Chicago also live there. This declines to 43 percent for college-educated parents with school-age kids.

    How do these numbers hold up to closer statistical scrutiny? To put them to the test, we conducted multivariate analyses with respect to individual household location in city versus suburb. We analyzed each of 15 city-suburb MSA pairs separately for the very recent past. Our study data are drawn from the Census Bureau’s American Community Survey for 2009. According to our results, the ongoing migration of educated, mostly young, adults into the city has not carried over into their child-raising years. Our findings are negative for higher education and income effects on living in a central city for families with school-age children for the largest cities within metropolitan areas in our sample, including Chicago, New York City, and Philadelphia. This contrasts with more positive higher education effects on living in cities for married and never-married respondents without school-age children.

    In most of our study MSAs, households with high educational attainment lead the way in living in central cities, but the presence of school-age children negates this effect. Overall, having either a bachelor’s degree or a master’s degree has a negative effect on families with school-age kids living in a city, although there are a few cases where the effect is positive. Having very high levels of educational attainment (a professional degree or a Ph.D.) is negatively associated with living in a city only in a few cases, suggesting that parents with the highest levels of educational attainment tend to have a greater preference for living in cities than other college-educated parents.

    To what extent should cities pursue households with children as a focus of strategic development? Clearly, the benefits of good schools and safe neighborhoods accrue to all population segments, so these are important goals for policy in any case. Social returns to education and safety are high; today’s children are tomorrow’s citizenry and work force. Now that more college-educated households are choosing to live in the city during their pre-child-raising years, city leaders may want to explore ways to entice more of them to remain in the city after they become parents.

    William Sander (Ph.D., Cornell University) is professor of economics at DePaul University in Chicago.  He has also taught at the University of Illinois at Urbana-Champaign and the University of the Philippines.

    William A. Testa (Ph.D., Ohio State University) is Vice President and Director of Regional Programs, Federal Reserve Bank of Chicago.  He has also taught at Tulane University.

    References:
    ¹William Sander and William A. Testa. 2013a. “Education and the Location of Work: A Continued Economic Role for Central Cities.” Annals of Regional Science.
    ²William Sander and William A. Testa. 2013b. “Parents’ Education, School-Age Children, and Household Location in American Cities.” Paper prepared for the European Regional Science Association Congress, Palermo, Italy.

    Crossing the street photo by Bigstock.

  • Mobility for the Poor: Car-Sharing, Car Loans, and the Limits of Public Transit

    Public transit systems intend to enhance local economies by linking people to their occupations. This presents problems for many  low-income families  dependent on transit for commuting. With rising prices at the gas pump, much hope has been placed on an influx of investment into public transit to help low-income households. But does public transit really help the poor? While the effect of transit access on job attainment is murky, several alternatives such as car loans and car-sharing programs have seen real results in closing the income gap. For Christina Hubbert, emancipation from public transit has been a change for the better. NBC News reports:

    A car means Hubbert no longer spends two hours each way to and from work in suburban Atlanta. It means spending more time with her 3-year-old daughter — and no longer having to wake her up at 5 every morning so she can be in the office by 8. It also means saving hundreds of dollars each week in day care late fees she incurred when she couldn’t get to the center before its 6:30 p.m. closing time.

    Research finds that car-ownership is positively correlated with job opportunities while no such relationship exists with access to transit stations. Furthermore, increased transit mobility has been proven to have no effect on employment outcomes for welfare recipients. The notion that newer and nearer public transit creates benefits for all is inaccurate; it only creates opportunities for those who live near the transit stations, and those opportunities are limited. A study by the Brookings Institute finds that, among the ten leading metropolitan areas in the US, less than 10% of jobs in a metropolitan area are within 45 minutes of travel by transit modes. Moreover, 36% of the entry-level jobs are completely inaccessible by public transit. This is not surprising given the fact that suburbia houses two-thirds of all new jobs.

    The mismatch between people and jobs can be reconciled in two ways: car loans and car-sharing services. Basic car-sharing involves several people using the same car or a fleet of cars, as with the ZipCar. The concept has branched out to on-demand car sharing services, such as Lyft, mobile apps which link riders with drivers.

    Car loans on the other hand have been around for a while and offer affordable financing for a car without a required down payment. Ways to Work, one of the largest loan providers in the U.S., includes courses on personal finance and credit counseling. By making vehicle travel more attractive, these two disruptive innovations threaten the expansion of public transit – and its powerful associated lobbies – in three ways:

    1. It’s more cost-efficient and time-efficient.

    To improve the way we move people, transit developments must save both time and money. Sadly, transit lines are notorious for their extraordinary costs and long delays. Data from the 2010 Census reveals that people living in central cities with a higher proportion of transit riders experience longer commutes. And since transit riders have more cumbersome commutes, they are much more likely to be tardy or absent from work.

    The hefty price tag of transit projects also triggers concern. For example, the cost per new passenger of the Washington Metro line to Dulles Airport was estimated at $15,000 annually. That’s about the same as the current poverty threshold for a household of two.

    Car-loan programs on the other hand are largely cost-efficient, producing real fiscal benefits to borrowers, employers, and taxpayers. A survey of 4,771 borrowers and their employers finds that borrowers have greater job security as a result of access to vehicles. With access to credit, borrowers increase their purchasing power by an average of $2,900 each year and save about $250 by avoiding payday loans and checks-for-cash outlets. Employers gain as well through cost savings due to increase retention and reduced absenteeism and tardiness, which amount to $817 and $1130 per borrower respectively. In large part, providing vehicle financing is a smart investment since it reduces the number of low-income families on social welfare – an annual cost savings of $2,900 for each borrower coming off public assistance.

    Given its clear advantages, car sharing is increasing. Recent reports find that shared-use vehicle organizations have been lucrative. Between August 2012 and July 2013, car-sharing ridership grew by 112 percent and the number of vehicles increased by 52 percent. And although car-sharing is not typically used to transport the poor, having on-demand car service makes it so that door-to-door access is more available and affordable. If car-sharing continues to grow at its current rate, it’s reasonable then to assume that these pseudo-taxi services will be eventually be affordable enough so that people would choose to be chauffeured rather than drive their own vehicles.

    2. Vehicle ownership provides greater access to jobs and economic opportunities.

    Instead of being limited to a few areas that are transit-oriented, families with cars have access to more jobs and economic opportunities. Public transit lines are limited in their geographical coverage and take time to make often numerous stops.  Transfers are inefficient and time-consuming, making much of that coverage impractical. Also regular transit riders have limited employment options since they’re only able to consider jobs in the vicinity of transit stops and stations.

    3. Travel by car  is responsive to current travel patterns

  • A common misperception is that low-income people do not have cars. In reality, 86% of the poor have cars, compared to 95% of the entire population. The high percentage of poor families with cars reveals how automobile culture has become fixed into American ideals of economic well-being and prosperity. And contrary to stereotypes, the poor and the rich similarly spend about 94% of their transportation costs on vehicle travel versus public transit, challenging the notion that low-income travel behavior is unlike that of the rest of the population. As such, providing the poor with cars dramatically levels the playing field as they are the ones who would gain the most from increased access to employment destinations and education facilities.

    A strong argument posited by public transit advocates is that as more cars use the road, congestion and pollution will intensify. And to be sure, public transit is more environmentally friendly than motor vehicles. The Amalgamated Transit Union (ATU), the largest union representing transit workers in North America, reports that one full bus eases the road of thirty-five cars, and that existing transit usage cuts national gasoline consumption by 1.4 billion gallons annually. Yet, on average, this result can only   be achieved if buses were always full, which they are not – authorities from the Los Angeles Metro estimate that their buses run at an average of 42% capacity.

    But is it equitable to ask the poor to forgo mobility and economic gain for the environment? Considering that most Americans experience some degree of social mobility via vehicle ownership, it’s far more reasonable to allow  low-income families greater access to opportunity. In addition, new fuel efficiency standards for cars set by the Obama administration will decrease overall GHG emissions substantially; according to forecasts by the Department of Energy, carbon emissions from light-duty vehicles will drop 21% between 2010 and 2040 in spite of a 40% increase in driving. This shows that, even with more cars on the road, environmental goals can be accomplished.

    Although the eligibility requirements are stricter in some areas than others, every state in the U.S. has a program for low-income residents to have access to car loans. Car-sharing is also rapidly expanding, but  marketing now is geared towards millennials on a budget rather than low-income families. Both innovations, however, respond to new demands faced by future workers, who are likely to find employment in dispersed locations and may make more trips per workday since many may have multiple part-time jobs. With more efficient ways of getting people to work, it’s time to challenge the assumption that the expansion of public transit is the best way to meet the needs of America’s hard-pressed working class.

    Jeff Khau graduated from Chapman University with a degree in business entrepreneurship. Currently, he resides in Los Angeles where he is pursuing his dual-masters in urban planning and public policy at the University of Southern California.

    Photo by Romana Klee, #113 zipcar.

  • Wall Street Journal Reports Reverse of Boomer Moving Trend

    An article by Nancy Keates in today’s The Wall Street Journal indicates that more than 1,000,000 baby boomers moved to within the downtowns of the 50 largest cities between 2000 and 2010. The article quoted Redfin.com as the source for the claim.

    In fact, the authoritative source for such information is the United States Census. The Journal’s claim is at significant variance with Census data.

    First of all, according to US Census Bureau data, the areas within 5 miles of the urban cores of the 51 metropolitan areas with more than 1,000,000  population lost 66,000 residents between 2000 and 2010 (See Flocking Elsewhere: The Downtown Growth Story). It is implausible for 1,000,000 boomers to have moved into areas that lost 66,000 residents (Figure).

    Secondly rather than flock to the city, as the Journal insists, baby boomers continued to disperse away from core cities between 2000 and 2010, as is indicated by data from the two censuses. The share of boomers living in core cities declined 10 percent. This is the equivalent of a reduction of 1.2 million at the 2010 population level (Note). The share of the baby boomer population rose 0.5 percent in the suburbs, the equivalent of 175,000. Outside these major metropolitan areas, the share of baby boomers rose three percent, which is the equivalent of 1,050,000. All of the net increase in boomers , then, was in the suburbs or outside the major metropolitan areas, while all of the loss was in the core cities.

    Among the 51 major metropolitan areas, only seven core cities gained baby boomers (See table at Demographia.). Among these seven, only two had larger percentage gains than the suburbs in the same metropolitan areas. One of these was Louisville, which accomplished the feat by a merger with Jefferson County. Louisville’s gain appears to have been simply the result of moving boundaries, not moving people.

    Note: The age groups used are 35 to 55 in 2000 and 45 to 65 in 2010, which approximate the baby boomers. There was a decline in the number of baby boomers between 2000 and 2010 (largely due to deaths). The figures quoted in this article allocate the same percentage loss from this reduction to the 2000 baby boomer population for each core city and metropolitan area (the national rate).

  • Distortions and Reality about Income Mobility

    A ground-breaking study of intergenerational income mobility has the enemies of suburbia falling all over themselves to distort the findings. The study, The Spatial Impacts of Tax Expenditures: Evidence from Spatial Variation Across the U.S. (by economists Raj Chetty and Nathaniel Hendren of Harvard University and Patrick Kline and Emmanuel Saez of the University of California, Berkeley). Chetty, et al. examined income mobility by comparing the income quintiles (20 percent) of households with children (between 1996 and 2000) compared to their own household income quintiles as adults in 2010/1. The children were all born in 1980 or 1981. The authors summarize their research as follows:

    “We measure intergenerational mobility at the local (census commuting zone) level based on the correlation between parents’ and children’s earnings. We show that the level of local tax expenditures (as a percentage of AGI) is positively correlated with intergenerational mobility.”

    The Over-Reach

    One of their findings was that children born in the Atlanta area had less upward income mobility than in most other metropolitan areas (Note 1). This provided all that was needed for a spin by others that distorted the findings into a completely different story than supported by the data.

    New York Times reporter David Leonhart started it, sprucing up the conclusions to produce anti-sprawl tome. He accomplishes this by unearthing anecdotes about the difficulty low income workers face getting to work in Atlanta, and blaming that urban area’s lower density suburbanization. However, the same anecdotes could have been woven from every metropolitan area in the nation (Note 2), regardless of their extent of suburbanization. More importantly, the research is not about sprawl.

    Nonetheless, Nobel Laureate Paul Krugman then piled on, writing in The New York Times that Leonhart’s article had shown “how sprawl seems to hurt social mobility.” Krugman continued the next day with his “sprawl-caused-Detroit’s bankruptcy” thesis, which relied on an apples-to-oranges comparison (See: Detroit Bankruptcy: Missing the Point). Then on July 28, Krugman wrote: “…in one important respect booming Atlanta looks just like Detroit gone bust: both are places where the American dream seems to be dying” (Note 3).  Krugman calls Atlanta the “Sultan of Sprawl.”

    Professor Steven Conn of Ohio State University took it a bit further in the Huffington Post, saying that: “One of their findings is that mobility is more restricted in places defined by suburban sprawl — like Atlanta and Columbus, Ohio — than in denser, more urban places like San Francisco and Boston. Far from being good for the nation, our love affair with the car, and the sprawl it has produced, keeps people from moving up the economic ladder.”

    The Research

    The authors of the report reached their conclusions using regression analyses and controlling for demographic factors, with the objective of identifying associations between upward income mobility and tax expenditures, not suburbanization. In fact, the very issue of transportation and density was simply not a factor.

    The authors provided additional information with 25 separate, simple correlation analyses between 25 individual variables and economic mobility (demographic factors were not controlled). Co-Author Raj Chetty described this supplemental research in a PBS interview, citing income segregation, school quality, two-parent families and measures, civic engagement, religiosity and community cohesiveness. The authors urged caution in interpreting these correlations: “For instance, areas with high rates of segregation may also have other differences that could be the root cause driving the differences in children’s outcomes.”

    Rational Responses

    The overreach was challenged by Columbia University urban planning professor David King, who pointed out that the best ranked cities in the upward mobility analysis were all “sprawling,” including Salt Lake City, Santa Barbara and Bakersfield, which he referred to as a “poster child for sprawl.” He further noted that: “…snapshot correlations really don’t mean anything and will provide evidence for whatever point of view is desired.”

    Randal O’Toole of the Cato Institute similarly questions the unfounded interpretations of the study and notes that Atlanta has invested billions in new transit systems over recent decades, but with no appreciable impact on how the poorest citizens did there.

    University of Southern California economics professor Peter Gordon suggested that: “In the fast-and-loose manner that some have digested the Chetty et al. study, we could conclude that sprawl causes upward mobility.”

    Pinnacles of Prosperity

    Interestingly, if, as Krugman alleges, Atlanta is the Sultan of Sprawl, then similarly sprawling Hartford is the “Pinnacle of Prosperity.” Hartford has the highest per capita gross domestic product of any metropolitan area in the world. Yet, the urban area density of Hartford is 1,791 per square mile (692 per square kilometer), little above Atlanta (1,707 and 659), but two-thirds less than less affluent New York (5,319 and 2,054) and three-quarters less than less affluent Los Angeles (6,999 and 2,702), according to the 2010 census (Note 4).

    The reality is that the US has the world’s most sprawling cities, yet the 50 most affluent metropolitan areas per capita in the world include 38 in the United States. This includes the top eight, such as lower density Bridgeport (urban density 1,660 per square mile/641 per square kilometer), Boston (2,232/862) and Durham (1,913/739), as well as metropolitan areas with higher urban densities, San Francisco (6,266/2,419) and San Jose (5,820/2,247). Neither high-density New York nor Los Angeles makes the top 10. America’s greater dispersal is associated with the shortest commute times in the high income world, the least intense traffic congestion and some of the most affordable housing, if metropolitan areas subject to urban containment (smart growth) policies are excluded.

    Moreover, the Chetty, et al data gives little comfort to any whose conception of good and evil depends on sprawl. The research aggregates upward mobility data for all counties within each commuting zone. Among major metropolitan areas, that includes counties from the most dense (New York County at 71,000 per square mile or 27,000 per square kilometer) to Skamania County in the Portland area, with a density of 7 per square mile or 3 per square kilometer. County level analysis could make a difference.

    This is illustrated by the New York metropolitan area, which Chetty, et al divide into multiple commuting zones. The Tom’s River commuting zone, made up of outer suburban Monmouth and Ocean counties in New Jersey showed better upward income mobility (10.4 percent) than the New York commuting zone (9.7 percent) which included the city of New York, Nassau, Suffolk and Westchester counties. It might be interesting, for example, to compare the data, say for highly urban The Bronx to suburban Suffolk County, but the data does not permit that. This is not to criticize the Chetty, et al work; it is rather to suggest caution in inventing conclusions.

    Smaller May be Better

    Further, commuting zones with smaller populations have generally better upward income mobility.  Rather than an ode to bigness, the study found that commuting zones with less than 100,000 population average have higher than average upward income mobility. Virtually all of the smaller areas are low density and have little or no transit. Indeed, the best performers were in the Great Plains, in a swath from West Texas, through Oklahoma, Kansas, Nebraska and reaching a zenith in South Dakota and North Dakota, which is about as far from dense urbanization as it is possible to get. Further, a large majority of the highest scoring commuting zones with larger populations, like Bakersfield and Des Moines, are highly dispersed (Table below). This could be an area for further research.

    Geographical Income Mobility
    Population of Commuting Zone Upward Mobility Cases
    Over 1,000,000 7.5% 62
    500,000 to 1,000,000 7.6% 60
    250,000 – 500,000 8.6% 89
    100,000-250,000 9.0% 167
    50,000-100,000 10.4% 129
    25,000-50,000 13.0% 88
    Under 25,000 13.9% 146
    Average/Total 9.5% 741
    Upward mobility: 30/31 year olds reaching top income quintile by 2010/1, from households in the bottom quintile in 1996-2000
    Commuting zones are similar to metropolitan areas


    Additional Caveats

    There is no question but that this is ground-breaking research. The authors deserve considerable credit for the unprecedented scale of their analysis, which included over 6.2 million observations. However, the available data had an important limitation. The IRS data set they used does not go back far enough to make similarly robust findings about peak adult earnings. Age 30 or 31 may premature for predicting longer run income mobility. At that age, many who will eventually earn much more are not far into their careers. This would include people who have spent longer in higher education, such as those who have earned professional degrees. Finally, the median income of households in the 30 to 31 age category is barely 1/2 of their parents in the same, which, again, is not likely to be representative of their eventual income and quintile ranking over their adult lives.

    The findings would be appropriately characterized as relating to young adult income upward mobility. Conclusions about lifetime upward mobility or peak earnings upward mobility will need to wait a decade or more.

    The Second Half of the Story: Where People Moved

    The authors use the childhood residence in the study, both for the child and the adult. This means, for example, that if a child lived in the New York metropolitan area and moved to Atlanta by 2010 or 2011, he or she would be counted in the New York data. Where people lived as children is the first half of the story. The second half is where they moved.

    This is important, because so many people moved away from places like New York, San Francisco, Los Angeles, Boston, and San Jose during the period the study covers. Approximately 10 percent of the residents of New York and Los Angeles moved elsewhere between 2000 and 2010. Approximately 8 percent left San Francisco, 13 percent left San Jose and 5 percent left Boston. These are not small numbers and indicate that more people left than moved in. A net 1.9 million left New York, 1.3 million left Los Angeles, 340,000 left San Francisco, while 230,000 left San Jose and Boston.

    Some of the metropolitan areas that have gained the most domestic migrants scored below average on upward income mobility. For example, migration from other parts of the nation added 24 percent to Raleigh’s population in the 2000s, 17 percent to Charlotte, 11 percent to Tampa-St. Petersburg, and 10 percent to Atlanta (Note 5).

    None of this contradicts the Chetty, et al findings, which did not address the question of why some many people have moved. It can be assumed that people who are doing well economically will probably stay where they are. On the other hand, most who leave might be thought of as seeking better opportunities that might elude them in the richer, slower growing, far more expensive metropolitan areas of their childhood. The idea that people left New York, Boston or Los Angeles for a less rewarding life in Atlanta, Charlotte, or Raleigh violates everything we know about human nature.

    Seeking Prosperity

    Throughout history, and especially over the last 200 years, cities have drawn people from elsewhere by facilitating opportunity. It is no different today. People move to satisfy their aspirations. This was the point of our recent "Aspirational Cities" report in The Daily Beast.

    Chetty et al conclude: “What is clear from this research is that there is substantial variation in the United States in the prospects for escaping poverty.” True. It is also clear from actual behavior that, for many, the best prospect for escaping poverty may be the better opportunities that attract them to an aspirational city.

    Wendell Cox is a Visiting Professor, Conservatoire National des Arts et Metiers, Paris and the author of “War on the Dream: How Anti-Sprawl Policy Threatens the Quality of Life.

    —-

    Note 1: Chetty, et al use “commuting zone” as their unit of geographical analysis. These areas are generally similar to metropolitan areas, but there are some important differences. For example, the New York metropolitan area is divided into three parts (New York Newark and Tom’s River). The Dallas-Fort Worth metropolitan area is divided into two. Los Angeles, Riverside-San Bernardino and Oxnard are combined as are Rochester and Buffalo. All of Connecticut, which has four metropolitan areas, is a single commuting zone. Areas outside metropolitan areas are also divided into commuting zones.

    Note 2: The overwhelming share of low income workers drive to work (see How Lower Income Citizens Commute). Even, in metropolitan Boston, with its better than average transit system, few of the city’s low income residents can reach suburban job locations in less than one hour (the average commute time for all residents is less than one-half that). Despite popular impressions to the contrary, most jobs cannot be reached in a reasonable period of time by transit in any metropolitan area, nor is there any practical (affordable) way to change that.  

    Note 3: To the contrary, the American Dream is alive and well in Atlanta. Atlanta’s housing affordability is unrivaled by nearly all major metropolitan areas. Housing is four times as expensive relative to incomes in San Francisco and San Jose as in Atlanta (measured by the “median multiple”) three times as high in New York and Los Angeles and twice as costly in Portland. This makes housing more affordable for low income households. Not surprisingly, Atlanta households with less than $20,000 in annual income (approximately the lowest quintile) have a higher home ownership rate than in New York, Los Angeles, San Francisco, San Jose, Boston and Portland. Further, the gap with respect to African-American home-ownership is substantial. Atlanta’s African-American home ownership rate is approximately 40 percent above those of San Jose and Los Angeles, approximately 50 percent higher than Boston, San Francisco and Portland and nearly 60 percent higher than New York (American Community Survey, 2011).

    Note 4: These are US Bureau of the Census urban area density figures, based upon continuous urban areas (“built-up” areas). Urban area densities are calculated using census blocks, and contain no rural land. As a result, their population densities are not distorted by jurisdictional borders. This is to be distinguished from any metropolitan area based measure. All metropolitan areas include urban areas as well as rural areas that are economically connected to the urban area. The extent of rural areas within a metropolitan area is driven by the geographical size of counties and thus varies widely. The largest major metropolitan area county, San Bernardino (California) is nearly 1,000 times as large as the smallest, New York County. If metropolitan area criteria were applied at the census block level, as is the case in urban areas, large swaths rural swaths would be removed from metropolitan areas, changing the density distribution. However, even if metropolitan areas were more appropriately defined, any measure of metropolitan density would remain a mixed urban-rural metric, not a measure of urban density. Here are the 2010 criteria for defining urban areas and metropolitan areas.

    Note 5: There is less black-white racial segregation in Atlanta than in New York, Los Angeles, San Francisco, Boston, and most other major metropolitan areas, according to 2010 data compiled by William Frey of the Brookings Institution.

  • Detroit, Why Hast Thou Forsaken Me?

    Thou wouldst fain destroy the temple! If thou be Jesus, Son of the Father, now from the Cross descend thou, that we behold it and believe on thee when we behold it. If thou art King over Israel, save thyself then!

    God, My Father, why has thou forsaken me? All those who were my friends, all have now forsaken me. And he that hate me do now prevail against me, and he whom I cherished, he hath betrayed me.

    Lyric excerpts from the Fifth and Fourth and Words, respectively, of the Seven Last Words of Christ orchestral work by Joseph Haydn.

    I’m pissed.

    Ever since the announcement late Thursday that the City of Detroit was indeed going to file for Chapter 9 municipal bankruptcy protection, the Internet has been overflowing with commentary on the matter. The commentary has come from all places and taken on by all comers – from the political left and right; from hard news and general interest sources. And all usually with the same scripted and lazy tripe about how Detroit reached its nadir:

    • Single-minded dependence on a collapsing auto industry doomed Detroit.
    • An inability to diversify economically doomed Detroit.
    • Public mismanagement and political corruption doomed Detroit.
    • An inability to effectively deal with its racial matters doomed Detroit.
    • The dramatic and total loss of its tax base doomed Detroit.

    That’s it, people, they seem to reason. The Motor City’s fall from grace is as simple as that. You do the things Detroit did, and you get what Detroit got. You defer decisions just as Detroit did, and you too will suffer the consequences. The speed with which the various articles on Detroit came out proved to me that many writers anticipated the announcement with at least a twinge of glee.

    As I’ve written before, Detroit’s narrative serves everyone else as the nation’s whipping boy, and that came through in the last couple of days:

    You can find Detroit in Cleveland, St. Louis, Buffalo, Milwaukee, Baltimore and Philadelphia. You can find it in Indianapolis, Minneapolis, Cincinnati, Columbus and Louisville. You can find it in Atlanta, Miami, Houston, Dallas and Phoenix. You can even find it in Las Vegas, Seattle, San Francisco and Portland. And yes, you can definitely find it in New York, Chicago, Los Angeles and Washington, DC. You can find elements of the Detroit Dystopia Meme™ in every major city in the country. Yet Detroit is the only one that owns it and shoulders the burden for all of them.

    But let’s leave that aside. I’m pissed because no one seems to acknowledge the central reason Detroit is filing for bankruptcy now. It has endured abandonment – white flight abandonment – on an absolutely epic scale. Before there was auto industry collapse, before there was a lack of economic diversity, before there was mismanagement and corruption, there was abandonment. People skirt and dance around the issue when they talk about the loss of Detroit’s tax base. What Detroit lost was its white people. The chart above illustrates how Detroit’s unique experience when compared to similar cities.

    Detroit is what happens when the city is abandoned. And frankly, there is a part of me that views those that abandoned Detroit with the same anger reserved for hit-and-run drivers – they were the cause of the accident, they left the scene of the crime, and they left behind others to clean up the mess and deal with the pain. What’s worse, so many observers seem to want to implicate those left behind – in Detroit’s case a large African-American majority community – for not cleaning up the mess or easing the pain. Their inflicted pain which they’ve made ours.

    White abandonment of Detroit did not start with the 1973 election of Coleman Young as mayor, or even the 1967 riots, yet those two events accelerated the process. And indeed, Detroit had a very unique set of circumstances that caused it to veer down a troubled path. The very first piece featured in my blog was about the land use and governing decisions that were made more than one hundred years ago in Detroit that literally set the city’s decline in stone. I identified eight key factors:

    • Poor neighborhood identification, or more broadly a poorly developed civic consciousness.
    • A housing stock of poor quality, cheap and disposable, particularly outside of the city’s traditional core.
    • A poorly developed and maintained public realm.
    • A downtown that was allowed to become weak.
    • Freeway expansion.
    • Lack of or loss of a viable transit network.
    • A local government organization type that lacked accountability at the resident/customer level.
    • An industrial landscape that was allowed to constrain the city’s core.

    Conor Friedersdorf of the Atlantic wrote perhaps one of the best recent articles I saw on Detroit when he acknowledged that even a half-century ago, journalists were predicting a dire future for the D. Take this quote Conor found from The Reporter, published October 31, 1957:

    The auto industry created modern Detroit simply as its dormitory and workshop, attracted polyglot millions to it, used it, and now threatens to abandon it. Civic consciousness played little part in the lives of the masses of Irish, German, Poles and Italians who flocked to Detroit in search of a Ford or Dodge or Packard pay check, and who settled there in islands of their own – any more than it played a part in the managements of Ford or Dodge or Packard themselves, or in the crowd of Negroes who also descended upon the city during the boom years of the Second World War… Indeed, it is remarkable that any sense of civic responsibility at all should have been generated in so rootless and transient a community.

    What can a city do when it finds its patron industry and its middle class moving out, leaving it a relic of extremes?… But urban deterioration offers at least one advantage. Once a city core has become as run-down as Detroit’s you can start to rebuild fairly cheaply.

    Yes, that is from 1957.

    The chart at the top of this article was done for an article I did more than a year ago, looking at U.S. Census data for several peer cities over the last seven decennial censuses. In it, I concluded that Detroit’s experience of abandonment was entirely unique:

    Between 1950 and 1970, the decline in Detroit’s white population was on the low end of the spectrum of cities on this list, but it was in the ballpark. Prior to 1970, Detroit and St. Louis were the white flight laggards. After 1970, the bottom fell out and Detroit stood alone. While there certainly are economic reasons white residents may have had for moving, this graph may lend credence to the twin theories of Motor City white flight – the 1967 riots and the 1973 election of Mayor Coleman Young.

    I’m not trying to persuade anyone of the invalidity of their decision to move from Detroit. There were good reasons and not so good reasons. I’m only trying to describe its impact relative to other cities. And where exactly are those white residents who left over the last 60 years? Certainly many have passed on. Some are currently in the Detroit suburbs or elsewhere in Michigan. Some are part of that great Detroit Diaspora that took them to New York, Washington, Charlotte, Atlanta, Houston, Phoenix, Los Angeles, Seattle and Portland. There are clearly at least 1.5 million reasons why white residents left Detroit.

    But the fact is, had Detroit experienced white flight at the same combined rate as the other cities on this list, and not experienced any other changes, there would be nearly 350,000 more white residents today. Maybe 140,000 more households. Maybe more stable neighborhoods.

    Can you imagine that? An additional 350,000 residents means Detroit would still be a city with more than one million people. It would likely be viewed in the same way that a Philadelphia or Baltimore is now – challenged but recovering – instead of the urban dystopia it’s widely seen as today. What impact would that have had on the city’s economy? On the metro area’s economy? On the state’s economy? Or simply the city’s national perception?

    I’ve mentioned here on several occasions that the reason I chose the planning profession is because I grew up in Detroit during the 1970s. I looked around and saw a city with an inferiority complex and saw people leaving in droves. My naïve and childish thinking was, “instead of leaving the city, why don’t people stay and work to make it better?”

    Silly of me. Abandonment is the American way.

    Nonetheless, I view Detroit’s bankruptcy announcement positively. It acknowledges that its troubles are far deeper than most realize. It can be the springboard for fiscal recovery, a re-imagining of the city and an actual and complete revitalization. Detroit indeed is in uncharted waters, and its abandonment means that in many respects it could be viewed as a frontier city once again. I would not be surprised if, after restructuring and reorganization, after recapturing its innovative spirit, the city could see growth almost like it did at the beginning of the twentieth century, mimicking what, say, Las Vegas has done for the last 40 years. Even at this dark moment, Detroit has assets that are the envy of other cities.

    But let no one forget that it is abandonment that brought Detroit to this point.

    This piece originally appeared at The Corner Side Yard.

    Pete Saunders is a Detroit native who has worked as a public and private sector urban planner in the Chicago area for more than twenty years.  He is also the author of "The Corner Side Yard," an urban planning blog that focuses on the redevelopment and revitalization of Rust Belt cities.

  • What Detroit’s Bankruptcy Teaches America

    As has long been expected, the city of Detroit has officially filed for bankruptcy.  While many will point to the sui generis nature of the city as a one-industry town with extreme racial polarization and other unique problems, Detroit’s bankruptcy in fact offers several lessons for other states and municipalities across America.

    The Day of Reckoning Can Take Much Longer Than We Think to Come

    What’s most surprising about Detroit’s bankruptcy is not that it happened, but how long it took to get there. In authorizing the bankruptcy filing Gov. Rick Snyder talked about “60 years of decline.” He’s not joking. It’s been widely known that Detroit has been in trouble for a very long time.

    Time Magazine ran a 1961 story called “Decline in Detroit.”  Jane Jacobs described its lack of vitality in her 1961 classic “The Death and Life of Great American Cities”:

    Researchers hunting the secrets of the social structure in a dull-gray district of Detroit came to the unexpected conclusion there was no social structure….Virtually all of Detroit is as weak on vitality and diversity as the Bronx. It is ring superimposed upon ring of gray belts. Even Detroit’s downtown itself cannot produce a respectable amount of diversity. It is dispirited and dull, and almost deserted by seven o’clock of an evening….Detroit today is composed of seemingly endless miles of low density failure.

    Moving from urban planning to economics. She wrote in 1969’s “The Economy of Cities”:

    This was the prosperous and diversifying economy from which the automobile industry emerged two decades later to produce the last of the important Detroit exports and, as it turned out, to bring the city’s economic development to a dead end.

    These are both well known, but the record of troubles in Detroit even predates this, going back at least to Life Magazine’s 1942 article “Detroit Is Dynamite” which gave a prescient warning to the city just a year before 1943’s race riot.

    For a city as uniquely troubled as Detroit to remain in serious decline for such an extended period of time before going bankrupt is a testament to the sheer resilience of cities. It also suggests that those predicting eminent doom for their own city unless it changes its ways are likely to end up as false prophets.

    Indeed, Detroit’s day of reckoning may not even yet be fully given that various challenges to the bankruptcy filing are expected. The fact that Detroit has limped along for so long suggests that cities may be able to survive nearly definitely as “zombie municipalities” similar to zombie banks. Though this may possibly end a Greek style crisis at some point, a very lengthy existence as the undead would seem to be possible.

    Decline Poisons Civic Culture and Sunders the Commonwealth

    Detroit also illustrates that once decline starts it sets in motion a toxic civic dynamic that makes the tough choices needed to turn things around nearly impossible. Just as growth begets growth, decline begets decline, and part of the reason is social dynamics.

    This comes about because in a city in decline – such as in late imperial Rome –people start thinking only about themselves and no longer come to see themselves as part of a greater enterprise or commonwealth. The city and suburbs, blacks and whites, taxpayers and unions no longer see their fortunes as linked. Rather than rising and falling together, it’s every man for himself.

    When the pie is growing, it’s easy to come to an agreement over how to divide it because everybody can get a bigger slice at the same time. But when the pie is stagnant or shrinking, zero-sum thinking takes over. To make a sacrifice is seen to in effect allow someone else to profit at your expense. Perhaps these dynamics were present latently before, but tough times bring out the real civic character.

    In Detroit’s case everyone from public employee unions who refuse to give up any of their benefits (and will no doubt fight to deny the bankruptcy filing) to suburban towns that would rather pretend the city does not exist have played a role in setting the disaster. With nobody willing to sacrifice for the greater good, prisoner’s dilemma logic results happen. You can see this playing out in nearly any troubled American city. By contrast, it seems to be healthier places like Denver that have managed to build stronger regional civic consensus. It’s simply easier in those places.

    Instead, Detroit chased conventional wisdom approaches and fad of the month type endeavors ranging from constructing the fortress-like Renaissance Center to the People Mover to former Gov. Jennifer Granholm’s “Cool Cities” program, none of which did anything but generate hype. What they all had in common is a transfusion of subsidies to the city (and taking on debt) rather than building a consensus around addressing the real issues.

    America Doesn’t Learn Lessons From the Past

    The last thing Detroit teaches us is that America too often doesn’t learn from its mistakes. Detroit’s troubles have been evident for quite some time, yet it’s hard to see that many other post industrial cities have managed to carve out a different path. Rather, they pretended that Detroit’s civic was somehow unique due to its auto industry dependence – and managed to ignore other failed cities as well – while embarking on the same turnaround strategy via conventional wisdom and silver bullets.

    They have even managed to ignore failures much closer to home. Booming new suburbs can look just 5-10 miles down the road to see yesterday’s hot spot now turned into a festering mess of dead and dying malls, declining schools, increasing poverty, and falling home prices. Yet most of them are simply replicating the same pattern that is destined to fail financially over the long term in any region without either severe building restrictions or very high population growth.

    Sadly, none of these augur favorably for change. Detroit may continue to garner special international attention as a train wreck people can’t stop watching, but less spectacular slow motion civic failures seem likely to remain commonplace unless somebody finds a way to overcome these forces.

    Aaron M. Renn is an independent writer on urban affairs and the founder of Telestrian, a data analysis and mapping tool. He writes at The Urbanophile.

    Photo by Kate Sumbler.

  • Suicide: Sprawl Not Guilty

    Atlantic Cities reports on research indicating an association between suicide and lower density, in an article entitled “The Unsettling Link Between Sprawl and Suicide.” Actually, there’s no reason to be unsettled, at least with respect to urban areas and their densities. The conclusions apply to rural areas, not urban areas.

    Above the 300 persons per square kilometer, or 780 persons per square mile, the authors found no association. The authors of the study note, “above this threshold … the suicide rate remains fairly constant."

    The US Census Bureau standard for urbanization is 1000 people per square mile or more, which is similar to the international standard of 400 persons per square kilometer. Even the suburbs of extremely low-density Atlanta and Charlotte have to reach the 1,000 persons per square mile threshold to be in the urban areas.

    This research, while interesting, has nothing whatever to do with the urban form.