Category: Suburbs

  • Falling In Love With Where You Are

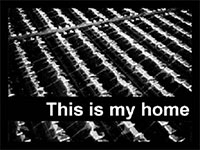
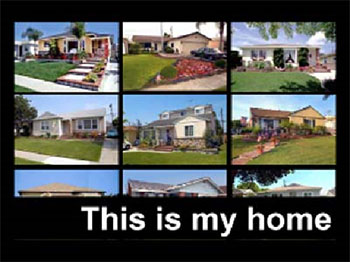
    Where I live is where most Californians live: in a tract house on a block of more tract houses in a neighborhood hardly distinguishable from the next, and all of these houses extending as far as the street grid allows.

    My exact place on the grid is at the southeast corner of Los Angeles County, between the Los Angeles and San Gabriel rivers. But my place could be almost anywhere in the suburbs of Los Angeles and Orange counties.

    My suburb may seem characterless, but it has a complex history of working class aspiration, of assumptions about social hygiene, of urban politics, and the decisions of many who imposed their imagination on the landscape.

    Where I live is a tract of wood-framed houses on a 5,000-square-foot lot at a density of about seven units per acre, where houses are set back 20 feet from the sidewalk and a street tree the city trims, and where neighborhood businesses are clustered at intersections so that anyone can walk to the store or a bar or to a fast food place.

    It’s also a place with 10 parks of 20 or more acres each so that everyone is about a mile from supervised open space with playgrounds, ball diamonds, picnic tables, and bar-b-cues.

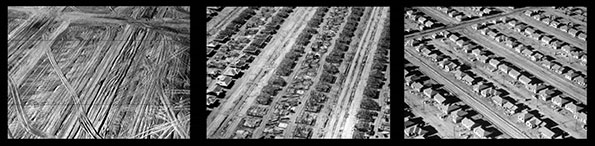
    There is a persistent belief that suburban places like mine must be awful places they must be inhuman and soul-destroying places. That belief persists partly because of these photographs, taken by a brilliant young aerial photographer named William Garnett who worked for the developers of Lakewood between 1950 and 1952.

    The historian and social critic Lewis Mumford used Garnett’s photographs in 1961 to indict the post-war suburbs which, he said, had become “A multitude of uniform unidentifiable houses, lined up inflexibly at uniform distances on uniform roads, in a treeless command waste inhabited by people of the same class, the same incomes, the same age group, witnessing the same television performances, eating the same tasteless prefabricated foods, from the same freezers … .Thus the ultimate effect of the suburban escape in our time is, ironically, a low grade uniform environment from which escape is impossible.”

    The architectural historian Peter Blake used these photographs in 1964 to define the post-war suburbs as “God’s own junkyard.”

    In 1969, Garnett’s photographs were part of Nathaniel Owings’s The American Aesthetic, a passionate critique of 20th century urban planning.

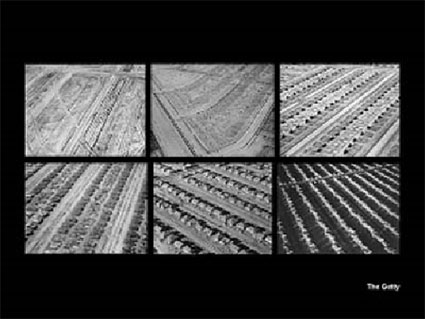
    Today, you can go to the Getty Museum in Brentwood and the Autry National Center in Los Angeles and see these photographs used as defining images of the suburbs of Los Angeles.

    They are beautiful and terrible photographs.

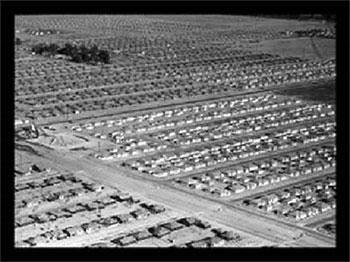
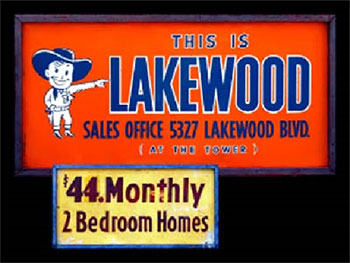
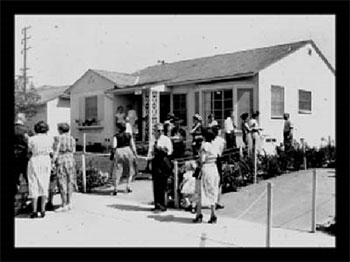
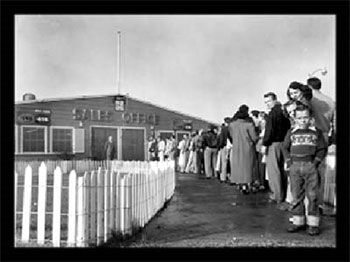
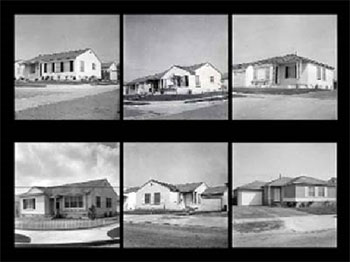
    With no little irony, these images of Lakewood became emblematic of the suburbs at the moment when Lakewood no longer was the eerie and empty place Garnett had photographed only a few months before. Between 1950 and 1953 – in less than 33 months – 17,000 houses had been built, sold, and made someone’s home. Nearly 100,000 people lived there, including my parents. In 1954, Lakewood had even become a city in the political sense, having completed the first municipal incorporation in California since 1939.

    Listen to Lakewood Blvd by Sara Lindsay

    We can presume that the developers of Lakewood – Mark Taper, Ben Weingart, and Louis Boyar – saw Garnett’s photographs mostly as a record to be filed with work logs and construction accounts when the project ended. But I also imagine that they looked at Garnett’s photographs and read into them a grandeur, a collective heroism that still attaches itself to the great construction projects of the 1930s and 1940s.

    And we know that Boyer, Taper, and Weingart and Fritz Burns and Joseph Eichler and Henry Kaiser understood that the Progressive era model of low-cost housing they had adapted to mass production would result in new relationships to the idea of place. Garnett’s photographs of deeply shadowed forms on a titanic grid would for some critics and many Americans permanently define that relationship as dread.

    In a memorable speech by James Howard Kunstler at the 1999 Congress for the New Urbanism, the kind of place where I live was described as a perversion of a place. “It is the dwelling place of untruth,” Kunstler told the New Urbanists. The title of his speech was “The place where evil dwells.”

    My parents and their neighbors more generously than Mumford or Blake or Kunstler understood what they had gained and lost in owning a small house on a small lot in a neighborhood connected to square miles of just the same.

    Despite everything that was mistaken or squandered in making my suburb, I believe a kind of dignity was gained. More men than just my father have said to me that living in my kind of place gave them a life made whole and habits that did not make them feel ashamed.

    As far as I could tell by their lives, my parents did not escape to their mass-produced suburb. They never considered escaping from it. Nor have I.

    I’ve lived my whole life in the 957-square-foot house my parents bought when the suburbs were new, when no one could guess what would happen after tens of thousands of working-class husbands and wives – so young and so inexperienced – were thrown together without an instruction manual and expected to make a fit place to live.

    What happened after was the usual redemptive mix of joy and tragedy.

    The suburb where I live is a place that once mass-produced a redemptive future for displaced Okies and Arkies, Jews who knew the pain of exclusion, Catholics who thought they did, and anyone white with a job. Left out were many tens of thousands of others: people of color whose exclusion was not just a Californian transgression.

    Today, futures still begin here, except the anxious, hopeful people who seek them are as mixed in their colors and ethnicities as all of southern California.

    I continue to live in Lakewood with anticipation because I want to find out what happens next to new narrators of suburban stories who happen to be my Latino, black, Filipino, Chinese, Korean, and Vietnamese neighbors.

    There are Californians who don’t regard a tract house as a place of pilgrimage, but my parents and their friends did. They were grateful for the comforts of their not-quite-middle-class life. Their aspiration wasn’t for more but only for enough despite the claims of critics then and now who assume that suburban places are about excess.

    I actually believe that the place where I live is, in words of the Californian philosopher Josiah Royce, a “beloved community.” The strength of that regard, Royce thought, might be enough to form what he called an “intentional community” – a community of shared loyalties – even if the community is as synthetic as a tract-house suburb or the Gold Rush towns that Royce knew in his boyhood. I believe Royce was right: At a minimum, loyalty to the idea of loyalty is necessary, even if the objects of our loyalty are uncertain.

    Urban planners tell me that my neighborhood was supposed to have been bulldozed away years ago to make room for something better, and yet the houses on my block stubbornly resist, loyal to an idea of how a working-class neighborhood should be made.

    It’s an incomplete idea even in Lakewood, but it’s still enough to bring out 400 park league coaches in the fall and 600 volunteers to clean up the weedy yards of the frail and disabled on Volunteer Day in April and over 2,000 residents to sprawl on lawn chairs and blankets to listen to the summer concerts in the park.

    I don’t live in a tear down neighborhood, but one that makes some effort to build itself up. All this is harder now, for reasons we all know.

    The suburbs aren’t all alike, of course, and there are plenty of toxic places to live in gated enclaves and McMansion wastelands. Places like that have too much – too much isolation and mere square footage – but, paradoxically, not enough. Specifically, they don’t have enough of the play between life in public and life in private that I see choreographed by the design of my suburb.

    With neighbors just 15 feet apart, we’re easily in each other’s lives – across fences, in front yards, and even through the thin, stucco-over-chicken-wire of house walls. When I walk out my front door, I see the human-scale, porous, and specific landscape into which was poured all the ordinariness that has shaped my work, my beliefs, and my aspirations. Out there, I renew my “sense of place” and my conviction that a “sense of place,” like a “sense of self,” is part of the equipment of a conscious mind.

    We often find it difficult to talk coherently about these issues or to make coherent policy choices for places to which our loyalty is only lightly attached.

    It seems to me that the abiding problem of southern California indeed of the entire West is the problem of home. We long for a home here, but doubt its worth when we have it. We depend on a place to sustain us, but dislike the claims on us that places make. Each of us is certain about our own preference for a place to live, but we’re always ready to question your choice.

    How do we make our home here, in new and sudden and places like Lakewood, like Irvine, like Santa Clarita? We’ve been asking that question for a very long time sometimes in despair. At almost the beginning of California, a disillusioned 49er named Thomas Swain wrote in 1851, “Large cities have sprung into existence almost in a day. . . The people have been to each other as strangers in a strange land ….”

    And too many of us are strangers still in a place that too many regard as uniquely perverse. And because much of southern California looks roughly the same too many of us see all these suburban places as aesthetically, politically, and morally perverse as well. And no place – however well crafted – is immune from the peculiarly American certainty that something better – something more adequate to the demands of our desire – is just beyond the next bend in the road.

    The question of “home” is increasingly acute because there’s hardly anywhere left to build another Lakewood or Irvine or Santa Clarita.

    The closing of the suburban frontier in southern California ends a 100-year experiment in place making on an almost unimaginable scale. The experiment was based on a remarkably durable consensus about the way ordinary people ought to be housed, beginning with turn-of-the-century beliefs about the power of a “home in its garden” to ameliorate the lives of working people and ending in the 1950s with tract houses turned into an affordable commodity.

    Today, most of southern California is what it will continue to be: uniformly dense and multi-polar, urbanized in fact but suburban in appearance, characterized by single-family homes in neighborhoods with a strong – but provisional – dependence on more “urban-like” nodes.

    This is a form for living and working, but it is neither “incoherent” nor “mindless sprawl.” That form in the future will, of course, be somewhat more dense – but our evolving suburbs cannot deliver mere density. In tandem with greater concentration of housing types must come what working-class people have always sought in southern California: a home with enough private space around it and enough public space adjacent to it so that this assemblage of house, lot, street, and transportation grid form the neighborhood-specific space that answers our desires.

    We can lament that too many suburban places are less than they some wish them to be, but I see no perfect way to bring “utopias” out of these suburban habits both good and bad. I see only a persistent longing to make fit places in which to live.

    Many of these places will look an awful lot like Orange County – dispersed, uniformly dense, and embedded in a metropolitan region in which historic downtowns function as “nodes.” The contest for the soul of our suburban region hinges on whether this constitutes enough to make a place where memories might be unblighted and desires assuaged.

    The author and environmentalist Barry Lopez considered some years ago what might be needed to make a durable life for ourselves in southern California. And in considering the problem of home, Lopez asked a challenging question: “How can we become vulnerable to the place where we live?”

    If that might be a goal if that tenderness were possible we might ask different questions when we build or approve a development project. We could ask, "What aspects of its design encourage loyalty to this place? What is built into this place that might evoke someone’s sympathy? Would anyone ever become vulnerable to this place?”

    What I have been speaking of is the acquisition something more than an idiosyncratic sensibility but a communal achievement that requires something from all of us. Built-out, maximally diverse, and more grown up, southern California requires courage to extend one’s imagination across its whole, tragic, human, and humanizing body.

    As for me, my suburb’s modesty keeps me there. When I stand at the head of my block, I see a pattern of sidewalk, driveway, and lawn, set between parallel low walls of house fronts that aspires to be no more than harmless. We live in a time of great harm to the ordinary parts of our lives and I wish that I had acquired all the resistance that my neighborhood offers.

    What I hope we might gain is a larger “moral imagination” … the imagination by which we might write ourselves into the story of our place and negotiate a way from the purely personal to the public.

    I don’t really know how (or perhaps I do only dimly). But faithfulness to what can be found in our history – to what can be found in our shared stories – impels me forward.

    It may surprise you to learn the object of Lopez’s meditation on vulnerability was the place where he grew up – a tract house neighborhood in the San Fernando Valley. And Lopez had this additional insight while contemplating his Valley home. He wrote . . . “Always when I return there, I have found again the ground that propels me past the great temptation of our time to put one’s faith in despair.”

    Despair or regret: “There once was a perfect Eden,” the conventional story goes, “to which gullible people were lured and as a result this Edenic place declined into the horrors of suburbanization.” And the moral of that story is “people ruin places.”

    I believe that people and places form each other … the touch of one returning the touch of the other. What we seek, I think, is tenderness in this encounter, but that goes both ways, too. I believe that places acquire their sacredness through this giving and taking. And with that ever-returning touch, we acquire something sacred from the place where we live. What we acquire, of course, is a home.

    It’s a question of falling in love … falling in love with the place where you are; even a place like mine … so ordinary, so commonplace, and my home.

    # # #

    D. J. Waldie is a contributing editor at the Los Angeles Times and a contributing writer for Los Angeles magazine. He is the author most recently of California Romantica with Diane Keaton. He blogs for KCET TV at http://www.kcet.org/user/profile/djwaldie.

  • Suburbs and Sacred Space

    Suburbs are often unfairly maligned as lacking the qualities that make cities great. But one place that criticism can be fair is in the area of sacred space. There most certainly is sacred space in the suburbs, but usually less of it than in the city both quantitatively and qualitatively.  In fact, the comparative lack of sacred space is one of the distinguishing characteristics of the suburb that makes it “sub” urban, that is, in a sense lesser than the city.

    Lewis Mumford put it this way:

    Behind the wall of the city life rested on a common foundation, set as deep as the universe itself: the city was nothing less than the home of a powerful god. The architectural and sculptural symbols that made this fact visible lifted the city far above the village or country town….To be a resident of the city was to have a place in man’s true home, the great cosmos itself.

    Mumford was onto something here in positing how great temples and such distinguished the city as unique.

    What Is Sacred Space?

    Mumford also hints at what makes something truly sacred space. We should clearly distinguish between what is merely public space and truly sacred space. The key to sacred space is the linkage to the transcendent.  That is, sacred space connects us to something beyond or bigger than our surroundings, our present existence, and even ourselves.

    Here are three ways sacred space can do that. It can:

    1. Connect us to a larger spiritual or religious reality, as in our Mumford example.  This is the most obvious case.
    2. Serve as a locus or repository of the culture and traditions of a people.
    3. Be a temporal connection between the present and the past and/or the future.

    As one example, consider the Indiana World War Memorial in downtown Indianapolis.

    This building is of course a symbol of the bedrock American values of that community and the willingness of its people to die to defend them yesterday, today, and tomorrow. Thus it is both a cultural repository and a temporal linkage.

    Also note the use of neoclassicism. The use of neoclassical architecture anchors Indianapolis and Indiana firmly within the 2,500 year history of Western Civilization, as a link in a chain of peoples connected by shared, timeless values and extending backwards and forward throughout time, thus achieving a sort of immortality.  This building is a statement of the permanence of this community, its people, and their values.

    We can also think of a radically different space such as Times Square, and how it has played host to so many civic celebrations and traditions over the years such that it has become not just a local but a national repository of our culture. The ball dropping on New Year’s Eve is an obvious example. But consider also this iconic photo.

    This is one of the most famous pictures from the war era and I don’t think it’s any surprise it was taken Times Square.

    How Suburbs Are Comparatively Lacking in Sacred Space

    Let’s apply the definition of sacred space to the suburbs. Yes, suburbs do have war memorials and culture and traditions and churches, but in general these are qualitatively different from what is found in the city core.  Here are three reasons why.

    1. Suburban traditions and spaces are often ephemeral and generational. When I was in high school, everybody liked to go to a place called Down Home Pizza in Corydon on the weekends. And that was something kids from every high school in the area did, not just those from mine. Today that place is long gone. And the kids are doing something else, whatever that may be.  In fact, it’s amazing how many of the places and traditions from my high school days are already gone after only 25 years because of physical and economic changes in the community such as restaurants and stores going out of business.

    This happens in the city too, like when the department stores went under, taking their white-gloved tea rituals and the like with them. But to a much greater extent than the city, suburbs rely on commercial establishments as focal points of shared experience, and by their very nature those tend to come and go. And suburbs have not to nearly as a great a degree established truly trans-generation rituals and spaces.

    2. Lack of transcendent scale. This is also something Mumford hints at. The “human scale” is a big buzzword in urbanism today. Contrary to what many say, the suburbs actually do a pretty good job of the human scale, especially from an automobile era perspective. But a unique essence of urbanity and often of transcendent experience itself is what we might call the “anti-human scale.” British writer Will Wiles put it this way:

    The “human scale” only tells part of the story of the city – after all, this can be found in villages and small towns. All cities need sublimity, a touch of holy terror, a defiance of human scale that asserts connection to the greater urban whole.

    The sheer scale of something like the Indiana War Memorial, which is a very imposing structure inside and out, renders it qualitatively different that your average small scale suburban memorial. This is true not just physically but also in terms of the humanity represented. That memorial stands for an entire state, not just a single town. Which is the same reason there may be more suburban school kids who have visited their state capital or the US Capitol than their local village hall.  There’s a reason the US Capitol and Lincoln Memorial and such have such powerful resonance. They represent an entire nation and a vast sea of humanity. Cities also participate in this scale effect.

    3. Low quality religious architecture. When it comes to the most obvious category of sacred space, the religious building, the suburbs also fall flat. That’s because Protestant Christianity, the largest suburban religious strain, has itself become unmoored from the transcendent. This is clear, for example, from the rise of what has been dubbed “Moralistic Therapeutic Deism” as a dominant worldview, especially among the young.

    The average suburban megachurch is an architectural horror show. The best of them generally rise to the level of an upscale corporate conference center. The worst are like “That 70’s High School”.

    Someone once said that all sin results from failing to believe one of the “4 G’s” about God, namely, God is great, God is good, God is gracious, and God is glorious. Applying that to religious life generally, in modern Evangelical churches, God may be very good and gracious, but He’s doesn’t seem all that great, and He’s certainly not very glorious.  This is religion that can inspire good works, but not great ones. There’s no trace of the overwhelming glory of God in nearly any of these structures. There’s no longer a faith like the Lutheranism of Johann Sebastian Bach that can inspire the greatest works of human artistic achievement.  Because modern suburban church architecture is so poor and so disposable, it diminishes the impact of sacredness in the space.

    The recent stories about the sale of Orange County’s Crystal Cathedral, designed by Philip Johnson, brings to mind an exception that proves the rule.

    Unsurprisingly it was the Catholic Church that bought it. Unlike Protestantism, Catholicism has always had a theology of place. And they’ve always used architecture and art as a way of telling the story of the gospel. Though obviously not in this case, they’ve also used Gothic sort of like neoclassical architecture as a way creating a sense of permanence and linkage to an everlasting, eternal church.

    So sacred space is one area where the suburbs really are deficient versus the city. But how important is this? Metropolitan areas today are mosaics. In an ever more complex and competitive global economy, every part of a region, city and suburb, needs to know its role on the team and bring it’s A-game. Just as there’s no need for every job to be located downtown, there’s no need for every major piece of sacred space in a region to be replicated in every suburb. Downtown does just nicely. However, this is one reason that while economically the core may no longer dominate a region, a healthy center still plays a key role in overall regional vitality. That’s because it remains home to things like the major pieces of sacred space such as war memorials and cathedrals that bind a region together and give it civilizational permanence, meaning, and purpose beyond the mundane.

    This article was adapted from remarks at the No Place Like Home conference on June 3, 2013 in Anaheim, CA.

    Aaron M. Renn is an independent writer on urban affairs and the founder of Telestrian, a data analysis and mapping tool. He writes at The Urbanophile.

    Suburbs photo by Bigstock.

  • Retrofitting the Dream: Housing in the 21st Century, A New Report

    This is the introduction to "Retrofitting the Dream: Housing in the 21st Century," a new report by Joel Kotkin. To read the entire report, download the .pdf attachment below.

    In recent years a powerful current of academic, business, and political opinion has suggested the demise of the classic American dream of home ownership. The basis for this conclusion rests upon a series of demographic, economic and environmental assumptions that, it is widely suggested, make the single-family house and homeownership increasingly irrelevant for most Americans.

    These opinions — which we refer to as ‘retro-urbanist’ — gained public credence with the collapse of the housing bubble in 2007. The widespread media reports of foreclosed housing in suburban tracts, particularly in the exurban reaches of major metropolitan areas, led to widespread reports of the “death of suburbia” and the imminent rise of a new, urban-centric “generation rent.”

    Yet despite this growing “consensus” about the future of housing and home ownership, our analysis of longer-term demographic trends and consumer preferences suggests that the “dream,” although often deferred, remains relevant. We see this in the strength of suburbs, as well as in the growth of the post-war “suburbanized cities” that generally have been the fastest growing regions of the country. These trends are notable in the three key demographic groups that will largely define the American future: aging boomers, immigrants, and the emerging millennial generation.

    This does not mean that suburbia, or home construction patterns, will not change in the coming decades. Higher energy prices, for example, could necessitate shorter commutes, even with automobile fuel efficiency improvements. The emerging concentration of employment centers could help bring this about by improving job housing balance. There is a need to fully make use of the high speed digital communication that can promote both dispersed and home-based work.

    For these and other reasons McKinsey & Company, among others, has noted that meeting environmental challenges does not require the kind of radical alteration of lifestyles and aspirations so widely promoted in the media, academia, and among some real estate interests. Equally important, there has been little consideration of the profound economic and social benefits of both home ownership and low to medium density living. These include, on the economic side, the huge impact on employment from home construction and the ancillary industries associated with household upkeep and improvement.

    More important still may be the social benefits. Most serious studies have shown that lower-density, homeowner-oriented communities are more socially cohesive in terms of volunteerism, neighborly relations, and church attendance, than denser, renter-oriented communities. Suburban and lower density urban neighborhoods are particularly critical for the growth of families and the raising of children, an increasingly important factor in a ‘post-familial’ era of plunging birthrates.

    To be sure, housing has been changing rapidly from the model developed in the 50s, and this process will continue over the next generation. Houses today are more energy efficient, and look to accommodate home-based work, as well as extended, multigenerational families. Similarly, the suburbs and low/mid density urban communities are already far more diverse, in terms of ethnicity and age profile, than the homogeneous communities often portrayed in media and academic accounts. This trend is also likely to accelerate.

    Ultimately, we believe that the dream is not at all dead, but is simply evolving. America’s tradition of property ownership, privacy, and the primacy of the family has constituted a critical aspect of our society since before the nation’s founding. It will need to remain so in the decades ahead if the country is to prove true to the aspirations of its people and the sustainability of its demographics.

    Joel Kotkin is executive editor of NewGeography.com and a distinguished presidential fellow in urban futures at Chapman University, and a member of the editorial board of the Orange County Register. He is author of The City: A Global History and The Next Hundred Million: America in 2050. His most recent study, The Rise of Postfamilialism, has been widely discussed and distributed internationally. He lives in Los Angeles, CA.

  • Market Surge Confirms Preference for Homeowning

    Ever since the housing bubble burst in 2007, retro-urbanists, such as Richard Florida, have taken aim at homeownership itself, and its “long-privileged place” at the center of the U.S. economy. If anything, he suggested, the government would be better off encouraging “renting, not buying.”

    Similar thinking has gained currency with some high-rise (or multi-unit) builders, speculators and Wall Street financiers, who would profit by keeping Americans permanent renters, with encouragement from former Morgan Stanley financial analyst Oliver Chang, who predicted we were headed toward a “rentership society.”

    Some support comes from research suggesting that higher ownership rates actually create unemployment. A study by the proausterity Peterson Institute for International Economics, cited recently both by Florida and the New York Times’ Floyd Norris, lays out an econometric case against homeownership.

    The authors justified their findings by pointing to larger unemployment-rate changes from 1950-2010 in states, mostly in the South, such as Alabama, Georgia, Mississippi, South Carolina and West Virginia, compared with California, North Dakota, Oregon, Washington and Wisconsin. They then noted that, in the states with the larger unemployment rate increases, homeownership had increased more. Hence, the connection between higher homeownership and higher unemployment rates.

    This analysis is staggeringly ahistorical. It fails to correct for the massive labor market changes that have occurred in the Southern states, as the agricultural and domestic employment common in 1950 has largely disappeared. The analysis begins with a year in which three of the states cited to prove that lower homeownership is associated with lower unemployment had unusually high unemployment in 1950 (California was No. 1, Oregon, No. 4, and Washington, No. 6); unemployment in these three West Coast states averaged nearly double that of the Southern examples.

    Another ahistorical implication is that that the South experienced a huge increase in homeownership since 1950, as economically disadvantaged African-Americans began to buy their residences. An analysis by demographer Wendell Cox indicates that, even as labor markets were being radically altered, per capita incomes in relatively underdeveloped Alabama, Georgia, Mississippi, South Carolina and West Virginia rose during 1950-2010 at more than double the rate experienced in California, North Dakota, Oregon, Washington and Wisconsin (more than 140 percent, adjusted for inflation, compared with approximately 65 percent).

    The Peterson thesis is also undermined by a close examination of county homeownership and unemployment rates, which finds, generally, that large counties with higher rates of homeownership have lower unemployment rates. For example, among the nation’s approximately 260 counties with more than 250,000 residents, those with homeownership rates above 70 percent have average unemployment rates of 8.1 percent. Among the counties with homeownership rates below 50 percent, unemployment rates average 9.6 percent. This is exactly the opposite relationship that would be expected from the Peterson Institute research.

    Finally, many large urban counties with the lowest homeownership rates – Los Angeles, Kings County (Brooklyn), New York County (Manhattan), Queens, Cook County (Chicago) and Philadelphia – also suffer well-above-average levels of unemployment and high levels of poverty. In contrast, suburban counties with high homeownership rates, like Nassau County, N.Y., Chester County (in the Philadelphia area), or Fairfax County, Va., boast considerably lower unemployment than their urban neighbors, and higher per-capita incomes. Most of the cities with the highest ownership rates, like Fort Worth and Austin, Texas, Indianapolis, Denver and Columbus, Ohio, all did very well in the most recent Forbes “Best Cities for Jobs” study.

    It is also alleged that countries with high ownership rates do worse than those with lower ones. And to be sure, troubled countries like Portugal and Spain have high levels of homeownership, while Germany, Sweden and Denmark have somewhat lower ones. Yet, many successful countries – Taiwan, Singapore, Norway, Australia, Canada and Israel – actually do quite well with higher ownership rates than in America.

    Dream that refuses to die.

    From a historic perspective, the present U.S. homeownership rate, 65.4 percent, does not represent a structural decline from the middle 2000s, as is often argued, but remains consistent with the virtual equilibrium achieved over the past half century. As recently as 1940, only 40 percent of Americans owned their homes, a share that reached 60 percent by 1960s. Since then, it has remained fairly stable. The modest decline from the middle 2000s was from an artificially high level that resulted from the virtual suspension of mortgage credit standards – egged on by Wall Street and government agencies – which was followed by a deep recession and a weak recovery.

    The housing bust changed the market, but not because of some fundamental shift in buyer preferences, as is sometimes alleged. Indeed, the recent spike in home sales confirms that Americans continue to aspire to homeownership. Research at the Woodrow Wilson Center indicated that 91 percent of respondents identified it as essential to the American Dream, and most favored steering government policy to spur homeownership.

    Much has been written about how the under-30 population is either living at home or cannot buy a house. Yet, surveys by generational chroniclers Morley Winograd and Mike Hais found that a full 82 percent of adult millennials surveyed said it was “important” to own their own home, which rose to 90 percent among married millennials. Another survey, this one by TD Bank, found that 84 percent of renters ages 18-34 intend to purchase a home in the future.

    Homeownership achieves almost cultish status among immigrants, who account for some 40 percent of all new owner households over the past decade. Among Asians who entered the country before 1974, a remarkable 81 percent own their home, while Latino homeownership is projected to rise to 61 percent by 2020.

    Societal advantages of owning

    Critics of homeownership often point out that renters have far more flexibility to move; that’s true and important particularly for people in their 20s. But, as people age, get married and, especially, have children, they seek to become involved in their communities on a more permanent basis. Pundits and economists often fail to recognize that people are more than simply profit-maximization machines ready to cross the country for an income increase of a few thousand dollars; they also seek out friends, stable neighbors, familial comfort, community and privacy.

    Homeowners reap the financial gains of any appreciation in the value of their property, so they tend to spend more time and money maintaining their residence, which also contributes to the overall quality of the surrounding community. The right to pass property to an heir or to another person also provides motivation for proper maintenance.

    Given their stake, homeowners participate in elections much more frequently than renters. One study found that 77 percent of homeowners had, at some point, voted in local elections, compared with 52 percent of renters. The study also found a greater awareness of the political process among homeowners. About 38 percent of homeowners knew the name of their local school board representative, compared with 20 percent of renters. The study also showed a higher incidence of church attendance among homeowners.

    People who own their homes also tend to volunteer more in their community, notes the National Association of Realtors. This applies to the owners of both expensive and modest properties. One 2011 Georgetown study suggests that homeownership increases volunteering hours by 22 percent.

    Perhaps the largest social benefits relate to children. Owners remain in their homes longer than do renters, providing a degree of stability valuable for children. Research published by Habitat for Humanity identifies a number of other advantages for children associated with homeownership versus renting, ranging from higher academic achievement, fewer behavioral problems and lower incidence of teenage pregnancy.

    ‘A share in their land’

    Even before the American Revolution, the notion of ownership, usually of a farmstead, was a critical lure. Even after the yeoman utopia of the early 19th century faded, Americans continued to yearn for their own homes, something that led them in two great waves, first in the 1920s and again in the 1950s and 1960s, to the suburban periphery.

    In contrast to today’s progressives, many traditional liberals embraced the old American ideal of dispersed land ownership. “A nation of homeowners,” President Franklin D. Roosevelt believed, “of people who own a real share in their land, is unconquerable.”

    Legislation under Roosevelt and successor presidents supported this ideal. More than a response to the market, governments embraced homeownership as a positive societal and economic good for the majority of Americans. This policy – brilliantly exploited by entrepreneurs – worked for both people and the economy. Almost half of suburban housing, notes historian Alan Wolfe, depended on some form of federal financing.

    Road to serfdom?

    The suggestion that we need to abandon what the New York Times denounces as the “dogma on owning a home” has grown deeply entrenched among retro-urbanists. Rather than facilitate the broad dispersion of property ownership across economic classes, the new orthodoxy suggests we would be better off as a nation of renters, living cheek-to-jowl in apartments. This works to the advantage of the Wall Streeters and other investors, who profit from our paying off their mortgages rather than our own. The assault on homeownership also pleases some advocates of austerity, such as Pete Peterson, who would like to eliminate the mortgage interest deduction as a way to raise revenue at the expense of the middle class.

    Turning against homeownership undermines the very promise of American life and the culture of independence critical to our identity as a people. Housing accounts for about two-thirds of a family’s wealth and the vast majority of the property owned by middle- and working-class households. The house represents for the middle class, devastated by the weak recovery, both a chance to make a long-term investment as well as a place to raise a family; a Wall Street portfolio, for all but the very affluent, who can afford the best advice, provides no reasonable alternative.

    We have to consider what kind society we wish to have. The nomadic model now in fashion suggests Americans should simply move from place to place, untethered to any one spot, seeking personal fulfillment and the best financial deal for themselves. Such a model fits with current planning dogma and facilitates a source of profit for some, but undermines the dispersion of property that can sustain our society, and our families, over the long run.

    Joel Kotkin is executive editor of NewGeography.com and a distinguished presidential fellow in urban futures at Chapman University, and a member of the editorial board of the Orange County Register. He is author of The City: A Global History and The Next Hundred Million: America in 2050. His most recent study, The Rise of Postfamilialism, has been widely discussed and distributed internationally. He lives in Los Angeles, CA.

    This piece originally appeared in the Orange County Register.

    Home illustration by Bigstock.
    Update: The Pete Peterson referred to here is not the Pete Peterson running for office in California.

  • Addressing Housing Affordability Using Cooperatives

    Our country is six years into the Great Recession, the biggest economic downturn since the Great Depression. It’s been replete with reports of home foreclosures, collapsing commuter towns, and young people struggling to become home owners. The term “generation rent” is often used in the media to describe the struggles of aspiring young people.  

    This is really a problem of upward mobility, and  how little the political system has responded to this problems of “generation rent” and those who have lost their homes. The current lack of action can be contrasted with the two very different periods in our economic history – the Roaring Twenties and the Great Depression.

    When discussing home ownership, many often bring up the efforts of Franklin Delano Roosevelt during the Great Depression. FDR called a nation of homeowners “unconquerable.”  But his administration really built on the ideas of previous administrations. Herbert Hoover, while serving as Warren Harding and Calvin Coolidge’s Secretary of Commerce, lent his support the “Own Your Own Home Campaign” of the Federal National Mortgage Association. This campaign touted the benefits of home ownership to the American people. And when Hoover became president, he created the Federal Home Loan Bank Board which chartered and supervised federal savings and loan institutions and created Federal Home Loan Banks to lend money to finance home mortgages. The purpose of this bank was to make homeownership cheaper for lower income people. It also represented a portion of Hoover’s efforts to fight the depression, and those efforts often went unrecognized by the American people both then and now. Hoover said home ownership could "change the very physical, mental and moral fiber of one’s own children." 

    After being elected president, Roosevelt created the Federal Housing Administration which insured homes made by banks and other lenders. The agency made it possible for people to pay for homes over three decades, before this period most homes were paid for through a three to five year loans. This program, followed up by Harry Truman’s support of veteran’s home loans and the home mortgage interest deduction, helped turn a nation of urban tenement dwellers into a nation of suburban home owners. Today, the federal government spends billions in subsides to ensure people have the opportunity to own their own homes. 

    Urbanist Richard Florida discusses the issue of home ownership in the 2010 book The Great Reset. In his interesting but misguided book, he correctly points out that too many people attained loans in the housing bubble and that high rates of homeownership hobble the labor market, as owning a home makes it harder for the job seeker to move. He also faults the Obama Administration for trying to do too much to prop up the mortgage market and recommends that the government quit supporting home ownership and start supporting renting to a greater extent. He said Fannie Mae has already taken steps in this direction by allowing people who experienced foreclosure to rent their houses. 

    But Florida is overstating the importance of renting in the lives of the American people, as we have a strong heritage as an upwardly mobile, ownership society that stretches back to the homesteading legislation pushed by Thomas Jefferson and Abraham Lincoln. But there’s no doubting that we’re a more mobile society than in the homesteading days. While FDR built on the work of his Republican predecessors, today’s leaders also have a template in the cooperative housing movement. According to the National Association of Housing Cooperatives, cooperative housing is defined as when “people join together on a democratic basis to own and control the housing or community facilities where they live.” Each month those who live in a housing cooperative pay their share of the expenses while sharing the benefits of the cooperative. According to the NAHC, 1.2 million families live in cooperative housing in the United States.

    What if we could create more forms of cooperative housing to make sure families have the opportunity to own a home and at the same time have a certain amount of mobility? Could a new Cooperative Housing Authority, with funding from Fannie Mae, buy up foreclosed houses and charge a monthly below market rate to a family? All such houses could be considered a part of the CHA and the family in the house would share in the profits of the authority. If and when the family moves, they’ll be entitled to those profits which could be used for rent or a down payment on a house. Such a program would help commuter towns who are suffering from high gas prices and foreclosures. 

    But a Cooperative Housing Authority would also be a conduit for affordable housing in America’s big cities and the surrounding suburbs, as the added supply of new housing forces the cost down. This would be an asset to certain cities where the supply of affordable housing is dwindling due to gentrification. Like most cooperative housing, the housing could take various forms: condos, townhomes and single family homes. I would suspect single family homes would be the most popular because they are the preference of most Americans. 

    A Federal Community Land Trust could be along with a CHA another way to deal with affordable  housing shortages. Like any land trust, it could add civic buildings, commercial spaces and community assets to the areas where the housing exits. This would ensure mixed/use type neighborhoods where residents would have access to shopping and civic life nearby. 

    Returning to FDR’s administration, during the 1930s the government constructed what was called garden suburbs outside of major cities: Greenbelt, Maryland; Greenhills, Ohio; and Greendale, Wisconsin. The garden suburbs were intended to house rural people who were migrating to the city as well as poor urban workers. The project was a two way street, as the government provided the road grid and cheap credit for the suburbs while aspiring families provided the mortgage payments.  These garden suburbs – designed to be suburban with some green (trees and parks) – provided a template for the mass automobile suburbanization that occurred in the 1950s.

    Of course, urbanists have never quit critiquing this suburban development model since it emerged. Like many in the city planning world, Lewis Mumford was horrified at the way suburbanization played out after World War II:
    "The planners of the New Towns seem to me to have over-reacted against nineteenth-century congestion and to have produced a sprawl that is not only wasteful but–what is more important–obstructive to social life."
    Mumford advocated the regional city – a city that included an urban core surrounded by well-planned suburbs, as he also rejected the densely packed cities of the decades before the war.     

    Could a FCLT and CHA work to create family friendly suburbs with mixed use development, and in turn save families money on energy and at the same time spare the environment more greenhouse gas pollution? I think that it could, and if these developments were to become a reality, Lewis Mumford’s vision of a regional city might look like a reality. 

    Jason Sibert is a freelance writer who has lived in the St. Louis Metro Area since the late 90s. He worked for the Suburban Journals for a decade and his work has appeared in various publications over the last four years.

    Chicago housing cooperative photo by Jennifer D. Ames.

  • Driving Trends in Context

    There are grains of reality, misreporting and exaggeration in the press treatment of a report on driving trends by USPIRG. The report generated the usual press reports suggesting that the millennial generation (ages 16 to 35) is driving less, moving to urban cores, and that with a decline in driving per capita, people are switching to transit. These included the usual, but not representative anecdotes about people whose lifestyles and mobility needs are sufficiently served by the severe geographical and travel time limitations of transit.

    Further, in an important contribution, the USPIRG report provides driving trend forecasts that are lower than other projections. If accurate, these would result in materially greater greenhouse gas emissions reductions to 2040 than projected by the Department of Energy, further undermining the justification for anti-mobility policies as well as urban containment.

    Millennials and More Urban and Walkable Living

    It is again reported that millennials "like to live in the city center." Last year, a report by USPIRG cited a poll indicating that 77 percent of millennials plan to live in urban cores. Their actual choices have been radically different.

    In fact, 2010 census data indicates that people between 20 and 29 years old were less inclined to live in more urban and walkable neighborhoods than their predecessors. In 2000, 19 percent of people aged 20 to 29 lived in the core municipalities of major metropolitan areas, where transit service and walkable neighborhoods are concentrated. Only 13 percent of the increase in 20 to 29-year-old population between 2000 and 2010 was in the core municipalities. By contrast, the share of the age 20 to 29 living  in the suburbs of major metropolitan areas was 45 percent, higher than the 36 percent living there in 2000 (Figure 1).

    The Decline in Driving

    Driving per capita in urban areas peaked in 2005. Between 2005 and 2011, driving declined seven percent. In the context of rising gasoline prices, and economic trends, the real news is not how much driving has fallen, but rather how little. A seven percent reduction is slight compared to the one and one-half times increase in gas prices over the past decade (Figure 2). Per capita travel by car and light truck has fallen back only to 2002 levels, which remained above the driving rates of previous years.

    Drivers: Not Switching to Transit

    The USPIRG report gives the impression that instead of driving, Americans are switching to other modes of transport, principally transit. In discussing the report, Nick Turner, of the Rockefeller Foundation said: "Americans are making very different transportation choices than they did in years past."

    Actually not. The data shows that as people drove less, they did not switch to transit. The driving reduction was approximately 900 miles per capita from 2005 to 2011. At the same time, transit ridership per capita was up approximately 15 miles – a small change compared to the reduction in driving (Figure 3). People just traveled a less (perhaps fewer trips to the store or to the beach, not to mention the fewer work trips in a depressed economy).

    Work trip travel trends are little changed over the past decade. Driving alone and transit were up marginally between 2000 and 2011. Working at home increased the most, while car pooling declined the most (Figure 4).

    This raises the issue of context. While driving was declining about seven percent per capita from 2005 to 2011, transit use was increasing about seven percent. The percentages were similar, but the amount of travel was radically different, because of transit’s much smaller base. Transit usage would need to increase nearly 400 percent to equal the mileage of a seven percent loss in travel by car. For all of the impressive transit ridership increase claims, transit’s share of urban travel has changed little (Figure 5).

    Transit’s failure to capture much of the decline in driving simply reflects the limitation of its effectiveness in taking people where they need to go. Transit is very effective in providing mobility to the nation’s largest downtown areas, where it provides half to three quarters of the trips. Approximately 55 percent of all US transit commuting is to six transit legacy cities (municipalities), including New York, Chicago, Philadelphia, Boston, San Francisco, and Washington. Most of this commuting is to the compact and dense downtown areas.

    Outside the transit legacy cities, transit’s impact is slight, because of the "last mile" problem.  Transit service is not close enough (or fast enough) to be practical for most trips in metropolitan areas. For example, Brookings Institution data indicates that the average worker can reach fewer than 10 percent of of jobs in major metropolitan areas within 45 minutes. By contrast, the average solo driver reaches work in approximately 25 minutes. There is no solving this problem, because the infrastructure that would be required is far from affordable, as Professor Jean-Claude Ziv and I showed in a WCTRS paper (See: Megacities and Affluence).

    Millennial Driving in Context

    Survey data does indicate a decline in driving among millennials, but those with jobs are not flocking to transit. Single occupant commuting in this age group increased between 2000 and 2011, from 66.9 percent to 69.7 percent. Transit use and working at home also increased (5.4 percent to 5.8 percent and 1.4 percent to 2.6 percent respectively. There was, however, a substantial decline in car pool use among millennials, from 17.4 percent to 12.6 percent (Figure 6).

    Younger workers have suffered disproportionately from the economic decline. There has been a substantial reduction in the percentage of people aged 16 to 24 who have jobs (Figure 7). These lost work trips have contributed more than any perceived preference for urban living to the decline in driving. Transportation expert Alan Pisarski has attributed much of the decline in demand in this age group to such economic factors.

    At the same time, and as USPIRG indicates, the increase in social media use may well have contributed to the declining demand for discretionary travel.

    Driving Less in the Future and the GHG Emissions Implications

    The decline in per capita driving is not surprising. Back in 1999, Pisarski predicted that per capita driving would soon peak ("Cars, Women and Minorities: The Democratization of Mobility in America"), because automobile availability had now spread to most all segments of society.

    USPIRG forecasts driving volumes below US Department of Energy predictions. According to USPIRG:  "Coupled with improvements in fuel efficiency, reduced driving means Americans will use about half as much gasoline and other fuels in 2040 than they use today." This means an even greater reduction in GHG emissions than currently forecast. Department of Energy forecasts a 21 percent decline in total (not per mile) GHG emissions from light vehicles between 2010 and 2040, despite a 40 percent increase in driving. The more modest driving levels in USPIRG scenarios would result in GHG emissions reductions of between 31 percent and 55 percent between 2010 and 2040 (Figure 8). These projections provide further evidence that of the "greening" of the automobile and the needlessness of urban containment policies.

    Reality

    Regardless, however, of the future trend, it is important to minimize the time that people spend traveling in metropolitan areas, because of the strong association between effective mobility, job access, and economic growth. Modern metropolitan areas require the quickest possible access between all origins and destinations to facilitate greater household affluence (measured in discretionary income) and lower levels of poverty. The objective should be the greatest reduction in travel delay per dollar spent on transportation.

    Dug Begley accurately characterized the situation in the Houston Chronicle:

    "We spend a lot of transportation money in the Houston region on roads, and for good reason: That’s how most people travel. Houston is a growing place, and there aren’t two or three job centers, there are about eight. Getting people between them … is going to take roads."

    Outside the municipal boundaries of the six legacy cities and especially their downtown enclaves, Houston (despite its reputation) is little different than the rest of metropolitan America. From the suburbs of New York, to the entire Portland and Phoenix metropolitan areas, the automobile carries the overwhelming share of travel (see Table 1, here). It cannot be any other way, since no planning agency in the New World or Western Europe has a plan, much less the resources, to construct a transit system that would duplicate the mobility of the automobile throughout its metropolitan area.

    Wendell Cox is a Visiting Professor, Conservatoire National des Arts et Metiers, Paris and the author of “War on the Dream: How Anti-Sprawl Policy Threatens the Quality of Life.

    —–

    Methodology: This article is based on data from the Federal Highway Administration, the Federal Transit Administration, Census Bureau, Department of Energy and USPIRG.

    Photo: Roadways, Fort Lauderdale (Miami metropolitan area)

  • Texas Suburbs Lead Population Growth

    The US Census Bureau has reported that eight of the fifteen 2011-2012 fastest-growing municipalities with at least 50,000 population were in Texas. Three of them were in the Austin metropolitan area. San Marcos, south of Austin, grew the fastest in the nation at 4.9 percent. Cedar Park, located in Austin’s northern suburbs, ranked fourth in growth at 4.7 percent while Georgetown, also north of Austin grew 4.2 percent and ranked seventh. Houston suburb Conroe placed 10th adding 4.0 percent to its population. Dallas-Fort Worth suburbs McKinney and Frisco placed 11th and 12th. The other two Texas municipalities ranking high were outside the major metropolitan areas, Midland (third) and Odessa (13th).

    Growth Outside Texas

    South Jordan, located in the southern suburbs of the Salt Lake City metropolitan area was the second fastest-growing municipality, at 4.9 percent. Atlanta suburb Alpharetta grew 4.4 percent and ranked sixth. The largest municipality among the fastest-growing was Irvine, an Orange County suburb in the Los Angeles metropolitan area, which grew 4.2 percent to a population of 230,000. Buckeye, a suburb on the western periphery of the Phoenix metropolitan area placed ninth, growing 4.1 percent.

    Among the above 11 fastest-growing suburbs in major metropolitan areas, all are either near the periphery of the urban area or beyond the principal urban area. This illustrates the historic tendency of the fastest-growing city sectors to be located on (or beyond) their fringes. This was also strongly evident in the 2000 to 2010 census data, which showed 94 percent of major metropolitan area growth to be 10 miles or more from the urban cores.

    Other fast growers were not in major metropolitan areas, including Midland, Texas, Odessa, Texas, Auburn, Alabama and Manhattan, Kansas. Clarksville, Tennessee grew fifth-fastest. Clarksville is the core city of the second fastest-growing metropolitan area in the nation, just north of Nashville.

    First Census Bureau Municipal Estimates Since 2010

    These were the first reliable municipality (sub-county) population estimates produced by the Census Bureau since the 2010 census. The 2011 municipality estimates were virtually meaningless, since they were simply percentage allocation of county growth to municipalities based upon their share of the 2010 population.

    Growth in the Major Metropolitan Core Cities

    Nonetheless, over the past two years the greatest historical core municipality growth has been in those with the most suburban (Figure 1) land use characteristics. (See Suburbanized Core Cities for discussion of how “Historical Core Cities” are defined).

    Pre-War & Non Suburban Core Cities: The least suburban core cities, those with little postwar suburban development, grew 0.7 percent between 2010 and 2012. The strongest growth in this category was in Washington, which added 2.2 percent annually. In reaching a population of 634,000, Washington passed nearby Baltimore for the first time in its history. New York added the largest number of people in the category at 162,000.

    Pre-War and Suburban Core Cities: The Pre-War Core cities with large tracts of post-war suburban development grew at a 1.2 percent annual rate (Note 1). In this category, New Orleans grew the fastest, at an annual rate of 3.2 percent, as it continues to recover from Hurricane Katrina. Denver also grew strongly, at an annual rate of 2.5 percent.

    Post-War & Suburban Core Cities: These core cities, none of which had strong urban cores before World War II and which are virtually all suburban, grew at an annual rate of 1.5 percent. Austin, which is at the core of the fastest-growing major metropolitan area in the United States, grew the fastest in this category, at 2.9 percent.

    Metropolitan, Core City and Suburban Trends

    The estimates also indicate that the suburban population boom that accompanied the housing bubble has run its course. During the 2000s, the share of major metropolitan area (over 1 million population) growth in historical core municipalities fell to approximately one-half the rate of the 1990s. That picked up in the late 2000s as housing construction came to a near standstill and the slower suburban growth rates that have continued through to 2012.

    In a few metropolitan areas, historical core municipalities attracted the majority of the population growth. The leader in this regard was Providence, with 75 percent of its metropolitan growth, which was miniscule. New Orleans captured nearly 2/3 of the growth in its metropolitan area, while New York accounted for 61 percent of its metropolitan area growth. San Antonio, San Jose, and Columbus also attracted more than one half of their metropolitan area growth, though the high share of core-city growth in San Jose and San Antonio was reflective of their high population shares (Table 1).

    Between 2000 and 2012, historical core municipalities accounted for 27.2 percent of the growth in major metropolitan areas (Figure 2). This is slightly more than their 26.4 percent of the population in 2010. It would be a mistake to interpret this as presaging the long predicted "return to the city." It would take a continuation of these growth rates for nearly 500 years for historical core municipality populations to struggle to 30 percent of the major metropolitan area population. At the same time, there have been recent indications of even more dispersion, as major metropolitan areas lost nearly two million domestic migrants to smaller areas between 2000 and 2011, according to Census Bureau data.

    Further, the trends in domestic migration indicate that people continue to move to the suburbs from elsewhere, while moving away from the core counties (migration data is not available below the county level). Overall, the core counties of major metropolitan areas lost 167,000 domestic migrants, while the suburban counties added 286,000 (Note 2).

    The domestic migration losses in some core counties were substantial. In the five counties that constitute New York, there was a loss of 139,000 domestic migrants (there was also a loss of 114,000 domestic migrants in the suburbs). Los Angeles County lost 111,000 domestic migrants, while Chicago’s Cook County lost 74,000. The largest gainers were in Austin (Travis County: 36,000), Atlanta (Fulton County: 32,000) and San Antonio (30,000). Core counties continued to attract most international migration, adding 757,000, compared to 589,000 in the suburban counties (Table 2).

    The Future?

    It seems apparent that the nation’s growth continues to be in a transitional period. Should a more normal and vibrant economy replace the current malaise, it seems likely that suburban growth will be renewed. That would not, however, preclude a continuation of the recent smaller inner-core population growth in the increasingly safer and more attractive downtown areas.

    Table 1
    Metropolitan and Historical Core CityPopulation: 2010-2012
    Metroplitan Area Metropolitan Area Change Historical Core City(s) Change Share of Growth
    Atlanta, GA        5,457,831         171,099         443,775        23,496 13.7%
    Austin, TX        1,834,303         118,017         842,592        51,955 44.0%
    Baltimore, MD        2,753,149           42,660         621,342            381 0.9%
    Birmingham, AL        1,136,650             8,600         212,038           (250) -2.9%
    Boston, MA-NH        4,640,802           88,400         636,479        18,885 21.4%
    Buffalo, NY        1,134,210            (1,301)         259,384         (1,926)
    Charlotte, NC-SC        2,296,569           79,534         809,798        21,221 26.7%
    Chicago, IL-IN-WI        9,522,434           61,329       2,714,856        19,258 31.4%
    Cincinnati, OH-KY-IN        2,128,603           14,023         296,550           (400) -2.9%
    Cleveland, OH        2,063,535          (13,705)         390,928         (5,886)
    Columbus, OH        1,944,002           42,037         809,798        21,221 50.5%
    Dallas-Fort Worth, TX        6,700,991         274,781       1,241,162        43,329 15.8%
    Denver, CO        2,645,209         101,731         634,265        34,241 33.7%
    Detroit,  MI        4,292,060            (4,187)         701,475       (12,302)
    Grand Rapids, MI        1,005,648           16,710         190,411          2,371 14.2%
    Hartford, CT        1,214,400             2,016         124,893            118 5.9%
    Houston, TX        6,177,035         256,579       2,160,821        63,604 24.8%
    Indianapolis. IN        1,928,982           41,105         834,852        14,410 35.1%
    Jacksonville, FL        1,377,850           32,254         836,507        14,723 45.6%
    Kansas City, MO-KS        2,038,724           29,386         464,310          4,523 15.4%
    Las Vegas, NV        2,000,759           49,490         596,424        12,637 25.5%
    Los Angeles, CA       13,052,921         224,079       3,857,799        65,172 29.1%
    Louisville, KY-IN        1,251,351           15,643         605,110          7,774 49.7%
    Memphis, TN-MS-AR        1,341,690           16,861         655,155          8,266 49.0%
    Miami, FL        5,762,717         198,060         413,892        14,384 7.3%
    Milwaukee,WI        1,566,981           11,073         598,916          4,176 37.7%
    Minneapolis-St. Paul, MN-WI        3,422,264           73,405         683,650        16,004 21.8%
    Nashville, TN        1,726,693           55,803         624,496        20,969 37.6%
    New Orleans. LA        1,227,096           37,233         369,250        25,421 68.3%
    New York, NY-NJ-PA       19,831,858         264,451       8,336,697      161,561 61.1%
    Oklahoma City, OK        1,296,565           43,573         599,199        19,196 44.1%
    Orlando, FL        2,223,674           89,263         249,562        11,258 12.6%
    Philadelphia, PA-NJ-DE-MD        6,018,800           53,459       1,547,607        21,601 40.4%
    Phoenix, AZ        4,329,534         136,647       1,488,750        41,198 30.1%
    Pittsburgh, PA        2,360,733             4,448         306,211            509 11.4%
    Portland, OR-WA        2,289,800           63,791         603,106        19,328 30.3%
    Providence, RI-MA        1,601,374               522         178,432            396 75.9%
    Raleigh, NC        1,188,564           58,074         423,179        19,232 33.1%
    Richmond, VA        1,231,980           23,879         210,309          6,072 25.4%
    Riverside-San Bernardino, CA        4,350,096         125,245         213,295          3,343 2.7%
    Rochester, NY        1,082,284             2,613         210,532              20 0.8%
    Sacramento, CA        2,196,482           47,355         475,516          9,028 19.1%
    St. Louis,, MO-IL        2,795,794             8,099         318,172         (1,122) -13.9%
    Salt Lake City, UT        1,123,712           35,839         189,314          2,871 8.0%
    San Antonio, TX        2,234,003           91,495       1,382,951        55,346 60.5%
    San Diego, CA        3,177,063           81,755       1,338,348        36,727 44.9%
    San Francisco-Oakland, CA        4,455,560         120,169       1,226,603        30,649 25.5%
    San Jose, CA        1,894,388           57,477         982,765        30,203 52.5%
    Seattle, WA        3,552,157         112,348         634,535        25,875 23.0%
    Tampa-St. Petersburg, FL        2,842,878           59,635         347,645        11,936 20.0%
    Virginia Beach-Norfolk, VA-NC        1,699,925           23,105         245,782          2,979 12.9%
    Washington, DC-VA-MD-WV        5,860,342         224,110         632,323        30,600 13.7%
    Total     173,283,025       3,770,067     45,771,761    1,026,581 27.2%
    Calculated from US Census Bureau data
    Table 2
    Migration: Major Metropolitan Areas
    Net Domestic Migration Net International Migration
    Metroplitan Area Core County(s) Suburban Counties Core County(s) Suburban Counties
    Atlanta, GA             32,368             4,672                8,122             31,891
    Austin, TX             36,045           30,339                9,536              2,161
    Baltimore, MD             (9,476)             9,895                4,282             14,336
    Birmingham, AL             (6,365)             2,141                1,709              1,119
    Boston, MA-NH             (2,596)             3,109              14,543             36,407
    Buffalo, NY             (4,920)            (1,473)                4,930                 440
    Charlotte, NC-SC             20,354           16,936                9,535              2,732
    Chicago, IL-IN-WI            (74,050)          (48,018)              36,540             15,580
    Cincinnati, OH-KY-IN            (10,814)            (3,155)                3,420              3,622
    Cleveland, OH            (24,548)            (2,628)                6,409              1,382
    Columbus, OH              3,116             2,366                9,220              1,088
    Dallas-Fort Worth, TX              9,745           88,765              20,652             22,153
    Denver, CO             17,317           29,839                3,447              6,393
    Detroit,  MI            (49,741)              (706)                7,716             13,973
    Grand Rapids, MI                 171                 59                1,794                 776
    Hartford, CT            (10,189)            (3,202)                9,480              1,428
    Houston, TX             20,101           50,554              42,096             12,295
    Indianapolis. IN             (6,523)           11,509                5,561              2,670
    Jacksonville, FL             (2,000)           12,461                5,991              1,546
    Kansas City, MO-KS             (6,842)             2,624                1,957              4,711
    Los Angeles, CA          (110,934)             8,439              88,868             23,635
    Louisville, KY-IN                (906)             1,837                3,871                 647
    Memphis, TN-MS-AR             (4,670)              (656)                3,727                 261
    Miami, FL                   26           44,255              66,308             44,873
    Milwaukee,WI            (11,271)               662                3,740                 911
    Minneapolis-St. Paul, MN-WI              2,706            (4,786)              11,583             11,424
    Nashville, TN              6,117           19,203                5,357              2,714
    New Orleans. LA             19,061              (585)                1,439              4,262
    New York, NY-NJ-PA          (139,190)        (114,335)            151,431           117,636
    Oklahoma City, OK              7,494           12,791                3,335              1,432
    Orlando, FL             16,507           15,163              21,115             10,779
    Philadelphia, PA-NJ-DE-MD            (14,535)          (18,095)              16,276             22,104
    Phoenix, AZ             42,243             4,716              18,971                 413
    Pittsburgh, PA              3,114             4,050                5,006                 783
    Portland, OR-WA              9,266           14,323                5,055              7,153
    Providence, RI-MA             (9,263)            (5,050)                6,428              2,988
    Raleigh, NC             25,546             3,409                7,207                 568
    Richmond, VA              1,965             3,781                1,656              4,908
    Riverside-San Bernardino, CA             (4,221)           33,207                6,649              6,184
    Rochester, NY             (5,738)            (2,222)                4,392                 583
    Sacramento, CA             (2,086)             6,472              11,150              3,172
    St. Louis,, MO-IL             (7,666)          (14,640)                2,322              6,677
    Salt Lake City, UT              1,486                 47                5,486                   28
    San Antonio, TX             30,130           16,031                7,417                 604
    San Francisco-Oakland, CA              1,736           17,103              12,294             36,783
    San Jose, CA             (7,029)               476              30,315                 104
    Seattle, WA             21,616             5,003              26,670              9,748
    Tampa-St. Petersburg, FL             20,153           15,875              12,823              7,086
    Virginia Beach-Norfolk, VA-NC             (4,405)            (7,859)                3,269             10,065
    Washington, DC-VA-MD-WV             14,170           21,026                6,199             73,365
    Total          (163,363)         285,728            798,480           588,593
    Calculated from US Census Bureau data


    Wendell Cox is a Visiting Professor, Conservatoire National des Arts et Metiers, Paris and the author of “War on the Dream: How Anti-Sprawl Policy Threatens the Quality of Life.

    —–

    Note 1: See 2010 historical core municipality list. This list does not include Grand Rapids, which now exceeds 1,0000,000 population as a result of the new metropolitan definitions, and is classified as Pre-War Core and Suburban.

    Note 2: Excludes the Las Vegas and San Diego metropolitan areas, which have only one county.

    Photo: Google Earth image of Cedar Park, Texas

  • Poverty and Growth: Retro-Urbanists Cling to the Myth of Suburban Decline

    In the wake of the post-2008 housing bust, suburbia has become associated with many of the same ills long associated with cities, as our urban-based press corps and cultural elite cheerfully sneer at each new sign of decline. This conceit was revealed most recently in a a studyreleased Monday by the Brookings Institution–which has become something of a Vatican for anti-suburban theology–trumpeting the news that there are now 1 million more poor people in America’s suburbs than in its cities.

    America’s suburbs, noted one British journalist, are becoming “ghost towns” as middle-class former suburbanites migrate to the central core. That’s simply untrue: both the 2010 Census and other more recent analyses demonstrate that America is becoming steadily more suburban: 44 million Americans live in America’s 51 major metropolitan areas, while nearly 122 million Americans live in their suburbs. In other words, nearly three quarters of metropolitan Americans live in suburbs, not core cities.

    The main reason there are now more poor people in the suburbs is that there are now many more people in the suburbs, which have represented almost all of America’s net population growth in recent years. Despite trite talk about “suburban ghettos,” suburbs have a poverty rate roughly half that of urban centers (20.9 percent in core compared to 11.4 percent in the suburbs as of 2010).

    To be sure, poverty in suburbs, or anywhere else, must be addressed. But not long ago, suburbs were widely criticized for being homogeneous; now they are mocked for having many of the problems associated with being “inclusive.”

    Many poor suburbs are developing because minorities and working-class populations are moving to suburbs. Yet even accounting for these shifts, cities continue to contain pockets of wealth and gentrification that give way to swathes of poverty. In Brooklyn, it’s a short walk east from designer shoe stores and locavore eateries to vast stretches of slumscape. The sad fact is that in American cities, poor people—not hipsters or yuppies—constitute the fastest-growing population. In the core cities of the 51 metropolitan areas, 81 percent of the population increase over the past decade was under the poverty line, compared to 32 percent of the suburban population increase.

    In Chicago, oft cited as an exemplar of “the great inversion” of affluence from suburbs to cities, the city poverty rate stands at 22.5 percent, compared to 10 percent in the suburbs. In New York, roughly 20 percent of the city population lives in poverty, compared to only 9 percent in the suburbs.

    Looking at it from a national perspective, most of the major metropolitan counties with the highest rates of poverty are all urban core, starting with the Bronx, with 30 percent of people living under the poverty line, followed by Orleans Parish (New Orleans), Philadelphia, St. Louis, and Richmond, Va. In contrast all 10 large counties with the lowest poverty rates are all suburban.

    This divergence has an impact on other measurements of social health. Despite substantial improvement in crime rates in “core cities” over the past two decades, suburban areas generally have substantially lower crime rates, according to Brookings Institution’s own research. Yet at the same time suburban burgs dominate the list of safest cities over 100,000 led by Irvine and Temecula, Calif., followed by Cary, N.C. Overall suburban crime remains far lower than that in core cities.

    A review of 2011 crime data, as reported by the FBI, indicates that the violent-crime rate in the core cities of major metropolitan areas was approximately 3.4 times that of the suburbs. (The data covers 47 of the 51 metropolitan areas with more than 1 million population, with data not being available for Chicago, Las Vegas, Minneapolis-St. Paul, and Providence.)

    In the least suburbanized core cities, that is places that have annexed little or no territory since before World War II (New York, Philadelphia, Washington, etc.) the violent crime rate was 4.3 times the suburban rate. Among the 24 metropolitan areas that had strong central cities at the beginning of World War II but which have significant amounts of postwar suburban territory (Portland, Seattle, Milwaukee, Los Angeles, etc.), the violent crime rate is 3.1 times the suburban rate. Among the metropolitan areas that did not have strong pre–World War II core cities (San Jose, Austin, Phoenix, etc.), the violent crime rate was 2.2 times the suburban rate. Basically, the more suburban the metropolis, the lower the crime rate.  
    Rather than castigating suburbs for exaggerated dysfunction, retro-urbanists would be much better served focusing on how to correct and confront the issue of poverty, which continues to concentrate heavily in the urban core and elsewhere in America.

    Joel Kotkin is executive editor of NewGeography.com and a distinguished presidential fellow in urban futures at Chapman University, and a member of the editorial board of the Orange County Register. He is author of The City: A Global History and The Next Hundred Million: America in 2050. His most recent study, The Rise of Postfamilialism, has been widely discussed and distributed internationally. He lives in Los Angeles, CA.

    Wendell Cox is a Visiting Professor, Conservatoire National des Arts et Metiers, Paris and the author of “War on the Dream: How Anti-Sprawl Policy Threatens the Quality of Life.

    This piece originally appeared in the The Daily Beast.

    Suburban neighborhood photo by Bigstock.

  • Housing Market Fringe Movement

    A year or two ago, pundits and planners, in California and elsewhere, proclaimed – and largely celebrated – the demise of suburbia. They were particularly heartened by a report, financed by portions of the real estate industry, that predicted the market for single-family homes in the state was hopelessly flooded, with a supply overhang of up to 25 years. The "new California dream" would supplant the ranch house with a high-density apartment, built along a transit or bus line.

    So much for the grand theory. As the economy has begun to recover from its nadir, single-family home sales have taken off, both in California and across the country. In 2012, prices rose by 6 percent nationwide, and pent-up demand has spurred interest among investors and buyers.

    In California, the new dream imagined by planners, pundits and their real estate backers is being supplanted by, well, a more traditional aspiration. In our state, hard hit by the most-recent housing bubble, single-family home prices surged 24 percent over the past year as inventories dropped precipitously. In some particularly desirable areas, such as Irvine, the supply constraints are at levels lower than experienced even in boom times.

    We are beginning to see a resurgence – which we were told never to expect – in new projects. The government reported recently that housing permits, still well below their peak, surged in February to their highest level since June 2008, an increase of nearly 34 percent from a year earlier.

    In Southern California, prospects for new single-family home construction are beginning to gear up. Toll Brothers, for example, recently bought into a new 2,000-home development in Lake Forest. Developers are turning over land across a vast portion of the state, particularly in places like Riverside-San Bernardino, which were at the epicenter of the housing bust but are now showing signs of recovery.

    The media’s surprise at these developments reflects the disconnect between the perceptions of planners, academics and some developers and reality on the ground. In the past decade or two, a huge industry has arisen, proclaiming the end of the single-family home and heralding the rise of densely populated urban cores. Yet, an analysis of the 2010 Census shows that growth in the suburbs, as opposed to core cities, actually rose from 85 percent to 91 percent from the previous decade.

    So, too, did the proportion of detached single-family homes, which grabbed 80 percent of the market during 2000-10, leaving 20 percent for multifamily buildings and townhouses. And now, with the market recovering, single-family homes in 2012 accounted for nearly two of three homes sold. Overall, sales of single-family homes in the past year were roughly seven times those for co-ops and condos nationwide.

    What’s behind this? It may have something to do with a little thing called consumer preference. Overall surveys tend to show that roughly 80 percent of adults prefer single-family houses, usually in either suburbs or exurbs.

    Of course, many insist that, in the aftermath of the 2007 housing bust, Americans now are finally unlearning their bad habits. In 2010, U.S. Housing and Urban Development Secretary Shaun Donovan, pointing to the flood of foreclosures in suburban reaches of Phoenix, claimed that the die, indeed, was already cast. "We’ve reached the limits of suburban development," Donovan claimed. "People are beginning to vote with their feet and come back to the central cities."

    Yet, although the Great Recession certainly slowed overall migration to suburbs, numbers for 2011, the most recent available, showed domestic migrants continued to head away from core counties and toward those in the suburbs and exurbs. Now that the economy is improving, this trend seems likely to continue, or even accelerate.

    Core cities may be reviving, but this is still a suburban nation; conservative estimates indicate than more than 70 percent of residents in major metropolitan areas live in suburbs. To be sure, areas within three miles of an urban core grew 4.7 percent in the past decade, or 206,000, a nice reversal from previous declines. Yet this represented less than one-half the metropolitan growth rate of 10.6 percent. Further, this growth was more than negated by a 272,000 loss of people living from two miles to five miles from the urban core.

    Contrast this with fringe growth. Over the past decade, for example, areas five to 10 miles further from the core expanded their populations by 1.1 million. Areas further out, 10 to 20 miles, added 6.5 million residents. Areas beyond 20 miles from the urban core saw the largest growth, 8.6 million – 40 times the growth in the urban core and nearly four times the percentage growth (18.0 percent).

    It does not appear that the Great Recession reversed these trends. An analysis of population growth in 2011-2012 by Jed Kolko, chief economist for the real estate website Trulia, found that the old patterns reinforced themselves, with strong, but numerically small, growth in the core, but the most robust expansion at the fringes. "The suburbanization of America," Kolko suggests, "marches on."

    In Southern California, this also is the pattern. From 2000-10, the Riverside-San Bernardino metropolitan area added twice as many people as did Los Angeles and three times that of San Diego. Overall growth in Los Angeles has been strongest toward its urban fringe. Although media coverage has focused on the growing residential population of Los Angeles’ downtown, which expanded from 35,884 to 51,329 over the decade, this population is actually smaller than that of the San Fernando Valley neighborhood of Sherman Oaks. It is also more than 5,000 fewer people that in the Riverside County community of Eastvale, once primarily an area of dairy farms that incorporated only in 2010 and whose population has increased eight-fold since 2000.

    The geography of the post-crash economy, despite the strong losses in suburban industries like manufacturing and construction, also has remained much as it was before the recession, and may begin to assert itself more in the future. A new report from the urban-core-oriented Brookings Institution found that the percentage of jobs within three miles of the urban core dropped in all but nine of the nation’s 100-largest metropolitan areas; only Washington, D.C., saw strong relative growth in its core.

    Overall, the periphery is now the dominant job center in metropolitan America, with more than 65 percent of all jobs in the largest metropolitan areas and with twice as many jobs 10 miles from the urban core as in the core itself. This undercuts the assertions by planners and retro-urbanists that we can cut commutes by coercing people to live closer to the core. The real trend is that many historically bedroom communities are nearing parity between jobs and resident employees. The jobs/housing balance, which measures the number of jobs per resident employee in a geographical area, has reached 0.89 (jobs per resident workers) in the suburbs of the country’s 51 major metropolitan areas, according to American Community Survey 2011 data.

    This proportion is greater in Southern California, where numerous job centers compete with downtown Los Angeles, which holds barely 3 percent of the region’s employment. Instead, many of the region’s strongest job centers – Ontario, Burbank, West Los Angeles, Valencia – are themselves suburban in nature. Overall, the strongest office markets remain in places like around John Wayne Airport and West Los Angeles, which have recovered much more than downtown Los Angeles, despite that area’s much ballyhooed "vibrancy."

    If the goal is to reduce both commute times and energy use, perhaps these dispersed centers may offer the best hope. In Irvine, for example, by 2000 there were three jobs for every resident; roughly two in five residents worked in the city. Commutes for Irvine residents are among the shortest in the Los Angeles basin, notes Ali Modarres, chairman of the Geography Department at Cal State Los Angeles.

    There’s also a danger that policies seeking to restrict construction of single-family homes could further inflate housing prices and thus also create a potential oversupply of the multifamily product that the planners and many developers want to push. This is particularly true here in sunny Southern California, where the single-family house represents, in historian Sam Bass Warner’s phrase, "the glory of Los Angeles and an expression of its design for living."

    Given these deep-seated preferences, perhaps it would make more sense if our planners, and some developers, would awake from their dogmatic slumbers. Their job should be to facilitate the quality of life that people seek, not to tell them how to live. That means admitting that the future of both America and, particularly, Southern California, is likely to remain largely suburban for years to come.

    Joel Kotkin is executive editor of NewGeography.com and a distinguished presidential fellow in urban futures at Chapman University, and a member of the editorial board of the Orange County Register. He is author of The City: A Global History and The Next Hundred Million: America in 2050. His most recent study, The Rise of Postfamilialism, has been widely discussed and distributed internationally. He lives in Los Angeles, CA.

    This piece originally appeared in the Orange County Register.

    Suburbs photo courtesy of BigStockPhoto.com.

  • Millennial Lifestyles Will Remake American Homes

    As Millennials, America’s largest generation, enter their thirties in ever greater numbers, their beliefs about how and where to raise a family will have a major impact on the nation’s housing market. This follows as their media and political preferences have helped shape how we entertain ourselves and who is the president of the United States.   A 2012 survey indicated that seventy percent of Millennials would prefer to own a home in the suburbs if they can “afford it and maintain their lifestyle.” Now a new survey of 1000 18-35 year olds conducted for Better Homes and Garden Real Estate (BHGRE) by Wakefield Research provides a much more detailed picture of the type of home Millennials believe best fits their needs and desires.  


    Reflecting their overall attitudes about spending their hard-to-come-by money, Millennials look more for value than “pizzazz” in a new home. Seventy-seven percent told BHGRE they preferred an “essential” home over a “luxury” model. And more than half (56%) believe the technological capabilities of a house are more important than its “curb appeal.”            

    Millennials are known for their fascination with technology.  The BHGRE survey demonstrates that tendency in reference to their home buying decisions. Almost two-thirds (64%) would not want to live in a home that wasn’t “tech-friendly.” Not surprisingly, almost half (44%) focus on the technological sophistication of the family room rather than other rooms in the house in making that determination. In fact, almost as many (43%) would rather turn their living room into a home theater with a big screen TV than use it in more traditional ways. Even in the kitchen, a solid majority (59%) would rather have a television screen than a second oven (41%).

    Another constant concern of Millennials, security, is also reflected in their technology preferences. Almost half (48%) named a security system as one of the technological essentials in a home and about a quarter (28%) would like to be able to control such a system from their smart phone.

    In addition, befitting the generation that first popularized social media sites such as MySpace and Facebook, most Millennials want a house that can be customized to their individual preferences. Forty-three percent want their home to be less a “cookie cutter” offering and more capable of allowing them to put their own finishing touches on it. Almost one-third (30%) would prefer a “fixer upper” to a “move-in-ready” home, and seventy-two percent of those surveyed thought they were at least as capable of making those repairs as their parents. Almost all (82%) of this supposedly “entitled” generation say they would find a way to handle the cost of these repairs themselves rather than borrowing the money from Mom or Dad.

    Millennials also take their concern for the environment into account when choosing a home. Almost half (45%) don’t want a home that wastes energy. Reflecting this, an energy efficient washer and dryer topped their essential technology wish list (57%). A smart thermostat was important to 44% of those surveyed, placing it third on the list of Millennial housing essentials.

    These preferences aren’t the only reason that Millennial homes will reduce the nation’s carbon footprint in coming years. Millennials see their home as a place to “do work,” not just a place to return to “after work.” Already one in five Millennials say that “home office” is the best way to describe how they use their dining room. The generation’s blurring of gender roles as well as its facility in using digital technologies means that Millennials will likely work as much from home as “at work,” as they share child rearing responsibilities based upon whose work responsibilities require which partner to be away from the house during the day.

    The cumulative impact on America’s energy consumption from this shift could be dramatic. A study by Global Workplace Analytics suggested that, if half of American worked from home, it would reduce carbon emissions by over 51 million metric tons a year—the equivalent of taking all of greater New York’s commuters off the road. Eliminating traffic jams would save almost 3 billion gallons of gas a year and cut greenhouse gas emissions by another 26 million tons. Additional carbon footprint savings would come from reduced office energy consumption, roadway repairs, urban heating, office construction, and business travel.

    By the end of this decade the Millennial generation will comprise more than one out of every three adult Americans (36%). Just as the Baby Boomers influenced the housing market when they started buying homes and raising families, the Millennial generation’s overwhelming size will place an indelible stamp on the nation’s housing market. Its numbers will produce a boom in demand for housing that will help heal this critical sector of the nation’s economy. 

    This may affect boomers and other old generations. Every seller of houses will have to adjust their offerings to accommodate Millennial preferences for the type of home in which they want to raise a family. The end result will be more family friendly neighborhoods where homes serve as the hub for their owner’s economic activity, simultaneously lowering the nation’s  carbon footprint and improving  the civic health of its communities.

    Morley Winograd and Michael D. Hais are co-authors of the newly published Millennial Momentum: How a New Generation is Remaking America and Millennial Makeover: MySpace, YouTube, and the Future of American Politics and fellows of NDN and the New Policy Institute.

    New home photo by BigStockPhoto.com.