Category: Suburbs

  • The Triumph of Suburbia

    The “silver lining” in our five-years-and-running Great Recession, we’re told, is that Americans have finally taken heed of their betters and are finally rejecting the empty allure of suburban space and returning to the urban core.

    “We’ve reached the limits of suburban development,” HUD Secretary Shaun Donovan declared in 2010. “People are beginning to vote with their feet and come back to the central cities.” Ed Glaeser’s Triumph of the City and Alan Ehrenhalt’s The Great Inversion—widely praised and accepted by the highest echelons of academia, press, business, and government—have advanced much the same claim, and just last week a report on jobs during the downturn garnered headlines like “City Centers in U.S. Gain Share of Jobs as Suburbs Lose.”

    There’s just one problem with this narrative: none of it is true. A funny thing happened on the way to the long-trumpeted triumph of the city: the suburbs not only survived but have begun to regain their allure as Americans have continued aspiring to single-family homes.

    Read the actual Brookings report that led to the “Suburbs Lose” headline: it shows that in 91 of America’s 100 biggest metro areas, the share of jobs located within three miles of downtown declined over the 2000s. Only Washington, D.C., saw significant growth.

    To be sure, our ongoing Great Recession slowed the rate of outward expansion but it didn’t stop it—and it certainly didn’t lead to a jobs boom in the urban core.

    “Absent policy changes as the economy starts to gain steam,” report author and urban booster Elizabeth Kneebone warned Bloomberg, “there’s every reason to believe that trend [of what she calls “jobs sprawl”] will continue.”

    The Hate Affair With Suburbia

    Suburbs have never been popular with the chattering classes, whose members tend to cluster in a handful of denser, urban communities—and who tend to assume that place shapes behavior, so that if others are pushed to live in these communities they will also behave in a more enlightened fashion, like the chatterers. This is a fallacy with a long pedigree in planning circles, going back to the housing projects of the 1940s, which were built in no small part on the evidently absurd, and eventually discredited, assumption that if the poor had the same sort of housing stock as the rich, they would behave in the same ways.

    Today’s planning class has adopted what I call a retro-urbanist position, essentially identifying city life with the dense, highly centralized and transit-dependent form that emerged with the industrial revolution. When the city—a protean form that is always changing, and usually expands as it grows—takes a different form, they simply can’t see it as urban growth.

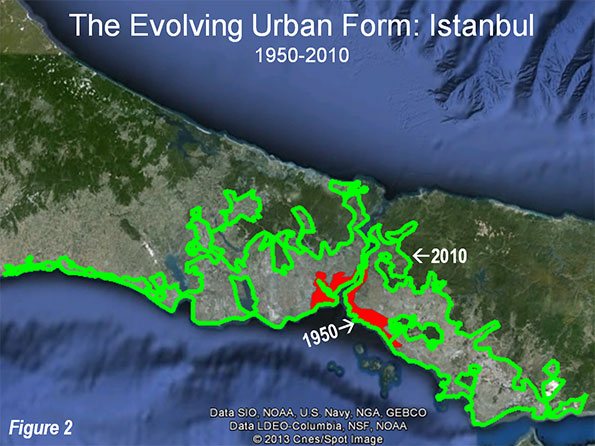
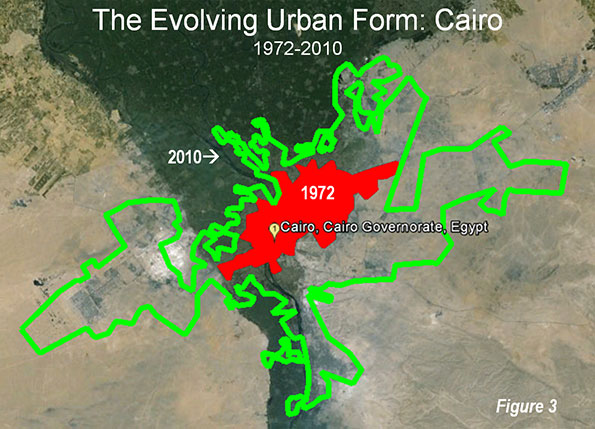
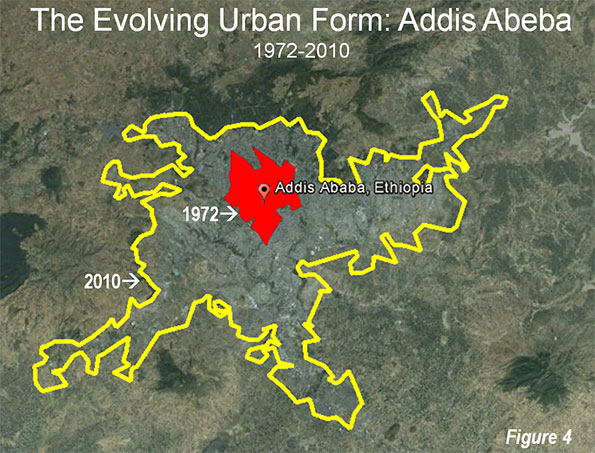
    In his masterwork A Planet of Cities, NYU economist Solly Angel explains that virtually all major cities in the U.S. and the world grow outward and become less dense in the process. Suburbs are expanding relative to urban cores in every one of the world’s 28 megacities, including New York and Los Angeles.  Far from a perversion of urbanism, Angel suggests, this is the process by which cities have grown since men first established them.

    In the U.S., the hate affair with suburbs and single-family housing, even in the city, dates to their rapid growth in the American boom after the first World War. In 1921 historian and literary criticic Lewis Mumford described the expansion of New York’s outer boroughs as a “dissolute landscape,” “a no-man’s land which was neither town or country.” Decades later, Robert Caro described the new rows of small, mostly attached houses—still the heart of the city’s housing stock—built in the post-war years as “blossoming hideously” as New Yorkers fled venerable, and congested, parts of Brooklyn and Manhattan for more spacious, tree-lined streets farther east, south, and north.

    In the 1950s, the rise of mass-produced suburbs like Levittown, New York, and Lakewood, California, sparked even more extreme criticism. Not everyone benefited from the innovation that allowed the Levitts to pioneer homes costing on average just $8,000—African-Americans were excluded from the original development—but for many middle- and working-class American whites, the housing and suburban booms represented an enormous step forward. The new low-cost suburbia, wrote Robert Bruegmann in his compact history of sprawl, “provided the surest way to obtain some of the privacy, mobility and choice that once were available only to the wealthiest and most powerful members of society.”

    The urban gentry and intelligentsia, though, disdained this voluntary migration. Perhaps the most bitter critic was the great urbanist Jane Jacobs. An aficionado of the old, highly diverse urban districts of Manhattan, Jacobs not only hated trendsetter Los Angeles but dismissed the bedroom communities of Queens and Staten Island with the memorable phrase, “The Great Blight of Dullness.” The 1960s social critic William Whyte, who, unlike Jacobs, at least bothered to study suburbs close up, denounced them as hopelessly conformist and stultifying. Like many later critics, he predicted in Fortune that people and companies would tire of them and return to the city core.

    More recent critiques of suburbia have focused as well on their alleged vulnerability in an energy-constrained era. “The American way of life—which is now virtually synonymous with suburbia—can only run on reliable supplies of cheap oil and gas,” declares James Howard Kunstler in his 2005 peak oil jeremiad, The Long Emergency. “Even mild to moderate deviations in either price or supply will crush our economy and make the logistics of daily life impossible.”

    Too often, the anti-surbanites seem to take a certain perverse comfort in any development, no matter how grim, that “helps” protect Americans from the “wrong choice” of aspiring to space of their own. The housing crash of 2007 was cheered on in some circles as the death knell of the suburban dream, as when theorist Chris Leinberger declared in the Atlantic that soon, poor families would be crowding into dilapidated McMansions in the “suburban wastelands.

    For retro-urbanists such as Richard Florida the reports, however premature, of the death of the suburbs, confirmed deeply held notions about the superiority of dense, urban living.  He summarily declared the single-family house archaic, and the quest for homeownership one of the “countless forms of over-consumption that have a horribly distorting affect on the economy."

    The Real Geography of America

    But the simple fact remains that the single-family home has remained the American dream, with sales outpacing those of condominiums  and co-ops despite the downturn.

    Florida has suggested that simply stating the numbers makes me a sprawl lover While he and other urban nostalgists see the city only in its dense urban core, and the city’s role as intimately tied with the amenities that are supposed to attract the relatively wealthy members of the so-called “creative class,” I see the urban form as ever changing, and consider a city’s primary mission not aesthetic or simply economic but to serve the interests and aspirations of all of its residents.

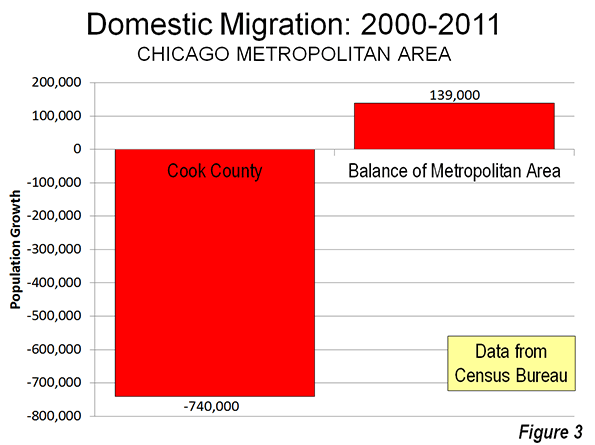
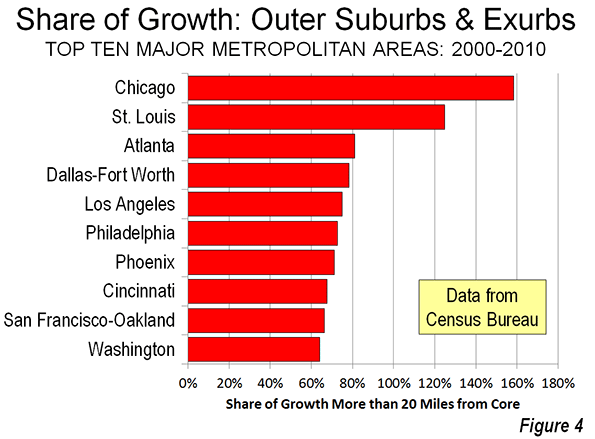
    Clearly the data supports a long-term preference for suburbs. Even as some core cities rebounded from the nadir of the 1970s, the suburban share of overall share of growth in America’s 51 major metropolitan areas (those with populations  of at least one million) has accelerated—rising from 85 percent in the ’90s to 91 percent in the ’00s. There’s more than a tinge of elitism animating the urban theorists who think that urban destiny rides mostly with the remaining nine percent matters. Overall, over 70 percent of residents in the major metropolitan areas now live in suburbs.

    Surveys, including those sponsored by the National Association of Realtors, suggest roughly 80 percent of Americans prefer a single family house to an apartment or a townhouse. Only 8 percent would prefer to live in an apartment. Yet just 70 percent of households live in a single-family house, while 17 percent live in apartments—suggesting the demand for single-family houses is still not being met. Such housing may be unaffordable, particularly in high-cost urban cores, but there is a fundamental market demand for it.

    To be sure, the Great Recession did slow the growth of suburbs and particularly exurbs—but recent indicators suggest a resurgence. An analysis last October by Jed Kolko, chief economist at the real estate website Trulia, reports that between 2011 and 2012 less-dense-than-average ZIP codes grew at double the rate of more-dense-than-average ZIP codes in the 50 largest metropolitan areas. Americans, he wrote, “still love the suburbs.”

    The Future Demographics of Suburbia

    Ultimately the question of growth revolves around the preferences of consumers. Despite predictions that the rise of singles, an aging population and the changing preferences of millennials will create a glut of 22 million unwanted large-lot homes by 2025, it seems more likely that three critical groups will fuel demand for more suburban housing.

    Between 2000 and 2011, there has been a net increase of 9.3 million in the foreign born population, largely from Asia and Latin America, with these newcomers accounting for about two out of every five new residents of the nation’s 51 largest metropolitan areas. And these immigrants show a growing preference for more “suburbanized” cities such as Nashville, Charlotte, Houston and Dallas-Fort Worth. An analysis of census data shows only New York—with nearly four times the population—drew (barely) more foreign-born arrivals over the past decade than sprawling Houston. Overwhelmingly suburban Riverside–San Bernardino expanded its immigrant population by nearly three times as many people as the much larger and denser Los Angeles–Orange County metropolitan area.

    Clearly, immigrants aren’t looking for the density and crowding of Mexico City, Seoul, Shanghai, or Mumbai. Since 2000, about two-thirds of Hispanic household growth was in detached housing. The share of Asian arrivals in detached housing is up 20 percent over the same span. Nearly half of all Hispanics and Asians now live in single-family homes, even in traditionally urban places like New York City, according to the census’s American Community Survey.

    Nowhere are these changes more marked than among Asians, who now make up the nation’s largest wave of new immigrants. Over the last decade, the Asian population in suburbs grew by about 2.8 million, or 53 percent, while that of core cities grew by 770,000, or 28 percent.

    Aging boomers, too, continue to show a preference for space, despite the persistent urban legend that they will migrate back to the core city. Again, the numbers tell a very different story.

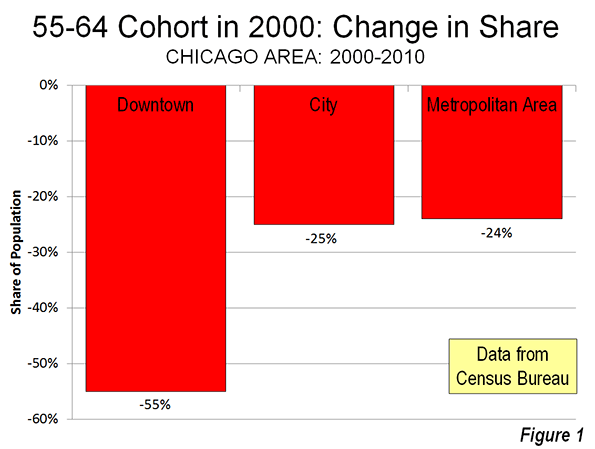
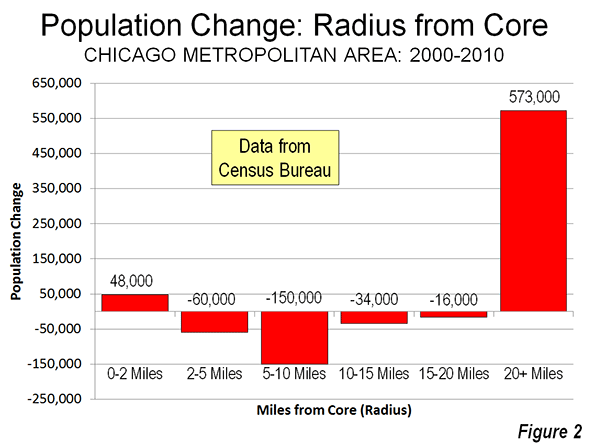
    A National Association of Realtors survey last year of buyers over 65 found that the vast majority looked for suburban homes. Of the remaining seniors, only one in 10 looked for a place in the city—less than the share that wanted a rural home. When demographer Wendell Cox examined the cohort that was 54 to 65 in 2000 to see where they were a decade later, the share that lived in the suburbs was stable, while many had left the city—the real growth was people moving to the countryside. Within metropolitan areas, more than 99 percent of the increase in population among people aged 65 and over between 2000 and 2010 was in low-density counties with less than 2,500 people per square mile.

    With the over-65 population expected to double by 2050, making it by far America’s fastest-growing age group, they appear poised to be a significant source of demand for suburban housing.

    But arguably the most critical element to future housing demand is the rising millennial generation. It has been widely asserted by retro-urbanists that young people prefer urban living. Urban theorists such as Peter Katz have maintained that millennials (the generation born after 1983) have little interest in “returning to the cul-de-sacs of their teenage years.” 

    To bolster their assertions, retro-urbanist point to stated-preference research showing that more than three quarters of millennials say they “want to live in urban cores.” But looking at where millenials actually live now—and where they see themselves living in the future—shows a very different story. In the nation’s major metropolitan areas, only 8 percent of residents aged 20 to 24 (the only millennial adult age group for which census data is available) live in the highest-density counties—and that share has declined from a decade earlier. What’s more, 43 percent of millenials describe the suburbs as their “ideal place to live”—a greater share than their older peers—and 82 percent of adult millenials say it’s “important” to them to have an opportunity to own their home.

    And, of course, as people get older and take on commitments and start families, they tend to look for more settled, and less dense, environments. A 2009 Pew study found that 45 percent of Americans 18 to 34 would like to live in New York City, compared with just 14 percent of those over 35. As about 7 million more millenials—a group the Pew surveys show desire children and place a premium on being good parents—hit their 30s by 2020, expect their remaining attachment to the city to wane.

    This family connection has always eluded the retro-urbanists. “Suburbs,” Jane Jacobs once wrote, “must be difficult places to raise children.” Yet suburbs have served for three generation now as the nation’s nurseries. Jacobs’s treatment of the old core city—particularly her Greenwich Village in the early 1960s—lovingly portrayed these places as they once were, characterized by class, age, and some ethnic diversity along with strong parental networks, often based on ethnic solidarity.

    To say the least, this is not what characterizes Greenwich Village or in Manhattan today. In fact, many of the most vibrant, and high-priced urban cores—including Manhattan, San Francisco, Chicago, and Seattle—have remarkably few children living there. Certainly, the the 300-square-foot “micro-units” now all the rage among the retro-urbanist set seem unlikely to attract more families, or even married couples.

    The Persistence of the Suburban Economy

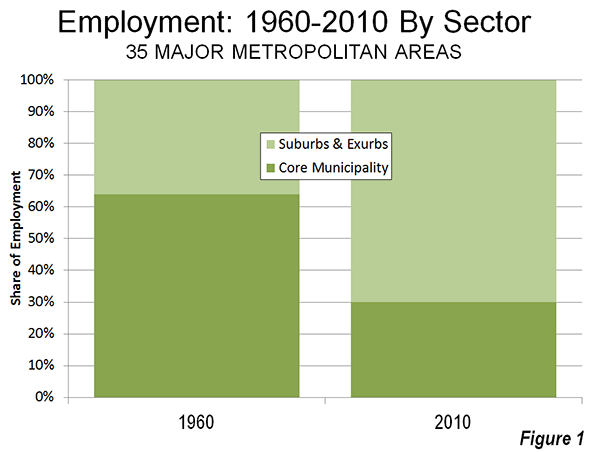
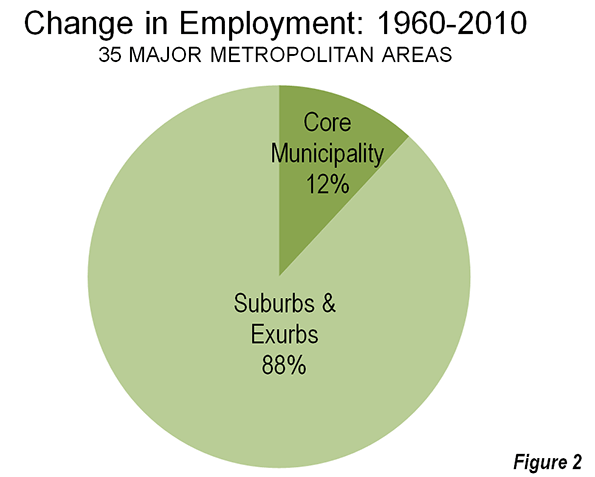
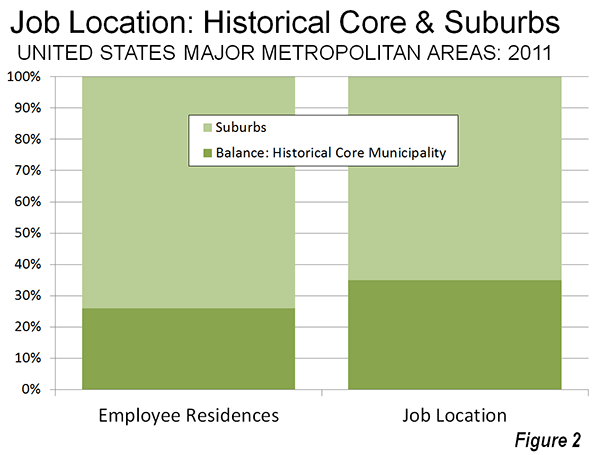
    As Americans have voted with their feet for the suburbs, employers have followed.

    Despite the attention heaped on a handful of companies like United Airlines and Quicken Loans that have moved “back to the city,” the suburbanization of the overall American economy has continued apace. Historically, suburbs served largely as residential areas, so-called bedroom communities, but their share of steadily.

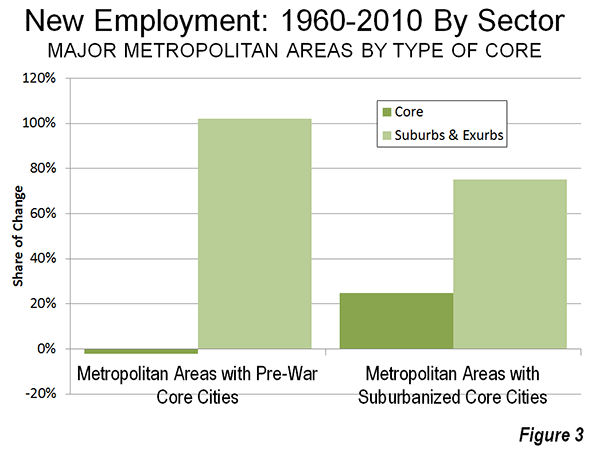
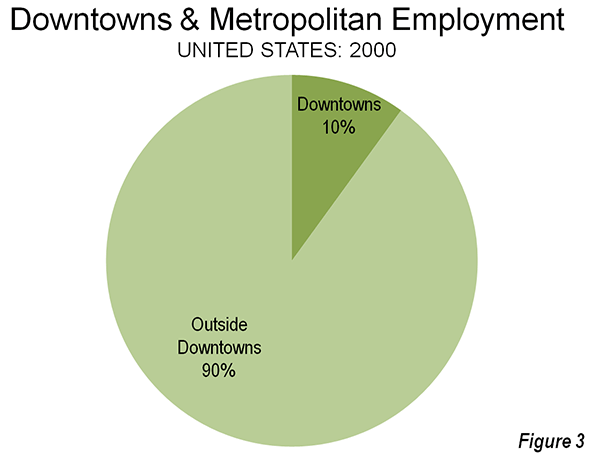
    Job dispersion is now a reality in virtually every metropolitan area, with twice as many jobs located 10 miles from city centers as in those centers. Between 1998 and 2006, as 95 out of 98 metro areas saw a decrease in the share of jobs located within three miles of downtown, according to a Brookings report. The outermost parts of these metro areas saw employment increase by 17 percent, compared to a gain of less than 1 percent in the urban core. Overall, the report found, only 21 percent of employees in the top 98 metros in America live within three miles of the center of their city.

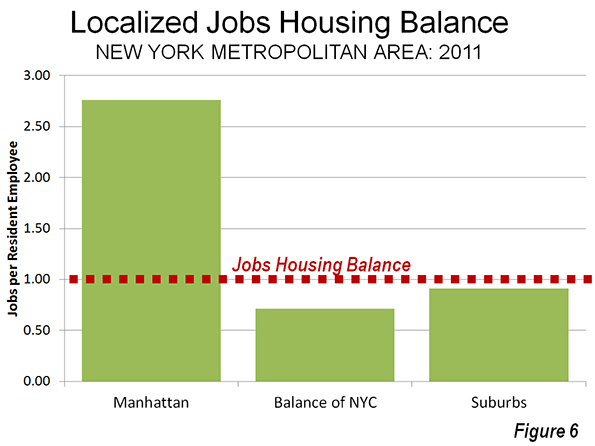
    This decentralization of jobs was slowed somewhat by the Great Recession, which hit more dispersed industries like construction, manufacturing and retail particularly hard. Yet an analysis of jobs in 2010 by the Rudin Center for Transport Policy and Management found that dispersion had continued. Between 2002 and 2010 only two of the top 10 metropolitan regions (New York and San Francisco) saw a significant increase in employment in their urban core.

    Some observers claim that job growth is coming to the urban core in response to the changing preferences of younger workers, particularly in high-tech fields and as much media attention has been given to a few prominent social media start ups in New York and San Francisco. Similar pronouncements were  made during the great dot-com boom of the late 1990s, and burst along with the bubble. In fact, the number of urban core country tech jobs actually shrank over the past decade, according to an analysis of Science, Technology, Engineering and Management (STEM) jobs by Praxis Strategy Group.

    While companies in walking distance of big-city reporters make news out of all proportion to their importance, virtually all the major tech concentrations in the country—including Silicon Valley—are suburban. San Jose is a postwar suburban core municipality, having experienced the vast bulk of its growth since 1940. Virtually all the nation’s top tech companies—Apple, Google, Hewlett-Packard, Intel, Oracle and even Facebook—are located in suburban settings 45 minutes or more from San Francisco. Apple’s recent plans to construct its new corporate campus in bucolic Cupertino elicited anger from the Environment Defense Fund and other smart-growth advocates, but reflects the fact that the vast majority of the tech industry is located, along with the bulk of its workforce, in the suburbs.

    Apple employs many experienced engineers, many of whom have families and prefer to live in suburbs. In 2012 San Francisco had a significantly lower share of STEM jobs per capita than Santa Clara County. And the new rising stars of the tech world—Austin and Raleigh-Cary—are even more dispersed and car-dependent than San Jose. 

    What Really Matters

    While they’ve weaved a compelling narrative, the numbers make it clear that the retro-urbanists only chance of prevailing is a disaster, say if the dynamics associated with the Great Recession—a rise in renting, declining home ownership and plunging birthrates—become our new, ongoing normal. Left to their own devices, Americans will continue to make the “wrong” choices about how to live.

    And in the end, it boils down to where people choose to live. Despite the dystopian portrays of suburbs, suburbanites seem to win the argument over place and geography, with far higher percentages rating their communities as “excellent” compared to urban core dwellers.

    Today’s suburban families, it should be stressed, are hardly replicas of 1950s normality; as Stephanie Coontz has noted, that period was itself an anomaly. But however they are constituted—as blended families, ones headed up by single parents or gay couples—they still tend to congregate in these kinds of dispersed cities, or in the suburban hinterlands of traditional cities. Ultimately life style, affordability and preference seem to trump social views when people decide where they would like to live.

    We already see these preferences establishing themselves, again, among   Generation X and even millennials as some move, according to The New York Times,toward “hipsturbia,” with former Brooklynites migrating to places along the Hudson River. The Times, as could be expected, drew a picture of hipsters “re-creating urban core life” in the suburbs. While it may be seems incomprehensible to the paper’s Manhattan-centric world view by moving out, these new suburbanites are opting not to re-create the high-density city but to leave it for single-family homes, lawns, good schools, and spacious environments—things rarely available in places such as Brooklyn except to the very wealthiest. Like the original settlers of places like Levittown, they migrated to suburbia from the urban core as they get married, start families and otherwise find themselves staked in life. In an insightful critique, the New York Observerskewered the pretensions of these new suburbanites, pointing out that “despite their tattoos and gluten-free baked goods and their farm-to-table restaurants, they are following in the exact same footsteps as their forebears.”

    So, rather than the “back to the cities” movement that’s been heralded for decades but never arrived, we’ve gone “back to the future,” as people age and arrive in America and opt for updated versions of the same lifestyle that have drawn previous generations to the much detested yet still-thriving peripheries of the metropolis.

    Joel Kotkin is executive editor of NewGeography.com and a distinguished presidential fellow in urban futures at Chapman University, and a member of the editorial board of the Orange County Register. He is author of The City: A Global History and The Next Hundred Million: America in 2050. His most recent study, The Rise of Postfamilialism, has been widely discussed and distributed internationally. He lives in Los Angeles, CA.

    This piece originally appeared in the The Daily Beast.

    Suburbs photo by BigStock.

  • Job Dispersion in Major US Metropolitan Areas: 1960-2010

    The continuing dispersion of employment in the nation’s major metropolitan areas has received attention in two recent reports. The Brookings Institution has published research showing that employment dispersion continued between 2000 and 2010, finding job growth was greater outside a three mile radius from central business districts between 2000 and 2010 in 100 metropolitan areas Note 1). This assessment probably underestimates the extent of job dispersion, since it includes some suburban centers as central business districts (such as West Palm Beach, FL and Palo Alto, CA).

    Recently I showed that employment dispersion has reached a point that there is a virtual balance of jobs and housing in suburban areas, which contrasts with the continuing excess of jobs in core municipalities relative to resident workers. After that article was published, Richard L. Forstall forwarded me research he presented to the Southern Demographic Association in the 1990s that examined employment trends in core municipalities and suburban areas between 1960 and 1990. At the time, Forstall was at the United States Bureau of the Census. He also spent years supervising Rand McNally international metropolitan area population estimates (Note 2).

    Major Metropolitan Job Dispersion: 1950 to 2010 and

    Forstall provides detailed information for the 35 major metropolitan areas as of 1990 (over 1,000,000 population). This article augments the Forstall research with data from the 2010 census (Note 3).

    Consistent with both national and international trends, the half century between 1960 and 2010 indicated significant dispersion in metropolitan areas. This, of course, was a continuation of a trend that accelerated from the first quarter of the 19th century, when early mass transit systems allowed people to live in larger spaces, farther away from their work.

    The movement of residents from the urban core to the suburbs followed the even greater exodus from small towns and rural areas. But it was not long before residents of the homogeneous bedroom suburbs of the 1950s began to find more nearby employment opportunities.

    In 1960, 54% of the employment in the 35 major metropolitan areas was in the historical core municipalities, with the balance of 46% of the jobs in suburban and exurban areas. By 2010, the corner municipality share had dropped to 30%, while suburban and exurban areas contained 70% of the employment (Figure 1). Between 1960 and 2010, 88% of the new jobs were in the suburbs and exurbs, leaving only 12% of the growth in the core municipalities (Figure 2).

    Dispersion Greater in Metropolitan Areas with Pre-War Non-Suburban Cores

    However, even this distribution appears to mask an even greater dispersion. Among the metropolitan areas with "Pre-war non-suburban core municipalities," (such as San Francisco, Baltimore, Providence, New York, etc.) a full 102% of job growth was in suburban and exurban areas. Core city employment accounted for a minus two percent of employment growth (in other words, it declined). These are metropolitan areas with core cities that were virtually fully developed before World War II and which have added little to their land areas by annexation.

    The other metropolitan areas have core cities with large swaths of suburbanization and some, like Phoenix and Sacramento are virtually all suburban. In these metropolitan areas, approximately 25% of the job growth since 1960 has been in the core cities (Figure 3).

    Pre-War Non-Suburban Core Municipalities Losses and Gains

    Among the 18 metropolitan areas with "Prewar non-suburban" core municipalities, two thirds experienced losses in their core cities. The Rust Belt "ground zero" core cities of Detroit, Cleveland, and Buffalo all lost 40 percent or more of their employment, and were joined by second tier Rust Belter St. Louis. The core city of Pittsburgh, typically one of the Rust Belt’s big four, did much better, losing only five percent of its employment. Across the state, however, the core city of Philadelphia did much worse, dropping 23 percent of its employment. The core city of Chicago lost 20 percent of its employment.

    Perhaps most notable was the core city of Hartford, which lost 9 percent of its employment between 1960 and 2010. According to data in the Brookings Institution Global Metro Monitor, Hartford has emerged as the world’s most affluent major metropolitan area (measured by gross domestic product per capita) over the same period. All of Hartford’s job growth was in the suburbs and exurbs.

    The core city of New York did the best among the metropolitan areas with "Pre-War non-suburban" cores, attracting 16 percent of the employment growth over the half-century. Washington (DC) also did well, with a 12 percent share of new employment.

    Urban Dispersion and the Quality of Life

    The dispersed metropolitan area, along with its comprehensive roadway networks, has served the US well, especially in two important measures of the quality of life — housing affordability and mobility. Major metropolitan areas in the United States have some of the most affordable housing in the high-income world. The US has shorter work trip travel times than Canada or Western Europe and much shorter than the major metropolitan areas of Japan (with the most comprehensive rail systems in the world) and East Asia.

    This advantage was reiterated with the recent release of the Tom Tom Congestion Index, which showed traffic congestion in the metropolitan areas of Australia and New Zealand to be far worse than in US metropolitan areas of similar size. For example, Sydney is as congested as Los Angeles, despite having only one-third the population. Auckland (New Zealand) has worse traffic congestion than any US metropolitan area of similar size.

    Peter Gordon and Harry W. Richardson spotted this advantage nearly two decades ago (See Are Compact Cities a Desirable Planning Goal?), before there was international traffic congestion comparison data. Based upon their review of national travel surveys, they concluded:

    Suburbanization has been the dominant and successful mechanism for reducing congestion. It has shifted road and highway demand to less congested routes and away from core areas.

    Wendell Cox is a Visiting Professor, Conservatoire National des Arts et Metiers, Paris and the author of “War on the Dream: How Anti-Sprawl Policy Threatens the Quality of Life.

    ——-
    Note 1: The Brookings Institution report indicates that employment within a 3 mile radius of downtown (the central business district) increased in number and share only in the Washington, DC metropolitan area. However, this may not indicate an increase in central business district (downtown) employment. The large, nearby, but suburban employment centers of Rosslyn, Crystal City and downtown Alexandria may be located within the three mile radius (the report does not indicate the point from which the radius is drawn). The three mile radius used in the report is useful and represents the best reported data. However, it may not be representative of central business district employment encloses a huge area (28 square miles), which is more than 25 times the typical central business district geographical size and larger than the land areas of the core cities of Providence and Hartford and nearly two-thirds the size of the core city of San Francisco. Transit commuting to such nearby employment centers is routinely far lower than the share that ride transit to downtown.

    Note 2: Forstall is co-author (with Richard P. Greene and James B. Pick of seminal research that estimated the population densities of the largest metropolitan areas in the world (Which Are the Largest: Why Lists of Metropolitan Areas Vary So Greatly). Normally, metropolitan area densities cannot be validly compared because of widely varying criteria between nations. Further, in the United States, metropolitan area densities are nonsensical, because their building blocks vary in size too much. With its County-based definitions, US metropolitan areas include building blocks ranging from half the size of Orlando’s Walt Disney World (New York County, or Manhattan borough) to the size of the nation of Costa Rica (San Bernardino County). The use of such a crude building block results in the inclusion of huge amounts of rural territory that is outside the labor market or the commuting shed (metropolitan areas are typically defined as labor markets). Forstall and his coauthors applied criteria that was both consistent and rational. This exhaustive process limited the number of metropolitan areas for which they were able to make estimates to 28.

    Note 3: This analysis differs from Forstall’s approach in defining core cities using the historical core municipality classification. It should be noted that there have been changes in metropolitan definitions over the 50 years.

    Photo: Suburban employment in Chicago (by author)

  • US Suburbs Approaching Jobs-Housing Balance

    Suburban areas in the US metropolitan areas with more than 1 million total regional population, once largely seen as bedroom communities, are nearing parity between jobs and resident employees. The jobs housing balance, which measures the number of jobs per resident employee in a geographical area has reached 0.89 (jobs per resident workers) in these 51 major metropolitan areas, according to data in the 2011 one-year American Community Survey. This is well below the 1.39 ratio of jobs to resident employees in the historical core municipalities (Figure 1).

    The historical core municipalities still have a larger share of metropolitan employment than they have of resident workers. However, 65 percent of major metropolitan area jobs are now in the suburbs, where 74 percent of workers live (Figure 2). The 0.89 jobs housing balance index indicates that there are only 11 percent fewer jobs in the suburbs than resident workers. Overall, the jobs housing balance of metropolitan areas (a synonym for labor markets) is at or near 1.00.

    From Monocentric to Polycentric to Dispersed Cities
    The data indicates the extent to which the classical monocentric city has been left behind by the evolution of the modern metropolitan area. Before the near universal extension of automobile ownership, cities were necessarily much more monocentric. Transit lines tended to converge on downtown, which made downtowns far more dominant in their share of metropolitan employment than they are today.

    For example, in 1926, according to historian Robert M. Fogelson writing in Downtown: Its Rise and Fall: 1880-1950, in 1926 41 percent of Los Angeles residents went to downtown every day, a figure that had dropped to 15 percent by 1953, principally for work and shopping. Today, in a much larger metropolitan area that also includes Orange County, 3 to 5 percent of jobs are located downtown (depending on the geographical definition). The area not only lost a significant share of metropolitan employment, but saw its share of retail sales drop as regional shopping centers were built throughout the area. Similar trends occurred in virtually every metropolitan area of the United States.

    All of this occured as the automobile facilitated access to virtually everywhere in the metropolitan area, not just downtown.

    The emerging polycentricity of the city long was obvious to many analysts, but it was Joel Garreau who brought the issue to popular attention in his classic Edge City: Life on the New Frontier. Garreau documented the development of large suburban employment centers throughout the major metropolitan areas and provided a list. Later, Robert Lang of the University of Nevada Las Vegas took the issue further in his Edgeless Cities: Exploring the Elusive Metropolis, which examined office space outside downtown areas and edge cities in 1999. Gross office space was greatest outside both the downtowns and edge cities, according to Lang’s data (Note 1).

    Lang’s analysis is limited to office space, which is more concentrated in downtown areas than employment. On average, 2000 data indicates that downtown areas had approximately 10 percent of employment, well below downtown’s 36 percent share of office space (Figure 3).

    Even so, there remains a misconception today that cities remain monocentric. Yet as the figures show we are progressing toward a distribution of jobs that nearly matches its distribution of housing, with the exception of downtown (where there is the greatest imbalance, see below).

    Historical Core Municipalities: Where the Jobs-Housing Imbalance is the Greatest

    The excess of jobs in relation to residential workers is greatest in the historical core municipalities. It is driven by the downtown areas (central business districts or CBDs), which have by far the highest employment densities in the metropolitan areas. For example, in 2000, the downtown areas of the nation’s 50 largest urban areas had an average job density 92,000 per square mile. This is approximately 70 times the average non-downtown urban area employment densities (1,300 per square mile). Downtown residential densities, if they were readily available, would doubtless be a small fraction of the downtown employment figures.

    Largest Historical Core Municipality Jobs-Housing Imbalances

    The imbalance between jobs and housing is highest among the historical core municipalities of Washington (2.63), Salt Lake City (2.61), Orlando (2.48), Miami (2.44) and Atlanta (2.31). Yet, these large historical core municipality imbalances co-exist with generally near average suburban jobs housing balances. For example, in Washington there are 0.87 jobs per resident worker in the suburbs, or only 13 percent fewer jobs than workers who reside in the suburbs. In the other four metropolitan areas, the suburban jobs housing balance is above 0.80 (Figure 4).

    Smallest Historical Core Municipality Jobs-Housing Imbalances

    The smallest historical core municipality jobs housing imbalance is in San Jose (0.84), which is the only major metropolitan area in which has fewer jobs than resident workers (Figure 5). However, the municipality of San Jose is a "Post War Suburban" core municipality, having experienced virtually all of its growth since 1940. This is despite the fact that San Jose’s corresponding urban area is the third most dense (following Los Angeles and San Francisco). Generally higher suburban housing densities were built in San Jose compared to less dense urban areas – which extend over vast distances – such as New York, Philadelphia and Boston. San Jose is also the only metropolitan area in which there are more suburban jobs than suburban resident workers (1.41 jobs per worker).

    The other historical core municipalities with the least imbalance between employment and resident workers are Los Angeles (1.10), Chicago (1.17), Milwaukee (1.17) and New York (1.17). The surprising inclusion of New York is discussed below.

    Each of the historical core municipalities with the fewest jobs per resident worker has a higher than average jobs housing balance in its suburban areas. Los Angeles has 1.02 jobs per suburban resident worker, principally the result of importing workers from the adjacent Riverside-San Bernardino metropolitan area. Milwaukee also has more suburban jobs than suburban resident workers (1.01).

    New York

    New York has the second largest central business district in the world, following Tokyo. It therefore seems odd that the municipality of New York should have such a low ratio of jobs per resident worker. The borough of Manhattan, where the central business district is located, has 2.76 jobs per resident workers, higher than that of top ranked Washington, DC (above). There are 1,450,000 more jobs than resident workers in Manhattan.

    New York’s low ratio is the result of a huge shortage of jobs relative to workers the outer boroughs (the Bronx, Brooklyn, Queens and Staten Island). There are 830,000 fewer jobs than resident workers in the four outer boroughs. Their ratio of jobs per resident, at 0.71 is lower than all but five suburban areas in the other 50 major metropolitan areas (Figure 6).

    The suburbs of New York, ironically, are more job-rich than the outer boroughs. They boast an 0.91 jobs per resident worker, ranking 17th out of the 51 metropolitan areas.

    The New Normal

    The former assumption that "everyone works downtown" is a thing of the past. Dispersion of jobs throughout the metropolitan area has become the rule. The "old normal" was that of the bedroom community – people living in the suburbs and working in the core cities. The "new normal" is about downtown and the core city. To the extent that there is a distortion in the jobs housing balance throughout the modern metropolitan area, it is the result of a larger number of jobs than residents in the core cities (and especially downtown).

    Wendell Cox is a Visiting Professor, Conservatoire National des Arts et Metiers, Paris and the author of “War on the Dream: How Anti-Sprawl Policy Threatens the Quality of Life.

    ———————-

    Photo: Houston downtown (to the left), edge city (Texas Medical Center in the middle) and dispersed employment (rest of photo). Photo by author.

    Note 1: The total office space outside the primary downtowns, secondary downtowns and edge cities was 37.0 percent in reviewed 13 metropolitan areas. Primary downtowns accounted for 36.5 percent, secondary downtown for 6.5 percent and edge cities for 19.8 percent (this analysis classifies Beverly Hills, Mid-Wilshire and Santa Monica in Los Angeles  as secondary downtowns, rather than as primary as in the book. See tables 4-2 and 4-10).

    Note 2: The historical core municipalities are the largest municipalities in each metropolitan area, with the following exceptions.
    (a) Oakland and St. Paul are also historical core municipalities.
    (b) Norfolk is the historical core municipality in the Virginia Beach metropolitan area.
    (c) San Bernardino is the historical core municipality in Riverside San Bernardino
    (see Classification of Historical Core Municipalities)

  • What Killed Downtown?

    What Killed Downtown?: Norristown, Pennsylvania, from Main Street to the Malls
    by Michael E. Tolle

    For those of us who have grown dyspeptic on the over-indulged topic of the collapse of the American city center, Michael Tolle’s What Killed Downtown? Norristown, Pennsylvania, from Main Street to the Malls earns much of its anodyne appeal by straying from a commonly accepted convention in urban studies—that an analysis of the socioeconomic decline of a community should draw heavily upon socioeconomic variables. Isn’t there another way to get the point across? And more importantly, aren’t there other contributing factors?

    This compassionate narrative of the 20th century rise and fall of an older Philadelphia suburb avoids graphs and charts for the most part, becoming much more engaging for its alternative approach. And likeability is exactly what it will need to win over skeptics, or the merely apathetic, because most people in the US probably have never heard of Norristown. In fact, it’s likely that quite a few people on the other side of the Keystone State aren’t familiar with it either. After all, the borough at its 1960 peak only had 39,000 inhabitants (the 2010 Census records a population of 34,000). But Norristown merits further observation, not so much because its downtown has declined in the mid-20th century—that happened everywhere, in municipalities of all sizes—but because Norristown sits squarely in the middle of Montgomery County, an expansive bedroom community of Philadelphia with 800,000 people and a median household income of over $78,000, placing it within the top 100 wealthiest counties in the nation. Meanwhile, Norristown’s median household income, according to the latest Census, is approximately $43,000 and its poverty level of 16.4% is almost triple that of the county’s 5.7%, and still a fair amount higher than the state’s rate of 12.6%. While Montgomery County boomed over the last half century, Norristown has not shared in that prosperity. It is by no means a devastated town—many old neighborhoods remain charming and fully intact—but the commercial heart of Norristown has never healed.

    The above paragraph contains a higher concentration of raw data than one should ever expect to encounter in Tolle’s new book. Rather than delving into the Bureau of Labor Statistics, the US Census Bureau, or rankings from Urban Land Institute or the Brookings Institution, Tolle manages to chronicle the rapid ascent of this suburban outpost, its 75-year dominion over commercial activity within the county, and its precipitous decline shortly after the Second World War—and he achieves it through a diligent perusal of old city directories, interviews with almost two dozen of Norristown’s older citizenry, and a vigorous exploration of the internal machinations of the Borough Council. He applies an anthropologist’s lens to a subject that sociologists have long overcrowded.

    While Norristown’s early history—first as a manor under one of William Penn’s initial surveys, followed by a subdivision into smaller farms by Isaac Norris in 1712—is clearly never the focal point for Tolle’s methodical dissection of downtown, he avoids glossing over it. Not surprisingly, Norristown emerged as the most desirable plot of land in the sprawling manor because of its accessibility: it abutted the “canoeable part of the Schuylkill” and the interconnected American Indian trails that allowed for easy fording of the river. By 1784, the Pennsylvania Assembly carved Montgomery County out of the existing Philadelphia County, and a subsequent deed conveyed lots reserved for county buildings at the intersection of two of the only extant roads at the time. Due to its advantageous location, it became a nearly self-sufficient Town of Norris within a few years, abiding by Penn’s “Town Model” for Philadelphia and other Pennsylvania cities, employing tightly organized, gridded streets that maximized uses of available space. The construction of some of the earliest turnpikes helped to stimulate the town’s steady growth and prepare it for its incorporation as a borough of 520 acres in 1812, followed shortly thereafter by the rail networks that galvanized further expansion.


    Swede Street just north of Main Street, known by some as Lawyers’ Row. Photo from Spring 2011, courtesy of Matthew Edmond.

    The early chapters of the book may only provide a backdrop for Norristown’s 20th century rise and fall, but Tolle chronologically accounts for the factors that helped Norristown emerge as the primary urban center in Montgomery County. And unlike neighboring 19th century boomtowns that dot both the Delaware and Schuylkill Valleys, Norristown “lacked the characteristics that define similar towns of sufficient size and influence that could easily explain the downtown’s decline. . . [It] was never a one-company town. It was never dependent on [a] single employer whose corporate fate might have led it to a catastrophic domino effect; rather Norristown’s workforce has always been distributed among many workplaces.” It owed much of its steady growth to its fortuitous location 17 miles northwest of Philadelphia, the convergence of several modes of transportation, and its role as the administrative center of a large and increasingly prominent county.

    By the book’s twentieth page, Tolle reveals the real heart of his study: the bustling commercial core of Norristown’s six-block Main Street. At the borough’s Centennial Celebration, population approached 30,000, swelling largely from immigrants who arrived to work in various industries: first the northern European Protestants, then the Irish, then, in by far the highest concentration, the Italians, overwhelmingly from Sicily. Mennonites, Amish, and Jews (predominantly of German heritage) along with African Americans arrived in smaller numbers. While the population self-segregated along largely ethnic and economic lines (working and lower-middle class Protestants on the West End; the wealthy, Northern European original settlers in the North End and DeKalb Street; Italians and African Americans in the blue-collar East End), all the strata converged along Main Street’s densely commercialized blocks. Tolle explores the full week’s worth of celebratory activities, from the details of the floats in the Industrial Day parade to overhead weave of flags, bunting, and electrical wires. The pace of the narrative slows at this point, but Tolle employs a humanism that he retains across the ensuing pages. When he intermittently bogs down in relentless detail, he’s easily forgivable—even a little admirable for not shying away from his obsessions.


    A view of DeKalb Street, Norristown’s most affluent residential address, from its southern junction with Main Street. This was once the center of commercial activity in the borough. Tolle details the controversy of the implementation of the Comprehensive Plan to make DeKalb Street one-way northbound in 1951, a restriction which remains today. Photo from Spring 2011, courtesy of Matthew Edmond.

    The Directory of the Boroughs of Norristown and Bridgeport, Montgomery County, Pa, for the years 1860-1861 serves as the bedrock for his chronological exploration of the commercial health of downtown Norristown. For some of the most resilient businesses—Chatlin’s Department Store, Egolf’s Furniture, Zummo’s Hardware—Tolle offers vignettes on their immigrant backgrounds and the financial maneuvering necessary to start their trades. Interspersed with these brief accounts are updates from subsequent City Directories, chronicling the change in business composition over time. But Tolle generally eschews tables and charts—with few exceptions, he narrates the changing commercial landscape of Norristown by integrating the livelihoods of the proprietors with the demands of the consumers. Because the authorial voice depends so heavily on firsthand accounts of the business climate—articles from the Norristown Times Herald, advertisements (including misspellings and solecisms), and, in the later years, eyewitness accounts—the routine references to City Directory data never grow stuffy or monotonous.


    What Killed Downtown? is a concatenation of anecdotes. While such an indulgence in human-interest nostalgia could take a maudlin turn, Tolle again counterbalances these episodes with moments of acerbic subjectivity, as any conscientious anthropologist cannot help but do. My two favorite anecdotes feature a building and a person. The Valley Forge Hotel emerged in the roaring 1920s, purely driven by the local business community, who felt that the proud city demanded a first-class hotel. A stock subscription campaign raised enough to complete the massive six-story brick structure by November of 1925. Though it rarely made a profit, its size and relative opulence made it an icon for the city, and as an emblem of civic pride, it succeeded. The other great anecdote involves the detailed account of the life of the city’s most colorful politician, the recalcitrant Paul Santangelo. Lacking greater aspirations than borough administration, Santangelo earns more ink on these pages than any other civic leader, including the mayors. He fiercely defended the interests of the poorer Sicilian immigrants who comprised much of his district, voting ferociously in their favor but often—in Tolle’s opinion—at the expense of city progress as a whole.


    Norristown Main Street, west of Swede Street and looking westward. Photo from Spring 2011, courtesy of Matthew Edmond.

    Tolle’s account of Norristown’s Main Street after its 1950 apex avoids mind-numbing predictability even has he identifies the usual culprits contributing to its decline: growing dependence on the automobile, competition from suburban shopping plazas like the now-mammoth King of Prussia, shift of the population center toward the far-southern part of Montgomery County, construction of limited access highways outside of the borough’s limits. And of course, all these factors converge with the suburban amenity that wounds Norristown the most: “free, ample parking”—a mantra which Tolle repeats enough that it tacitly answers the question to his book’s title. Anyone with a scintilla of knowledge of American urbanism will know where this is headed. But by the1950s, Tolle reaches a point in time where procures firsthand accounts of Main Street’s changes. The worm’s-eye view continues, imbuing the narrative of Norristown’s saddest days—by the 1970s it is not safe to walk Main Street at night—with empathy and hope.


    Courthouse Plaza along Main Street, one of many mid-century projects that removed commercial buildings and replaced them with staid, largely unused civic space. Photo from Spring 2011, courtesy of Matthew Edmond.

    For a person as enamored by details as me, Tolle’s worm’s-eye view never really grows old, even when he’s a fussbudget over counts of shuttered storefronts from year to year. At the same time, this intricate approach to an already small subject could easily undermine the ability for What Killed Downtown? to find a broad audience. What happens to a little-known suburban city can hardly resonate as much as if he had explored the devolution of downtown Philadelphia—or even Allentown or Erie. The fixation on downtown storefronts—at the expense of geographic context—firmly ensconces the book in the “local interest” category. His 250-page narrative rarely explores impacts on Norristown Main Street outside of Montgomery County. From an early point in the book, he describes street intersections with specificity that would only mean anything to a local; then he only provides two referential maps.

    None of these cavils really amount to an inherent weakness of the book—after all, it might prove just the right medicine for Tolle’s fellow Norristowners. But the narrowness of scope does foretell an oversight as to the broader implications for this city’s decline, which could have made for a much bolder peroration than the one the book currently provides. The only atypical bogeyman contributing to downtown Norristown’s precipitous decline is the persistent political gridlock and resultant incompetence of the Borough Council, which he relates with the same humanist eye he applies to his wonderful vignettes of immigrant entrepreneurialism. But Tolle had the chance to make this story matter on a scale that could mean something to someone from Ashtabula or Waukegan, and he spurned the opportunity.

    My knowledge of Philadelphia, having lived there for a time, gives me an unfair advantage, but I can’t help but ask a few questions. Norristown, the seat of wealthy Montgomery County, declined and its main street is moribund to this day. But Media, the much smaller seat of neighboring Delaware County, boasts a flourishing main street of local shops and restaurants—all despite the fact that Delaware County, while equally urbanized, is much less affluent than Montgomery County. Meanwhile, cities like Chester (also in Delaware County) and Camden, New Jersey can claim a similar lifespan to Norristown, strong transportation access, and an industrial boom. But today these two cities are not only among the most devastated municipalities in their respective states, Chester and Camden are among the poorest cities in the country. Perhaps most interestingly, after several decades of population decline, Norristown began to trend upward again in the 2000 census, and by the 2010 Census the city grew virtually 10%–an unprecedented occurrence for a city that still has the reputation of being the poorest place in its respective county.

    What Killed Downtown? remains a welcome contrast to countless other chronicles of downtown decline whose narratives depend on sociological detachment. Recognizing that true objectivity is impossible, Tolle instead depicts the Norristown transformation from the perspective of people who experienced it. Because its vision is geographically precise and obscure to people outside southeast Pennsylvania, I suspect our author felt driven to write it even if it enjoyed a readership of zero. Such an endeavor could reek of self-indulgence, but Michael Tolle’s opus has way too much empathy for that. Hopefully Norristown’s coterie of model train owners and newspaper collectors will put this book on their to-do lists—and then recommend it to others.

    Eric McAfee is a licensed urban planner currently working in emergency management. Though he hails from Indianapolis, his professional field grants him a certain degree of itinerancy, which he uses to his advantage to write about and photograph landscapes across the country in his blog, American Dirt. He lived and worked as a military planner in northern Afghanistan from 2010 to 2012, letting him fudge on the “American” aspect of his blog a little bit. In the past, Eric’s writing has won him Outstanding Paper in Real Estate at the University of Pennsylvania, as well as an outstanding research on housing award from the Joint Center for Housing Studies at Harvard University.  Aside from American Dirt, he has featured his writing on Urban Indy.com, Streetsblog.net, and Urbanophile.com. 

  • America’s Fastest- and Slowest-Growing Cities

    Since the housing crash of 2007, the decline of the Sun Belt and dispersed, low-density cities has been trumpeted by the national media and by pundits who believe America’s future lies in compact, crowded, mostly coastal and northern, cities. But apparently, most Americans have not gotten the memo — they seem to be accelerating their push into less dense regions of the Sun Belt.

    An analysis of population data by demographer Wendell Cox, including the Census report for the most recent year released late last week, shows that since 2000, virtually all the 10 fastest-growing metropolitan areas in the United States are located in Sun Belt states. The population of the Raleigh, N.C., metropolitan statistical area has expanded a remarkable 47.8% since 2000, tops among the nation’s 52 metro areas with over 1 million residents. That is more than three times the overall 12.7% growth of those 52 metro areas.

    Austin, Texas, and Las Vegas also expanded more than 40%, putting them second and third on our list. The populations of the other metro areas in the top 10 all expanded by at least 25%, or twice the national average. This jibes nicely with domestic migration trends and growth in the foreign-born population, both of which have been strongest in many of these same cities.

    The most recent numbers, covering July 2011 to July 2012, also reveal some subtle changes in the Sun Belt pecking order. Over the 2000-2012 period, the growth winners   included places like Las Vegas, Riverside-San Bernardino and Phoenix, all of which suffered grievously in the housing bust. Although they all clocked population growth better than the national average over the past year, none, besides Phoenix, ranked in the updated top 10.

    Growth momentum has shifted decidedly toward Texas. Austin’s population expanded a remarkable 3% last year, tops among the nation’s 52 largest metro areas. Three other Lone Star metropolitan areas — Houston, San Antonio and Dallas-Ft. Worth — ranked in the top six and all expanded at roughly twice the national average. The other fastest-growing metros over the past year include Raleigh, Orlando, Phoenix, Charlotte and Nashville. One unexpected fast-growth area has been Oklahoma City, which ranked 20th between 2000 and 2012, but notched the 12th spot last year, with a growth rate 60% above the national average.

    What explains these subtle shifts? Some of it can be traced, of course, to the stronger growth in energy-rich areas such as Texas as well as Oklahoma City. The differences are particularly striking when looking at varying economic growth rates among the country’s largest regions. In 2011 the Houston metro area, whose population is up by 1.4 million since 2000, also enjoyed the fastest GDP growth, at 3.7%, of any of the nation’s top 20 regions. Dallas-Fort Worth clocked a respectable 3.1%.

    In contrast, the GDP growth rates for the hip, dense metro areas lagged behind. Among the elite cities, the tech hubs of San Francisco , Seattle and Boston have done the best, posting GDP growth around 2.5%. But the economies of New York, Los Angeles, Philadelphia and, surprisingly, Washington D.C., grew at roughly half the rate of Houston.

    But it’s not just economic factors at play. One remarkable similarity in all the fastest-growing areas is their relatively low population densities. Although Raleigh and Austin are held out as “hip” cities, they have very low-density urban cores. Not one of the top 10 growth cities for 2010 to the present, or last year, had urban core densities more than a half of those of places like Boston (40th for 2000 to the present), New York (41st),  Los Angeles (42nd) or Chicago (43rd).

    At the same time, we have to consider the issue of housing affordability, something that rarely comes up among proponents of “cool” cities. In contrast to slower-growing San Francisco, New York and Los Angeles, most of the fastest-growing cities have lower housing prices relative to income. Particularly notable are the low prices in areas such as Austin, Raleigh, Houston and Dallas-Fort Worth, where housing costs are half or less than in the more highly regulated “cool” cities.

    Lower housing costs also seem to impact another critical growth component: family formation. Immigrants and domestic in-migrants are important to population growth but equally critical is whether longtime residents in a region choose to have children. Virtually all the top 10 metro areas, both last year and since 2000, have also ranked among the fastest growing in terms of the population under 15; Raleigh’s child population alone has expanded by almost 45% since 2000, compared to 2% nationally;  Austin’s toddler population surged a remarkable, 38%. The child populations of Houston, Dallas-Fort Worth, Atlanta, Phoenix, Las Vegas and Orlando all  increased by 20% or more.

    In contrast, none of the hip cities posted under 15 population growth better than 5%. The number of children has actually declined in many, including New York, Los Angeles, Boston, San Francisco and Chicago. Even with substantial influxes from abroad, particularly in New York, it’s difficult for these areas to sustain population increases when the number of children keeps dropping.

    The problem may be even more intense in Los Angeles and Chicago, whose economies continue to lag further behind. But the demographic challenges of the Big Orange and the Windy City pale compared to those faced by many cities in the old industrial Rust Belt, which have either lost population or posted only weak increases.

    Cleveland’s population is down 3.9% since 2000, the worst performance among the nation’s biggest metro areas apart from disaster-struck New Orleans. Cleveland lags in both family formation and has seen strong outmigration, but also attracts few foreign-born residents. Much the same can be said of Providence, R.I., Pittsburgh, Buffalo and Detroit. Nor do things seem to be improving with time; these areas continued to inhabit the nether regions in the most recent Census reports.

    So what do these trends tell us about the demographic evolution of our major metropolitan areas? Certainly sustained economic growth, low density and more affordable housing all clearly continue to push the center of population gravity toward certain Sun Belt cities, primarily in the Southeast and Texas. It turns out that neither the Great Recession, the housing bust or a much hyped preference for dense urbanity is turning this around.

    Major Metropolitan Areas (Over 1,000,000) Population
    Ranked by Population Change Percentage: 2000-2012 (2013 Geography)
    Rank Metropolitan Area 2000 2012 2000-2012 Growth 2000-2012 % 2011-2012 %
    1 Raleigh, NC           804,436        1,188,564        384,128 47.8% 3.3%
    2 Austin, TX        1,265,715        1,834,303        568,588 44.9% 3.1%
    3 Las Vegas, NV        1,393,370        2,000,759        607,389 43.6% 3.1%
    4 Orlando, FL        1,656,835        2,223,674        566,839 34.2% 2.5%
    5 Charlotte, NC-SC        1,729,023        2,296,569        567,546 32.8% 2.4%
    6 Riverside-San Bernardino, CA        3,277,578        4,350,096     1,072,518 32.7% 2.4%
    7 Phoenix, AZ        3,278,661        4,329,534     1,050,873 32.1% 2.3%
    8 Houston, TX        4,716,964        6,177,035     1,460,071 31.0% 2.3%
    9 San Antonio, TX        1,719,262        2,234,003        514,741 29.9% 2.2%
    10 Dallas-Fort Worth, TX        5,239,149        6,700,991     1,461,842 27.9% 2.1%
    11 Atlanta, GA        4,297,419        5,457,831     1,160,412 27.0% 2.0%
    12 Nashville, TN        1,387,274        1,726,693        339,419 24.5% 1.8%
    13 Jacksonville, FL        1,126,224        1,377,850        251,626 22.3% 1.7%
    14 Sacramento, CA        1,808,442        2,196,482        388,040 21.5% 1.6%
    15 Denver, CO        2,194,022        2,645,209        451,187 20.6% 1.6%
    16 Washington, DC-VA-MD-WV        4,862,582        5,860,342        997,760 20.5% 1.6%
    17 Salt Lake City, UT           942,666        1,123,712        181,046 19.2% 1.5%
    18 Portland, OR-WA        1,936,108        2,289,800        353,692 18.3% 1.4%
    19 Tampa-St. Petersburg, FL        2,404,273        2,842,878        438,605 18.2% 1.4%
    20 Oklahoma City, OK        1,097,874        1,296,565        198,691 18.1% 1.4%
    21 Seattle, WA        3,052,379        3,552,157        499,778 16.4% 1.3%
    22 Richmond, VA        1,058,816        1,231,980        173,164 16.4% 1.3%
    23 Indianapolis. IN        1,664,431        1,928,982        264,551 15.9% 1.2%
    24 Columbus, OH        1,681,865        1,944,002        262,137 15.6% 1.2%
    25 Miami, FL        5,025,806        5,762,717        736,911 14.7% 1.1%
    26 San Diego, CA        2,824,987        3,177,063        352,076 12.5% 1.0%
    27 Minneapolis-St. Paul, MN-WI        3,044,901        3,422,264        377,363 12.4% 1.0%
    28 Kansas City, MO-KS        1,818,073        2,038,724        220,651 12.1% 1.0%
    29 Louisville, KY-IN        1,123,966        1,251,351        127,385 11.3% 0.9%
    30 Memphis, TN-MS-AR        1,216,293        1,341,690        125,397 10.3% 0.8%
    31 San Jose, CA        1,739,669        1,894,388        154,719 8.9% 0.7%
    32 Birmingham, AL        1,053,394        1,136,650          83,256 7.9% 0.6%
    33 San Francisco-Oakland, CA        4,136,658        4,455,560        318,902 7.7% 0.6%
    34 Baltimore, MD        2,557,501        2,753,149        195,648 7.6% 0.6%
    35 Grand Rapids, MI           934,388        1,005,648          71,260 7.6% 0.6%
    36 Virginia Beach-Norfolk, VA-NC        1,584,042        1,699,925        115,883 7.3% 0.6%
    37 Cincinnati, OH-KY-IN        1,999,787        2,128,603        128,816 6.4% 0.5%
    38 Philadelphia, PA-NJ-DE-MD        5,693,275        6,018,800        325,525 5.7% 0.5%
    39 Hartford, CT        1,150,915        1,214,400          63,485 5.5% 0.4%
    40 Boston, MA-NH        4,402,611        4,640,802        238,191 5.4% 0.4%
    41 Los Angeles, CA      12,398,950      13,052,921        653,971 5.3% 0.4%
    42 New York, NY-NJ-PA      18,976,899      19,831,858        854,959 4.5% 0.4%
    43 Chicago, IL-IN-WI        9,117,732        9,522,434        404,702 4.4% 0.4%
    44 St. Louis,, MO-IL        2,678,224        2,795,794        117,570 4.4% 0.4%
    45 Milwaukee,WI        1,502,305        1,566,981          64,676 4.3% 0.4%
    46 Rochester, NY        1,066,335        1,082,284          15,949 1.5% 0.1%
    47 Providence, RI-MA        1,586,744        1,601,374          14,630 0.9% 0.1%
    48 Pittsburgh, PA        2,429,023        2,360,733        (68,290) -2.8% -0.2%
    49 Buffalo, NY        1,169,159        1,134,210        (34,949) -3.0% -0.3%
    50 Detroit,  MI        4,457,471        4,292,060      (165,411) -3.7% -0.3%
    51 Cleveland, OH        2,147,948        2,063,535        (84,413) -3.9% -0.3%
    52 New Orleans. LA        1,336,795        1,227,096      (109,699) -8.2% -0.7%

    Analysis by Wendell Cox, Demographia

    Joel Kotkin is executive editor of NewGeography.com and a distinguished presidential fellow in urban futures at Chapman University, and a member of the editorial board of the Orange County Register. He is author of The City: A Global History and The Next Hundred Million: America in 2050. His most recent study, The Rise of Postfamilialism, has been widely discussed and distributed internationally. He lives in Los Angeles, CA.

    This piece originally appeared at Forbes.com.

  • Chicago: Outer Suburban and Exurban Growth Leader

    Greg Hinz at Crain’s Chicago Business congratulates Chicago for its nation-leading population growth. Heinz also notes that the far suburbs also gained population strongly, but there had been losses in the areas between the two. He asks: "the question now is whether the area can prosper with a thriving core but sinking neighborhoods and inner-ring suburbs around it."

    The area within 2 miles of downtown gained nearly 50,000 people between 2000 and 2010. No other US metropolitan area equaled this urban core population increase.

    The article cites a number of factors beyond population growth to indicate that the city of Chicago is outperforming the suburbs. Retail sales tax collections have increased faster in the city. However, Hinz also notes that there has also been a sizable proliferation of big-box stores (Target and Wal-Mart), which is made it possible for residents to shop in the city instead of the suburbs.

    Empty Nesters Not Flocking to Downtown

    Hinz notes that "empty nesters" are moving to the urban core. Yet this is not confirmed by the data. Between 2000 and 2010, the age cohort that was from 55 to 64 years old in 2000 dropped by 55 percent as a share of the population in the fast growing core census tracts of central Chicago. In contrast, in the city of Chicago overall, the loss was 25%, and the reduction was 24% in the entire metropolitan area (Figure 1). Our previous national research showed that the population losses in this cohort were the greatest in the core cities among the 51 major metropolitan areas.

    The article goes on to quote Alan Ehrenhalt to the effect that an "inversion" of the city to suburban movement pattern is occurring, and "it’s happening more in metropolitan Chicago than just about any other city in the country."

    "Inversion" implies "turning upside down." For an inversion to have occurred, there would need to have been a reversal of the trend in movement from the core cities to the suburbs. The most important indicator of any such inversion would be that domestic migration would show a flow from a suburbs to cities. It does not. Domestic migration from Cook County, in which Chicago is located, was minus 740,000 between 2000 and 2011 (Note). Domestic migration in the suburban counties was a plus 139,000. Thus, there was no net migration from the suburbs to Cook County (Figure 2).  

    The City of Chicago Outside Downtown

    The story was much different outside the core area. The balance of the city, where 93 percent of the people live, lost 250,000 residents – a loss greater than that of any municipality in the nation over the period – including Detroit. The losses were pervasive. More than 80 percent of the city’s 77 community areas located outside the core lost population.

    Thus, the core area boom is far more than negated by the losses in the balance of the city. The losses that were sustained in the area between the urban core and the outer suburbs and exurbs were virtually all in the city itself.

    Inner Suburbs

    At the same time, the inner ring suburbs (between the city and 20 miles from the core for this analysis) grew only modestly, gaining less than 20,000 between 2000 and 2010. This is not unexpected, especially in a metropolitan area with slow growth, like Chicago. Urban areas tend to grow organically, with the greatest growth on the urban fringe. As the urban fringe moves further from the core, growth will be less in the established developed areas. 

    An important exception is the small pockets of growth developing and occupying previously disused warehouse and commercial and even railroad yard areas. The core of Chicago is among these, along with Portland’s Pearl District, the Washington Avenue corridor in St. Louis, the Third Ward in Milwaukee, and others. The exit of commercial activities permitted conversion to residential uses, often decades after the abandonment of previous uses.

    Outer Suburban and Exurban Growth

    The overwhelming reality of metropolitan growth in Chicago, however, is that the outer suburbs and exurbs continue to capture virtually all growth. Overall, areas outside 20 miles from the core of Chicago gained 573,000 residents between 2000 and 2010. By contrast, the entire metropolitan area gained only 362,000 residents. As a result, these outer suburbs and exurbs accounted for 158% of the Chicago metropolitan area’s population growth between 2000 and 2010. The core gains, city and inner suburban losses are illustrated in Figure 3.

    Approximately 52 percent of the metropolitan area population is now in the outer suburbs and exurbs. If Chicago’s outer suburbs and exurbs were a separate metropolitan area, they would rank as the 10th largest in the nation, with a population of nearly 5 million, between Atlanta and Boston.

    Chicago: Outer Suburban and Exurban Growth Leader

    As significant as Chicago’s core population growth has been over the last decade, it has been substantially overshadowed by outer suburban and exurban growth. Approximately 12 residents were added in the outer suburbs and exurbs for each new resident in the urban core. Like its urban core growth, Chicago’s growth in the urban core led the nation. Only one other metropolitan area, St. Louis, exceeded 100 percent in its population growth outside a 20 mile radius from downtown (Figure 4).

    Wendell Cox is a Visiting Professor, Conservatoire National des Arts et Metiers, Paris and the author of “War on the Dream: How Anti-Sprawl Policy Threatens the Quality of Life.

    Photograph: Outer suburbs of Chicago (by author)

    Note: Domestic migration data is not available below the county level.

  • In California, Don’t Bash the ‘Burbs

    For the past century, California, particularly Southern California, nurtured and invented the suburban dream. The sun-drenched single-family house, often with a pool, on a tree-lined street was an image lovingly projected by television and the movies. Places like the San Fernando Valley – actual home to the "Brady Bunch" and scores of other TV family sitcoms – became, in author Kevin Roderick’s phrase, "America’s suburb."

    This dream, even a modernized, multicultural version of it, now is passé to California’s governing class. Even in his first administration, 1975-83, Gov. Jerry Brown disdained suburbs, promoting a city-first, pro-density policy. His feelings hardened during eight years (1999-2007) as mayor of Oakland, a city that, since he left, has fallen on hard times, although it has been treated with some love recently in the blue media.

    As state attorney general (2007-11) Brown took advantage of the state’s 2006 climate change legislation to move against suburban growth everywhere from Pleasanton to San Bernardino. Now back as governor, he can give full rein to his determination to limit access to the old California dream, curbing suburbia and forcing more of us and, even more so our successors, into small apartments nearby bus and rail stops. His successor as attorney general, former San Francisco D.A. Kamala Harris, is, if anything, more theologically committed to curbing suburban growth.

    Sadly, much of the state’s development "community" has enlisted itself into the densification jihad. An influential recent report from the Urban Land Institute, for example, sees a "new California dream," which predicts huge growth in high-density development based on underlying demographic trends – like shifts in housing tastes among millennials or empty-nesters rushing to downtown condos.

    Yet it’s not enough for the planners, and their developer allies, to watch the market shift and take advantage of it. That would be both logical and justified. But the planning clerisy are not content to leave suburbia die; it must, instead, be cauterized and prevented, like some plague, from spreading.

    Ironically, it turns out that the "new California dream" is more widely shared by planners and rent-seeking developers than by the consuming public. During the past decade, when pro-density sentiment has supposedly building, some 80 percent of the new construction in the state was single-family, a rate slightly above the national average. Over time, Californians continue to buy single-family houses, mostly in the suburban and exurban periphery. They do it because they are like most Americans, roughly four of five of whom prefer single-family houses, preferably closer to work but, if that proves unaffordable, further out.

    This includes both working-class and upper middle-class markets. The more-affluent, including many largely Asian immigrants, have been willing to buy high-priced homes closer to employment centers in places like Irvine or Cupertino, near San Jose. Meanwhile, the less-affluent of all ethnicities continue to move further out, to places like the Inland Empire or the further reaches of the Bay Area. These peripheral areas have continued to represent the vast majority of growth in both greater Los Angeles and around the Bay Area.

    Meanwhile, some of the urban-centric residential construction now being put up will, as occurred in the housing bust, may be fashionable but, in some cases, not so profitable over time. Construction is being driven mostly by tax breaks, Uncle Ben’s essentially ultralow-interest money for wealthy investors and, in some cases, subsidies. Overall, the Wall Street Journal notes, the rental market is beginning to "lose steam," as people again start looking into buying homes. This may suggest that new speculative building in places like downtown Los Angeles – where there’s good evidence that rents and occupancy levels are, if anything, getting weaker – may end up in tears.

    To date, the anti-suburb jihad has been somewhat constrained by the recession and the collapse of the housing bubble about five years ago. But now that there’s an incipient housing recovery in parts of the state, including Orange County, the constraints could be problematical, particularly for younger buyers about to start a family or for people migrating into the state.

    The impact may be felt first in Silicon Valley and its environs. The planners now dominating the Bay Area want only highly dense bus-stop- or train-oriented development in the valley. Yet, notes real estate consultant John Burns, this does not reflect market realities marked by what they describe "as a resilient and ongoing preference for single-family homes."

    Even more fanciful, they are promoting high density in areas, far distant from current employment centers, in dreary locales like Newark, south of Oakland, claiming workers there will take public transit to jobs in the Valley. The belief among planners and some gullible developers that aging millennials will choose to live in high density, far from costly San Francisco or Palo Alto, and commute to work by transit is somewhat north of absurd; today, a bare 3 percent of workers in Silicon Valley get to work by transit, and downtown San Jose, the logical terminus of any transit strategy, is home to barely 26,000 of the region’s 860,000 workers.

    Some tech workers may put up with a few years of high rents and shared apartments in San Francisco or Palo Alto, but not many will want to live in expensive towers far from both Silicon Valley’s primary employers and the amenities of the big city. Apple’s plans for a new headquarters in Cupertino has drawn criticism from green-minded urbanists precisely because they rest on the sensible presumption that Apple’s workforce will remain largely suburban and car-oriented. One can also wonder the effect on the start-up culture when workers have been forced to live in places lacking the proverbial garage or extra bedroom that historically have nurtured new firms.

    More important still, forced densification, by denying single-family alternatives, is likely, and in some places, already is, spiking prices, which are up $85,000 in Silicon Valley in a year. This, over time, will force millennials, as they age, to look for other locales to meet their longtime aspirations. Generational chroniclers Morley Winograd and Mike Hais, in their surveys, have found more than twice as many millennials prefer suburbs over dense cities as their "ideal place to live." The vast majority of 18-to-34-year-olds do not want to spend their lives as apartment renters; a study by TD Bank found that 84 percent of them hope to own a home.

    Much the same can be said of Asian immigrants, who are now driving much of the new-home sales, particularly in desirable places like Orange County or Silicon Valley. Nationwide, over the past decade, the Asian population in suburbs grew by almost 2.8 million, or 53 percent, while the Asian population of core cities grew 770,000, 28 percent. In greater Los Angeles, there are now three times as many Asian suburbanites as their inner-city counterparts.

    If California is not willing to meet the needs of its own emerging middle class, there’s no doubt that other states, from Arizona and Texas to Tennessee – although not as fundamentally alluring – will be, and are already, more than happy to oblige.

    Rather than seeking to destroy our suburbs, California leaders should expend their energy figuring out how to make them better. Rather than some retro-1900s urbanist vision, they need to embrace the multipolarity of our urban agglomerations. They could look to preserve open space nearby, when possible, or cultivate natural areas, parks, walking and biking trails that would appeal to families as well as to singles.

    Instead of attempting to force employment into the center city, it would make more sense to expand home-based and dispersed work in order to cut down or eliminate commuting times. These moves would create both healthier suburbs and reduce carbon emissions without devastating the natural aspirations of most California families.

    Joel Kotkin is executive editor of NewGeography.com and a distinguished presidential fellow in urban futures at Chapman University, and a member of the editorial board of the Orange County Register. He is author of The City: A Global History and The Next Hundred Million: America in 2050. His most recent study, The Rise of Postfamilialism, has been widely discussed and distributed internationally. He lives in Los Angeles, CA.

    This piece originally appeared in the Orange County Register.

    Suburb photo by BigStockPhoto.com.

  • America’s Oldest Cities

    One of the most important turning points in the social history of the United States occurred at the beginning of the 1940s. This is not about Pearl Harbor or the Second World War, but  rather about the economic, housing and transportation advances that have produced more affluence for more people than ever before in the world.

    After being delayed by World War II, people began moving from the overcrowded cities to spacious (for that time) houses in the suburbs. They increasingly traveled to work and other destinations by car. These trends were at least two decades old at the time, but had been put on hold by the Great Depression. The prewar city (metropolitan area) was considerably denser, more oriented to mass transit and largely monocentric. By 2010, all major metropolitan areas had developed an urban form that was overwhelmingly suburban and polycentric, with the rise of edge cities and the even greater dispersion of edgeless cities. On average, areas outside the traditional downtowns (central business districts) accounted for 90 percent of metropolitan employment in 2000, ranging from a high of more than 95 percent in metropolitan areas like Phoenix, San Jose and Tampa-St. Petersburg to a low of 80 percent in New York.

    Rating Metropolitan Areas by Pre-War Residential Development

    Although dense urban cores persist in most metropolitan areas, their size and significance varies greatly. This can be illustrated by data from the 2007- 2011 American Community Survey, which makes it possible to rank metropolitan areas by their shares of pre-World War II residential development.

    This article uses the percentage of dwelling units, both owner and renter occupied constructed before 1940 to rate the ages of the nation’s 51 major metropolitan areas (those with more than 1 million population in 2010).  Overall, America’s major metropolitan areas are overwhelmingly postwar in their urban development, with approximately 14% of residences built before 1940. By comparison the 1940 populations of today’s major metropolitan counties were just 35 percent of their 2010 populations.

    Oldest Metropolitan Areas

    The nation’s oldest metropolitan areas, not surprisingly, are concentrated in the Northeast and the upper Midwest. Overall population growth has been modest in these regions compared especially to the South and the West.

    • Boston is the oldest with 35.7% of its residences built before 1940. This varies from 55.6% in the historical core city of Boston to roughly 32 percent in the suburbs, which are the oldest themselves in the country.   
    • Nearby Providence is the second oldest metropolitan area, with 33.1% of its dwellings built before 1940. The city of Providence is also the second oldest among historical core municipalities, at 58.8%. Providence overall share of pre-1940 housing stands at 30.2%. It is notable that the Office of Management and Budget now considers Boston and Providence to be in the same combined statistical area (consolidated metropolitan area).
    • Buffalo is the nation’s third oldest metropolitan area with 30.5% of its residences preceding 1940. The core city of Buffalo is the oldest historical core municipality, with 62.8% of its housing predating 1940. Buffalo suburbs, however, are considerably newer, with only 20.1% older than 1940.
    • New York is the nation’s fourth oldest metropolitan area, with 28.9% of its dwellings having been built before 1940. The city of New York has a much lower prewar housing percentage than the top four, largely because of the substantial amount of green field housing built in the more distant sections of Queens and especially in Staten Island during the 1950s and 1960s. New York’s suburbs, which have accounted for nearly all of the growth in the metropolitan area have a pre-1940 housing share of 18.9%.
    • Rochester is the nation’s fifth-oldest metropolitan area, with 28.8% of its housing prewar. The historical core municipality of Rochester has a high 58.1% of its housing in prewar stock, while the suburbs have a 21.1% share.

    The next five oldest metropolitan areas are Pittsburgh, at 27.2%, Milwaukee and 23.3%, Cleveland 22.7% Chicago and 21.3% and Philadelphia at 21.2%. Among these, the oldest historical core municipalities are Cleveland, at 51.9% and Pittsburgh at 50.3%. Pittsburgh has the highest suburban pre-1940 housing stock, at 23.5%, the third highest in the nation after Boston and Providence (Figure 1).

    Youngest Metropolitan Areas

    The nation’s youngest major metropolitan areas are concentrated in the South and West, comprising 28 of the 51.

    • Las Vegas is the youngest major metropolitan area.  "Sin City" has had the greatest percentage population growth since 1940, and is now approaching a population of 2 million, compared to less than 20,000 in 1940. Only 0.3% of the housing stock in Las Vegas was built pre-war.
    • Phoenix, which is grown from little more than 200,000 people in 1940 to more than 4 million people today, has a pre-1940 housing stock of only 1.0%. The city of Phoenix has a miniscule pre-1940 housing stock of 1.9%.
    • The third youngest major metropolitan area is Orlando with 1.7% of its housing stock having been built before 1940.
    • Perhaps surprisingly, Miami is the fourth youngest major metropolitan area with only 2.2% predating 1940. The historical core municipality of Miami, however, has one of the highest densities in the United States and a comparatively strong 10.6% of its housing is prewar.
    • Austin is the fifth youngest major metropolitan area, with 2.5% of its housing predating the war.


    Tampa St. Petersburg, Houston, Riverside-San Bernardino, Raleigh and Dallas-Fort Worth round out the 10 youngest major metropolitan areas. Each of these has a pre-1940 housing stock between 2.7% and 3.1% (Figure 2).

    Data for all metropolitan areas is provided in the table.

    Table
    Share of Housing Units Constructed Before 1940
    US Metropolitan Areas Over 1,000,000 Population in 2010
    Rank Metropolitan Area Metropolitan Area Historical Core Municipality(s) Rank Suburbs Rank HCM
    1 Boston, MA-NH 35.7% 55.6% 4 32.4% 1 1
    2 Providence, RI-MA 33.1% 58.8% 2 30.2% 2 1
    3 Buffalo, NY 30.5% 62.8% 1 20.1% 5 1
    4 New York, NY-NJ-PA 28.9% 41.3% 12 18.9% 6 1
    5 Rochester, NY 28.8% 58.1% 3 21.1% 4 1
    6 Pittsburgh, PA 27.2% 50.3% 7 23.5% 3 1
    7 Milwaukee,WI 23.3% 38.9% 16 14.0% 10 1
    8 Cleveland, OH 22.7% 51.9% 6 15.4% 8 1
    9 Chicago, IL-IN-WI 21.3% 43.8% 10 11.6% 13 1
    10 Philadelphia, PA-NJ-DE-MD 21.2% 39.1% 14 14.9% 9 1
    11 San Francisco-Oakland, CA 20.4% 45.5% 9 9.2% 15 1
    12 Hartford, CT 19.3% 43.1% 11 16.7% 7 1
    13 Cincinnati, OH-KY-IN 17.2% 41.3% 13 12.6% 11 1
    14 St. Louis,, MO-IL 15.8% 54.4% 5 10.3% 14 1
    15 Minneapolis-St. Paul, MN-WI 15.0% 46.7% 8 6.1% 24 1
    16 Baltimore, MD 14.4% 39.0% 15 6.8% 22 1
    17 Portland, OR-WA 13.1% 31.8% 19 5.5% 25 2
    18 Columbus, OH 12.5% 12.6% 31 12.4% 12 2
    19 Louisville, KY-IN 12.3% 16.9% 27 8.1% 20 2
    20 Indianapolis. IN 12.1% 15.6% 28 8.8% 16 2
    21 Los Angeles, CA 12.0% 20.2% 26 8.3% 18 2
    22 Detroit,  MI 12.0% 31.7% 22 8.2% 19 1
    23 Kansas City, MO-KS 11.9% 21.5% 24 8.8% 17 2
    24 New Orleans. LA 11.7% 31.7% 21 3.0% 35 1
    25 Seattle, WA 11.1% 29.9% 23 6.1% 23 2
    26 Richmond, VA 9.0% 32.0% 18 4.1% 31 2
    27 Salt Lake City, UT 8.9% 31.8% 20 3.1% 34 2
    28 Washington, DC-VA-MD-WV 8.6% 36.1% 17 4.6% 29 1
    29 Denver, CO 7.1% 21.4% 25 2.1% 43 2
    30 Birmingham, AL 6.8% 15.6% 29 4.5% 30 2
    31 Oklahoma City, OK 6.7% 8.8% 34 4.9% 27 2
    32 Memphis, TN-MS-AR 5.6% 8.8% 35 2.3% 41 2
    33 Virginia Beach-Norfolk, VA-NC 5.4% 1.1% 50 7.0% 21 2
    34 San Jose, CA 5.3% 5.5% 42 5.1% 26 3
    35 Nashville, TN 5.1% 6.9% 39 3.9% 33 2
    36 San Antonio, TX 5.1% 5.7% 40 4.1% 32 2
    37 Sacramento, CA 4.6% 11.5% 32 2.7% 36 3
    38 San Diego, CA 4.3% 7.0% 38 2.1% 42 2
    39 Charlotte, NC-SC 4.0% 3.3% 46 4.6% 28 2
    40 Jacksonville, FL 3.8% 4.7% 43 2.3% 40 2
    41 Atlanta, GA 3.2% 14.5% 30 2.0% 45 2
    42 Dallas-Fort Worth, TX 3.1% 5.7% 41 2.5% 38 2
    43 Raleigh, NC 2.8% 3.1% 47 2.6% 37 3
    44 Riverside-San Bernardino, CA 2.7% 7.9% 37 2.5% 39 3
    45 Houston, TX 2.7% 4.6% 45 1.6% 47 2
    46 Tampa-St. Petersburg, FL 2.7% 8.4% 36 1.9% 46 2
    47 Austin, TX 2.5% 3.0% 48 2.0% 44 3
    48 Miami, FL 2.2% 10.6% 33 1.5% 48 2
    49 Orlando, FL 1.7% 4.7% 44 1.3% 49 3
    50 Phoenix, AZ 1.0% 1.9% 49 0.6% 50 3
    51 Las Vegas, NV 0.3% 0.3% 51 0.3% 51 3
    Total 13.6% 25.5% 9.0%

    Notes:
    Calculated from American Community Survey 2007-2011
    HCM: Historical core municipality category: (1) Pre-War & Non-Suburban, (2) Pre-War & Suburban, (3) Post-War Suburban. There is one HCM per metropolitan area, except in in San Francisco-Oakland (San Francisco and Oakland) and Minneapolis-St. Paul (Minneapolis & St. Paul). Otherwise, the HCM is the first named municipality in the metropolitan area name, except in Virginia Beach-Norfolk, where it is Norfolk and Riverside-San Bernardino, where it is San Bernardino.

    Not All Core Cities are the Same

    This analysis indicates the substantial differences between not only the nation’s metropolitan areas, but even more the differences between the core municipalities. For example, the core cities of Phoenix and Philadelphia have approximately the same population. Yet they could not be more different. Philadelphia has a long history, including a time as the nation’s largest city around the period of the Revolutionary War. Phoenix, in contrast, is a product of the post-World War II boom. By 2010, Phoenix had become the nation’s 6th largest municipality. Its 65,000 population in 1940 would rank it around 600th today. Figure 3 shows the average, maximum and minimum pre-war housing stock percentages by metropolitan area, historical core municipality and suburbs.

    Categorizing Core Municipalities

    In Suburbanized Core Cities, we classified the nation’s core municipalities into three categories, based upon the extent of their pre-automobile development (This was described further in a paper co-authored with Peter Gordon of the University of California, Cities in Western Europe and America: Do Policy Differences Matter?).

    The categories included "Pre-War Non-Suburban," which are core municipalities that were of high density in 1940 and have expanded their boundaries little since that time. Philadelphia, Baltimore and Providence are examples of these. The second category was "Post-War and Suburban," which includes municipalities that had a dense core of more than 100,000 residents in 1940, but contain large swaths of post-War suburban development (such as Los Angeles, Milwaukee and Atlanta). The third category was Post-War Suburban, which includes core cities that had little or no dense urban core in 1940 (such as Phoenix, Austin and San Jose).

    Figure 4 illustrates the huge differentials in the pre-1940 housing stock between the metropolitan areas as classified by their historical core municipalities.

    Commonalities

    Even so, metropolitan areas are much more similar than their historical core municipalities. The bottom line is one different than one tends to hear in the urban-core-oriented press. In most of America the detached house predominates and virtually all development since 1940 has been suburban, both inside and outside the historical core municipalities.

    Wendell Cox is a Visiting Professor, Conservatoire National des Arts et Metiers, Paris and the author of “War on the Dream: How Anti-Sprawl Policy Threatens the Quality of Life.”

    —-

    Photograph: Boston (by author)

  • Time to Acknowledge Falling Private Car Use

    The prospect of falling car use now needs to be firmly factored into planning for western cities. 

    That may come as a bit of a surprise in light of the preoccupation with city plans that aim to get people out of their cars, but it is already happening.  And it is highly likely to continue regardless of whether or not we promote urban consolidation and expensive transit systems. 

    But not necessarily lower resource consumption
    Of course, as day-to-day travel savings are made by households these can simply result in other forms of consumption, offsetting any resource savings.  This should not be surprising.   Final demand embodies resources consumed right across the production and distribution chain.  Savings from lower transport spending (including commuting) – an intermediate input in the chain – that lead to lower prices translate into increases in discretionary spending (assuming constant or rising incomes). 

    Hence, the reduction in resource use and pollution sought by subsidising public transport and promoting higher density living may simply be spent on resource-intensive appliances, recreation, entertainment, and inter-city and international travel.

    Look to the fringe to look to the future
    Putting that inconvenient equation aside, long-term plans for cities should avoid simply projecting past behaviours into the future. Instead, we might look to changes at the margin that signal the issues, discoveries, and events that might determine the long-term outcomes we are interested in. 

    So let’s look at what’s happening at the margins of car use, focusing for the purpose of illustration on Auckland.

    First, travel demand
    The New Zealand Travel Survey has been conducted since 2003.  The results are published on a two-yearly rolling basis.  Using Statistics New Zealand population estimates I have calculated annual “per person” measures for Auckland from 2003 to 2011.  There are some sampling issues and qualifications regarding the survey that mean motor cycle and bicycle use statistics for Auckland are not considered reliable enough to use. Even given sampling error, the balance point to some significant and consistent shifts.

    For example, total travel (measured as annual kilometres per resident) appears to have peaked around 2007 (Figure 1). In fact, recorded travel declined by 15% over the period.  Public transport has done better, down 12% overall but actually increasing 13% between 2007 and 2011.

    Figure 1: Aucklanders’ Travel by Mode, 2003-2011


    More telling, though, has been declining car use.  The first column in Table 1 shows changes over the whole period.  The second column shows changes between the 2007 travel peak and 2011.

    The fall in car dependence since 2007 has been marked among passengers (-23%).  Perhaps that means fewer discretionary trips are being taken. This and a 14% decline in driver kilometres and 17% fewer trip legs confirms what the vehicle counts say – cars are being driven significantly less in Auckland  (particularly inner Auckland) now than they were five or ten years ago.

     
    Period

    2003-11
    Peak
    2007-11
    Driver
    Km
    -4%
    -14%
    Hours
    3%
    -12%
    Trip Legs
    1%
    -17%
    Passenger
    Km
    -33%
    -23%
    Hours
    -18%
    -17%
    Trip Legs
    -8%
    -22%
    All Car Users
    Km
    -16%
    -17%
    Hours
    -5%
    -13%
    Trip Legs
    -3%
    -19%

    Possible reasons:

    1.      We know already that an ageing population reduces car use.

    2.      Public transport is playing a growing but so far minor role (up from 3.7% to 3.9% share of all kilometres travelled).  An average 76km per person growth in public transport use since 2007 hardly offsets the 1,810km average contraction in distance travelled by car.

    3.      Lower real incomes and higher fuel prices play a part.  A sharp contraction since 2007 suggests that economic conditions have an impact on motoring far more immediate and influential than trying to reshape the shape the city and how people live in it might.   

    4.      The decentralisation of jobs, recreation and entertainment, professional services, and consumer services – including retailing – mean that people can get more done closer to where they live.  Trying to turn this clock back by pushing commercial activity back into the central city and then providing subsidised public transport to access it seems somewhat obtuse in the light of this development.

    Second, car purchases

    The Ministry of Transport publishes new car registrations (which include imported used cars).  It also provides data on the total  vehicle fleet since 2000.  

    Long-term registration statistics are interesting when related to national population data (Figure 2). Apart from a hiccup in 1991 growth in registrations was more or less continuous from 1950 until 2003.  Since then there has been a sharp decline.  Time will tell whether this is cyclical or signals a long-term shift.  It is noteable, though, that 2009, 2010, and 2011 figures fall well below trend.

    Figure 2: Trends in New Car Registrations

    This slowdown in new car registrations is reflected in two ways.  First, it is reflected in total fleet size, for which data are available from 2000 (Figure 3). This shows that  2007 was a turning point in total numbers, consistent with evidence that driving in Auckland peaked in that year.  That’s presumably good for the environment.

    Figure 3: New Car Registrations, New Zealand 2000-2011,

    Second, with the slow-down in imports, the fleet has begun to age (Figure 4).  That’s presumably bad for the environment, as older cars are less efficient and generate more emissions.

    Figure 4: New Zealand’s Ageing Car Fleet

    Third, fleet changes
    Fleet composition is changing as growth slows. The average CC rating of newly registered vehicles in 2000 was 2,127.  This climbed to 2,191 in 2005, but fell to 2,033 in 2011, an 8% fall in six years. 

    If this is a sign of things to come an increase in the turnover of vehicles would boost fleet efficiency over the medium term even without taking account of the greater engine efficiencies being delivered and gains among electric and hybrid vehicles

    Add to that the prospect supported by these numbers of increasing differentiation among vehicle styles (Figure 5).  At one end sits the large weekend recreational vehicle, perhaps falling as a share of new vehicles – or at least being down-sized.  At the other is the increasingly popular city runabout or smart car, and in the middle  the family sedan, the work horse with an engine size now likely to be well under 2,000cc.  

    Figure 5: Changes in Engine Size of Newly Registered Vehicles, 2000-2011

    So what does this all mean?
    There is evidence accumulating to suggest that significant changes are taking place at the margin of transport demand and car dependence.  If this is a sign of things to come it raises questions about long-term road expenditure, about dire predictions of road congestion, and about the benefits of adopting expensive land use and transport measures designed to force people out of their cars.

    Already, within a more constrained economy, people seem to be making their own decisions to reduce car dependence.

    In terms of city planning, it suggests that decentralisation may be more sustainable than the compact city protagonists make out.  In this respect, is interesting that motorway traffic counts show that significant reductions in inner city vehicle flows are offset by gains (albeit much smaller) in outer parts of the city – even as measured distance travelled falls. 

    And Auckland definitely needs to rethink assumptions behind spending plans for major road and rail infrastructure – and confront the risks and costs of getting them wrong. 

    And, incidentally, it’s about time New Zealand’s Ministry for the Environment updated its report card on trends in the environmental impact of vehicle travel – which only goes up to 2007, a year which may prove to be a turning point in long-term travel behaviour.

    Phil McDermott is a Director of CityScope Consultants in Auckland, New Zealand, and Adjunct Professor of Regional and Urban Development at Auckland University of Technology.  He works in urban, economic and transport development throughout New Zealand and in Australia, Asia, and the Pacific.  He was formerly Head of the School of Resource and Environmental Planning at Massey University and General Manager of the Centre for Asia Pacific Aviation in Sydney. This piece originally appeared at is blog: Cities Matter.

    Aukland harbour photo by Bigstockphoto.com.

  • Dispersion in the World’s Largest Urban Areas

    No decade in history has experienced such an increase in urban population as the last. From Tokyo-Yokohama, the world’s largest urban area (population: 37 million) to Godegård, Sweden, which may be the smallest (population: 200), urban areas added 700 million people between 2000 and 2010.

    Nearly one in 10 of the world’s new urban residents were in the fastest growing metropolitan regions (see: Definition of Terms used in "The Evolving Urban Form" Series), which added nearly 60 million residents. They ranged from a an estimated increase of more than 8.5 people in Karachi (Note 1) to 3.9 million people in Mumbai (Figure 1). The average population growth in these 10 metropolitan regions was 6 million, approximately the population of Dallas-Fort Worth or Toronto, which were fast-growers on their own in comparison to other high income world cities.

    By comparison, the largest growth over any single decade over the past half century in US metropolitan areas has been less than one half of the 6 million average: 2.43 million in New York (1920s) and 2.37 million in Los Angeles (1950s). Only Tokyo-Yokohama (1960s) and Shenzhen (1990s) have added more than 5 million people in a single decade before the last decade.

    Growth has been overwhelmingly concentrated outside the urban cores (Note 2) in these 10 fastest growing metropolitan region. Excluding Karachi (for which sufficient data is unavailable), approximately 85 percent of the growth was outside the urban cores (A 42 million increase in the suburbs and 8 million in the urban cores).

    Dispersion in World Megacities

    This is consistent with the findings of The Evolving Urban Form series, which is now two years old. These analyses have generally demonstrated that urban spatial expansion (pejoratively called "sprawl") is world-wide and contrary to some perceptions, not limited to the United States. Cities expand geographically as they add population, though this organic tendency is sometimes contained by urban planning. Peripheral growth is virtually always at lower densities than in urban cores, which means that as cities grow they tend to become less dense (Note 3).

    This process ironically is sometimes accelerated by planning decision-making. London‘s greenbelt —which banned the extension of housing into the near periphery of the city — has result in even greater sprawl to far outside the principal urban area. This trend since World War II, has forced commuters to travel longer times and distances to the urban core (All of metropolitan London’s growth has been suburban for 100 years, with a loss of 1.8 million in inner London, while the suburbs and exurbs grew by 10.5 million).

    The Evolving Urban Form has now covered 23 of the world’s 28 megacities (Note 4). As the Table indicates, population growth has been strongly oriented away from the urban cores and toward more suburban areas

    Table
    Summary of Megacity Population Trends
    URBAN AREA CORRESPONDING METROPOLITAN REGION
    Bangkok 10 Years: 55% of growth outside core municipality
    Beijing 10 Years: 99% of growth outside core districts
    Buenos Aires 60 Years: 100%+ of growth outside core municipality
    Cairo 16 Years: 2/3 of growth outside core governate
    Delhi 10 Years: 90% of growth outside core districts
    Dhaka 10 Years: 50% of growth outside core municipalities
    Guangzhou-Foshan 10 Years: 75%+ of growth outside core districts
    Istanbul 25 Years: 100%+ growth outside core districts
    Jakarta 20 Years: 85% of growth outside core jurisdiction
    Kolkata 20 Years: 95% of growth outside core municipality
    Los Angeles 60 Years: 85% growth outside core municipality
    Manila 60 Years: 95% growth outside core municipality
    Mexico City 60 Years: 100%+ of growth outside core districts
    Moscow 8 Years: 95% of growth outside core districts
    Mumbai 50 Years: 98% of growth outside core districts
    New York 60 Years: 95% growth outside core municipality
    Osaka-Kobe-Kyoto 50 Years: 95% of growth outside core municipalities
    Rio de Janeiro 10 Years: 95% of growth outside core districts
    Sao Paulo 20 Years: 2/3 of growth outside core municipality
    Seoul 20 Years: 115%+ of growth outside core municipality
    Shanghai 10 Years: 99% of growth outside core districts
    Shenzhen 10 Years: 70%+ of growth outside core districts
    Tokyo 50 Years: 95% of growth outside core municipalities


    In US examples, New York and Los Angeles, 95 percent and 85 percent of growth respectively of their corresponding metropolitan region growth has occurred outside the core municipalities since 1950. But these US regions are joined by middle income Buenos Aires and Mexico City where all growth has been outside urban core since 1950. In lower income Manila, 95 percent of the growth has been outside the urban core since 1950.

    The world’s largest metropolitan region, Tokyo-Yokohama, has experienced a virtual monopoly of suburban growth over the past 50 years, as has Japan’s second largest metropolitan region, Osaka-Kobe-Kyoto.

    Over the past quarter century, all of Istanbul‘s growth has been outside the urban core. The urban expansion has been going on for much longer, as is illustrated over the past 60 years (Figure 2). Cairo‘s urban expansion is similarly substantial (Figure 3). In one of the developing world’s poorer megacities, nearly all population growth in the Mumbai region has been outside the urban core for 50 years

    For the last 20 years, more than 115 percent of the growth in the Seoul-Incheon metropolitan region has been outside the core city. In the world’s second largest urban area, Jakarta (Jabotabek), growth is also strongly suburban, accounting for 85 percent of growth over the past two decades. In Kolkata suburban growth has been 95 percent over the same two decades.

    The same tendency is evident in the other megacities. Over the past decade or two, nearly all population growth in China’s four megacities (Shanghai, Beijing, Guangzhou-Foshan and Shenzhen), Delhi and Rio de Janeiro has been outside the urban cores.

    Dispersion in Other Large Urban Areas

    The Evolving Urban Form has also examined smaller urban areas. The same pattern of dispersal is evident there as well even in traditionally compact cities. Zürich, for example has had all of its growth outside the core city since 1950. All of the growth in Barcelona and Milan has been outside the core cities for 40 years. Even high density Hong Kong has experienced all of its growth outside the urban core for three decades. Low income Addis Abeba indicates a pattern of urban expansion is not unlike that of Istanbul or Cairo (Figure 4). In megacity wannabe Chicago (1.4 million short), 125 percent of growth since 1950 has been outside the core; this number reflects that the central city has been shrinking even as the periphery expands. Even in fast-growing Dallas-Fort Worth, more than 80 percent of population growth over the past 60 years has been outside the city of Dallas (which itself is largely suburban in form, see Suburbanized Core Cities).

    The one notable exception to the peripheral growth model is Quanzhou (Fujian, China), which is developing under an even more dispersed pattern, described by Yu Zhu, Xinhua Qi, Huaiyou Shao and Kaijing He at Fujian Normal University. Typically, urban areas expand from an urban core on the periphery. Quanzhou is experiencing "in situ" urbanization, the spontaneous conversion of rural areas into urban development that does not expand from the urban core. The result is a sparsely developed urban area (especially for China), with plenty of land for potential infill development in the future.

    The Future of Urbanization

    It is likely that urban areas will continue to expand as they grow larger, consistent with what appears to be both economic pressures and market preferences for lower cost, more spacious housing. For example, fast growing Ho Chi Minh City is expected to see virtually all of its population increase over the next 15 years outside the urban core. Not surprisingly Shlomo Angel, Jason Parent, Daniel Civco, Alexander Blei and David Potere at the Lincoln Land Institute project significant expansions of urban land by mid-century. And, Angel, in his Planet of Cities, notes how important it is to allow the expansion, in order to improve the quality of life for the majority of people, who deserve to live as well as people in the West.

    —-

    Note 1: Incomplete results of the 2011 Pakistan census have been reported by media in both Pakistan and India. However, no official announcement of the results has been identified from Pakistan census authorities. The Karachi population increase would be the largest metropolitan region 10 year rate of increase in history.

    Note 2: Urban cores are generally the core historical jurisdiction, which often contains substantial non-core areas, even outside the United States. Core district data within these jurisdictions is used where available. Thus, this estimate over-states the urban core population increase.

    Note 3: The driving factor in declining densities is principally transportation advances. Substantial urban expansion began with the coming of mass transit in the 19th century. However an even greater expansion began occurring with the availability of the automobile. As automobile orientation replaces transit orientation, densities tend to decline until it nearly all travel is by automobile. Even among automobile oriented urban areas, there can be large differences in urban densities. For example, transit’s market share in the Boston urban area is substantially greater than in the Los Angeles urban area. Yet the Los Angeles urban area has a population density of 7000 per square mile (2,700 per square kilometer), more than three times that of the Boston urban area, at 220 per square mile (850 per square kilometer). The difference is that in Los Angeles residential development has largely occurred densities determined by the market, with single-family housing being typically built on 1/4 acre lots. In Boston, suburban lot sizes were forced higher by urban planning requirements for large lot zoning. The result is much greater land consumption than would have occurred if people’s preferences (the market) had driven development. If Los Angeles had been developed at the same low density as Boston, its urban land area would equal that of the state of Connecticut.

    Note 4: Megacities are urban areas with more than 10 million population. Five megacities remain to be described in The Evolving Urban Form (Karachi, Lagos, Nagoya, Paris and Teheran). Corresponding metropolitan regions are used for this analysis, since historic urban area data (areas of continuous urban development) is not available for most nations.

    Wendell Cox is a Visiting Professor, Conservatoire National des Arts et Metiers, Paris and the author of “War on the Dream: How Anti-Sprawl Policy Threatens the Quality of Life.”

    —–

    Photo: New detached housing, suburban Tokyo-Yokohama (by author).