Category: Suburbs

  • Florida: When Your Best (Place) Just Ain’t Good Enough

    Real estate broker Coldwell Banker handles corporate relocations for a large portion of our middle class. It recently released a survey of Suburbanite Best Places to Live. While it’s easy to dismiss as a sales tool for their realtors, the survey provides a fascinating glimpse of middle class, suburban preferences, influenced by our current economy. Coldwell Banker’s top honors go to Cherry Hills Village, Colorado, a suburb of Denver. Suburbs of Seattle, New York City, Washington, DC, and other prominent cities feature strongly on Coldwell Banker’s list, which highlights places that are sprinkled evenly throughout the United States. Notably missing are any communities in Florida.

    For a state with sunshine, beaches, and low taxes, Florida just doesn’t have the chops to get even one community onto the top 100 list.

    Weather, evidently, has little to do with our middle class’s desirable locations. Frigid Whitefish Bay, just south of Milwaukee, captured spot #100. Situated along the shore of Lake Michigan, this suburb of 14,000 doesn’t exactly have the kind of weather that makes people flock to the beach. Instead, it offers residents a strong sense of community, heritage, and a culture that values education and family. If you move here, you’ll find yourself within a suburban community with a high homeownership ratio, an educated population, and a quality of life that includes short commutes, low crime rates, close conveniences, and a tendency to eat at home.

    Suburban living has maintained a strong appeal for middle-class Americans due to the popularity of many of the factors on which Coldwell Banker based its rankings. While socialites prefer more urban, dense lifestyles (which is another list that Banker recently produced), suburbanites prefer backyards and quieter neighborhoods away from the hustle and bustle of the city; they don’t need to be near the action. Florida has all these things in abundance, except when compared to… almost everywhere else.

    Windermere, Florida’s top ranked suburb, came closest, ranking just below Whitefish Bay and a couple of others. Like most suburbs on the list, Windermere is on the periphery of a large metropolitan area (Orlando), and contains conveniences, good schools, parks, and recreation facilities.

    For much of its history, Florida represented the suburban American dream. The net benefits included an affordable cost of living and upward mobility, and Florida’s growth has consisted almost entirely of suburban densities. No one can accuse Florida developers of building communities that people didn’t want – the product was carefully researched to fit the market.

    In the late period of the boom, urban options were also developed, in the belief that a new demand for socialite “downtown” style living would emerge. Townhomes and condominiums rose in Florida’s primary and secondary urban markets. Even tertiary cities like Sanford, a historic agricultural town north of Orlando, begot a six-story condo. Those who migrated from Chicago and the dense Northeast now had a diverse set of choices, from rural to urban, with something to please everybody.

    It is perhaps this dilution of the market that has made Florida’s star fade a bit in relation to the national constellation of suburbs. If East Grand Rapids, Michigan (Coldwell Banker’s #8) can outrank the hundreds of suburbs around Tampa, Miami, Jacksonville, Tallahassee, and Orlando, there’s something else going on besides beauty.

    One thing that many of the top 100 have in common is a strong public education system. Florida, which has refused to invest in education, may now be harvesting the bitter fruit of this stubborn negligence. The state’s primary growth today continues to be in retirees who are uninterested in supporting education, and who control a large part of the state’s political power.

    Another aspect that the top 100 suburbs offer is safety. “Safety is a priority,” states the opening page of this survey, but it simply isn’t something that most people associate with the Sunshine State. A state that doesn’t offer a strong sense of personal safety isn’t going to rank highly, no matter what else is being offered. With two out of the ten most dangerous cities in the country, Florida seems more like the wild West than a suburbanite’s dream come true.

    Increasing public safety and public education are two efforts that government can do best, most people agree. Florida has spiraled downward on both fronts. The state’s leadership, by cutting taxes during the worst part of the recession, haven’t exactly helped the situation. With Florida’s new home sales up, the state’s economists are whistling a happy tune, convinced that the worst is over. But what Coldwell Banker is telling Florida is a different, darker story.

    Florida’s best offerings are attracting a population less interested in the core values stated in the Coldwell Banker survey – safety, good education, a sense of community – and so we continue to get more of the same. More population that reinforces Florida’s lack of investment in community, more population reluctant to put money into education, and more population that is quick to move somewhere else at the earliest opportunity seem to be Florida’s fate. This represents a lost opportunity to those who wish to see Florida make gains in these spheres – education, community, and safety. And it represents a lost opportunity to match up a truly beautiful place with truly involved people.

    Corporations seeking to relocate and recruit good people pay attention to these surveys. Florida’s low taxes may lure a few more down south, but if corporations need to attract and retain top talent, this survey points to where they are likely to go, regardless of the incentives our state has to offer.

    Places like Whitefish Bay, Wisconsin; Rossmoor, California; and Haworth, New Jersey will continue to gain in the type of population that share these same values. The middle class, fighting its way back from a threatened extinction, isn’t likely to take a chance on a place that has a rapidly degrading quality of life. Until Florida’s culture starts caring about the quality of its community, safety, and education, our state will continue to grow without flourishing as a place where people desire to be.

    Richard Reep is an architect and artist who lives in Winter Park, Florida. His practice has centered around hospitality-driven mixed use, and he has contributed in various capacities to urban mixed-use projects, both nationally and internationally, for the last 25 years.

    Bigstock photo: Florida Housing
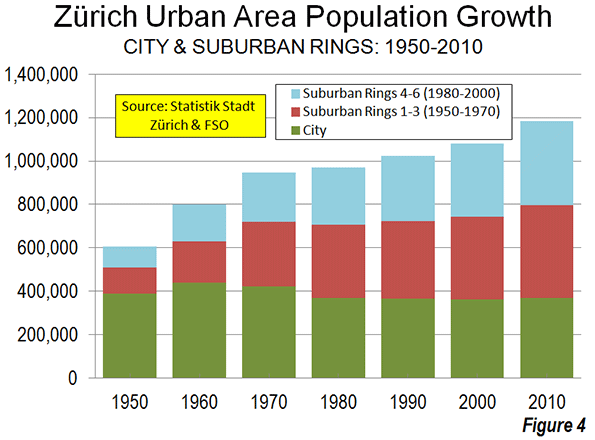
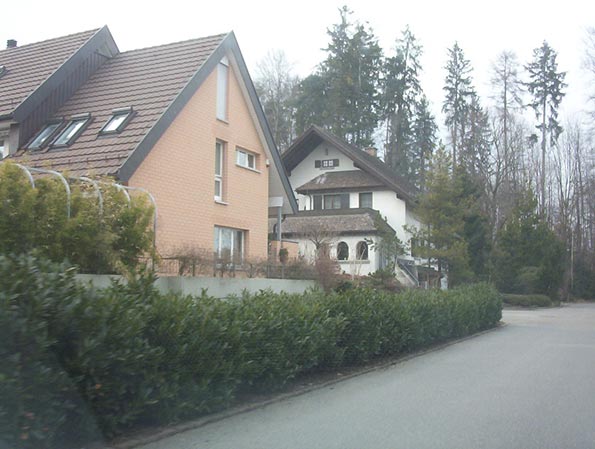
  • Even After the Housing Bust, Americans Still Love the Suburbs

    For decades, Americans have chosen to live in suburbs rather than in cities. Suburban growth has outpaced urban growth, and many big cities have even lost population. But in recent years, some experts have said it’s time for cities to make a comeback. Why? Urban crime rates have fallen; many baby boomers want to live near restaurants, shops, and all the other good things that cities offer; and the housing bust has caused more people to rent instead of buy – sometimes by choice and sometimes out of necessity. Moreover, cities offer shorter commutes, a big draw given today’s higher gas prices and growing concerns about the environment.

    So is there evidence that cities are really making a comeback? Earlier this year, a widely-reported Brookings analysis using 2011 Census estimates suggested that they were, reversing the long-term trend of faster suburban growth. However, it later became clear that those 2011 Census estimates should not be used for areas smaller than counties, which includes most cities and suburbs (see “the fine print” at the end of this post).

    Knowing that we couldn’t use these Census data, we decided to tackle this question another way. Using U.S. Postal Service data on occupied addresses receiving mail, we calculated household growth in every ZIP code from September 2011 to September 2012. (A previous Trulia Trends post explains in more detail how these data are collected.) Consistent with earlier studies of city versus suburb growth, we compared the growth in a metro area’s biggest city with the growth in the rest of the metropolitan area, across America’s 50 largest metros.

    By this measure, there was essentially no difference between city and suburban growth. When we looked at all 50 metros together, household growth was 0.536% in the metros’ biggest cities and 0.546% in the rest of the metro area over the past year – which means that suburbs grew ever so slightly faster than big cities. The biggest city grew faster than the suburbs in 24 of those metros, including New York, Los Angeles, Chicago, Miami and Philadelphia; the suburbs grew faster than the biggest city in the other 26 metros, including Dallas, Houston, Atlanta, Detroit and Phoenix.

    But comparing the biggest city with the rest of the metro area misses some of the action. In most metros, there are neighborhoods outside the biggest city that are more urban than some neighborhoods in the biggest city (as measured by density). For example, Hoboken NJ, just across the river from New York City, is denser and feels more urban than much of Staten Island, which is part of New York City. Central Square in Cambridge, next to Boston, feels more urban than West Roxbury and Hyde Park, two quiet neighborhoods within the City of Boston. In southern California, Santa Monica and Pasadena – which are outside the Los Angeles city boundary – feel more urban than Sylmar, Chatsworth and other outlying neighborhoods in the San Fernando Valley that are technically part of the City of Los Angeles.

    Therefore, we took a new approach. We compared growth in neighborhoods based on whether they actually are more urban or suburban based on their density, regardless of whether those neighborhoods happen to be inside or outside the boundary of a metro area’s biggest city. Within each metro area, we ranked every neighborhood – as defined by ZIP codes — by household density. Neighborhoods with higher density than the metro area average are “more urban”; neighborhoods with lower density than the metro area average are “more suburban.” (See “the fine print” at end of this post.)

    By defining “urban” and “suburban” in this way, suburban growth is clearly outpacing urban growth. Growth in the “more suburban” neighborhoods was 0.73% in the past year, more than twice as high as in the “more urban” neighborhoods, where growth was just 0.35%. In fact, urban neighborhoods grew faster than suburban neighborhoods in only 5 of the 50 largest metros: Memphis, New York, Chicago, San Jose and Pittsburgh – and often by a really small margin. In the other 45 large metros, the suburbs grew faster than the more urban neighborhoods.

    Top 5 Metros Where Urban Growth Outpaced Suburban Growth
    U.S. Metro

    Urban Growth

    Suburban Growth

    Difference: Urban minus Suburban

    Memphis, TN

    0.92%

    0.42%

    0.50%

    New York, NY

    0.58%

    0.27%

    0.31%

    Chicago, IL

    0.31%

    0.26%

    0.06%

    San Jose, CA

    0.73%

    0.71%

    0.02%

    Pittsburgh, PA

    0.44%

    0.43%

    0.01%

    Note: among largest 50 metros.

    Top 5 Metros Where Suburban Growth Most Outpaced Urban Growth
    U.S. Metro

    Urban Growth

    Suburban Growth

    Difference: Urban minus Suburban

    San Antonio, TX

    0.40%

    2.46%

    -2.07%

    Oklahoma City, OK

    0.38%

    1.87%

    -1.49%

    Houston, TX

    0.44%

    1.91%

    -1.48%

    Austin, TX

    0.88%

    2.13%

    -1.25%

    Detroit, MI

    -0.94%

    0.20%

    -1.14%

    Note: among largest 50 metros.

    Looking more closely: what happened to growth in not just in the “more urban” neighborhoods, but in the MOST urban? Within each metro, we split neighborhoods into ten categories, based on their density. The highest-density category covers just the “most urban” parts of big cities (much of Manhattan, for instance, but none of Brooklyn) including a few neighborhoods that are technically outside the metro’s biggest city (parts of Cambridge MA, Arlington VA and Scottsdale AZ, for instance). On the other end of the spectrum, the lowest-density neighborhoods are the “most suburban” (in fact, in some metros, the lowest-density neighborhoods feel downright rural). Now the pattern gets interesting:

    Trulia City vs. Suburban Growth Bar Chart

    In general, the “more suburban” neighborhoods grew faster than the “more urban” neighborhoods. But the “most urban” neighborhoods actually had solid growth, as the leftmost bar in the graph shows. Household growth was 0.54% in these “most urban” neighborhoods,” which matched the overall growth rate for the metro areas examined. Furthermore, among only the largest 10 metros, household growth was 0.65% in the “most urban” neighborhoods, compared with 0.48% growth in these metros overall.

    That’s the punchline: America’s suburban areas are continuing to grow faster than America’s urban areas. Despite falling homeownership, rising gas prices, downsizing baby boomers and improvements to city living, American suburbanization hasn’t reversed. Even though the highest-density neighborhoods, particularly in the largest metros, have grown in the past year, the suburbanization of America marches on.

    We’ve provided the full data set of urban and suburban growth in the 50 largest U.S. metro areas below.

    The fine print:

    • This Brookings analysis showed cities growing faster than their suburbs between 2010 and 2011, based on 2011 Census estimates. Posts at newgeography.com here and here criticized the 2011 Census estimates and questioned research based on those estimates, including the Brookings analysis. The problem with the 2011 Census estimates is that the 2010-2011 growth rates for subcounty areas – which includes most cities and suburbs — were assumed to be the same as the growth rate for the whole county (with the exception of population in “group quarters”).
    • We used the largest 50 metro areas. In this report, the “San Francisco” metro area includes Oakland; “Dallas” includes Fort Worth; “Washington DC” includes the Bethesda metro division; “New York” includes Long Island; and so on. (Most Trulia Trends posts use the smaller “metropolitan division” where they exist for consistency with other housing data reports.)
    • The U.S. Postal Service reports delivery statistics by ZIP codes. We calculated density using 2010 Census data for ZCTA’s, a Census approximation of ZIP codes. 

    Jed Kolko is Trulia’s Chief Economist, leading the company’s housing research and providing insight on market trends and public policy to major media outlets including TIME magazine, CNN, and numerous others. Read more of his work at Trulia Trends blog.

    This piece originally appeared at the Trulia blog.

    Suburban neighborhood photo by Bigstock.

  • The Evolving Urban Form: Barcelona

    Among those for whom Paris is not their favorite European city, Barcelona often fills the void. Barcelona is the capital of Spain’s Catalonia region. Catalonia has been in the news in recent weeks because of the rising a settlement for independence from Spain, or at a minimum, considerably expanded autonomy. In part, the discontent is driven by a concern about the extent to which more affluent Catalonia subsidizes the rest of Spain. Another driving factor is the interest in separating Catalonian language and culture from that of Spain.

    Barcelona is nestled on the Mediterranean coast with mountains and valleys immediately behind. It would be easy to visit Barcelona without being aware of the huge expanse of suburbanization that has developed especially over the last 50 years.

    The Core City

    Like virtually all European core cities that have not annexed or combined with other jurisdictions, Barcelona’s population had peaked well before the turn of the 21st century. In 1960, the city of Barcelona had a population of just below 1.6 million people. Today, after having risen to 1.75 million in 1981, Barcelona’s population has dropped to approximately 1.62 million. Nonetheless, like other European core cities, Barcelona experienced strong growth before 1970, rising to nearly 7 times its 1890 population of 250,000.

    At the same time, like some other European and North American core cities, the city of Barcelona has begun to grow again. Having reached a modern low point of 1.5 million in 2001, the city grew by approximately 7 percent by the 2011 census.

    The city itself covers a land area of approximately 55 square miles/143 square kilometers, slightly less than that of Washington, DC. Barcelona’s density is much higher, at approximately 40,700 per square mile/15,700 per square kilometer, as opposed to the approximately 10,000 per square mile/4,000 per square kilometer of Washington. Yet, other core areas are considerably more dense, such as the ville de Paris, which is at least 30 percent more dense and Manhattan, which is approximately 50 percent more dense.

    The Metropolitan Area and the Urban Area

    The metropolitan area is generally considered to be the province of Barcelona, which is a part of the region of Catalonia (Figure 1). Since 1950, the metropolitan area has expanded from 2.2 million to 5.6 million people. Since 1960, nearly all of the population growth has been outside the city of Barcelona. The city has added approximately 60,000 people, while the balance of Barcelona province has added approximately 2.7 million people (Figure 2).


    The province of Barcelona is divided into comarques, which are the equivalent of counties. The core comarca (the singular form) is also called Barcelona and includes the city as well as other municipalities (or local government authorities), the largest of which is Hospitalet de Llobregat, with a population of 250,000.

    Barcelona’s urban area (area of continuous urban development) continues along the Mediterranean coast to the southwest into the comarca of Baix Llobregat, which includes the international airport. To the northwest the urbanization continues along the coast for some distance into the comarca of Maresme.

    The urbanization then surrounds Tibidabo Mountain behind the city along freeway routes on either side. These roadways connect with the AP-7 autopista (toll motorway), which provides direct access between Madrid, Valencia, Andalusia and France. The large valley through which the AP-7 runs contains the largest suburbs of Barcelona, which are divided into two comarques, the Valles Oriental (East Valley) and the Valles Occidental (West Valley).

    The Barcelona urban area covers approximately 415 square miles/1,075 square kilometers (Figure 3) and has a population of 4.6 million. At approximately 11,000 persons per square mile/4200 per square kilometer, Barcelona is one of Western Europe’s most dense urban areas. It is approximately 15 percent more dense than Paris and among the larger urban areas trails only Madrid (11,800 per square mile/4,500 per square kilometer) and London (15,100 per square mile/5,800 per square kilometer).

    The Barcelona urban area’s high density is also illustrated by comparison to the Zürich urban area, with its reputation for high density. As defined by the Federal Statistical Office of Switzerland, Zürich covers virtually the same land area as Barcelona, yet has less than one quarter of its population.

    Between the 2001 and the 2011 censuses, there was seven percent growth in the inner suburbs surrounding the city of Barcelona within the comarca of Barcelona. Much greater growth, however, was experienced in the more peripheral parts of the urban area. The coastal suburbs of Baix Llobregat and Maresme grew approximately 17 percent and now have a population of more than 1,000,000.

    Growth was even stronger in the interior valley, with the Valles Occidental growing at 19 percent and the Valles Oriental, which and with much more vacant land for development, grew 22 percent (Figure 4). Now the population of the Valles approaches 1.2 million.

    However the largest growth was outside the urban area entirely, in the balance of the metropolitan area, where the population increased 27 percent (Figure 5), and now approaches 1,000,000.

    Newer Development

    Much of the most recent growth has been relatively unusual for large Spanish urban areas, which have largely experienced high density expansion, with multi-family buildings (often high rise), even in the suburbs (see top photo). However, considerable detached housing has been built in the Barcelona metropolitan area over the past decade.

    Barcelona’s Dispersion

    Thus, the Barcelona metropolitan area is generally following the trend of greater growth in the urban periphery and the strongest growth in the rural and smaller urban areas that are outside the continuous urbanization.

    Wendell Cox is a Visiting Professor, Conservatoire National des Arts et Metiers, Paris and the author of “War on the Dream: How Anti-Sprawl Policy Threatens the Quality of Life.”

    Photo: Residential area in Valles Occidentale (Barcelona suburbs), by author.

  • America’s Last Politically Contested Territory: The Suburbs

    Within the handful of swing states, the presidential election will come down to a handful of swing counties: namely the suburban voters who reside in about the last contested places in American politics.

    Even in solid-red states, big cities tilt overwhelmingly toward President Obama and the Democrats, and even in solid-blue ones, the countryside tends to be solidly Republican.

    What remains contested are the suburbs, which—despite the breathless talk in recent years of an urban revival—have accounted for 90 percent of metropolitan growth over the past decade.

    But as the suburbs have grown—in large part by collecting families priced out of cities or seeking more space or better schools—they’ve shifted from reliably Republican territory to contested turf. Barack Obama won 50 percent of the suburban vote in 2008, a better performance than either Bill Clinton or John Kerry.

    Obama’s success resulted from demographic changes sweeping the periphery of most major cities. Long derided by blue-state intellectuals as stultifying breeders of homogeneous white bread, the suburbs increasingly reflect and shape the country’s ethnic diversification. The majority of foreign-born Americans now live in suburbs, and many suburban towns—like Plano, Texas, outside Dallas; Cerritos, south of Los Angeles; and Bellevue, near Seattle—have become more ethnically diverse than their corresponding core cities. Among the metropolitan areas with the highest percentage of suburban minority growth are swing state regions Des Moines, Iowa; Milwaukee; and Allentown and Scranton, Pa.

    Minorities, according to a recent Brookings study now represent 35 percent of suburban residents, similar to their share of overall U.S. population.

    The suburbs of Las Vegas in hotly contested Nevada are now minority-majority, as the number of Latinos living there has shot up. Nationwide, well over 5 million Latinos moved to the suburbs during the past decade—and many more Latinos now live in suburbs than core cities. In the past, Hispanic suburbanites tended to vote somewhat more Republican than their urban counterparts. But this year, they appear to be solidly Democratic—as Latinos have been repelled by the GOP’s ugly embrace of nativism ,and drawn to Obama’s clever election-year move to offer effective amnesty to young illegal immigrants.

    Asians—another group that’s strongly favored Obama—have moved even more quickly into the suburbs. While many immigrants hail from some of the world’s densest cities, few immigrants come to America dreaming of a small apartment near a transit stop.

    “Many Asian immigrants today are bypassing the city entirely and going straight to suburban neighborhoods first to fulfill their version of the American dream,” says Thomas Tseng, a founding principal at New American Dimensions, a Los Angeles–based ethnic marketing and research firm.

    Over the past decade the Asian population in suburbs has grown at nearly four times the rate of that in cities, with 2.7 million more Asians in suburbia compared to 770,000 in the core cities. In the northern Virginia suburbs around Richmond, the number of Asian suburbanites has doubled, as it has in the suburbs around Columbus and Cincinnati. The Asian suburban population nearly tripled in the Raleigh area and doubled around Charlotte. Even in Florida, there are now well more than 100,000 more Asians in the suburbs of the Sunshine State’s four major cities—Miami, Jacksonville, Orlando, and Tampa—than there were a decade ago.

    Obama also will likely receive significant backing from white professionals, who tend to cluster in the suburbs of cities such as Columbus or around Washington, D.C. Virtually all the 10-best educated counties in America are suburban; seven are in the greater Washington area. The fact that many of these professionals work directly or indirectly for the federal government that Obama has expanded dramatically will only help him in his bid to remain in the White House.

    So what about Romney? He’s clearly a product of the suburbs, growing up in the tony periphery of Detroit and now living in leafy Belmont, Mass., a comfy close-in commuter suburb that has seen little population growth since 1950.

    In the primaries, Romney did well in suburbs, particularly upper-class ones, and those voters played a critical role in putting him over the top against Rick Santorum.

    Romney continues to score roughly 50 percent support in polls with voters making at least $100,000, a group that tends to live in affluent commuter towns ringing cities. But to win, the Republican needs to reproduce his party’s wave of 2010, when they captured roughly 55 percent of the suburban vote on their way to retaking the House. But can Romney reach beyond his classic country-club GOP base to the middle- and working-class swing state suburban voters?

    On paper, he should do well in lower density suburban areas, in large part because they tend to have far larger concentrations of married families with children, a group that tilts Republican. But despite his own family, he’s been overshadowed by Obama’s better-marketed, albeit far smaller, domestic unit.

    Romney also may be missing a chance to appeal to suburbanites on the contentious issue of “smart growth.” Opposition to suburban housing has become a favorite cause among Democratic politicians, and widely praised by the Manhattan-centric national media.

    But Romney, in his term as governor of Massachusetts, was a classic patrician corporate modernizer, showing a penchant for the kind of planning that uses strict growth controls to constrain suburban expansion.

    In this sense Romney resembles other politicians from the gentry class—such as Al Gore, Arnold Schwarzenegger, and John Kerry—who, in the name of “rational” societal objectives, make it harder for middling-class people to achieve the suburban dream they’ve taken for themselves.

    So while they represent the majority of the nation, suburban voters have no real champion in this election. Taken for granted by conservatives and betrayed by Wall Street, they have few friends in high places—except at election time. They are also increasingly detested by progressives, a long way from the days when Bill Clinton keyed in on “soccer moms.” Instead the suburbs have evolved into a shapeless political lump, divided by income and race, cultural conflict, and regional rivalries.

    On balance, this all works to the president’s favor. If Obama can manage anything close to a split in suburbia, as he did in 2008, he will surely win a second term. Such a loss, at a time of economic hardship, may be enough to force even the dullards of the GOP back to the drawing board to confront their inability to win over enough of the suburban voters (homeowners, small businesspeople, parents of any races)—who should provide the GOP an electoral majority, but so far are not.

    Joel Kotkin is executive editor of NewGeography.com and is a distinguished presidential fellow in urban futures at Chapman University, and contributing editor to the City Journal in New York. He is author of The City: A Global History. His newest book is The Next Hundred Million: America in 2050, released in February, 2010.

    This piece originally appeared in The Daily Beast.

    Suburbs photo by Bigstock.

  • The Rise of Telework and What it Means

    Teleworking (also known as telecommuting) has taken flight as a global trend. During July of 2002, European Union collectively decided on a shared framework agreement on telework, which regulates issues such as employment and working conditions, health and safety, training, and the collective rights of teleworkers. Following suit, the American the Telework Enhancement Act of 2010 served as a rallying call for federal agencies to encourage “work-at-home” employees. In the same year officials in China, eager to reduce gross national carbon emissions, chose the province of Hubei to undergo the country’s first telecommuting pilot program  

    In the United States, telecommuting is   on the clear increase.  Data from the American Community Survey estimate that the working at home population grew 61% between 2005 and 2009. The biggest increases in teleworking population compared to workforce was in Riverside-San Bernardino-Ontario, CA while the metro with the highest growth in teleworking was San Jose-Sunnyvale-Santa Clara, CA.


    Is the trend to telecommuting comparable between the private and public sectors? The 2009 American Community Survey gives a snapshot of the work-at-home population by class of worker in the years 2005 and 2009. Although the rise of teleworkers is across both sectors, a surge in government teleworkers indicates the public sector, notably the federal government, has made a huge effort keep staff at home to cut administrative costs.

    After the federal government, the next largest increase in ratio of teleworkers is at the state level. Municipal government teleworkers showed the most modest growth and represent only 3.9% among those working at home. Though only 2.4% of private for-profit sector employees consider themselves teleworkers, by size alone they represent about three-fourths of the working-at-home population.

    Still, understanding of telework remains incomplete.   First, as President Obama’s Council of Economic Advisors stated in 2010, there remains a persistent “lack of data on the prevalence of workplace flexibility and arrangements which makes policy-making more difficult.” There are often ambiguities such as the issue of how to distinguish between part-time and full-time teleworkers. One also must separate paid work telework (such as an official flex-time work arrangement) from non-paid telework (such as a teacher grading papers at home during the weekend).   Telework’s definition is so broad that perceptions   can vary dramatically.

    New research attempts to bring clarity into whether employers should allow their employees to have a work-at-home option. Results from a recent study at Stanford partnered with Ctrip, an online travel-booking agency based in China, presented strong evidence to support the causal relationship between telework and productivity. With a turnover rate among Ctrip call center representatives hovering at around 50% per year (typical of the industry in China), retaining workers was a core objective of the experiment. Estimates by management say the typical costs of hiring and training a new representative is $2000, approximately 6 months of salary for an average employee.

    Despite initial doubt, the research provides stark insight on efficiency gains from telecommuting gains. An article from Slate summarizes the findings:

    Over the duration of the experiment, home workers answered 15 percent more calls, partly because each hour was 4 percent more productive, and partly because home office employees spent 11 percent more time answering phone calls. (Home workers took fewer breaks and sick days, rarely arrived late to their desks, and had fewer distractions.) … distractions of home life had no impact on the quality of service: The home-work group converted phone calls into sales at exactly the same rate as those in the office. And employees themselves liked the arrangement better… [and] reported less “work exhaustion,” a more positive attitude towards their jobs, and were nearly 50 percent less likely to say they were planning to quit at the end of the eight months.

    In the long run, telecommuting could generate massive changes in urban geography. As benefits of telework manifest in new research, city planners ought to observe how its impact on the geography of American cities.

    Teleworkers are more likely than not to live in the suburbs. Since teleworkers are often required to be tech-savvy with the latest mobile devices, one could expect a disproportionately high percentage of them working in hi-tech industries in sprawled tech hubs like the Silicon Valley. Most teleworkers choose to commute for a very practical reason: it would save them time and money. According to research by Kate Lister and Tom Harnish of the Telework Research Network, aside from housing preference the typical teleworker is a 49-year-old, college-educated, salaried, non-union employee in a management or professional role, earning $58,000 a year at a company with more than 100 employees. As of 2009, 76% of the total working-at-home population consists of the for-profit workers.

    Some industries will stay clustered around the city center but more jobs, especially service-oriented ones, will continue to migrate towards the suburbs.  

    Teleworking will increase the total amount of hours Americans work annually. Americans, infamous for overwork, can easily translate telework as “more work.” Data from the United Nations reports 86% of American males and 67% of American females working more than 40 hours a week. While technology has often been accused as a job-killer, it has also made jobs easier and, in some ways, more social. Employers using Cloud technology are utilizing personalized social networks in hopes of creating a more connected community in the work place. The point at which work begins and leisure ends is becoming increasingly hard to distinguish as hours spent “on the job” are elusive, and thus harder to limit.

    For urban planners, this signals new types of urban development to provide for a population of Americans that work longer hours but do so closer to home.  Food and retail establishments will be one of the first to address this trend. Coffee shops with Wi-Fi and casual dining franchises like Panera and Corner Bakery will become commonplace in middle-to-upper class suburban neighborhoods.

    These general locales could generate a privatized version of the Third Place, a milieu distinct from the two usual social environments of home and the workplace. Other urban innovations to anticipate include co-working offices, such as those offered by BLANKSPACES, and pay-as-you-go meeting services, like Liquidspace.

    The availability of affordable mobile technology has been the main contributor to the "any time, any place" lifestyle. Still, the trend is limited to a small percentage of American workers, mainly those that tend to work in service-oriented positions and, as the numbers in Silicon Valley suggest, in the service sector. As more interest and funding is directed towards nanotechnology and cloud networking, perhaps this lifestyle will propagate to become the new normal. If so, telework may someday be just a common way that people work that may change forever the urban landscape.

    Jeff Khau graduated from Chapman University with a degree in business entrepreneurship. Currently, he resides in Los Angeles where he is pursing his dual-masters in urban planning and public policy at the University of Southern California.

    Office or home signpost photo by Bigstock.

  • The Evolving Urban Form: Zürich

    Zürich is the largest urban area in Switzerland. The core city (stadt) of Zürich is located at the northern end of Lake Zürich, which is glacial and similar to the "finger lakes" of upstate New York. Lake Zürich is approximately 25 miles/40 kilometers long and 1-2 miles/1.5-3 kilometers wide. The urban area extends south along most of the lake and over hills to the East and West and further North.

    Zürich, like larger Paris and Barcelona is a favorite among urban aficionados. Two reasons: the apparent compactness of its urban core and it has one of the world’s best transit systems. Yet, as is shown below, Zürich looks and feels denser than the reality experienced by its citizenry. Moreover the urban core is surrounded by a sea of anything-but-compact suburbanization, as is the case in Paris and virtually all other large Western urban areas. A visit confined to the smallish, but architecturally pleasing precincts of the core can lead to a profound misinterpretation of the urban form (See Louvre Café Syndrome: Misunderstanding Amsterdam and America).

    The City of Zürich (Stadt)

    Like virtually all European core cities that have not substantially annexed new land or consolidated with other jurisdictions, the city of Zürich has lost population. Zürich reached its population peak in 1960, with 440,000 people. Since that time, the population has fallen to 373,000, a loss of 15 percent. The city is not very dense despite its reputation to the contrary. The land area is 34 square miles/89 square kilometers, which yields a 2010 population density of 11,000 per square mile/4200 per square kilometer. This is less than two thirds the density of the city of San Francisco and similar to that of some Los Angeles suburbs, such as Santa Ana, Inglewood or Alhambra (Figure 1).

    The city is divided into nine districts. The densest, the 5th district, covers 1.1 square miles/2.9 square kilometers and has a density of 24,000 per square mile/9200 per square kilometer. By comparison, Westlake, the most densely populated community planning district in the city of Los Angeles covered three times as much land and had a population density of 34,000 per square mile/13,000 per square kilometer in 2000 (latest data available). This is 40 percent greater than the highest Zürich district density.

    The Urban Area

    According to the Federal Office of Statistics (FSO), the Zürich urban area (urban agglomeration) has a population of approximately 1.2 million and covers a land area of 420 square miles/1085 square kilometers. The population density is comparatively low, at 2800 per square mile/1075 per square kilometer.

    Zürich’s development since World War II has mirrored the international trend towards suburbanization. In 1950, the urban area included the city of Zürich and 14 additional municipalities. The city, with a population of 390,000, contained more than 85 percent of the urban area population as defined at that time. Since 1950 all growth in the Zürich urban area has been in the suburbs. By 2010, the city of Zürich represented only 32 percent of the urban area population (Figure 2). Suburban areas account for 68 percent of the population and more than 90 percent of the urban land area.

    At each decennial census year, FSO adds new municipalities to the urban area as appropriate. In 1950, the urban area included the city of Zürich as well as 14 additional municipalities. By 2000, the urban area included the city of Zürich and 130 other municipalities (Figure 3). FSO is reviewing 2010 census results and is likely to add more municipalities to the urban area within the next year. The population of the urban area as presently defined has nearly doubled since 1950. The population trend for the city of Zürich and the six suburban rings (as presently defined) is illustrated in the Table.

    Zürich Urban Area: Population of Core Municipality & Suburban Rings: 1950-2010
    1950 1960 1970 1980 1990 2000 2010
    Urban Area: (Agglomeration Zürich)   605,765   801,124   947,011   970,073   1,021,859   1,080,728   1,188,566
    City of Zürich (Stadt)   390,020   440,170   422,640   369,522      365,043      363,273      372,857
    1st Ring (1950)     59,324     97,124   132,014   136,787      135,777      138,936      153,674
    2nd Ring (1960)     45,989     73,560   120,492   140,088      154,226      168,812      192,469
    3rd Ring (1970)     13,396     19,135     44,178     59,823         67,567         73,364         82,693
    4th Ring (1980)     64,259     83,036   113,195   132,444      145,165      159,021      183,878
    5th Ring (1990)     32,777     41,483     52,329     60,240         72,402         82,862         94,244
    6th Ring (2000)     46,616     62,163     71,169         81,679         94,460      108,751
    1950 Population for 6th Suburban Ring (2000) Not Available
    Source: Statistik Stadt Zürich & FSO


    In recent decades, population growth has gradually moved farther to the periphery of the urban area. This is illustrated by Figure 4, which shows a population trends for the city, the first three suburban rings (1950 to 1970) and the outer three suburban rings (1980 to 2000). By 2000, the three inner suburban rings exceeded the population of the city of Zürich. The outer three suburban rings passed Zürich in population by 2010 (Photo: Suburbs of Zürich).

    Suburbs of Zürich

    Suburban densities are considerably lower than that of the city of Zürich. Suburban Zürich has an overall population density of approximately 2100 per square mile/800 per square kilometer. As would be expected, the population densities decline substantially with distance from the city of Zürich (Figure 5). The first ring suburbs (1950) have a population density of 4500 square mile/1800 per square kilometer. This is about a quarter higher than the aggregate suburban density of Portland or New York, but only two-thirds as dense as the Los Angeles suburbs. The lowest population density is in the sixth suburban ring (2000) at approximately 1200 per square mile/450 per square kilometer. This is slightly above the approximate 1000 per square mile/400 per square kilometer international standard used by national statistics agencies in designating urban areas (Note 1).

    Similarly, employment has become more dispersed as jobs follow residents toward lower density suburban areas. Less than 15 percent of the urban area’s employment is in the central business district, a figure similar to that the average of US, Canadian and Australian urban areas.

    Getting Around and To Zürich

    Zürich is served by one of the world’s most effective transit systems, which necessarily focuses on the central business district and provides an intense mesh of service in the core city. Among the approximately 90 urban areas of the world for which the Millennium Cities Database provides service information, Zürich ranked 22nd in transit service intensity (transit vehicle kilometers divided by urban area square kilometers), with a service-level approximately 15 percent that of Hong Kong (Note 3). Among the European urban areas surveyed, only Barcelona and Milan had more intense transit service.

    However, as is the case in all urban areas of Western Europe (as well as the United States, Canada and Australia), the overwhelming majority of motorized travel in the Zürich urban area is by car. Zürich’s automobile market share, in distance traveled, is approximately 75 percent, similar to that of Paris and approximately 15 percent below that of the New York, Toronto or Sydney urban areas.

    Zürich, as the nation’s largest urban area, is unique in not having been linked to its national freeway (motorway) system until recently. Only since 2009 has Zürich been connected to nearby Lucerne (only 30 miles/50 kilometers away) or beyond  through the St. Gotthard tunnel to Milan and the South. The new Uetliberg Tunnel (A4 motorway) connects to the exurb of Zug. For the first time Switzerland’s main north-south motorway connects to its principal route, the east-west A1 motorway   (Note 2).

    No motorway dissects the city of Zürich. However, a swath is cut through the city of Zürich by the national railway system. Starting at Zürich Station and extending to the north city limits, the railway divide is from 150 to 450 meters/650 to 1500 feet wide (Photo: Zürich Railway Divide). This may be wider than any freeway in the world. For example, the 26-lane Katy Freeway in Houston, the 18-lane Autopista Panamericana in Buenos Aires and the 14-lane MacDonald Cartier Freeway in Toronto all have average widths of 150 meters/650 feet or less.

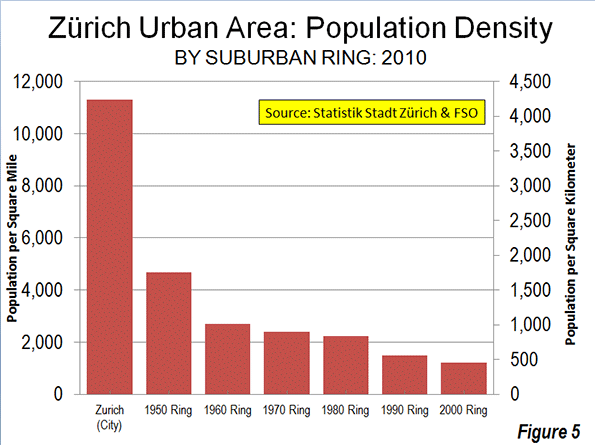
    Zürich Railway Divide (from Hardbrücke)

    Zürich: Compact Core, Suburban Reality

    Like urban residents throughout the high-income world, the residents of Zürich (and other Swiss urban areas) have chosen to live in larger, more comfortable houses, often with yards (gardens). At the same time, the historical urban core remains intact as a frequent or occasional destination for both tourists and residents, most of whom live in the suburbs.

    Wendell Cox is a Visiting Professor, Conservatoire National des Arts et Metiers, Paris and the author of “War on the Dream: How Anti-Sprawl Policy Threatens the Quality of Life.”

    —–

    Photo: Zürich Urban Core Street Scene (photos by author)

    Note 1: Such as INSEE (France), National Statistics (UK), Statistics Canada, United States Census Bureau, Census of India,

    Note 3: According to Millennium Cities Database information, only Manila had more intense transit service than Hong Kong (85 percent higher service intensity).

    Note 2: Switzerland speed limits are slow by European standards, but generally higher than those in the United States, Canada and Australia. The national speed limit on the motorway system is 120 kilometers per hour/75 miles per hour. Speed limits are higher in France and Italy at 130 kilometers per hour/81 miles per hour. In Germany, most of the autobahn system is not subject to speed limits. The highest speed limit in the United States is now planned for a new toll road (C-130) between San Antonio and Austin, at 85 miles per hour/137 kilometers per hour and on some other Texas and Utah roads at 80 miles per hour/129 kilometers per hour. Elsewhere in the United States, Canada and Australia, speed limits are lower than in Switzerland and nearly all Europe.

  • Carmel, IN Named Best Small City in America to Live In But Can Others Follow?

    Money Magazine just named the Indianapolis suburb of Carmel as the top small city in America to live in. Fishers, another Indianapolis suburb, ranked #12.

    Any ranking survey, and particularly one done by a magazine, needs to be taken with a grain of salt. However, Carmel and Fishers (along with occasionally Noblesville), frequently show up high in various national rankings. For those interested in suburban living, these places offer a pretty strong combination of good schools, low real estate prices (Indianapolis is basically the cheapest big city housing market in America), low taxes, and fairly high quality of life. With populations of over 75,000 each, these communities also have the scale to efficiently provide quality public services.

    I personally think Fishers has long term sustainability issues. It has kept up with very rapid growth admirably, but it has really not done much to secure its long term future, and when it reaches buildout, I expect problems to set in.

    Carmel by contrast has invested heavily in building towards a future where greenfield growth is no longer the driver. It has invested in high quality public facilities, some of the best suburban transportation infrastructure in the nation, building new urbanist neighborhoods from scratch, upgrading utilities, improving the environment, etc. Dan McFeely of the Indianapolis Star covers Carmel and wrote a bit about this.

    I’ve covered Carmel extensively for years here on the blog, calling it the “next American suburb” and writing about its civic strategy, new urbanist approach, and various criticisms of its leadership.

    I think the Carmel story is an interesting one because it shows how a city, albeit an affluent one, in a very conservative state can fundamentally transform itself in a way that that demonstrates results. This includes urbanism standards and infrastructure standards that exceed those of the urban core of Indianapolis, with many of its public services being better as well.

    The results most notably show up in incomes. While incomes cratered relative to the US in both Indiana and metro Indianapolis, Carmel’s median household income actually inched up versus the US average despite starting from a higher base.

    In short, the strategy has been working, though obviously the national economy has had an effect. And I don’t necessarily support everything they have done. Their $150 million performing arts center, for example, all paid for with public funds, seems expensive for a city of this size, and has saddled the city’s redevelopment commission with debt. But on the whole, things seem to be paying dividends.

    This is part of the explanation for why Indianapolis as a region has done well while its urban core lags many other cities. The majority of people prefer suburbs, and Indy’s newer suburbs provide an exceptional value proposition.

    Ultimately to be successful, the region will have to fire on all cylinders. This means both urban and suburban, with each neighborhood and town bringing a unique approach and its A game to the table. It’s not an either/or situation. I want to build urban cores up, not tear suburbs down. (Downtown Indianapolis has its own game going. Despite some recent criticisms that I stand behind, downtown Indy has positive momentum in a lot of areas. For example, another 300 tech jobs were just announced yesterday).

    I previously highlighted Columbus, Indiana, which has accomplished something similar in a more blue collar environment. So positive stories based on different variations of the same playbook aren’t limited merely to upscale suburbs.

    In a state that has long lagged the nation in job and output growth, and where the very large decline in relative incomes has been a huge issue at all levels, you would think that leaders would be streaming in to study these successful models.

    Alas, that is not the case. Not only is there little interest in learning from models that are actually working (save perhaps for other Indy suburbs looking to Carmel), there’s actual hostility. It’s as I said in some recent posts: Indiana actively discourages the pursuit of excellence. They’d rather cut down the successful than bring up the failing. State level policy choices are trying to do just that.

    Start with school funding. As part of a property tax reform process, the state of Indiana took over 100% of all local school operating funding. However, they also changed the funding formula in a way that stuck well performing metro Indy districts at the bottom of the pile. Out of about 360 school districts statewide, Carmel is fourth from the bottom in per pupil funding from the state. Other regional districts like Fishers and Zionsville are also at the bottom. In effect, the state decided to starve fast growing and well performing suburban districts. Somehow this didn’t make the list of education reforms in that recent Economist article. For a state that claims to want to base its economic future on things like life sciences, this sure seems puzzling.

    The state has also sought to impose a one size fits all, least common denominator approach to services. While it didn’t affect Carmel directly since they already built their first class library, the state’s Department of Local Government Finance vetoed plans by the suburbs of Westfield and Greenwood to build new libraries (partially inspired by Carmel), even though the bonding plans survived a petition challenge. The state’s rationale was that the cost per resident was higher than the state average. It’s easy to see that a policy like this acts as a one way downward ratchet.

    The state also passed a law that not only capped property taxes as a percentage of assessed value – a measure I support – but also put in place a de facto spending freeze for all cities at current levels through a levy cap.* (This levy cap ignores growth in commercial tax base, so if a town built a 50 million square foot industrial park, it wouldn’t even be able to raise the revenues to provide services to it).

    This has left cities increasingly depending on gimmicks to finance anything. And every time a city figures something like that out, the state makes noises about shutting it down. The state has also refused to allow communities to even let their own citizens vote in favor of spending money on things like transit. Indiana has never particularly empowered municipalities, but recent years have seen a strong turn towards disempowerment, with the state’s General Assembly serving as a sort of uber-city council (and now uber-school board too).

    I’d be willing to venture that neither Carmel nor Columbus would be able to accomplish what they have if they were starting out on the journey today under the current state legal and political climate.

    This is not to say that spending money is a solution to problems. Actually, by national standards, places like Carmel and Columbus don’t spend very much money at all. With some exceptions like that performing arts center, they are actually quite frugal. They understood the concept of long term total cost of ownership, and as a result have kept taxes low by not being penny wise, pound foolish in the short term, while so many other places that thought only about the now have descended into a near death spiral of service cuts, tax increases, and abandonment. That’s the tragedy.

    In a rational world, one would think that we’d look at models that are producing population growth, job growth, corporate (including foreign) investment, high quality of services and quality of life, keeping incomes at or above US levels – and mostly importantly all while keeping taxes well below normal (at the bottom of the state in Carmel’s case) even by the standards of Indiana – and say to ourselves: how can we get more of that? Unfortunately, that’s not the case here. (Again, some other Indy suburbs excepted).

    Before proposing solutions to Indiana’s long term under-performing economy, I would suggest that the candidates for governor first take a look around the state to examine at the places that are already doing well and have been doing well over the last decade or more. Then ask the question: what are they doing different and right and what do we need to do to get other places doing those things? First among the places to visit would be suburbs like Carmel and industrial cities like Columbus. If you’re ranked #1 in America, you must be doing something right.

    * This is complicated, but my understanding is that the total property tax levy cannot grow faster than inflation + population growth. This has had many perverse incentives, including keeping entities like townships from lowering their tax levy even when possible because they’re afraid they’ll never be able to raise it again if needed.

    Aaron M. Renn is an independent writer on urban affairs and the creator of Telestrian, a data analysis and mapping tool. He writes at The Urbanophile, where this piece originally appeared.

    Carmel City Hall photo by Bigstock.

  • The Unseen Class War That Could Decide The Presidential Election

    Much is said about class warfare in contemporary America, and there’s justifiable anger at the impoverishment of much of the middle and working classes. The Pew Research Center recently dubbed the 2000s a “lost decade” for middle-income earners — some 85% of Americans in that category feel it’s now more difficult to maintain their standard of living than at the beginning of the millennium, according to a Pew survey.

    Blaming a disliked minority — rich business folks — has morphed into a predictable strategy for President Obama’s Democrats, stripped of incumbent success. But all the talk of “one percent” versus “the ninety nine percent” misses new splits developing within both the upper and middle classes.

    There is no true solidarity among the rich since no one is yet threatening their status. The “one percent” are splitting their bets. In 2008 President Obama received more Wall Street money than any candidate in history, and he still relies on Wall Street bundlers for his sustenance. For all his class rhetoric, miscreant Wall Streeters, particularly big ones, have evaded big sanctions and the ignominy of jail time.

    Obama enjoys great support from the financial interests that benefit from government debt and expansive public largesse. Well-connected people like Obama’s financial tsar on the GM bailout, Steven Rattner, who is also known as a vigorous defender of “too big to fail.”

    The “patrician left” — a term that might have amused Marx — extends as well to Silicon Valley, where venture capitalists and techies have opened their wallets wider than ever before for the president. Microsoft and Google are two of Obama’s top three organizational sources of campaign contributions. Valley financiers are not always as selfless as they or their admirers imagine: Many have sought to feed at the Energy Department’s bounteous “green” energy trough and all face regulatory reviews by federal agencies.

    The Republicans have turned increasingly to those patricians who depend on the more tangible economy. If you make your living from digging coal or exploring for oil wells, even if you don’t like him, Romney is you man. This saddles the GOP with the burden of being linked to one of America’s most hated interests: oil and gas companies. Almost as detested is the biggest source of Romney cash, large Wall Street banks. (In contrast, Democratic-leaning industries, such as Internet-related companies, enjoy relatively high public support.)

    With the patriarchate divided, the real action in the emerging class war is taking place further down the economic food chain. This inconvenient reality is largely ignored by the left, which finds the idea of anyone this side of Bain Capital supporting Romney as little more than “false consciousness.”

    Obama’s core middle-class support, and that of his party, comes from what might be best described as “the clerisy,” a 21st century version of France’s pre-revolution First Estate. This includes an ever-expanding class of minders — lawyers, teachers, university professors, the media and, most particularly, the relatively well paid legions of public sector workers — who inhabit Washington, academia, large non-profits and government centers across the country.

    This largely well-heeled “middle class” still adores the president, and party theoreticians see it as the Democratic Party’s new base. Gallup surveys reveal Obama does best among “professionals” such as teachers, lawyers and educators. After retirees, educators and lawyers are the two biggest sources of campaign contributions for Obama by occupation. Obama’s largest source of funds among individual organizations is the University of California, Harvard is fifth and its wannabe cousin Stanford ranks ninth.

    Like teachers, much of academia and the legal bar like expanding government since the tax spigot flows in the right direction: that is, into their mouths. Like the old clerical classes, who relied on tithes and the collection bowl, many in today’s clerisy lives somewhat high on the hog; nearly one in five federal workers earn over $100,000.

    Essentially, the clerisy has become a new, mass privileged class who live a safer, more secure life compared to those trapped in the harsher, less cosseted private economy. As California Polytechnic economist Michael Marlow points out, public sector workers enjoy greater job stability, and salary and benefits as much as 21% higher than of private sector employees doing similar work.

    On this year’s Labor Day, this is the new face of unionism. The percentage of private-sector workers in unions has dropped from 24% in 1973 to barely 7% today and in 2010, for the first time, the public sector accounted for an absolute majority of union members. “Labor” increasingly means not guys with overalls and lunch pails, but people whose paychecks are signed by taxpayers.

    The GOP, for its part, now relies on another part of the middle class, what I would call the yeomanry. In many ways they represent the contemporary version of Jeffersonian farmers or the beneficiaries of President Lincoln’s Homestead Act. They are primarily small property owners who lack the girth and connections of the clerisy but resist joining the government-dependent poor. Particularly critical are small business owners, who Gallup identifies as “the least approving” of Obama among all the major occupation groups. Barely one in three likes the present administration.

    The yeomanry diverge from the clerisy in other ways. They tend to live in the suburbs, a geography much detested by many leaders of the clerisy and, likely, the president himself. Yeomen families tend to be concentrated in those parts of the country that have more children and are more apt to seek solutions to social problems through private efforts. Philanthropy, church work and voluntarism — what you might call, appropriately enough, the Utah approach, after the state that leads in philanthropy.

    The nature of their work also differentiates the clerisy from the yeomanry. The clerisy labors largely in offices and has no contact with actual production. Many yeomen, particularly in business services, depend on industry for their livelihoods either directly or indirectly. The clerisy’s stultifying, and often job-toxic regulations and “green” agenda may be one reason why people engaged in farming, fishing, forestry, transportation, manufacturing and construction overwhelmingly disapprove of the president’s policies, according to Gallup.

    Obama supporters sometimes trace the loss of largely white working-class support — even to the somewhat less than simpatico patrician Romney — to “false consciousness.”  A recent Daily Kos article, charmingly entitled “The Masses are Asses,” chose to wave the old bloody shirt of racism, arguing that whites “are the single largest, and most protected racial group in this country’s history.”

    Ultimately this division — clerisy and their clients versus yeomanry — will decide the election. The patricians and the unions will finance this battle on both sides, spreading a predictable thread of half-truths and outright lies. The Democrats enjoy a tactical advantage. All President Obama needs is to gain a rough split among the vast group making around or above the national median income. He can count on overwhelming backing by the largely government dependent poor as well as most ethnic minorities, even the most entrepreneurial and successful.

    Romney’s imperative will be to rouse the yeomanry by suggesting the clerisy, both by their sheer costliness and increasingly intrusive agenda, are crippling their family’s prospects for a better life. In these times of weak economic growth and growing income disparity, the Republicans delude themselves by claiming to ignore class warfare. They need to learn how instead to make it politically profitable for themselves.

    Joel Kotkin is executive editor of NewGeography.com and is a distinguished presidential fellow in urban futures at Chapman University, and contributing editor to the City Journal in New York. He is author of The City: A Global History. His newest book is The Next Hundred Million: America in 2050, released in February, 2010.

    This piece originally appeared in Forbes.

    Mitt Romney image from Bigstock.

  • Evolving Urban Form: São Paulo

    São Paulo is Brazil’s largest urban area and ranks among the top 10 most populous in the world. Between 1950 and 1975, São Paulo was also among the globe’s fastest growing urban areas. For two decades starting in 1980 São Paulo ranked fourth in population among the world’s urban areas, but has been displaced by much faster growing urban areas like Manila and Delhi.

    São Paulo became Brazil’s largest urban area, displacing Rio de Janeiro, in the middle 1960s. There has been no looking back. By 2025, the United Nations forecasts that São Paulo will have 10 million more people than Rio (Figure 1).

    São Paulo is the capital of Brazil’s largest state, also called São Paulo. The 2010 census counted more than 41 million people in the state, more than live in California. The state of São Paulo is substantially more densely populated than California, occupying only two thirds of the land area (approximately the size of Oregon).

    There are other large urban areas in the vicinity of São Paulo. Campinas, an urban area of 2.5 million people, is located 60 miles (100 kilometers) north and San Jose dos Campos, an urban area of 600,000 is located 60 miles (100 kilometers) to the west.

    A 20th Century City

    Like many developing world megacities, São Paulo is a creation of the 20th century. In 1900, the population was 240,000. By 1950, the population had reached two million and now is approximately 20,200,000.

    São Paulo is located on a small plateau, over the mountains from the Atlantic Ocean 2500 feet (750 meters) above sea level, approximately the same elevation as Madrid. São Paulo is the world’s second largest urban area not located on an ocean or sea coast (Delhi is the largest).

    São Paulo is located 50 miles (80 kilometers) from the seaport of Santos, which is an urban area of 1.7 million. Santos is reached by one of the world’s most spectacular freeways, the Rodovia dos Imigrantes, which winds down the mountainside, with the southbound lanes crossing over the northbound lanes like the Interstate 5 Grapevine north of   Los Angeles, the grade down from Puebla (Mexico) to the city of Orizaba on Autopista 150D and a section of the N205 approaching Chamonix-Mont-Blanc in France.

    São Paulo’s Urban Expanse

    São Paulo is a comparatively dense urban area, at 16,500 persons per square mile, or 6400 per square kilometer. This makes São Paulo somewhat less than double the density of Paris, but still one quarter the density of Hong Kong or Mumbai and one seventh the density of Dhaka. The urban area covers 1,225 square miles (3,175 square kilometers), similar in size to the Miami and Washington DC urban areas.

    São Paulo is hardly a "compact city." The urban area stretches nearly 60 miles/100 kilometers east to west and more than 30 miles/50 kilometers north to south. The core city covers nearly as much area as the core city of Houston.

    Recent Growth and Suburbanization

    The central city (municipio) of São Paulo continues to grow. In the last 10 years, São Paulo  has grown from 10.4 million to 11.2 million. A majority of the urban area population, 57 percent, continue to live in the central city. However there is much stronger growth in the suburbs, reflecting the trends in nearly all other major urban areas of the world. Since 1950, São Paulo’s suburbs have experienced an explosive   growth, rising from under 200,000 residents to 8.4 million. This exceeds the core city’s growth over the same period of 7.46 million (Figure 2).

    In the last 10 years, suburban São Paulo has grown from 6.7 million to 8.4 million people, capturing   more than two thirds of the population growth. Since 1950, when the suburbs had approximately 5 percent of the population, they have increased their share in every census. However, if the strong growth of the city and the suburbs continues at the rates of the last 10 years, it could be 30 years before a majority of the population lives in the suburbs.

    Deficient Transport

    Like most nations, Brazil has a freeway or motorway system. There is a freeway between São Paulo and Rio de Janeiro and a freeway from São Paulo to the nation’s third largest urban area, Belo Horizonte. These and other freeways emerge from the urban periphery, without traversing the core.

    Yet, there is no way for trucks to traverse the São Paulo urban area from East to West without getting tied up in São Paulo’s monumental central area traffic. Nor is there a freeway for port traffic to cross the urban area south to north toward Campinas. Thus, truck traffic from the affluent urban areas of the South, such as Curitiba and Porto Alegre and the port at Santos is forced on to the Avenida Marginal Tiete and Avenida Marginal Pinheiros, forging an overused route adjacent to the urban core on both the west and north sides. East-west and north-south commercial traffic is combined on this roadway.

    However, São Paulo is building a long overdue ring road, the Mario Covas Beltway. Less than one half of this route is now in operation and the whole circle will not be completed until 2015.

    São Paulo is also on the trouble fraught high speed rail route proposed to run from Rio de Janeiro to Campinas. The route was roundly criticized by The Economist, which noted the low-balled costs, the astronomical ridership projections and the likelihood that Brazilian taxpayers would have to foot quite a bill to make it happen. This line was covered in more detail in Private Investors Shun Brazil High Speed Rail and High Speed Rail in Brazil: The Need for Guarantees.

    From Monocentricity to Polycentricity

    A number of other megacities in the developing world have added new commercial cores, becoming more polycentric, as the old central business district becomes comparatively less important. This is evident in Istanbul, Mexico City and Manila. In recent decades, most of the core-type commercial development has occurred along Avenida Paulista (two miles/three kilometers west of Centro) and then later, Luis Berrini (another 6 miles/10 kilometers further to the southwest).

    The Shantytowns

    As drivers travel on the Avenidas Marginal and the Mario Covas Beltway, they pass many shantytowns (favelas) close to the roadways. This can be a shocking site for North American rental car tourists. In more recent decades, favelas have developed not only on the urban fringe, but adjacent to affluent areas in the core (Photo). There are also corticos, which tend to be old subdivided houses and more centrally located. Both of these are increasingly interspersed through the urban area. A mid 1990s estimate placed the number of people living in this sub-standard housing at one quarter of the people in the central city of São Paulo.

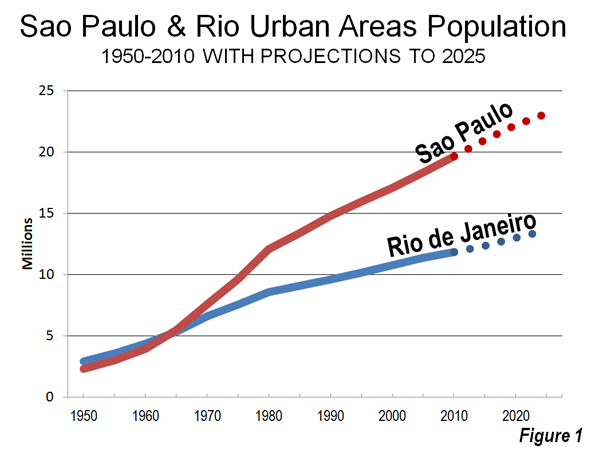
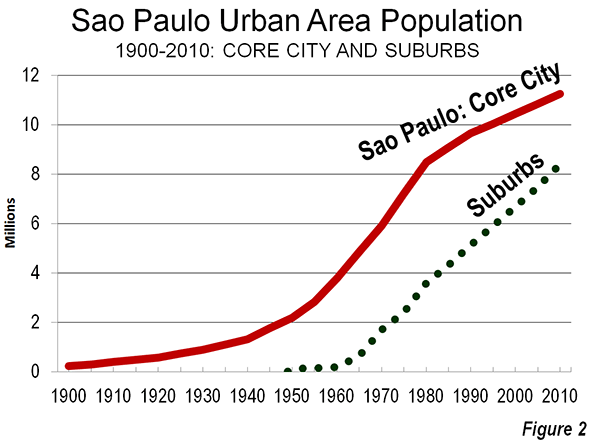
    Favela and Affluence, core city of São Paulo

    City of Hope

    The origins of this movement to Sao Paulo are clear. People moved from the poor countryside, often from the sugar plantations of the Northeast. As bad as life may look to affluent northerners, things are much better here than back in the countryside. Otherwise they would go home, which occurs with no material frequency. São Paulo, like all big metropolitan areas, is a city of hope.


    Wendell Cox is a Visiting Professor, Conservatoire National des Arts et Metiers, Paris and the author of “War on the Dream: How Anti-Sprawl Policy Threatens the Quality of Life.”

    Lead Photo: Paulista Avenue (by author)

  • Regionalism: Spreading the Fiscal Irresponsibility

    Stanley Kurtz’s new book, Spreading the Wealth: How Obama is Robbing the Suburbs to Pay for the Cities describes political forces closely tied to President Obama who have pursued an agenda to “destroy” the suburbs for many years. He expresses concern that a second Obama term will be marked by an intensification of efforts to destroy the suburbs through eviscerating their independence thought the imposition of "regionalism". The threat, however, long predates the Obama administration and has, at least in some cases, been supported by Republicans as well as by Democrats.

    America is a suburban nation. Nearly three-quarters of the residents of major metropolitan areas (over 1,000,000 population) live in suburbs, most in smaller local government jurisdictions. Further, outside the largest metropolitan areas most people live in suburbs, smaller towns or smaller local government jurisdictions.

    Smart Growth

    The anti-suburban agenda has more than one dimension. The best known is smart growth, known by a variety of labels, such as compact development, growth management, urban consolidation, etc. Smart growth, from our research, also is associated with higher housing prices, a lower standard of living, greater traffic congestion and health threats from more intense local air pollution.

    Regionalism

    Another, less well-known anti-suburban strategy is regionalism, to which Kurtz grants considerable attention. Regionalism includes two principal strains, local government amalgamation and metropolitan tax sharing. Both of these strategies are aimed at transferring tax funding from suburban local governments to larger core area governments.

    Social welfare and differing income levels are not an issue at this level of government. Local governments, cities, towns, villages, boroughs and townships, finance local services principally with their own local taxes. The programs aimed at social welfare or providing income support are generally administered and financed at the federal, state or regional (county) level. Any suggestion that local suburban jurisdictions are subsidized by core local governments simply reveals a basic unfamiliarity with US municipal finance.

    Local Government Amalgamation

    Opponents of the suburbs have long favored amalgamating local governments (such as cities, towns, villages, boroughs and townships). There are two principal justifications. One suggests "economies of scale" — the idea that larger local government jurisdictions are more efficient than smaller governments, and that, as a result, taxpayers will save. The second justification infers that a larger tax base, including former suburbs, will make additional money available to former core cities, which are routinely characterized as having insufficient revenues to pay for their services. Both rationales are without foundation.

    Proponents of amalgamation incessantly refer to the large number of local governments in some states, implying that this is less efficient. The late Elinor Ostrum put that illusion to rest in her acceptance speech for the Nobel Prize in economics in 2009:

    Scholars criticized the number of government agencies rather than trying to understand why created and how they performed. Maps showing many governments in a metropolitan area were used as evidence for the need to consolidate.

    The reality is that there is a single measure of efficiency: spending per capita. Here there is a strong relationship between smaller local government units and lower taxes and spending. Our review of local government finances in four states (Pennsylvania, New York, Indiana and Illinois) indicates that larger local governments tend to be  less efficient, not more. Moreover, the same smaller is more efficient dynamic is evident in both metropolitan areas as well as outside. "Smaller is better" is also evident at the national level (Figure 1).

    Yet the "bigger is better" faith in local government amalgamation remains compelling to many from   both the Right and Left. Proponents claim that smaller local governments are obsolete, characterizing them as being from the horse-and-buggy era. The same logic could be used to eliminate county and even state governments. However, democracy remains a timeless value. If people lose control of their governments to special interests (which rarely, if ever, lobby for less spending), then democracy is lost, though the word will still be invoked.

    Support of local government amalgamation arises from a misunderstanding of economics, politics and incentives (or perhaps worse, contempt for citizen control). When two jurisdictions merge, everything is leveled up, from labor costs to service levels. The labor contracts, for example, will reflect the wage, benefit and time off characteristics of the more expensive community, as the Toronto "megacity" learned to its detriment.

    Further, special interests have more power in larger jurisdictions, not least because they are needed to finance the election campaigns of elected officials, who always want to win the next election. They are also far more able to attend meetings – sending paid representatives – than local groups. This is particularly true the larger the metropolitan area covered, since meeting are usually held in the core of urban area not in areas further on the periphery. This greater influence to organized and well-funded special interests – such as big real estate developers, environmental groups, public employee unions – and drains the influence of the local grassroots. The result is that voters have less influence and that they can lose financial control of larger local governments. The only economies of scale in larger local government benefit lobbyists and special interests, not taxpayers or residents.

    Regional Tax Sharing

    Usually stymied by the electorate in their attempts to amalgamate local governments, regional proponents often make municipal tax sharing a priority. The idea is that suburban jurisdictions should send some of their tax money to the core jurisdictions to make up for the claimed financial shortages of older cities. Yet this ignores the fact, as Figure 1 indicates, that larger jurisdictions generally spend more per capita already and generally tax more, as our state reports cited above indicate. Larger jurisdictions also tend to receive more in state and federal aid per capita.  A principal reason is that the labor costs tend to be materially higher in larger jurisdictions. In addition to paying well above market employee compensation, many larger jurisdictions have burdened themselves with pension liabilities and post employment health benefits that are well above what their constituencies can afford. The regionalist solution is not to bring core government costs in line with suburban levels but force the periphery to help subsidize their out of control costs.

    Howard Husock, of Harvard University’s JFK School of Government (now at the Manhattan Institute) and I were asked to evaluate a tax sharing a plan put forward by former Albuquerque mayor David Rusk for Kalamazoo County, Michigan (The Kalamazoo Compact) more than a decade ago. Our report (Keeping Kalamazoo Competitive)found no justification for the suburban areas and townships of Kalamazoo County to share their tax bases with the core city of Kalamazoo. The city already spent substantially more per capita, received more state aid per capita and had failed to take advantage of opportunities to improve its efficiency (that is, lower the costs of service without reducing services).  We concluded that the "struggling" core city had a spending problem, not a revenue problem. To the credit of the electorate of Kalamazoo County, the tax sharing proposal is gathering dust, having been made impractical by suburban resistance.

    Spreading the Financial Irresponsibility

    The wanton spending that has gotten many larger core jurisdictions into trouble should not have occurred. The core cities are often struggling because their political leadership has "given away the store," behavior that does not warrant rewarding. Elected officials in the larger jurisdictions had no business, for example, allowing labor costs to become higher than necessary or granting rich pension benefits paid for by private sector employees (taxpayers), most of whom  enjoy only  much more modest pension programs, if at all (See note below).

    The voters are no match for the spending interests with more efficient access to City Hall. The incentives in such larger jurisdictions are skewed against fiscal responsibility and the interests of taxpayers. Making an even larger pool of tax revenues available can only make things worse.

    At the same time, the smaller, suburban jurisdictions around the nation are often the bright spot in an environment of excessive federal, state and larger municipal government spending. Their governments, close to the people, are the only defense against the kind of beggar-the-kids-future spending that has already captured the federal government, state governments and some larger local jurisdictions.

    Either Way the Threat is Very Real

    Even if President Obama is not re-elected or if a second Obama Administration does not pursue the anti-suburban agenda, the threat to the suburbs will remain very real. This is not just about the suburbs, and it is certainly not some secret conspiracy. What opposing regionalism means is the preservation of what is often the last vestige of fiscal responsibility. It is not that the elected officials in smaller  jurisdictions are better or that the electorate is better. The superior performance stems from the reality that smaller governments are closer to the people, and decision-making tends more to reflect their interests more faithfully than in a larger jurisdictions.

    Ed. note: This piece was corrected to add quotation marks around the word “destroy” in the first paragraph. That clause is included in reference to Kurtz’s characterization, not the author’s.

    ——

    Note: A report by the Pew Charitable Trusts (Promises with a Price) indicated that "… in general, the private sector never offered the level of benefits that have been traditionally available in the public sector." The report further indicated that 90 percent of state and local government retirees are covered by the more expensive defined benefit pension programs, compared to 20 percent in the private sector. The median annual pension in the state and local government sector was cited at 130 percent higher than in the private sector. While 82 percent of state and local government retirees are covered by post-employment medical benefits, the figure is 33 percent in the private sector. According to the Bureau of Labor Statistics, after accounting for the one-third higher wages per hour worked among state and local government workers, employer contribution to retirement and savings is 160 percent higher than in the private sector (March 2012). A just published Pew Center on the States report (The Widening Gap Update) indicates that states are $1.3 trillion short of the funding required to pay the pension and post employment medical benefits of employees. This does not include programs administered by local governments.

    Wendell Cox is a Visiting Professor, Conservatoire National des Arts et Metiers, Paris and the author of “War on the Dream: How Anti-Sprawl Policy Threatens the Quality of Life.”

    Lead Photo: Damascus City Hall (Portland, Oregon metropolitan area) by Wiki Commons user Tedder.