Category: Suburbs

  • A Victory for Localism in Australia: Court Blocks Forced Amalgamation

    In a rare victory for grassroots activists, The New South Wales Supreme Court has blocked the forced local government amalgamation of northern suburban councils Ku-ring-gai and the Shire of Hornsby in Greater Sydney. The Ku-ring-gai Council had challenged the parliamentary order and lost at a lower court level , but as The Daily Telegraph put it “Ku-ring-gai Council has won its appeal against a forced merger with Hornsby Council this morning in a judgment that was highly critical of the State Government delegate and its process.” The Council was also awarded costs.

    This forced amalgamation is just one of a number of mergers ordered by the ruling Liberal-National Coalition government of Premier Gladys Berejiklian. This and other such orders have been challenged in court and, according to the Daily Telegraph: “The Berejiklian government’s remaining council merger plans have been thrown into upheaval after the NSW Supreme Court ruled the process used ahead of a proposed merger between Ku-ring-gai and Hornsby Councils did not accord with procedural fairness.”

    Statutory Duty, Disclosure, Public Participation and Procedural Fairness

    In particular, the court indicated concern about a failure of statutory duty, lack of public disclosure and insufficient opportunity for public participation.

    At issue was the recommendation of Delegate Garry West that the forced merger proceed (Delegate West was appointed by the government to make a finding on the government’s forced merger proposal). The Ku-rung-gai Council argued that Delegate West had relied on a merger analysis report by KPMG, a report that the government would not release in public.

    Writing in the opinion, Judge J. A. Basten said: “The Council was right to assert that the delegate could not properly carry out his function of examination without having access to that material…" and found that “that the financial advantages identified by KPMG for the government were a critical element in favour of the merger, but this analysis was not provided to the delegate or public.” Judge Basten concluded that Mr. West had "constructively failed" in his statutory duty of examining the government’s merger proposal, according to the Sydney Morning Herald.

    In addition, Judge Basten pointed out that "Release of the material was also necessary for public participation in the public inquiry to be meaningful." According to the opinion: “The appellant was denied procedural fairness as the delegate chose to rely on the KPMG analysis, rather than conducting his own assessment of the merger, when the appellant was not in possession of the document in which the analysis was contained.”

    No Amalgamation Based on a Secret Report

    Government News reported Greens Local Government spokesman David Shoebridge as saying “Today the Court of Appeal has said the obvious, that it is blatantly unfair to forcibly amalgamate a local council on the basis of a secret report.” (In parliamentary systems, opposition office holders are designated as spokespersons or shadow ministers, replicating the portfolios of the government ministers, who are also legislative members). He added that the decision could “dismantle every single outstanding amalgamation proposal.” He called the decision “an embarrassing blow” for the government’s forced amalgamation program, which he characterized as “unraveling.”

    The Labor Party Opposition Leader Luke Foley expressed similar sentiments, saying “Thank God we have an independent judiciary.”

    Tony Recsei, president of Save Our Suburbs (SOS) NSW, which has opposed the forced mergers, noted that:  “Rational justification for wholesale forced council amalgamations was never provided by the Government.” He added: “The amalgamation “consultation” process was laughable in its duplicity. It was glaringly obvious to anyone who participated that the results had been predetermined.” He characterized the court decision as “… a rare win for the community against a dictatorial government and represents a complete trouncing of underhand bureaucratic manipulation.” Demonstrations have been held to oppose the forced mergers (Photo).


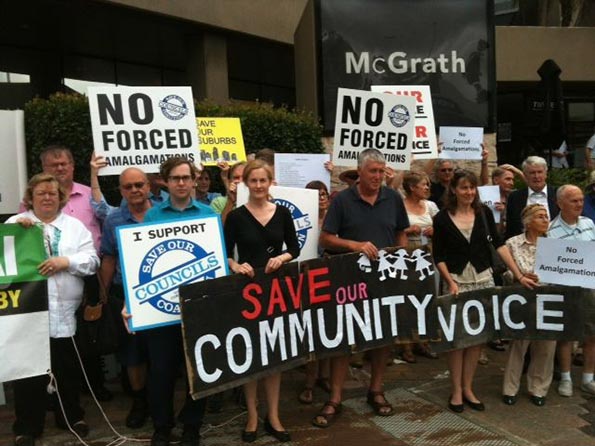
    Photograph courtesy of FOKE (Friends of Ku-ring-gai Environment)

    Still a Threat

    Deputy Premier John Barilaro had demanded two months ago that the Coalition government abandon its forced amalgamation program. His National Party (the Liberal Party’s coalition partner) had recently lost the Legislative Assembly seat of Orange that it had held for 69 years running, a consequence, at least in part of the government’s forced amalgamation program. The National Party has traditionally been strong in the “bush,” including smaller urban areas (such as Orange), outside the major metropolitan areas of Australia. The National Party usually been the coalition partner of the Liberal Party in government at the federal and state level.

    A compromise was reached  such that “country councils” (outside the Greater Sydney area and where the National Party is strong) will not be required to amalgamate. However, a month ago, the government expressed its intention to continue with the Sydney area amalgamations.

    In fact, the government could resurrect the Ku-ring-gai Hornsby forced merger proposal. However, Ku-ring-gai Mayor Jennifer Anderson told the ABC (Australian Broadcasting Corporation) that she was “heartened.” She added that “We have had to go to court to get the Government to listen to us and I am seeking a change of heart from the Premier on this issue as a matter of urgency." She cautioned that "If they continue with the merger process, they will be flying in the face of our community and the court."

    Forced Amalgamation: “Fit for the Dustbin?”

    This initiative is the third local government reorganization since 2000 in New South Wales. Like the previous programs, the justification has been anticipated cost savings. Councils were examined for their fiscal sustainability in “Fit for the Future” reviews.

    Greens spokesman Shoebridge questions the justification for amalgamation. In a Greens of Hornsby website article entitled “Fit for the Future, Fit for the Dustbin,” Shoebridge notes that “When amalgamations have been forced on locals in other states like Victoria and Queensland, rates (taxes) have gone up, services have stagnated and residents end up less connected to the councilors who represent them. In Queensland a number of councils have even begun the expensive process of de-amalgamation, with the Queensland Government bearing the cost of this process.” In that state, the Liberal National government won power promising de-amalgamation votes, yet allowed only four referendums out of the 19 councils seeking relief. All four voted to de-amalgamate.

    Repeating History

    If the Ku-ring-gai amalgamation story sounds familiar, it is. In 2000, the government of Quebec undertook a wholesale program of local government amalgamations. Public reaction was so sharp that the government was defeated at the next election, as the opposition Liberal Party promised de-amalgamation votes. Despite its promises, the Liberals, once elected, required de-amalgamation “yes” votes to equal 35 percent of eligible voters, a prohibitive barrier given the typically low turnouts in local government elections. In the end 32 governments voted to de-amalgamate. In the United States, proposals to force local government amalgamations have not received legislative approval in Pennsylvania, New York, Illinois and Ohio.

    The Sydney area consultant savings report is also familiar. In 1997, the Ontario government announced a forced amalgamation of six local governments in the Toronto area. The “megacity” as it was called was, according to an accounting firm report commissioned by the government, to save $300 million annually, which was not achieved, according to University of Western Ontario local governance expert  Professor Andrew Sancton. Despite overwhelming referendum rejections in six of the cities, the government forced the amalgamation.

    Basic Democratic Values

    Ku-ring-gai Mayor Anderson also stressed basic democratic values, the ability of an electorate to control its government, noting that "This merger should not proceed because Ku-ring-gai ratepayers (taxpayers) will be robbed of the means to decide how and where our rates are spent and of any real say in how our local area is managed.

    These are powerful words. The fight for democracy has been waged for at least the 800 years since Magna Carta and progress has been hard won. Forced amalgamations are anti-democratic and a step backward. It would be one thing if the electorate of Ku-ring-gai had determined that it would be best to amalgamate with Hornsby. But there is a big difference between top-down forced amalgamations and amalgamations that arise from the people themselves. Voluntary amalgamations have a better chance of succeeding than those that are forced.

    However, forced amalgamations dilute the voice of voters, and without  their consent. Usually, as in New South Wales, it is argued that larger government units will be more efficient, exercising economies of scale. The reality is all too often that the economies of scale that are actually achieved are only for special interests, not for the people or their pocket books.

    Wendell Cox is principal of Demographia, an international public policy and demographics firm. He is a Senior Fellow of the Center for Opportunity Urbanism (US), Senior Fellow for Housing Affordability and Municipal Policy for the Frontier Centre for Public Policy (Canada), and a member of the Board of Advisors of the Center for Demographics and Policy at Chapman University (California). He is co-author of the “Demographia International Housing Affordability Survey” and author of “Demographia World Urban Areas” and “War on the Dream: How Anti-Sprawl Policy Threatens the Quality of Life.” He was appointed to three terms on the Los Angeles County Transportation Commission, where he served with the leading city and county leadership as the only non-elected member. He served as a visiting professor at the Conservatoire National des Arts et Metiers, a national university in Paris.

    Photograph: Ku-rin-gai anti-forced amalgamation campaign banner, Photography courtesy of Save Our Suburbs (SOS) NSW.

  • Flight from Urban Cores Accelerates: 2016 Census Metropolitan Area Estimates

    The flight from the nation’s major metropolitan area core counties increased 60 percent between 2015 and 2016, according to just-released estimates from the US Census Bureau (Note). A total of 321,000 more residents left the core counties than moved in, up from 199,000 in 2015. This is ten times the decade’s smallest domestic migration loss of 32,000 for the same counties which occurred in 2012.

    Suburban counties continued to attract net domestic migrants, at a somewhat higher rate than in recent years and much higher than in the early part of the decade. The suburban counties gained 235,000 domestic migrants in 2016, compared to 224,000 in 2014 and more than double the low point of 113,000 in 2011 (Figure 1).

    The 60 percent rise in net domestic migration out of the core counties converts to a 0.4 percent annual loss relative to last year’s population. This loss is more than one-half the annual growth rate of only 0.7 percent. This is a substantial deterioration from the net domestic migration loss in 2012 of 0. 04 percent, which was only 1/25th of the 1.1 percent growth rate for the core counties.

    At the same time, the suburbs had their best performance of the decade. Their minimum advantage was in 2012, when the suburbs attracted 150,000 new domestic migrations relative to the core counties (118,000 compared to negative 32,000). The 2016 advantage was 556,000 (235,000 compared to negati ve 321,000).

    The suburbs outperformed core county domestic migration in 40 of the 50 major metropolitan cases. The ten exceptions include three with strong urban cores (San Francisco, Boston and Washington) and seven with very small urban cores, indicating that much of the central county population is post-war suburban (see: Growth Concentrated in Most Suburbanized Core Cities).

    Overall Domestic Migration

    The deterioration in core county domestic migration led to overall negative domestic migration for the major metropolitan areas in 2016, the first time this has happened this decade. Overall, the 53 major metropolitan areas had a net domestic migration loss of 64,000, down from 17,000 in 2015 and 98,000 in 2012. Since the 2010 census, the major metropolitan areas have gained 222,000 net domestic migrants. This represents an overall net domestic migration rate of 0.13 percent relative to their 2010 population.

    The big, and perhaps surprising, news here is that the “second tier” of metropolitan areas   (between 500,000 and 1 million population) have begun to perform better than their larger counterparts, a result reminiscent of the last decade. These 53 metropolitan areas gained 97,000 net domestic migrants, topping the major metropolitan areas for the third year in a row (Figure 2). Since the 2010 census, second tier metropolitan areas have gained 334,000 domestic migrants. This is 0.92 percent of the 2010 census population, seven times the major metropolitan area figure of 0.13 percent.

    Where People Are Moving To and Away From

    As has become customary, the greatest rates of domestic migration among the major metropolitan areas are overwhelmingly in the South. Austin is again number one, gaining nearly 1.7 percent from domestic migration. Austin is followed by Tampa St. Petersburg, Raleigh and Jacksonville. Las Vegas is the only non-southern major metropolitan area among the top five in net domestic migration. The second five includes four southern metropolitan areas, Charlotte, Orlando and Nashville, ranking sixth through eighth and San Antonio ranking tenth. Phoenix placed ninth.

    The bottom 10 are a relatively familiar group of metropolitan areas, with San Jose placing last and being alone in having more than one percent (1.1 percent) of its population move away between 2015 and 2016. San Jose was also last in net domestic migration in the decade of the 2000s, if hurricane ravaged New Orleans is excluded. The bottom five also includes New York, Chicago, Hartford and Milwaukee. Los Angeles had the sixth worst net domestic migration, followed by Rochester, Virginia Beach-Norfolk, Washington and Buffalo (Figure 3).

    The net domestic migration leaders among the large metropolitan areas posted even stronger gains than Austin. All of the top five had greater net domestic migration rates, and all are in Florida. Leader Cape Coral added more than 2.5 percent to its population from domestic migration. Nearby Sarasota was near 2.5 percent in Daytona Beach was also over two percent. Melbourne and Lakeland were approximately 1.9 percent. The second five was led by Charleston, South Carolina, followed by Boise, Fayetteville AR-MO, Spokane and Provo, UT.

    The largest domestic migration loss was in Honolulu, at 1.1 percent and slightly worse than San Jose (minus 1.08 percent compared to 1.06 percent in San Jose). Two of New York’s commuter rail exurbs ranked second and fourth worst, Bridgeport-Stamford and New Haven, while Syracuse ranked third. El Paso had the fifth worst net domestic migration. The second five worst in net domestic migration were Springfield, Massachusetts, Youngstown, Bakersfield, Oxnard and McAllen, Texas (Figure 4).

    Population Rankings and Trends

    Again, New York, Los Angeles, Chicago, Dallas-Fort Worth and Houston were the largest. They were followed by Washington (which passed Philadelphia last year), Philadelphia, Miami, Atlanta and Boston. There was no change in the rankings of the top 22 major metropolitan areas. Portland dropped two notches, from 23rd to 25th largest, as both Orlando and San Antonio jumped ahead. Austin jumped 2 positions, passing both Cleveland and Columbus, becoming the 31st largest metropolitan area. Finally, Raleigh passed Louisville to become the 43rd largest metropolitan area. The table at the end of the article includes information on the 106 largest metropolitan areas.

    The population growth rates for both the major and second tier  metropolitan area leaders and trailers looks similar to the domestic migration rankings (Figures 5 and 6). Austin leads the majors and Cape Coral leads the large metropolitan areas. There are greater differences in the bottom ten, where some of the largest domestic migration losers (such as New York, Los Angeles and Chicago) attract strong international migration have been replaced by others that attract fewer, and tend to have lower population growth rates as a result.

    More Major Metropolitan Areas?

    Meanwhile, some metropolitan areas should soon pass the 1,000,000 mark. Honolulu has been at the top of the list for some time. If the annual growth rates from 2010 to 2013, 2014 or 2015 had been sustained, Honolulu would have reached a million by 2016. But, Honolulu’ growth rate has slowed substantially in each of the last years since 2012, culminating in a modest population loss in 2016, leaving Honolulu 7,000 short of a million. Current growth rates suggest that Tulsa and Fresno could get to a million before Honolulu.

    Reason For Concern

    While the domestic migration data has long since disproven any thesis of a general movement of people from the suburbs to the urban core, the escalation in core county domestic migration losses is cause for concern.

    The urban cores are far nicer places than they were before. But their recovery has been all too concentrated ; meanwhile the rings around trendy downtown residential areas continue, as before the micro-core renaissance, to suffer serious poverty levels and other social ills more intensely than elsewhere. We have been down a similar road before, and have never recovered from the serious costs.

    Note: Major metropolitan areas have more than 1,000,000 population. The domestic migration comparison between core and suburban counties is limited to 50 of the 53 metropolitan areas, because four have only one county (Las Vegas, San Diego and Tucson). The lowest geographical level at which domestic migration data is available is counties. The core counties are often so large that they include large suburban components. This makes for a more crude comparison than would be the case if more precise data were available.

    Metropolitan Areas Over 500,000:  Population Estimates: 2016
    Population (Millions) 2015-2016
    Rank Metropolitan Area 2010 2015 2016 Population Change Net Domestic Migration Rank: Domestic Migration
    1 New York, NY-NJ-PA     19.566    20.118    20.154 0.18% -0.99% 103
    2 Los Angeles, CA     12.829    13.269    13.310 0.31% -0.66% 95
    3 Chicago, IL-IN-WI       9.462      9.533      9.513 -0.21% -0.94% 101
    4 Dallas-Fort Worth, TX       6.426      7.090      7.233 2.02% 0.85% 25
    5 Houston, TX       5.920      6.647      6.772 1.88% 0.42% 38
    6 Washington, DC-VA-MD-WV       5.636      6.078      6.132 0.88% -0.51% 91
    7 Philadelphia, PA-NJ-DE-MD       5.966      6.062      6.071 0.14% -0.43% 84
    8 Miami, FL       5.566      6.002      6.066 1.08% -0.28% 72
    9 Atlanta, GA       5.287      5.699      5.790 1.59% 0.64% 30
    10 Boston, MA-NH       4.553      4.767      4.794 0.58% -0.35% 76
    11 San Francisco, CA       4.336      4.642      4.679 0.80% -0.26% 69
    12 Phoenix, AZ       4.193      4.568      4.662 2.05% 1.13% 20
    13 Riverside-San Bernardino, CA       4.225      4.475      4.528 1.17% 0.34% 43
    14 Detroit,  MI       4.296      4.298      4.298 0.00% -0.47% 86
    15 Seattle, WA       3.440      3.727      3.799 1.93% 0.83% 26
    16 Minneapolis-St. Paul, MN-WI       3.349      3.518      3.551 0.93% 0.01% 57
    17 San Diego, CA       3.095      3.290      3.318 0.84% -0.25% 68
    18 Tampa-St. Petersburg, FL       2.784      2.971      3.032 2.06% 1.57% 7
    19 Denver, CO       2.544      2.809      2.853 1.58% 0.72% 28
    20 St. Louis,, MO-IL       2.788      2.808      2.807 -0.05% -0.41% 83
    21 Baltimore, MD       2.711      2.794      2.799 0.18% -0.40% 81
    22 Charlotte, NC-SC       2.217      2.425      2.474 2.05% 1.31% 13
    23 Orlando, FL       2.134        2.38      2.441 2.48% 1.24% 15
    24 San Antonio, TX       2.143        2.38      2.430 2.01% 1.04% 21
    25 Portland, OR-WA       2.226      2.385      2.425 1.68% 1.01% 22
    26 Pittsburgh, PA       2.356      2.351      2.342 -0.38% -0.33% 73
    27 Sacramento, CA       2.149      2.268      2.296 1.27% 0.54% 34
    28 Cincinnati, OH-KY-IN       2.115      2.155      2.165 0.45% -0.06% 61
    29 Las Vegas, NV       1.951      2.109      2.156 2.20% 1.31% 12
    30 Kansas City, MO-KS       2.009      2.084      2.105 0.96% 0.32% 44
    31 Austin, TX       1.716      1.998      2.056 2.92% 1.67% 6
    32 Cleveland, OH       2.077      2.060      2.056 -0.21% -0.49% 89
    33 Columbus, OH       1.902      2.020      2.042 1.06% 0.22% 48
    34 Indianapolis. IN       1.888      1.987      2.004 0.89% 0.13% 51
    35 San Jose, CA       1.837      1.969      1.979 0.52% -1.06% 105
    36 Nashville, TN       1.671      1.829      1.865 1.99% 1.14% 19
    37 Virginia Beach-Norfolk, VA-NC       1.677      1.723      1.727 0.20% -0.55% 92
    38 Providence, RI-MA       1.601      1.613      1.615 0.13% -0.24% 66
    39 Milwaukee,WI       1.556      1.574      1.572 -0.12% -0.72% 98
    40 Jacksonville, FL       1.346      1.448      1.478 2.09% 1.36% 11
    41 Oklahoma City, OK       1.253      1.357      1.373 1.20% 0.40% 39
    42 Memphis, TN-MS-AR       1.325      1.342      1.343 0.07% -0.48% 88
    43 Raleigh, NC       1.130      1.271      1.303 2.48% 1.46% 10
    44 Louisville, KY-IN       1.236      1.278      1.283 0.46% -0.01% 58
    45 Richmond, VA       1.208      1.270      1.282 0.89% 0.26% 46
    46 New Orleans. LA       1.190      1.262      1.269 0.54% -0.07% 62
    47 Hartford, CT       1.212      1.210      1.207 -0.26% -0.80% 100
    48 Salt Lake City, UT       1.088      1.168      1.186 1.60% 0.32% 45
    49 Birmingham, AL       1.128      1.145      1.147 0.22% -0.05% 60
    50 Buffalo, NY       1.136      1.135      1.133 -0.24% -0.51% 90
    51 Rochester, NY       1.080      1.081      1.079 -0.22% -0.64% 94
    52 Grand Rapids, MI       0.989      1.038      1.047 0.84% 0.11% 53
    53 Tucson, AZ       0.980      1.008      1.016 0.79% 0.25% 47
    54 Honolulu, HI       0.953      0.993      0.993 -0.06% -1.08% 106
    55 Tulsa, OK       0.938      0.980      0.987 0.69% 0.17% 50
    56 Fresno, CA       0.930      0.972      0.980 0.80% -0.27% 71
    57 Bridgeport-Stamford, CT       0.917      0.945      0.944 -0.05% -1.04% 104
    58 Worcester, MA-CT       0.917      0.934      0.936 0.17% -0.39% 79
    59 Omaha, NE-IA       0.865      0.914      0.924 1.08% 0.12% 52
    60 Albuquerque, NM       0.887      0.905      0.910 0.52% 0.11% 54
    61 Greenville, SC       0.824      0.873      0.885 1.34% 0.88% 24
    62 Bakersfield, CA       0.840      0.879      0.885 0.60% -0.48% 87
    63 Albany, NY       0.871      0.881      0.882 0.12% -0.25% 67
    64 Knoxville, TN       0.838      0.861      0.869 0.86% 0.73% 27
    65 New Haven CT       0.862      0.859      0.857 -0.26% -0.79% 99
    66 McAllen, TX       0.775      0.839      0.850 1.25% -0.41% 82
    67 Oxnard, CA       0.823      0.848      0.850 0.24% -0.44% 85
    68 El Paso, TX       0.804      0.837      0.842 0.57% -0.69% 97
    69 Allentown, PA-NJ       0.821      0.833      0.836 0.31% -0.08% 63
    70 Baton Rouge, LA       0.803      0.830      0.835 0.65% 0.03% 56
    71 Columbia, SC       0.767      0.810      0.817 0.95% 0.48% 36
    72 Dayton, OH       0.799      0.800      0.801 0.11% -0.17% 65
    73 Sarasota, FL       0.702      0.768      0.788 2.66% 2.46% 2
    74 Charleston, SC       0.665      0.745      0.761 2.22% 1.54% 8
    75 Greensboro, NC       0.724      0.752      0.756 0.58% 0.17% 49
    76 Little Rock, AR       0.700      0.732      0.735 0.42% -0.10% 64
    77 Stockton, CA       0.685      0.723      0.734 1.41% 0.57% 32
    78 Cape Coral, FL       0.619      0.700      0.722 3.15% 2.54% 1
    79 Colorado Springs, CO       0.646      0.698      0.712 2.11% 1.16% 18
    80 Akron, OH       0.703      0.703      0.702 -0.16% -0.35% 75
    81 Boise, ID       0.617      0.676      0.691 2.32% 1.47% 9
    82 Lakeland, FL       0.602      0.649      0.666 2.58% 1.87% 5
    83 Winston-Salem, NC       0.641      0.658      0.662 0.64% 0.45% 37
    84 Syracuse, NY       0.663      0.660      0.657 -0.53% -0.99% 102
    85 Ogden, UT       0.597      0.642      0.654 1.88% 0.69% 29
    86 Madison, WI       0.605      0.641      0.649 1.30% 0.49% 35
    87 Wichita, KS       0.631      0.643      0.645 0.26% -0.35% 74
    88 Daytona Beach, FL       0.590      0.623      0.638 2.29% 2.24% 3
    89 Des Moines, IA       0.570      0.623      0.635 1.95% 0.95% 23
    90 Springfield, MA       0.622      0.630      0.630 0.02% -0.67% 96
    91 Toledo, OH       0.610      0.606      0.605 -0.06% -0.37% 77
    92 Provo, UT       0.527      0.585      0.603 3.07% 1.18% 17
    93 Augusta, GA-SC       0.565      0.590      0.595 0.83% 0.35% 42
    94 Jackson, MS       0.568      0.579      0.579 0.10% -0.37% 78
    95 Melbourne, FL       0.543      0.568      0.579 1.97% 1.91% 4
    96 Harrisburg, PA       0.549      0.565      0.568 0.52% -0.03% 59
    97 Durham, NC       0.507      0.551      0.560 1.51% 0.55% 33
    98 Spokane, WA       0.528      0.547      0.557 1.69% 1.23% 16
    99 Scranton, PA       0.564      0.558      0.555 -0.45% -0.40% 80
    100 Chattanooga, TN-GA       0.528      0.547      0.552 0.85% 0.64% 31
    101 Youngstown, OH-PA       0.566      0.549      0.545 -0.85% -0.59% 93
    102 Modesto, CA       0.514      0.535      0.542 1.15% 0.38% 40
    103 Lancaster, PA       0.519      0.536      0.539 0.40% -0.26% 70
    104 Portland, ME       0.514      0.527      0.530 0.54% 0.37% 41
    105 Fayetteville, AR-MO       0.463      0.513      0.525 2.26% 1.28% 14
    106 Santa Rosa, CA       0.484      0.501      0.503 0.32% 0.06% 55
    From: US Census Bureau Data

    Wendell Cox is principal of Demographia, an international public policy and demographics firm. He is a Senior Fellow of the Center for Opportunity Urbanism (US), Senior Fellow for Housing Affordability and Municipal Policy for the Frontier Centre for Public Policy (Canada), and a member of the Board of Advisors of the Center for Demographics and Policy at Chapman University (California). He is co-author of the "Demographia International Housing Affordability Survey" and author of "Demographia World Urban Areas" and "War on the Dream: How Anti-Sprawl Policy Threatens the Quality of Life." He was appointed to three terms on the Los Angeles County Transportation Commission, where he served with the leading city and county leadership as the only non-elected member. He served as a visiting professor at the Conservatoire National des Arts et Metiers, a national university in Paris.

    Photo: Coral Gables Florida (MSA), largest domestic migration and population gain of any metropolitan area over 500,000 population, 2015-2016 (by author)

  • Suburban and Urban Housing Cost Relationships

    Perhaps this is old hat to you, but this came across as a bit of an epiphany to me earlier today.

    I was listening to the local public radio station this morning and there was a segment about the Chicago regional housing market that was fairly interesting.  Real estate and personal finance expert Ilyce Glink talked about home buying in the Chicago regional market.  Like many other housing markets nationwide, Chicago took an incredible hit in 2008-09 via the Great Recession, and regionally, home prices have been slow to rise from the depths of the early parts of the 2010s.  There’s some greater optimism that prices might be up throughout the area, even as the potential for higher mortgage rates increases, too. 

    In describing the Chicago regional housing market, Glink described many things in our recent housing history that are familiar to a lot of people in metro Chicago, and in other metros as well — depressed prices, numerous foreclosures, and a razor-thin inventory.  But she also alluded to the pre-Great Recession pattern that defined the region’s housing market — the continued movement outward of new home construction at the edges of the region — and how that essentially stopped around 2009 and hasn’t resumed since. 

    That got me thinking.  YIMBYs, the “yes-in-my-backyard” group that’s been pushing for relaxed housing regulation so that more housing units are built in cities to address affordable housing, have been effective in using the obscene housing prices and rents of cities to justify new city housing construction, despite my repeated objections.  My contention has usually been that prices rose so steeply in the hottest city neighborhoods because the demand was so high.  There was a newfound preference for city living, especially among young professionals.  However, there simply wasn’t enough of Lincoln Park or Wicker Park for everyone that wanted in.  Furthermore, there are other neighborhoods, like South Shore, that have the same positive qualities (lakefront location, easy public transit, close to the Loop) that should make it appealing to those wanting to live in the city, but it was being bypassed.  My argument was that such neighborhoods might actually welcome investment.  The combination of these factors, I believed, led to the price and rent spikes in the hottest areas, and it could be resolved in part by city newcomers considering previously unconsidered parts of the city.

    Here’s the epiphany — what if the lack of housing supply, at the regional level, has less to do with the lack of housing production within cities, and more to do with the lack of housing production at the metro area’s margins?

    Just before and well after the last recession, I worked for a city at our region’s edge and it was a huge beneficiary of the pre-2007 housing free-for-all.  In fact, the city where I worked more than doubled its population between 1990 and 2010 on the strength of annexation and new housing construction, becoming one of the largest cities in Illinois.  In 2007, weaknesses in the housing market were becoming apparent; in 2008, the bottom fell out; in 2009 and 2010, people were wondering when the old normal would return, or if a new normal would set in.  I think it’s fair to say the latter, since nothing approaching the pre-2007 boom has returned to the metro edges. 

    This would require further study and analysis by someone far more qualified than me, but here’s what I’m thinking.  Maybe, in a strange way, early urban pioneering was dependent on housing growth at the margins.  It could be affordable for those who chose to live there because it was one part of a housing market conveyor belt: first step a trendy but safety-optional urban apartment, second step a safer and quieter apartment or condo, third step a house in the suburbs.  The lack of edge housing construction disrupts that model, especially if there’s a shift in housing preferences as well.

    In other words, what’s broken is not the ability of cities to accommodate new construction, but the edge-driven model we’ve had for the last 60-70 years. 

    Don’t get me wrong.  I don’t see a return to our suburban-sprawl frenzy as a way to reduce prices and rents in cities.  But maybe it pays to examine the entirety of a regional housing market before designating a culprit.

    Pete Saunders is a Detroit native who has worked as a public and private sector urban planner in the Chicago area for more than twenty years.  He is also the author of “The Corner Side Yard,” an urban planning blog that focuses on the redevelopment and revitalization of Rust Belt cities.

    An unfinished subdivision.  Source: joyyehle.com

  • Big Box Jesus

    One of my cousins recently attended an event at a suburban church and I tagged along. I’m amoral and omnivorous. I’ll go to any house of worship on the odd chance I might actually learn something useful – and I often do. And I meet a lot of really nice people along the way. But mostly I like to explore the landscapes other people inhabit. Church provides an intimate glimpse into what people are thinking and feeling in a particular location.

    I was immediately impressed with how much this church looked and functioned like a shopping mall. The size, shape, and general construction of the buildings and surrounding parking lots were indistinguishable from a large retail center. I spent more time than I probably should have trying to figure out which denomination it was. Catholic? Definitely not. Lutheran? Not exactly. Baptist? Meh. Mormon? Nope. It was a generic all inclusive Christian arrangement that celebrated the lack of any specific affiliation. Come and worship. We take all kinds. And enjoy the ample free parking and food court while you’re here. There was a well populated Christian school, a substantial auditorium, and all manner of programs and facilities. It was a highly successful suburban version of Big Box Jesus.

    The event my cousin was attending wasn’t strictly religious in nature. It was more of a collection of speakers who each preached a version of financial independence with a Christian slant. The majority of the attendees were suburban women like my cousin looking to start or improve an independent business venture.

    A borrower is a slave to his master. A thousand heads nodded. Always set aside 25% of everything you earn. The congregants listened intently. Start small and build up incrementally. There were biblical parables about prudence leading to abundance. Knowing smiles of agreement followed. There were some folksy stories about the misguided foolishness good people often stumble into. Laughs ensued from the audience. I liked these people.

    But then I looked out at the parking lot. How many people paid cash for their cars? I explored the subdivisions all around the church. How many people bought their suburban homes with cash? How many people are capable of setting aside even a sliver of savings on a regular basis ever. How many people bought their clothes and shoes and had their hair done with a credit card that got rolled over into a big ball of vague but gradually mounting debt? How many people are approaching middle age and still paying off student loan debt?

    I understand the dynamics of contemporary accounting. Carrying mortgage debt provides a substantial tax advantage. Using “other people’s money” at a low interest rate to invest in an asset that consistently rises in value is smart and frees up cash to be deployed in other more productive ways. Putting cash into savings is inefficient since it sits in a bank earning near zero interest these days. Stock values keep rising so investing in equities is a no brainer.

    You can’t go around wearing thrift store clothes and sporting a bowl haircut and expect to be taken seriously in a professional business setting. You don’t want to drive around in an old clunker and put your family at risk when you could have the latest safety and reliability features of a newer car bought on credit. If you can buy that car with a home equity loan and get the tax deduction, all the better. Everything about respectable modern life is predicated on people spending a certain amount of money in a very specific way that is nearly impossible to achieve on a cash basis. And that set of arrangements is in direct conflict with the traditional virtues of frugality, saving, and self reliance. Big Box Jesus takes Visa, Mastercard, and American Express.

    This particular suburb is still very much in the aggressive growth phase of development. Everything is shiny and new. Did the developers build this town on a cash basis? No. It’s built on an Everest of commercial debt. How many of the people at the church earn their living selling real estate, or cars, or brokering mortgages, or refinancing people’s obligations, or helping them manage their stock portfolios? How many people are critically dependent on other people buying their products or services on credit? One way or another… almost everyone.

    Is the city paying as it goes for infrastructure with funds set aside for maintaining and replacing all the pipes, pumps, and pavement when they wear out? Are pensions fully funded? Will this development pattern generate enough taxable value as it ages to support and maintain all the critical public infrastructure of schools, police, and fire protection? I’ve spent a lot of time exploring the municipal finances of towns all over the country for years. They’re all functionally insolvent beyond a certain not-too-distant point.

    What all these practices and institutions need – what they can’t function without – is constant growth based on ever more leverage and debt. This can’t go on forever. Sooner or later there’s going to have to be a day of reckoning when the whole house of cards comes down. If I were a religious man I’d start praying right about now. Instead, I actually do what the preachers say. Pay cash, live below your means, save for the future, and opt out of the situations that trap you in a dysfunctional living arrangement with no future.

    John Sanphillippo lives in San Francisco and blogs about urbanism, adaptation, and resilience at granolashotgun.com. He’s a member of the Congress for New Urbanism, films videos for faircompanies.com, and is a regular contributor to Strongtowns.org. He earns his living by buying, renovating, and renting undervalued properties in places that have good long term prospects. He is a graduate of Rutgers University.

    All photos by Johnny Sanphillippo

  • A New Age of Progressive Suburbanism?

    We are living in a global suburban age… While statistics demonstrate that the amount of the world population in metropolitan areas is rapidly increasing, rarely is it understood that the bulk of this growth occurs in the suburbanized peripheries of cities. Domestically, over 69% of all U.S. residents live in suburban areas; internationally, many other developed countries are predominately suburban, while many developing countries are rapidly suburbanizing as well.”

    That’s not some anti-urban crackpot statement (as some inner urban elites might think) but from the introduction to a biennial theme of the MIT Center for Advanced Urbanism (USA). They understand that suburban and regional centres are not irrelevant for the future economy but highly important.  MIT are a pretty credible lot – hardly likely to pursue fringe urban planning or economic theories.

    In Australia, however, that message is not getting through. From the Prime Minister, down, there is a sense of irrational exuberance that the jobs of the future will mostly be concentrated in our CBDs and inner cities. Urban planning which supports increased concentration of employment through generous infrastructure allocations to inner urban areas is the manifestation of this inner urban obsession.  And while CBDs and inner urban areas are lavished with costly projects designed mainly to benefit the minority of people who work there, suburban and regional centres – where the majority live, work and play – have been largely left to fend for themselves.

    This process started in the late 1990s and early 2000s, notions about the “creative class” — many of which are being re-examined by author Richard Florida in a new book —   was a cause celebre amongst planning and government circles. It was widely argued that to attract the creative class of worker (synonymous with high skills and the new economy) cities needed to invest heavily in the quality of life in their downtowns. This was a precursor to the inner urban hipster, and, when real estate prices, rose their successors, the rise of the inner-city latte set.

    This thinking fit in well with two other trendy theories, New Urbanism and ‘Smart Growth’ (which redefined suburban progress as urban sprawl). The collective wisdom moved from supporting a growing suburban realm to one that disparaged it: the burbs were for bogans, the home of sprawl, “McMansions” full of low wage earning, culturally deficient and poorly educated masses, eating fast food diets and slurping sugar drinks. Inner cities by contrast were for educated, cultured and knowledgeable people – who had little need for suburban spaces or suburban habits but greater need for inner city waterfront cycle ways, museums, theatres and quality restaurants run by notable chefs. And, of course, lots of baristas. 

    Urban planning shifted quickly to a highly-regulated approach which promoted much higher densities of inner urban housing (and limits on outward expansion) because, after all, the inner city is where everyone in the future will want to live, right? The promises of these regional planning policies bordered on messianic. Take this example from the “Draft Metropolitan Strategy for Sydney to 2031” from the early 2000s:

    “A home I can afford. Great transport connections. More jobs closer to where I live. Shorter commutes. The right type of home for my family. A park for the kids. Local schools, shops and hospitals. Liveable neighbourhoods.”

    And what have we got thus? Some of the worst housing affordability in the world. Worsening congestion. Longer commutes. Limited housing choice, much of it not ideal for raising families.

    The ongoing policy focus and infrastructure obsession with centralisation is utterly at odds with economic and community signals. New economy industries in technical, scientific or professional services, or health and social care, have little interest in centralisation. Digital technology has broken that tyranny of distance. Undeterred though, we continue to watch as political and industry leaders promote costly infrastructure projects that enhance and support further centralised employment and a concentration of amenity in inner urban cores enjoyed by a privileged, mostly childless minority.

    For the record, the proportion of metropolitan wide jobs in the inner cities of Melbourne, Sydney and Brisbane was 11%, 13% and 12% respectively at the last census.  The reality remains that in our metropolitan centres, most people both live and work outside inner city bubbles of privilege. 

    The penny is finally dropping in some minds. Former Victorian Planning Minister, Matthew Guy (now Opposition Leader) once extolled the virtues of high density inner urban development. Looks like he has had a Damascus moment, commenting in The Australian (March 1, 2017) that: “Victoria is becoming a great, heaving, unsustainable mess. The whole of Victoria is just becoming an offshoot of Melbourne.”

    The emphasis on centralisation of jobs, housing and supportive infrastructure makes little sense in a country with such large land masses and capacity for expansion. Not only that, but the economic winds – enabled by rapid expansion of disruptive technology – are blowing the other way. Suburban and regional centres, long disparaged by the cognoscenti should instead be looked on as part of the solution to economic expansion and development. Where once we promoted urban renewal, we now need to turn our minds to suburban and regional renewal. We need to identify the critical infrastructure constraints of suburban and regional business centres and remedy them to encourage accelerated development of employment opportunities across the board.

    In a bid to put some balance into the discussions about urban development and growth, a Suburban Alliance (www.suburbanalliance.com.au) has been formed in Australia – with the intention of supporting research projects into the nature and needs of the suburban economy, and to use these as a platform for well-informed policy advocacy. Wish us luck. The initial focus starts in Brisbane but if the idea finds support, we’d like to see this expand to cover all major urban and regional centres. 

    The more supporters we can muster the sooner this absurd preoccupation with all things inner city can begin to be balanced with a better understanding of the important role played by suburban and regional business centres and why these are part of the solution to enhanced economic opportunity.

    Ross Elliott has more than twenty years experience in property and public policy. His past roles have included stints in urban economics, national and state roles with the Property Council, and in destination marketing. He has written extensively on a range of public policy issues centering around urban issues, and continues to maintain his recreational interest in public policy through ongoing contributions such as this or via his monthly blog, The Pulse.

    Photo: Photograph by Gnangarra [CC BY 2.5 au], via Wikimedia Commons

  • The High Cost of a Home Is Turning American Millennials Into the New Serfs

    American greatness was long premised on the common assumption that each generation would do better than the previous one. That is being undermined for the emerging millennial generation.

    The problems facing millennials include an economy where job growth has been largely in service and part-time employment, producing lower incomes; the Census bureau estimates they earn, even with a full-time job, $2,000 less in real dollars than the same age group made in 1980. More millennials, notes a recent White House report, face far longer periods of unemployment and suffer low rates of labor participation. More than 20 percent of people 18 to 34 live in poverty, up from 14 percent in 1980.

    They are also saddled with ever more college debt, with around half of students borrowing for their education during the 2013-14 school year, up from around 30 percent in the mid-1990s. All this at a time when the returns on education seem to be dropping: A millennial with both a college degree and college debt, according to a recent analysis of Federal Reserve data, earns about the same as a boomer without a degree did at the same age.

    Downward mobility, for now at least, is increasingly rife. Stanford economist Raj Chatty finds that someone born in 1940 had a 92 percent chance of earning more than their parents; a boomer born in 1950 had a 79 percent chance of earning more than their parents. Those born in 1980, in contrast, have just a 46 percent chance.

    Since 2004, homeownership rates for people under 35 have dropped by 21 percent, easily outpacing the 15 percent fall among those 35 to 44; the boomers’ rate remained largely unchanged.

    In some markets, high rents and weak millennial incomes make it all but impossible to raise a down payment (PDF). According to Zillow, for workers between 22 and 34, rent costs now claim upward of 45 percent of income in Los Angeles, San Francisco, New York, and Miami, compared to less than 30 percent of income in metropolitan areas like Dallas-Fort Worth and Houston. The costs of purchasing a house are even more lopsided: In Los Angeles and the Bay Area, a monthly mortgage takes, on average, close to 40 percent of income, compared to 15 percent nationally.

    Like medieval serfs in pre-industrial Europe, America’s new generation, particularly in its alpha cities, seems increasingly destined to spend their lives paying off their overlords, and having little to show for it.

    Rather than strike out on their own, many millennials are simply failing to launch, with record numbers hunkering down in their parents’ homes. Since 2000, the numbers of people aged 18 to 34 living at home has shot up by over 5 million.

    One common meme, particularly in the mainstream media, has been that millennials don’t want to buy homes. The new generation, as Fast Company breathlessly reported, is part of “an evolution of consciousness.” Other suggest the young have embraced “the sharing economy,” so that owning a home is simply not to their taste. The well-named site Elite Daily asserts that the vast majority of millennials are headed to “frenetic metropolis” rather than becalmed suburbs.

    And it’s not just ideologues claiming millennials have evolved out of home ownership. Wall Street speculators like Blackstone are betting that the young are committed to some new “rentership society,” with that firm investing $10 billion to scoop up existing small homes to rent, and even building tracks of homes exclusively for rent.

    It’s not a lifestyle choice, but economics—high prices and low incomesthat are keeping millennials from buying homes. In survey after survey the clear majority of millennials—roughly 80 percent, including the vast majority of renters—express interest in acquiring a home of their own. Nor are they allergic, as many suggest, to the idea of raising a family, albeit often at a later age, long a major motivation for home ownership. Roughly 80 percent of millennials say they plan to get married, and most of them are planning to have children.

    Overall, more than 80 percent of millennials already live in suburbs and exurbs, and they are, if anything, moving away from the dense, expensive cities. Since 2010 millennial population trends rank New York, Chicago, Washington, and Portland in the bottom half of major metropolitan areas while the young head out to less expensive, highly suburbanized areas such as Orlando, Austin, and San Antonio.

    Age will accelerate this process. Economist Jed Kolko notes as people enter their thirties they tend to head out of core cities to suburban locations; roughly one in four people in their mid to late twenties lives in an urban location but by the time those people are in their early thirties, that number drops precipitously and continues dropping into their eighties. In fact, younger millennials, notes the website FiveThirtyEight, are moving to the ’burbs at at a faster clip than previous generations. What’s slowing that trend is economics. Many can’t afford to move or transition to a traditional adulthood.

    The millennial housing crisis is reshaping the geography of opportunity. Although millennial rates of homeownership have dropped nationwide, the most precipitous declines have been in such metropolitan areas as New York, Miami, San Francisco, Portland, Seattle, and Los Angeles. In all these areas, public policy has regulatory barriers in the way of suburban and exurban affordability. It is in these markets where such things as “tiny houses” and “micro-apartments”—not exactly a boon to people looking to start families—are being touted as solutions to housing shortages.

    Nowhere is this dynamic more evident than in California, where the state government has all but declared war on single-family homes by banning new peripheral development, driving up house prices throughout metropolitan areas. Regulatory fees typically add upward of $50,000, two-and-a-half times the national average; new demands for “zero emissions” homes promise to boost this by an additional $25,000.

    Due largely to such regulatory restraints, overall California housing construction over the past 10 years has been less than half of that it averaged from 195 to 1989, forcing prices up, particularly on single-family houses. The state ranks second to the last in middle-income housing affordability, trailing only Hawaii. It also accounts for 14 of the nation’s 25 least affordable metropolitan areas.

    Home ownership rates in California are among the nation’s lowest, with Los Angeles-Orange having the lowest rate of the nation’s 75 large metropolitan areas. For every two homebuyers who come to the state, five families leave, notes the research firm Core Logic.

    The irony is that the state’s progressive policies are contributing to a less mobile society and a potential demographic crisis. For one thing, fewer young people can form families—Los Angeles-Orange had one of the biggest drops in the child population of any of the 53 largest metros from 2010 to 2015.

    This also has a racial component, as homeownership rates African American and Latino households—which often lack access to family wealth—have dropped far more precipitously than those of non-Hispanic Whites or Asians. Hispanics, accounting for 42 percent of all California millennials, endure homeownership roughly half that seen in other parts of the country.

    This is not the planners’ happy future of density dwelling, transit-riding millennials but a present of overcrowding, the nation’s highest level of poverty and, inevitably, a continued drop in fertility in comparison to less regulated, and less costly, states such as Utah, Texas, and Tennessee that have been among those with the biggest surges in millennial migration.

    Once identified with youth, California’s urban areas are now experiencing a significant decline in both their millennial and Xer populations. By the 2030s, large swaths of the state—particularly along the coast—could become geriatric belts, with an affluent older boomer population served by a largely minority servant class. How feudal!

    Ownership of land has always  been a critical component of middle-class wealth and power. Those celebrating the retreat from homeownership among millennials are embracing the long-term decline of that middle class, two thirds of whose wealth is in their homes.

    The potential decline in ownership also represents a direct assault on future American prosperity. Jason Furman, who served as chairman of President Obama’s Council of Economic Advisors, calculated that a single-family home contributes 2.5 times as much to the national GDP as an apartment unit. Investment in residential properties has dropped to its lowest share of overall spending since World War II; by some estimates reviving that would be enough to return America to 4 percent growth.

    With so many millenials unable to afford homes, or even to see a path to future ownership, household formation has been far slower than in the recent past. Rather than a surge of middle-class buyers, we are seeing the rise of a largely property-less generation whose members will remain economically marginal into their thirties or forties. Indeed by 2030, according to a recent Deloitte study, millennials will account for barely 16 percent of the nation’s wealth while home-owning boomers, then entering their eighties and nineties, will still control a remarkable 45 percent of the nation’s wealth.

    If this continues, we may have to all but abandon the notion of the United States as a middle-class nation. Instead of having a new generation that strikes out on their own, we may be incubating a culture that focuses on such things as the latest iPhone, binge watching on Netflix, something they do far more than even their Xer counterparts.

    Progressives who embrace these developments are abandoning one of the central tenets of mainstream liberalism. In the past, many traditional liberals embraced the old American ideal of dispersed land ownership. “A nation of homeowners,” President Franklin D. Roosevelt believed, “of people who own a real share in their land, is unconquerable.” Homeownership is not only critical to the economy but provides a critical element of our already fraying civic society; homeowners not only tend to vote more than renters, but they also volunteer more and, as Habitat for Humanity suggests, provide a better environment for raising children.

    On the flip side, high housing prices tend to suppress birthrates. Many of the places with the highest house costs—from Hong Kong to New York, Los Angeles, Boston, and San Francisco—also have very low birthrates. The four U.S. areas ranked among the bottom 10 in birthrates among the 53 major metropolitan areas in 2015. Over time these can have a dampening impact on economic growth, as is clearly seen today in places like Japan and much of Europe, and increasingly here in the U.S.

    It’s time for millennials to demand politicians abandon the policies that have enriched the wealthy and stolen their future. That means removing barriers to lots of new housing in cities and, crucially, embracing Frank Lloyd Wright’s notion of Broadacre Cities, with expansive development along the periphery.

    These new suburbs, like the Levittowns of the past, could improve people’s lives, while using new technology and home-based work  to make them more environmentally sustainable. They could, as some suggest, develop the kind of urban amenities, notably town centers, that may be more important to millennials than earlier generations. One thing that hasn’t changed is the demand for affordable single-family homes and townhomes. But the supply is diminishing—those under $200,000 make up barely one out of five new homes.

    There are some reasons for hope. The soon-to-develop tsunami of redundant retail space will open up millions of square feet for new homes. A move to prefabricated homes, already common in Europe and Japan, could help reduce costs. Certainly there’s potential demand at the right price—ones that young people can reasonably aspire to and then build lives in.

    The alternative is to travel back to serfdom and a society sharply divided between a small owner class and many more permanent rent payers. By then, the American dream will be reduced to a nostalgic throwback in an increasingly feudalized country.

    This piece first appeared in The Daily Beast.

    Joel Kotkin is executive editor of NewGeography.com. He is the Roger Hobbs Distinguished Fellow in Urban Studies at Chapman University and executive director of the Houston-based Center for Opportunity Urbanism. His newest book, The Human City: Urbanism for the rest of us, was published in April by Agate. He is also author of The New Class ConflictThe City: A Global History, and The Next Hundred Million: America in 2050. He lives in Orange County, CA.

  • Caterpillar’s HQ Move to Chicago Shows America’s Double Divide

    Earlier today Caterpillar announced that it was moving its corporate headquarters from Peoria to Chicago. The move affects about 300 top-level executives. The company will retain a large presence in Peoria.

    This is in line with what I’ve written about before: the rise of the executive headquarters, where a company moves its executive suite (anywhere from 50-500 people) to a major city like Chicago while leaving the back office elsewhere.

    Chicago has benefitted from this more than any other city I know. In addition to many corporate HQ relocations from the suburbs, it lured ADM from downstate Decatur, ConAgra from Omaha, and even MillerCoors from Milwaukee.

    These are all food/agriculture or industrial concerns. That’s right in line with Chicago’s industrial heritage.

    I would assume there’s a real possibility every major agricultural or industrial company in the US interior that’s not already headquartered in a major city like Minneapolis may make a similar move to Chicago. I’m sure World Business Chicago already has its target list compiled and is making calls.

    This exposes two major divides in the American economy.

    The first is between cities positioned advantageously vs. disadvantageously. Chicago is the former (along with Boston, San Francisco, Dallas, etc). Peoria, along with most sub-million metro areas with an industrial heritage, is the latter. It’s simply difficult to keep higher end jobs in these cities. This robs of them of not just some high wage positions, but also significant talent firepower that could be invested in civic betterment.

    The second is between those who are prospering with high skills, and those who are not. Chicago has a serious murder problem that’s been making global headlines for two years. It also has a huge financial problem on its hands, especially in the school district.

    This doesn’t seem to be affecting business recruitment. CAT and others have not been scared off. This shows that, so far at least, Chicago and its successful segments can succeed even while the impoverished black and Latino areas of the city fail, and as many other industrial cities fall into decline.

    In other words, this is another example of the decoupling of success in America. Those who are succeeding in America no longer need the overall prosperity of the country in order to personally do well. They can become enriched as a small, albeit sizable, minority.

    Trump’s election was an intrusion into that success caused by those resentful from being left behind. The election of leftist mayors in the style of Bill de Blasio is another such reaction.  It’s very clear from what I see and hear in global cities that those who are succeeding wish those who are not would hurry up and die or just go away. They pretty much say it explicitly when it come to the white working class, and you can believe they are thinking it when it comes poor blacks.

    There are cumulatively a lot of angry people out there, who are not blind to what items like CAT’s relocation imply. This inequality is only a recipe for further political upheaval and unrest.

    Aaron M. Renn is a senior fellow at the Manhattan Institute, a contributing editor of City Journal, and an economic development columnist for Governing magazine. He focuses on ways to help America’s cities thrive in an ever more complex, competitive, globalized, and diverse twenty-first century. During Renn’s 15-year career in management and technology consulting, he was a partner at Accenture and held several technology strategy roles and directed multimillion-dollar global technology implementations. He has contributed to The Guardian, Forbes.com, and numerous other publications. Renn holds a B.S. from Indiana University, where he coauthored an early social-networking platform in 1991.

    Picture by Bidgee (Own work) [CC BY 3.0], via Wikimedia Commons

  • Are America’s Cities Doomed to Go Bankrupt?

    I’m a fan of Strong Towns and share their thesis that the biggest sustainability problem with much of suburbia is its financial sustainability.

    recent article there about Lafayette, Louisiana has been making the rounds. That city’s public works director made some estimates of infrastructure maintenance costs and which parts of the city turned a “profit” from taxes and which were losses. Here’s their profit and loss map.

    The obvious conclusion that we are supposed to draw is that dense, compact, traditional urban development is profitable and good, but low density sprawl is a money loser and bad.

    There’s some truth in this, but taking that simplistic view can give a misleading impression. For example, let’s consider why high density central business districts tend to have such density of development and high property values per acre (and thus taxes). It’s obvious that these districts derive a great part of their value from the overall scale of the community, i.e., sprawl.

    Let’s do a quick thought experiment. Lower Manhattan below 59th St. is certainly incredible valuable property. However, if the rest of the metro area were some how chopped away leaving only this super-valuable part, how much value would that land retain? In part, Manhattan is valuable because it’s the center of a vast megacity region where tremendous amounts of human capital that lives in dispersed communities can be concentrated in a small area for commercial purposes.

    This article says that only about five cities in America don’t suffer from a fatally flawed financial model. I seem to recall that elsewhere they said NYC and SF are the only two cities that can survive in the long run financially.

    But it wasn’t that long ago that NYC nearly went bankrupt and had to be rescued. A recent study just said that its structural finances are the second worst of any major city in the country, primarily because of its gigantic liability for retiree health care. NYC looks good now because its economy has been booming. Let’s see how it does it a major downturn, particularly without a strong fiscal hand like Bloomberg at the tiller.

    San Francisco is unaffordable to all but very high income residents. It’s a de facto gated community. It may well be that pricing everybody but the rich out is a viable strategy for financial sustainability, but that’s obviously a path foreclosed to most places, even if they wanted to try it.

    We also need to consider that there’s infrastructure we have maintained. By and large our telecommunications infrastructure and electricity infrastructure are in very good shape, for example.  For telecom especially we’ve made vast investments to not only maintain, but dramatically upgrade our infrastructure. How did we manage to pull that off if it’s financially impossible to maintain and upgrade infrastructure? What lessons could we learn from that?

    In short, I agree with the general Strong Towns thesis that we need to look at the long run “total cost of ownership” of sprawl. In many cases, the math just doesn’t add up and some cities are in an infrastructure hole so deep they’re unlikely ever to get out. But they are overstating their case here.

    Aaron M. Renn is a senior fellow at the Manhattan Institute, a contributing editor of City Journal, and an economic development columnist for Governing magazine. He focuses on ways to help America’s cities thrive in an ever more complex, competitive, globalized, and diverse twenty-first century. During Renn’s 15-year career in management and technology consulting, he was a partner at Accenture and held several technology strategy roles and directed multimillion-dollar global technology implementations. He has contributed to The Guardian, Forbes.com, and numerous other publications. Renn holds a B.S. from Indiana University, where he coauthored an early social-networking platform in 1991.

    Photo "Downtown Lafayette, Louisiana" by Patriarca12 (Own work) [CC BY 3.0], via Wikimedia Commons

  • Them that’s got shall have. Them that’s not shall lose.

    My family lived in this building when I was a kid in the 1970’s. This was the door to our old apartment. It’s in a nondescript part of the San Fernando Valley in Los Angeles. There are a million places just like this all over the Southland. These beige stucco boxes are the workhorses of semi-affordable market rate housing in California. The place hasn’t changed in forty years other than the on-going deferred maintenance.

    I walked around the block to see the buildings where my friends used to live and the shops where we bought groceries and such. I can’t say I felt nostalgia. These weren’t happy times. But I was aware of the fact that the people who live here now are the same as my family was then – basically good people who are scraping by with almost no money doing the best they can with what they have. These are the minimum wage workers who do all the invisible dirty work of the city. Real incomes for these folks haven’t changed since I was a kid. But the cost of everything important from owning a home to health care to a proper education has skyrocketed.

    I want to go back to my last post about the exclusive homes in the fringe suburbs. The people who can afford to live here do so in large part so they can distance themselves from the people in my old neighborhood. Fair enough. I completely understand. I don’t want to live in my old neighborhood again either.

    But there’s that lingering problem of public infrastructure vs. the tax base of various forms of development. The city has spent almost nothing on my old block for decades. Yet those sad buildings keep spinning off revenue year after year. And there are a lot of them. Collectively they generate enough excess cash that the authorities can siphon it off to fund other activities. When it comes time to allocate resources who do you think has the most likely chance of getting what they need? The people who live in my old apartment, or the folks who live in the $700,000 homes up on the hill?

    As a society we want to believe that the poor are draining the public coffers dry. We need to blame the lower end of the working class for whatever we don’t like about the country. We want it to be true that they are undeserving compared to the better people who begrudgingly support them from a distance. Welfare. Food stamps. Section 8. But the reality – if you look at the budget and the actual numbers – is that without the poor packed tightly in their crappy apartments all working for crumbs in underfunded sections of town there could be no exclusive enclaves.

    Billie Holiday said it best. Them that’s got shall have. Them that’s not shall lose.

    John Sanphillippo lives in San Francisco and blogs about urbanism, adaptation, and resilience at granolashotgun.com. He’s a member of the Congress for New Urbanism, films videos for faircompanies.com, and is a regular contributor to Strongtowns.org. He earns his living by buying, renovating, and renting undervalued properties in places that have good long term prospects. He is a graduate of Rutgers University.

    All photos by Johnny Sanphillippo

  • 2010-2013 Small Area Data Shows Strong Suburban & Exurban Growth

    The latest small area estimates from the Census Bureau indicate that suburban and exurban areas continue to receive the overwhelming share of growth in metropolitan areas around the country, with a single exception, New York. The new American Community Survey (Note 1) 5 year file provides an update of data at the ZCTA (zip code tabulation area), which are described below, as analyzed by the City Sector Model. The data was collected from 2011 through 2015, and can therefore be considered generally reflective of the middle year of the period, 2013.

    City Sector Model Analysis

    The City Sector Model classifies small areas into five categories based on population density, commuting mode and age of development (the criteria is described in Figure 7). There are two pre-World War II classifications, the Urban Core CBD (central business district) and the Urban Core Inner Ring. These areas are typified by substantial reliance on transit, walking and cycling for commuting and have higher population densities. There are also three post-World War II, classifications, the Early Suburbs, Later Suburbs and the Exurbs, both of which have lower population densities and substantial automobile orientation (Figure 1).

    The Overall Trends

    In contrast to the narrative that there has been a “return to the cities” (meaning the urban core, as opposed to cities in the functional sense or physical sense, which are metropolitan areas and urban areas respectively see Note 2 in a previous post), most new residents are located in the suburbs and exurbs. Between 2010 and 2013, The automobile oriented suburbs and exurbs captured 89.9 percent of the new population growth in 52 major metropolitan areas (over 1,000,000 population in 2013). By contrast, 10.1 percent of major metropolitan population growth was in the Urban Core. The Urban Core-CBD, (largely identified with the Central Business District), accounted for 0.8 percent of the growth, and the Urban Core: Ring, the neighborhoods surrounding the core, for the other 9.3 percent (Figure 2). Although the vast majority of growth is concentrated in the suburbs and exurbs, the urban core has reversed their long-term decline, after suffering a small loss in population between 2000 and 2010.

    Each of the five categories experienced population increases between 2010 and 2015 (Figure 3). However, only the Later Suburbs grew faster than its pre-existing share of the metropolitan population. The Later Suburbs had 26.9 percent of the population in 2010, yet added a much stronger 45.8 percent of the population increase from 2010 to 2013.

    The Earlier Suburbs grew faster than in the previous decade, but their 29.5 percent share of metropolitan growth was far less than their 41.5 percent population share in 2010. The Urban Core: CBD captured 0.8 percent of the growth, less than its prior 1.3 percent share, while the Urban Core: Inner Ring fell nearly one-third short of equaling its previous population share. The Exurbs, which were hit hard by the Great Recession, also fell short of gaining at the rate of their population  (Figure 4).

    New York and the Rest

     The New York metropolitan area, dominated the nation in urban core growth, with 73.2 percent of the population increase, leaving only 27.8 percent for the suburbs. Even this, however, is not likely an indication of a “return to the core city” because of apparent net domestic migration losses (Note 2) throughout the metropolitan area. In fact the city of New York was not attracting new domestic migrants at all, from the suburbs or elsewhere in the nation, with a net domestic migration loss of 400,000 between 2010 and 2015. All of the city of New York’s population gain was due to an excess of births over deaths and, as befits one of the world’s great global cities, international migration.

    New York’s domination of urban core growth was astounding in raw numbers, as well. More than one-half of all the urban core growth among the major metropolitan areas was in the New York metropolitan area. Washington was a distant second, with 11.2 percent of the urban core growth. Boston was close behind at 9.7 percent, followed by San Francisco-Oakland at 8.1 percent. The other two metropolitan areas with legacy core cities were substantially lower, with Philadelphia accounting for 4.1 percent and Chicago 3.7 percent. All of the 46 metropolitan areas without legacy core cities, accounted for only 10.6 percent of total urban core growth, one-fifth the growth in New York alone. As with so much, the story of high density urban cores in the United States is largely about New York (Figure 5).

    Nothing like New York’s domination of urban core growth over suburban and exurban growth occurred elsewhere, not even among the other five metropolitan areas with “legacy cities” (core cities). These are the metropolitan areas with the six largest central business district in the United States, and in which the core cities account for 55 percent of the national transit commuting destinations (despite having only six percent of the national employment).

    Boston, came the closest, with 39.9 percent of its growth in the urban core. There was one other metropolitan area with more than 30 percent of its growth in the urban core, Philadelphia at 36.2 percent. The Chicago urban core accounted for 29.7 percent of its growth, San Francisco for 24.5 percent and Washington for 20.8 percent. Each of these, with the exception of San Francisco, managed to have proportionally greater growth in its urban core than the population share already living there (Figure 6).

    The situation was much different in the 46 major metropolitan areas without legacy core cities. In these, nearly all population growth (98.6 percent) was in the suburbs and exurbs. This is slightly above the 94.5 percent of the population living there.

    Suburban Nation

    Using a different small area classification system, the Urban Land Institute (ULI) has reached similar conclusions on the distribution of metropolitan population and growth. Indicating that “America remains a largely suburban nation,” ULI indicates that 79 percent of the nation’s metropolitan population lives in the suburbs and that suburban areas accounted for 91 percent of metropolitan growth from 2000 to 2015. These trends are mirrored in large measure in Canada and Australia, according to work led by Professor David Gordon of Queens University in Kingston, Ontario.

    To be sure, the improvement in urban core fortunes is a very positive development. There is no question that urban cores are far nicer places than they were two decades ago and that their renewed growth makes the entire city, from the central business district to the sparsely populated exurbs, a better and more productive place. But the bulk of growth, and the preponderance of the population, remains firmly suburban.

    Note 1: The American Community Survey (ACS) uses sampling methods from which estimates are built, not actual counts like occur in the US Census every 10 years. The most reliable data is from the Census, which will be conducted next in 2020.

    Note 2: “Apparent” is used because domestic migration data is not reported below the county level (such as in ZCTA’s). However, much of the Urban Core is in the city of New York and all of the inner ring suburban counties lost domestic migrants, suggesting that net domestic migration gains could not have occurred.
    Wendell Cox is principal of Demographia, an international public policy and demographics firm. He is a Senior Fellow of the Center for Opportunity Urbanism (US), Senior Fellow for Housing Affordability and Municipal Policy for the Frontier Centre for Public Policy (Canada), and a member of the Board of Advisors of the Center for Demographics and Policy at Chapman University (California). He is co-author of the "Demographia International Housing Affordability Survey" and author of "Demographia World Urban Areas" and "War on the Dream: How Anti-Sprawl Policy Threatens the Quality of Life." He was appointed to three terms on the Los Angeles County Transportation Commission, where he served with the leading city and county leadership as the only non-elected member. He served as a visiting professor at the Conservatoire National des Arts et Metiers, a national university in Paris.

    Photo: NASA satellite view of New York’s urban core