Category: Suburbs

  • The Evolving Urban Form: Tokyo

    Tokyo is the ultimate in urbanization, being nearly one-half larger than any other urban area in the world. Further, Tokyo has retained its position as the largest urban area in the world for longer than any period since London’s approximately 100 year run from the early 1800s to the early 1900s. During the 1920s, New York became the largest, but was displaced by Tokyo in 1955.

    Tokyo became the world’s largest urban area by adding more than 20 million people between 1955 and 2000, adding more people than lived in any other urban area in the world during that period. Even with its now slow growth, Tokyo seems likely to remain number one for two decades or more. However, if the breakneck growth of urban areas like Jakarta, Delhi and Manila continues, Tokyo could relinquish its position by 2030, especially if Tokyo begins losing population, joining Japan in that country’s accelerating rate of population decline as is projected (below). 

    The Tokyo region is much more than Tokyo proper (the "ku-area"). It includes Yokohama, which with 3.7 million people is larger than any suburb in the world except for Howrah in the Calcutta area. Kawasaki, between Tokyo and Yokohama has a population of 1.4 million, while Saitama, to the north has 1.2 million. Chiba, on the way to Narita International Airport, is home to nearly 1,000,000. There are multiple possible definitions of the Tokyo region. This article defines the Tokyo metropolitan area as Chiba, Kanagawa, Saitama and Tokyo prefectures (Note 1).

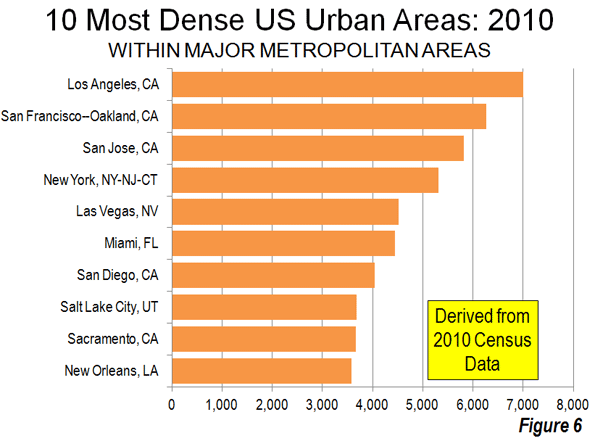
    Suburban Areas: Tokyo also has the largest suburban population of any metropolitan region in the world. Approximately 26.7 million, or 75 percent of the Tokyo region’s 35.4 million population lives in suburban areas. This is the largest expanse of suburbanization in the world. The suburban population increase since 1950 exceeds that of New York, Los Angeles, and Paris combined (Note 2).

    The Core

    Tokyo is unique in having abolished its core municipality. In 1943, the former city of Tokyo was combined with the prefecture of Tokyo. This area was also labeled the Tokyo "metropolis." (Note 3) The prefecture of Tokyo contained a number of additional municipalities, which were not impacted by the merger, while the former area of the city of Tokyo was directly administered by the prefecture. In the intervening decades, the former city has been reorganized into 23 wards (ku), which have obtained considerable self-government authority, emerging as the near equivalent of cities themselves.

    This "ku" area can be considered the historical core municipality. The 23 ku reached a peak population in 1965 of 8.893 million in 1965. In the next 30 years, the 23 ku sustained a population loss of more than 900,000, while the suburban areas were adding more than 20 million. The ku area exceeded its previous peak in the 2010 census, reaching 8.946 million, approximately 50,000 more than in 1965.

    Growth Trends:

    Census data indicates that in 1940, the core accounted for 53 percent of the region’s population. This dropped to 41 percent in 1950, with the largest share of war-time population losses in the ku area. The core gained back to 47 percent of the population in 1960. After that, nearly all growth was in the suburbs. Between 1950 and 2000, 87 percent of the population gain was in the suburbs. In the last decade, the suburbs share of growth dropped to 63 percent (Figure 1 and Table)

    Tokyo Metropolitan Region
    Population by Sector: 1920-2010
    Year Tokyo Region Former City of Tokyo Balance of Tokyo Prefecture Tokyo Prefecture Kanagawa Prefecture Saitama Prefecture Chiba Prefecture
    1920    7,678,000  2,173,000     1,526,000     3,699,000   1,323,000   1,320,000   1,336,000
    1930    9,958,000  1,995,000     3,414,000     5,409,000   1,620,000   1,459,000   1,470,000
    1940  12,740,000  6,779,000        576,000     7,355,000   2,189,000   1,608,000   1,588,000
    1950  13,051,000  5,385,000        893,000     6,278,000   2,488,000   2,146,000   2,139,000
    1955  15,424,000  6,969,000     1,068,000     8,037,000   2,919,000   2,263,000   2,205,000
    1960  17,864,000  8,310,000     1,374,000     9,684,000   3,443,000   2,431,000   2,306,000
    1965  21,017,000  8,893,000     1,976,000   10,869,000   4,431,000   3,015,000   2,702,000
    1970  24,113,000  8,787,000     2,621,000   11,408,000   5,472,000   3,866,000   3,367,000
    1975  27,042,000  8,647,000     3,027,000   11,674,000   6,398,000   4,821,000   4,149,000
    1980  28,697,000  8,349,000     3,269,000   11,618,000   6,924,000   5,420,000   4,735,000
    1985  30,273,000  8,354,000     3,475,000   11,829,000   7,432,000   5,864,000   5,148,000
    1990  31,796,000  8,164,000     3,692,000   11,856,000   7,980,000   6,405,000   5,555,000
    1995  32,577,000  7,968,000     3,806,000   11,774,000   8,246,000   6,759,000   5,798,000
    2000  33,413,000  8,130,408     3,928,592   12,059,000   8,490,000   6,938,000   5,926,000
    2005  34,472,000  8,490,000     4,081,000   12,571,000   8,791,000   7,054,000   6,056,000
    2010  35,618,000  8,946,000     4,213,000   13,159,000   9,048,000   7,195,000   6,216,000
    Data from Census of Japan


    Generally, however the last decade has been far better for the core than in any period since 1960. Over each of the last two five year census periods, the percentage growth in the core has been greater than that of the suburbs, which, examining data from Europe, United States, Canada, and elsewhere is quite unusual.

    Density Comparisons

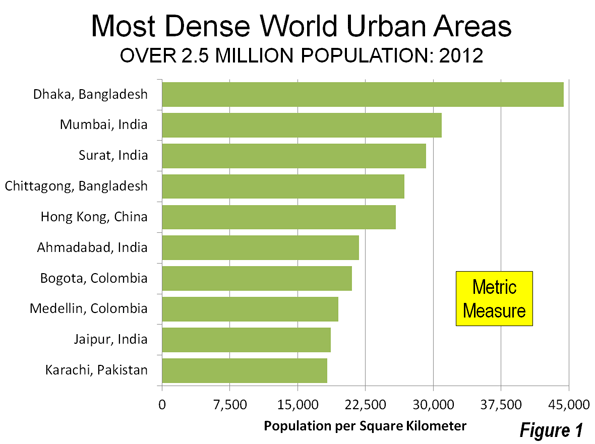
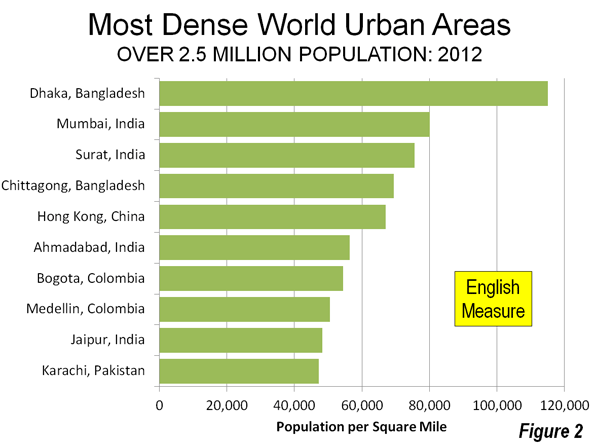
    Tokyo is often portrayed as one of the world’s highest density urban areas. It is not. At a density of 11,300 per square mile (4,300 per square kilometer), Tokyo is less dense than London (13,700 & 5,300), one-sixth the density of Hong Kong (67,000 & 25,900) and one-tenth the density of Dhaka (115,000 & 44,400). There are two reasons for this:

    1. Tokyo does not have intensely dense central areas. The ku area has a density of 37,300 per square kilometer (14,400 per square kilometer). This is well below the densities of Manhattan (69,000 & 27,000) and the ville de Paris (51,000 & 21,000). Only one of the ku (Toshima) exceeds the density of Paris.
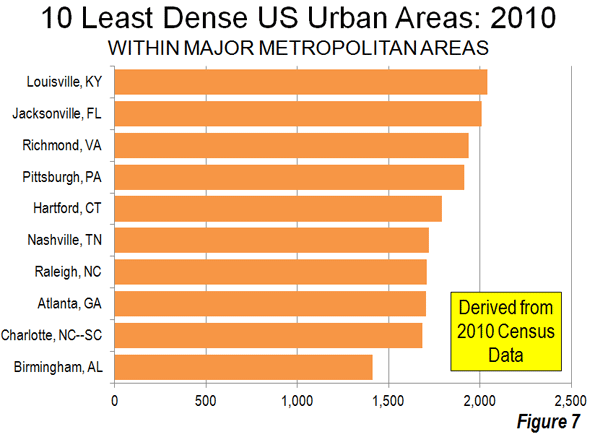
    2. Further, according to the Japan House and Land Survey of 2008, Tokyo has a large stock of detached houses, by definition lower density. Nearly 45 percent of the Tokyo region’s housing is detached. One-third of the dwellings within 30 kilometers (18 miles) of the core are detached. This figure rises to more than 60 percent outside 30 kilometers from the core and 85 percent between 60 and 70 kilometers (37-43 kilometers) from the core (Figure 2).

    Transport

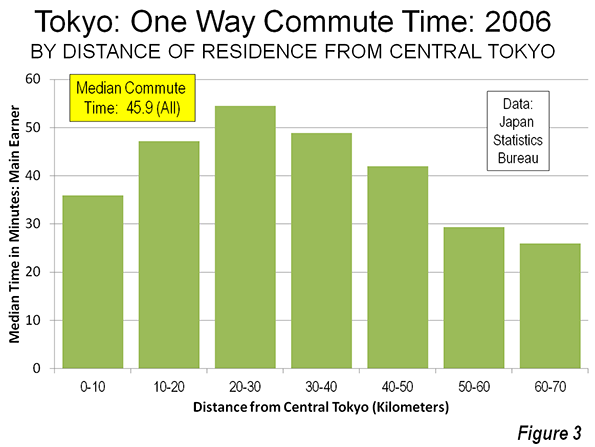
    Tokyo is a transit oriented metropolis, with by far the highest transit usage in the world. In 2007, 65 percent of trips within a 50 mile radius were by mass transit. Overall transit usage is (passenger miles or kilometers) in the Tokyo region is approximately double that of all combined usage in the United States and nearly 10 times that of Paris, according to the Millennium Cities Data base. At the same time, one-way work trip travel times are reported to be the highest in the high income world, at a median of 45.9 minutes (Note 4) for main earners. Work trip travel times from residences are the shortest from the most remote residential locations (60-70 kilometers from the core) at a median of 26 minutes and at 29 minutes from residences between 50 and 60 kilometers from the core. Median travel times are 36 minutes one way within 10 kilometers of the core (Figure 3). The longest commutes are from residences located between 10 and 50 kilometers from the core (6 to 31 miles), which peak at 54.5 minutes each way between 20 and 30 kilometers (12 and 18 kilometers) from the core.

    Toward a City State?

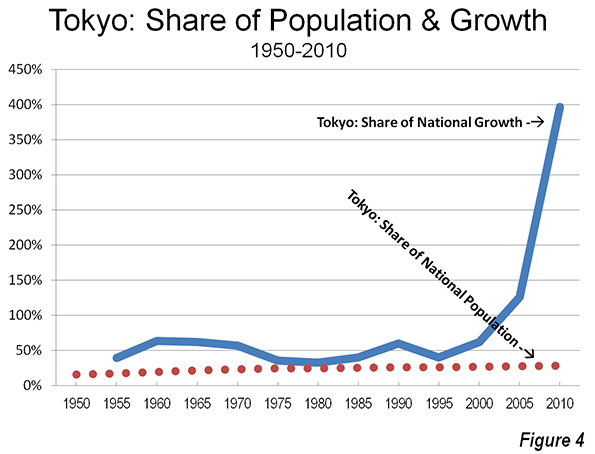
    Japan has been centralizing for decades, principally as rural citizens have moved to the largest metropolitan areas. Since 1950, Tokyo has routinely attracted much more than its proportionate share of population growth. In the last two census periods, all Japan’s growth has been in the Tokyo metropolitan area as national population growth has stagnated. Between 2000 and 2005, the Tokyo region added 1.1 million new residents, while the rest of the nation lost 200,000 residents. The imbalance became even starker between 2005 and 2010, as Tokyo added 1.1 million new residents, while the rest of the nation lost 900,000. (Figure 4)

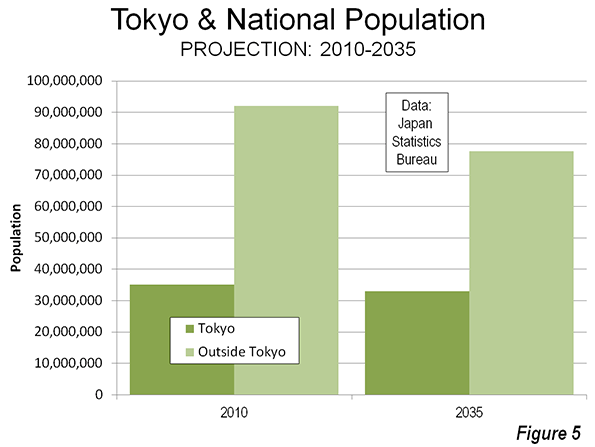
    Eventually, Japan’s imploding population will finally impact Tokyo. Population projections indicate that between 2010 and 2035, Tokyo will start losing population. But Tokyo’s loss, at 2.1 million, would be a small fraction of the 16.5 million loss projected for the rest of the nation (Figure 5). If that occurs, Tokyo will account for 30 percent of Japan’s population, compared to 16 percent in 1950. With Japan’s rock-bottom fertility rate, a declining Tokyo will dominate an even larger share of the country’s declining    population and economy in the coming decades.

    Wendell Cox is a Visiting Professor, Conservatoire National des Arts et Metiers, Paris and the author of “War on the Dream: How Anti-Sprawl Policy Threatens the Quality of Life.”

    Photo: Yamanote Loop Train, Tokyo Station (by author)

    Note 1: The government defines a Tokyo major metropolitan area, using smaller area data. However, insufficient data is readily available for this article.

    Note 2: These three urban areas have the largest suburban populations in the high income world outside Tokyo and Osaka-Kobe Kyoto.

    Note 3: The term "Tokyo metropolis," has misled any number of analysts to believe that it means the Tokyo metropolitan area. In fact, it means only the prefecture of Tokyo, which is only one of the from one of the from four to eight prefectures (part or all) that can be considered a part of the metropolitan area, depending on the definition. Thus any comparison of the "Tokyo metropolis" with anything else in metropolitan in the world is best dismissed out of hand.

    Note 4: Based on an analysis of the detailed data, it is estimated that the one-way average work trip travel time is more than 48 minutes.

  • Architecture Critic Paul Goldberger on Silicon Valley, San Jose, and Apple

    Last week Paul Goldberger, Pulitzer Prize winning architecture critic for the New Yorker and Vanity Fair, sat down with Allison Arief of the San Francisco Planning and Urban Research Association (SPUR) in downtown San Jose to discuss the state of 21st Century urbanism with a focus on Silicon Valley. Though admired the world over as the preeminent center for technological innovation, Silicon Valley has never been known for its great architecture. Goldberger suggested that this reputation could’ve improved had Apple not missed the mark with the design of their proposed Apple Campus 2 building in Cupertino.

    While acknowledging that Apple is probably the best design company at the moment, Goldberger asserted that the company’s design abilities end with small consumer gadgets and fail spectacularly at the urban level. Calling the Norman Foster designed building for the new Apple Campus a ‘beautifully designed donut or spaceship’, he lamented the lack of context and connection to anything around it. Speaking to an audience that included members of San Jose’s city government, Goldberger suggested that Apple missed the opportunity to take the reins to help transform San Jose by relocating at least some of its operations to help its long struggling (and subsidized) downtown.

    The reality is that most of the big tech companies in the Valley, not just Apple, have an extreme indifference to place-choosing to locate operations in suburban office parks. This has much to do with the history of Silicon Valley planning as it does with the nature of tech companies, which tend to employ legions of introverted computer engineering types and go to great lengths to remain insular and secretive (Apple taking this to the extreme). Perhaps it also makes perfect sense that rather than even acknowledging the true urban environment, companies whose primary business is creating the virtual world in which we increasingly experience public life take an active stance on turning their backs on the city.

    Yet for those still interested in experiencing the delights of pre-Information Era, pre-21 Century urbanism, there is always San Francisco not far up the road.  Goldberger made the point that the handful of tech companies who do choose to locate their operations in the city probably have a different mindset than those that stay in the Valley. Twitter being the prime example of the moment- the micro blogging site just leased 400,000 square feet of space on a long-maligned section of Market Street. Up in Seattle, Amazon recently announced its plan to build three new 37-story towers in the downtown area, which the proposal’s architect said is “not about building a corporate campus, it’s about building a neighborhood.”

    So even though not every tech company is averse to the city, the Richard Florida argument that high urban density is a prerequisite for innovation and creativity is a bit of a stretch, as the economic success of suburban Silicon Valley continually disproves. Near the end of the discussion, Goldberger suggested that deliberately designing space for innovation might be a bit too self-conscious. This implies that rather than design, factors such as human resources, access to capital and a culture with openness to trial-and-error matter more than the traditional urban hardware of cities.

    Adam Nathaniel Mayer is an American architectural design professional currently based in China and California. In addition to his job designing buildings he writes the China Urban Development Blog. Follow him on Twitter: @AdamNMayer.

  • Midcentury Modern

    Midcentury modern tours now are taking place in cities all over the country. Renewed interest in this era capitalizes on the millennials’ interest in design from a time that seems almost impossibly optimistic compared to today’s zeitgeist. Most cities around the country boast a healthy building stock from this postwar period, nicknamed “the suburbs,” although these are ritually condemned – and designated for annihilation – by academics, urban land speculators and the urban clerisy.

    Yet the new interest in the mid-century modern form reflects its basic and enduring appeal. As the curious and the trendy take bus tours of these inner-ring neighborhoods, the forms of this era evoke a sense of great confidence and faith in the future, both of which seem to be lost in the obsession with neo-traditional forms that hearken to the pre-car era or to the cartoonlike, sculpture-as-architecture one sees in many urban centers.

    Suburban expansion after World War II reached out beyond the streetcar systems that created the traditional neighborhoods of the late 19thand early 20th Century. The returning GIs wanted something simple and affordable to begin their lives after serving their country. Confidence surged in America’s know-how and ability to solve even the deepest social problems. The triumph of science and technology was a palpable presence. The dark side, of course, was the atomic threat, restraining our enthusiasm but only a little.

    In this midcentury era, planning and design began to be car-based. Residences were designed to show off the car, putting it out front for display – and some home plans even had tailfinned beauties in the living room


    Living Garage, photo from Populuxe by Thomas Hine

    Consumer goods were no longer accessed on foot; a new form of luxury consisted of driving up to the front door of a shop with parking in front. Front-loading houses and stores became unquestionably more efficient as a means to accommodate the new American lifestyle.

    Yet despite the auto-orientation, the architecture of this era retained the pedestrian scale and intimate feel that marked Main Street before World War 2. This both/and aesthetic marks the form of the 1940s and 1950s, with streamlined design styles like Art Deco Revival and materials like glass and stainless steel. Gentle angles suggested motion, and the theme of mobility was everywhere in the architecture.  Wider streets and lower, longer horizontal lines accommodated this theme and even today the architecture reinforces a feel of motion when driving past these structures.

    Modernism also formed a certain ethic. To be modern was more than a lifestyle choice; it was an acceptance of science, knowledge, and technology, free from preconceptions.  At the time, modernism elevated architecture above the style debate, and was considered even a shedding of styles. The politics of the time was similarly marked by Truman’s “straight talk”, and there was a shedding of rhetoric and posturing that lasted up until Joe McCarthy began once again a divide-and-conquer campaign against people.

    Translated to the suburbs, modernism meant practical homes, without the adornment that marked Victorian architecture. Instead, modernist residences were marked by deep horizontals and large picture windows, providing a sense of openness that was a hallmark of modernist thought. Floor plans also were open, allowing free movement through space, rather than cutting the house up into cluttered little parlors, dining rooms, or nooks. 

    Today, midcentury modern design is fetishized for mass consumption in magazines like Dwell that emphasize acquisitiveness over ethics. But back then, the design meant something else, something cleaner and more powerful. In the 1950s, modernism meant consumption, but even more, the modernism defined the quest for the inner self and a new, forward looking outlook.

    By reducing modernism to a sofa style or wallpaper pattern, we risk losing all that this era stood for.  Buildings from the 1950s have sustained themselves through multiple recessions, the rise of the internet, cultural acceleration, massive city growth, and globalism. So perhaps they point towards a real definition of sustainability by having good bones and adapting through all these changes.

    The current millennial generation seeks a practical domestic situation, much like returning GIs. Most would prefer to reduce car-trips, but are realistic about this goal, given the range of their travel. Most in this generation see right through car-free living claims; more than one of my students, when discussing walkability, stated that “I’m not gonna lug my groceries even a block in this heat.” The battle with the car is chiefly about making the car more efficient, and less ubiquitous through the use of telecommuting and on-line shopping. It is not about removing it from the scene entirely.

    So as McMansions have swollen to represent a kind of architectural obesity, they have made many midcentury neighborhoods unfashionable, for typically these older homes have one parking space, often in a carport, not a true garage. They also are front-loaded, a much more efficient planning concept than alleys, but then the car becomes part of the front façade. Millennials have a hard time understanding what’s wrong with that. Again, as one 28-year-old student put it to me, “It’s just a house, after all…what’s the big deal?”

    Developers seeking first-time homebuyers, however, respond to the regulatory climate, which favors solutions like garages on alleys, big homes on tight lots, and neotraditional styling.  Bonus density and other zoning incentives rig the game in favor of this highly regulated development pattern, even in the exurbs.  Here in Central Florida, the development zone nicknamed Horizon West has been codified to enforce these form-based principles, with stiff permitting fees and a highly participatory government staff to keep things on the straight-and-narrow.

    Keeping prices low with all this overburden requires developers to cut the cost of the home drastically, likely reducing lifespan of components and systems. Ironically, the house meeting these tortured standards of today is less sustainable than the house built in 1953, with better bones and an adaptable floor plan.

    Meanwhile, these 1950s neighborhoods are under attack for their very form. Cities, persuaded by planners to heal the effects of the car, cannot do so in a granular manner, so ordinances are passed  forbidding front-facing garages, or garages set back arbitrarily from the house front. These 1950s homes, with their carports, couldn’t be built today, and so are reduced to the status of heritage sites from a bygone era. In Winter Park, garages are banished to the rear on new homes, and if you are adding a garage to your midcentury home, it must be arbitrarily set back at least four feet from your front wall whether or not your lot can accommodate this arbitrary, and seemingly pointless, ordinance.

    Of course mid modern tours allow people to rediscover the essence of the 1950s, and these overlooked neighborhoods could be the springboard for a new era in modern planning.  Front-loaded neighborhoods can be successful when the architecture is designed at a human scale, and fine-grained integration of residential and commercial uses point to a future of home-office, cottage-industry, people-based industry once again.

    The Victorian era ended rather abruptly in the 1890s with a series of economic catastrophes that changed America’s middle class. Architecture switched to a more streamlined, Edwardian style – simple, flexible, and utilitarian forms that quickly gave rise to modernist design.  This current economic transition may well bode a similar outcome – design styles, often labeled “contemporary,” reduce the amount of architectural gingerbread and fussiness, reducing cost and maintenance, and may be favored by the coming generation for its cleanliness and utility.

    A new era that manages the car at a human scale, forgives people for wanting mobility and efficiency, and allows for contemporary exploration of style and design can and should inform new neighborhood planning. Midcentury suburbs, rediscovered by popular interest, can point the way to a middle ground between mcmansion-style subdivisions and neotraditional fussiness, and maybe even help us rediscover our confidence and faith once again.

    This essay is a summary of Richard Reep’s talk “Populuxe and the Atomic Bungalow” given at the 3rd annual Colloquium on Historic Preservation, hosted by Friends of Casa Feliz, Winter Park, Florida in April 2012.  Richard and his wife, Kim Mathis, hosted a midcentury modern tour in their own 1950s home for the colloquium.

  • CNU20: New Urbanism’s Young Adult Angst

    Possibly the most earnest folks in the real estate development industry assembled for the 20th anniversary of the founding of the Congress of the New Urbanism in West Palm Beach, Florida this month. Among the excellent accomplishments of CNU20 attendees: a credible car/pedestrian strategy, some fine looking new communities, and perhaps best of all, a body of hard-won knowledge about town-making for citizen education.

    Officially, CNU20 was optimistic and confident, but an undercurrent of negativism marred the event. More than one New Urbanist questioned the validity of what by now should have been a transformative movement. But the imposition of form-based codes and regulations on city growth has become a stress point in the movement’s evolution.

    Three hundred communities now boast New Urbanist town planning, over a dozen communities have adopted form-based zoning, and urban design schools are teaching the New Urban principles all over the country, facts triumphed during the opening plenary session. Form-based zoning uses a hierarchy of increasingly dense districts with defined boundaries, rather than land-use (or Euclidian) zoning to regulate growth. These principles are exquisitely defined in a model code nicknamed the Smart Code, which defines street width and sidewalk width, and provides fine-grained guidance on the form of a building on a given lot. Participants in early work sessions were taught how to work the code, and walked the hot, humid streets of West Palm Beach to interpret its many nuances and subtleties.

    In 2003, Downtown West Palm Beach was redeveloped, and it should be a proud example of the earliest New Urban efforts. Instead, conference participants spoke of the result with open distaste. The main outdoor plaza features a noisy fountain, which a group of attorneys, architects, and land planners belittled as “a mini Bellagio”; a pale imitation of the huge Las Vegas hotel’s water feature. Andrés Duany, one of the founders of the CNU, stated during the conference that “much of the architecture of the downtown zone was junk.” The movement’s most flamboyant spokesman, James Howard Kunstler, cited the “cartoonish, low quality finish of the buildings” as a failure. The distance New Urbanists have put between themselves and one of their finest achievements is dismaying.

    When not complaining about West Palm Beach, many practitioners wandered the somewhat sparse exhibit hall of booths sponsored by municipalities, attorneys, and consultants. Conversations often hit notes of personal suffering. Few new communities of any scale are being funded, so just as the supply of highly trained New Urbanists has hit the market, demand has dwindled to a trickle of infill projects here and there. Morale at the ground level was quite low, given the effort New Urbanists have put forth.

    Pedestrian-based urban form is a science that New Urbanists can offer to every community, and it has been a win for them where it has been implemented. Our monocultural vehicular transport model of car-dominated cities has made people work hard to carve out social space. The New Urbanist critique of the aesthetics of transportation is right on target. Armed with plenty of real data about how pedestrian environments work, New Urbanists have succeeded at softening the city and allowing pedestrians to compete.

    New Urbanists can also point to successes in the real estate market. In one study session, three single-family residential New Urbanist communities were analyzed, and the developer’s financial models were revealed. Each of the three communities fared better than their competitive set through the 2008-2012 cycle, in terms of net present value, appraisals, and foreclosure rate. New Urbanists claimed credit for this, although the affluent demographics and in-town locations tilted the plate in their favor. Still, New Urbanists have created a strong model that works for a segment of the population.

    Perhaps New Urbanism’s most potent contributions are to the art and science of traditional town planning. A solid body of knowledge that is based upon beautiful real places— Charleston, South Carolina and Savannah, Georgia, to name just two — now informs much of the theory behind place-making. We Americans are notably unsentimental about our cities, tearing down landmarks and whole districts in the quest for efficiency and betterment. New Urbanists have made it fashionable once again to care about history and good design, and our cities are the better for it.

    The CNU’s 20th anniversary marks a curious point in the life of this laudable and lasting movement. Because there isn’t any new development occurring, government effortshave turned towards adding form-based code overlays to existing cities. Already, Miami and Philadelphia have passed these codes to regulate growth. Many other cities like Orlando operate a standard zoning code by ordinance, while enforcing a form-based code as well. Property owners, developers, and design teams must now satisfy the intricacies of two local codes, rather than one, to get a building permit.

    While de-regulation is a term on everyone’s lips, this quiet up-tick in regulation has occurred largely under the radar screen. Those pushing for form-based code are largely consultants, who argue that the code will make for a better city by protecting us from ourselves. Municipal officials are amenable to, it, too.Both groups see the job security it promises them. Developers see profit if their communities can boast adherence to a strict code that promises a better lifestyle.

    Developers would normally scream loudly at any new regulation, no matter how trivial, but they are passively allowing form-based code because of the effect it can have on their bottom lines.
    If these codes tend to increase cost, well, the financial investors don’t complain, because the more money that’s borrowed to complete these structures, the more interest income they earn. So — form-based codes benefit all the interest groups that advocate their implementation.

    At CNU20 we witnessed the coming of age of a new regulatory regime. Place-making, once an activity trusted to individual citizens, has become codified; a vision enforced by authorities and interpreted by high priests who have special training to understand how to make a proper city. Maybe we have so abused our power as individuals that we deserve to have this power taken away. Perhaps our city form is so ugly, and so dysfunctional, that we cannot rescue it without serious intervention.

    Or, perhaps not. The American Dream is not about freedom from sprawl, as suggested in the movement’s seminal manifesto, “Suburban Nation”. Rather, it’s about freedom to choose. New Urbanists might be able to provide this freedom within the confines of a new institution, the Smart Code, as long as the Smart Code produced good results. But if the critique at CNU20 of their own Downtown West Palm Beach is any indication, the Smart Code ain’t so smart after all.

    American town planning needs less regulation, not more. Let’s use CNU’s body of knowledge to educate citizens and provide a path forward, not with the manacles of a new code, but with the freedom to create a new urban form that suits the lifestyles of the 21st century.

    Flickr photo by Eric Alix Rogers, New Urban, in Six Corners, Chicago. New houses, all facing a common sidewalk, with garages on alleys behind. Off of Kilbourn, just south of Irving Park.

    Richard Reep is an architect and artist who lives in Winter Park, Florida. His practice has centered around hospitality-driven mixed use, and he has contributed in various capacities to urban mixed-use projects, both nationally and internationally, for the last 25 years.

  • Toward More Competitive Canadian Metropolitan Areas

    The Federation of Canadian Municipalities (FCN) and the Canadian Urban Transit Association (CUTA) have expressed serious concern about generally longer commute trip times making Canadian metropolitan areas less competitive. Each has called for additional funding for transit at the federal level to help reduce commute times and improve metropolitan competitiveness.

    The Right Concern

    The concern over commute times is well placed. Economic research generally concludes that greater economic and employment growth is likely where people can quickly reach their jobs in the metropolitan area. Five of the nation’s six major metropolitan areas (Toronto, Montréal, Vancouver, Ottawa-Gatineau and Calgary) have average one-way work trip travel times that are among the highest in their size classes among 109 metropolitan areas in the more developed world for which data is available. Only Edmonton has an average commute time that is among the shortest (Table 1).

    Table 1
    Average One-way Commute Times: Major Metropolitan Areas
    Compared with International Major Metropolitan Areas
    Major Metropolitan Area One-way Commute Time (Minutes) Overall One-way Commute: Rank out of 109 One-way Commute: Rank in Population Class
    Population Size Class
    Toronto 33 97th  Over 5,000,000 11th out of 19
    Montréal 31 90th  2,500,000 – 5,000,000 19th out of 23
    Vancouver 30 86th  1,000,000 – 2,500,000 60th out of 67
    Ottawa-Gatineau 27 60th  1,000,000 – 2,500,000 55th out of 67
    Calgary 26 58th  1,000,000 – 2,500,000 50th out of 67
    Edmonton 23 15th  1,000,000 – 2,500,000 15th out of 67


    The Wrong Answer

    Yet the solution – more transit and funding for transit – misses the mark. Transit does many things well, but it does not reduce commute times (Figure 1). According to Statistics Canada, average commute times by transit in the Toronto, Montréal and Vancouver metropolitan areas are from 30 per cent longer to nearly double those of average automobile commuters (Note 2). Some 58 percent of car users (drivers and passengers) reach their work locations in under 30 minutes, something accomplished by merely y 25 percent of transit commuters. Overall Toronto commute times are longer than either Los Angeles – famed for its traffic – as well as much less dense, and far less transit dependent, Dallas-Fort Worth. In Toronto, 21 percent of commuters take transit, compared to two percent in Dallas-Fort Worth. Among Montréal commuters, 20 percent use transit and spend more time commuting than their counterparts in more decentralized Phoenix, where less than two percent take transit. Commute times in transit-focused Vancouver are worse than much larger Los Angeles and indeed longer than nearly American metropolitan area, including Dallas-Fort Worth, Houston, and Philadelphia (Table 2).

    Given this pattern, transferring car travel to transit likely would increase commute times and make metropolitan areas even less competitive.

    Table 2
    30- and 40-minute Commute Shares:
    Representative Metropolitan Areas
    Population Classification Work Trip Under 30 Minutes Work Trip 30 to 44 Minutes Work Trip Under 45 Minutes
    5,000,000 and Over      
    Dallas-Fort Worth 59% 24% 83%
    Los Angeles 55% 24% 79%
    Toronto 48% 25% 73%
    Paris 45% 22% 67%
    2,500,000 – 5,000,000      
    Phoenix 57% 26% 83%
    Montréal 47% 27% 74%
    1,000,000 – 2,500,000       
    Edmonton 68% 20% 88%
    Indianapolis 66% 22% 88%
    Ottawa-Gatineau 65% 21% 86%
    Tampa-St. Petersburg 62% 22% 84%
    Calgary 54% 29% 83%
    Vancouver 55% 21% 76%
    Source: Statistics Canada, U.S. American Community Survey, National Institute of Statistics and Economic Studies (France)


    The Geography of Transit

    Rational Transit and Downtown:Transit’s greatest strength is in providing access to the largest downtown areas. These areas have the greatest job densities (jobs per square kilometre) in their metropolitan areas and are typically well served by frequent, rapid and convenient transit service from throughout the metropolitan area. This combination of high employment density and superior transit service attracts one-half or more of all downtown commuters in Canada’s major metropolitan areas to transit (Figure 2). Transit is meets the needs of people who commute to downtown and is the rational choice for many, if not most. However, downtowns contain only a relatively small share (14 per cent) of metropolitan area jobs (Figure 3).

    Rational Personal Mobility Elsewhere: Areas outside downtown lack any such intense concentration of jobs. The area outside downtown, accounting for 6 out of every 7 jobs (Figure 4), maintain much lower employment densities and generally lacks transit service. This is illustrated by the nation’s largest employment center, which surrounds Pearson International Airport in Toronto. Its more than 350,000 employees are spread around an area the size of city of Vancouver (or the city of San Francisco) at a density so low that quick and efficient transit is simply impossible.

    For the overwhelming share of work trips to outside the downtown area, the car does the job and transit accounts for less than 10 percent of commuters. Thus, the automobile is the rational choice for most people who commute to locations outside downtown. And things are not getting better for transit. According to Statistics Canada, employment has been growing much faster outside of downtown than in the high density core areas suited for transit. The 2011 census indicated a continuing dispersion of population as well.


    Transit’s Robust Funding Growth and Declining Productivity

    Strongly Rising Transit Subsidies: Transit subsidies have been growing strongly. According to Transport Canada data, from 1999 to 2008 subsidies grew 83 percent (adjusted for inflation), which is more than three times the 26 percent ridership growth rate and 3.5 times the rate of general inflation. Transit’s declining productivity could indicate a substantial potential for improved cost effectiveness and service expansion within the generous present funding levels.

    Declining Transit Productivity: At the same time, there are concerns about transit productivity. The Conference Board of Canada has documented a 1.2 percent annual decline in productivity for two decades. The same analysis found productivity in other transport sectors to be generally improving. Transit costs have risen well in excess of inflation, service levels and ridership. Rising costs seriously limit transit’s ability to increase its share of travel in metropolitan areas and limits the important role that it is called upon to play in providing door-to-door mobility for the transportation-impaired, such as disabled citizens, the elderly, and students.

    Land Use Strategies that Retard Metropolitan Competitiveness

    Policies that Could Make Metropolitan Areas Less Competitive: While the prospects for improving transit commute times are discouraging, some current land use strategies further increase traffic congestion and lengthen commute times and make metropolitan areas and make metropolitan areas less competitive . Compact cities (also called smart growth) policies have been adopted across Canada in an effort to reduce automobile use and increase urban densities. The planning expectation is that housing should be placed near rail stations. Yet job locations throughout metropolitan areas remain highly dispersed, and with the rise of working at home, are becoming more so. The potential for transit systems (or walking or cycling) to materially impact commuting is very limited in the least.

    International data indicate that higher densities are associated with greater traffic congestion. Further, higher traffic densities are strongly associated with higher levels of air pollution. Improvements in vehicle technology will make reductions in automobile use to reduce greenhouse gas emissions unnecessary, according to U.S. research by McKinsey & Company. Finally, smart growth type policies have been found to retard metropolitan economic growth in the Netherlands, the United Kingdom and the United States (Note 2).

    Improving Metropolitan Competitiveness

    Strategies that reduce commute times can improve metropolitan competitiveness. Expanded telecommuting reduces average commute times by its very nature (though the reported commute times routinely exclude the working at home sector, both in Canada and the US). There are also lessons to be learned from Edmonton and the international metropolitan areas that have been more successful in maintaining shorter commutes: more dispersed employment, lower population densities and a larger share of travel by car (Table 3).

    Table 3
    Comparison of Canadian and U.S. Major Metropolitan Areas
    Average One-way Commute Times and Urban Area Densities
     
    CANADA Canada Metropolitan Areas United States: Metropolitan Area Size Classes
    Commute Time Principal Population Centre Density (per KM2) Average Commute Time Average Principal Population Centre Density (per KM2)
    5,000,000 and Over        
    Toronto 33 2,900 28 1,400
    2,500,000 – 5,000,000        
    Montréal 31 2,200 26 1,200
    1,000,000 – 2,500,00        
    Vancouver 30 1,900 23 1,100
    Ottawa-Gatineau 27 1,900
    Calgary 26 1,600
    Edmonton 23 1,100
    Principal Population Centre: Largest population centre (Statistics Canada term for urban area) in the metropolitan area.


    Focusing on Objectives: To become more competitive, Canada’s metropolitan areas need to improve their average commute times. This requires focusing on strategies that have the highest potential to reduce traffic congestion.

    Residents and businesses in metropolitan areas would be best served by goal-oriented and objective policies squarely directed toward getting people to work faster. The focus should be on what makes commutes shorter, regardless of transport mode, rather than on idealistic notions of how a city should look or how people should travel.

    Wendell Cox is a Visiting Professor, Conservatoire National des Arts et Metiers, Paris and the author of “War on the Dream: How Anti-Sprawl Policy Threatens the Quality of Life”.

    –––

    Note: This article is based upon the recently released Frontier Centre for Public Policy report Improving the Competitiveness of Metropolitan Areas by Wendell Cox, who also serves as a senior fellow at the Centre.

    Note 1: Data not provided for other metropolitan areas.

    Note 2: On a related note, the Bank of Canada (the central bank) and others have indicated a concern about rising house costs relative to incomes. This is to be expected in metropolitan areas adopting green belts, urban growth boundaries and other land rationing policies. Huge housing price increases have occurred in Vancouver, Toronto, Montréal and Calgary (for example), in response to such policies (This is evident from the annual editions of the Demographia International Housing Affordability Survey, sponsored in Canada by the Frontier Centre for Public Policy). The Bank of Canada may be virtually powerless to slow this loss of housing affordability, since its cause (constraining metropolitan land supply) is beyond the reach of the Bank’s monetary policies.

    Photo: Suburban Montreal (by author)

  • Homebuilding Recovery: A Zoning & Planning Overhaul

    Part III of the Recovery Blueprint for homebuilding. Defining good zoning and good planning, and a look at how social engineering plays in.

    What exactly is ‘planning’?

    It can be government creation of an Interstate Highway, or a city council vote on a new park. For the purposes of this blueprint, planning refers to the design of a new land development or a design for redevelopment. In both cases, the land plan is the developer’s business plan. The design will either be positive or negative for the sustainability — long-term health — of the city.

    Typically, the ‘planner’ will be an engineer or surveyor if the development is suburban, or an architect or ‘urban planner’ designing an urban redevelopment. In any case, the planner will follow regulations that set ‘minimums,’ such as a minimum on lot size, side yards, front and rear setbacks, and so forth. There are a few major problems with this ‘minimums’ based system.

    In order to maximize profits for the client (the builder or developer), the planner is encouraged to squeeze as many units as possible within the available land. The design of the development becomes a mathematical exercise, more than an attempt to create an attractive and functional neighborhood design.

    The result becomes a monotonous, cookie-cutter solution. It maximizes not just density, but also construction costs, with a high volume of streets, utility mains, and sidewalks.

    Technology made the situation worse, with software not only limiting creativity, but also influencing the planning to correspond with the predetermined, robotic functions of the widely used software.

    A minimums-based design is quite rigid. In the long run, if a design is driven only by density, the development can be far less profitable for the developer, despite the original intention to economize. Builders who buy lots from the developer also end up paying more than they would have with a different approach. When topography and the overall property configuration are more complex, and as restrictions on wetlands and tree ordinances increase, it gets worse. Rigid designing is like trying to fit a square peg in an odd shaped hole, increasing waste.

    Development after development becomes a clone, because of the way regulations are written and interpreted. This monotony can then only be broken up with a much greater attention to architecture and landscaping. The ‘geometry’ of each development remains similar.

    This is where the confusion between good planning and good architecture comes in. An example is New Urbanism, with architecture as its key component. A coherent architectural theme, full front porch, and street trees are typical of these developments. Compare that to the vinyl sided, bland subdivision where the three-car garage is the dominant feature. New Urbanism typically wins the curb appeal beauty contest. (Of course, in upscale suburban communities where every home showcases great architecture and landscaping, that is not necessarily the case.)

    Underlying New Urbanism is the implication that certain design elements will change behavior and solve social problems. Neighbors will want to interact regardless of income, race, religion, and so on. Many think this ‘Stepford Wife’ approach places design as a tool to implement mind control. Is it?

    Those who reside in New Urban communities desire the more attractive setting. The architectural and landscaping control creates a welcoming and cohesive community appearance, compared to the garage snout vinyl cladded subdivision. These developments are typically more expensive per home square foot, thus your neighbor is likely to be somewhat successful, just like you. This is no more social engineering than is providing any market for successful people who value appearance and like to live among others with similar values.

    Within a city, other planning solutions can result in social change. Replacing a blighted, high crime neighborhood with a gentrified urban mecca for wealthy residents that enjoy the nightlife is one sure formula to do so. But is it a change in the right direction for a city?

    What happens to those low-income families that are displaced? How are their lives improved? Theoretically, they could move to a safer, less blighted area, like many who were displaced by Katrina. Instead of displacing poor families, there are viable solutions based on rebuilding blighted areas and maintaining affordability. Not the typical ‘smart growth’ solutions, though; those often add significantly to redevelopment costs. Compressing these families into dense, high-rise structures does nothing to foster pride, thus, high-density low-income housing could be considered unsocial engineering.

    Zoning gets attacked, but the truth is that it tends to preserve property values better than intermixed usage does. New Urbanism offers the promise that the rich and poor can all live on the same block. That would be marketing suicide for the developer and builder. Suburban zoning can also be a terrible model. It places the strip mall or multi-family homes along arterial roads, then transitions to the large single family lots and homes as one drives deeper into the subdivision or the ‘master planned’ community (i.e., ‘larger’ subdivision). Showcasing the cheapest housing, and placing the most families in the worst places is land use madness. To highlight inexpensive homes and strip malls cheapens the development and the city as a whole.

    A blueprint for recovery without class barriers, one that benefits all income levels, can easily be accomplished today. To start, the suburban zoning pattern is in serious need for an overhaul. Reversing the pattern would increase property values and profitability, and values would be more stable over time.

    A less rigid geometric pattern would reduce monotony, while allowing the development design to adhere to the natural terrain. An adherence to the natural terrain allows surface flow, which reduces the expense and negative impact of traditional storm sewer systems.

    How can all of the above be expedited? Cities can be proactive by writing regulations that reward better solutions. That particularly includes a modification of their existing minimums-based regulations.

    Flickr photo by infomatique (William Murphy): “Discussion: ‘Can Zoning Be Bad For You?’ All land in Dublin City is zoned for one particular use or another, some more restrictive than others…”

    Rick Harrison is President of Rick Harrison Site Design Studio and Neighborhood Innovations, LLC. He is author of Prefurbia: Reinventing The Suburbs From Disdainable To Sustainable and creator of Performance Planning System. His websites are rhsdplanning.com and pps-vr.com.

  • The Export Business in California (People and Jobs)

    California Senate President Pro-Tem Darrell Steinberg countered my Wall Street Journal commentary California Declares War on Suburbia in a letter to the editor (A Bold Plan for Sustainable California Communities) that could be interpreted as suggesting that all is well in the Golden State. The letter suggests that business are not being driven away to other states and that the state is "good at producing high-wage jobs," while pointing to the state’s 10 percent growth over the last decade. Senate President Steinberg further notes that the urban planning law he authored (Senate Bill 375) is leading greater housing choices and greater access to transit.

    This may be a description of the California past, but not present.

    Exporting People

    Yes, California continues to grow. California is growing only because there are more births than deaths and the state had a net large influx of international immigration over the past decade. At the same time, the state has been hemorrhaging residents (Figure 1).

    Californians are leaving. Between 2000 and 2009 (Note), a net 1.5 million Californians left for other states. Only New York lost more of its residents (1.6 million). California’s loss was greater than the population of its second largest municipality, San Diego. More Californians moved away than lived in 12 states at the beginning of the decade. Among the net 6.3 million interstate domestic migrants in the nation, nearly one-quarter fled California for somewhere else.

    The bulk of the exodus was from the premier coastal metropolitan areas. Since World War II, Los Angeles, San Francisco, San Diego and San Jose have been among the fastest growing metropolitan areas in the United States and the high-income world. Over the last decade, this growth has slowed substantially, as residents have moved to places that, all things being considered, have become their preferences.

    More than a net 1.35 million residents left the Los Angeles metropolitan area, or approximately 11 percent of the 2000 population. The San Jose metropolitan area lost 240,000 residents, nearly 14 percent of its 2000 population. These two metropolitan areas ranked among the bottom two of the 51largest metropolitan areas (over 1,000,000 population) in the percentage of lost domestic migrants during the period. The San Francisco metropolitan area lost 340,000 residents, more than 8 percent of its 2000 population and ranked 47th worst in domestic migration (New York placed worse than San Francisco but better than Los Angeles). Each of these three metropolitan areas lost domestic migrants at a rate faster than that of Rust Belt basket cases Detroit, Cleveland and Buffalo.

    San Diego lost the fewest of the large coastal metropolitan areas (125,000). Even this was double the rate of Rust Belt Pittsburgh.

    Exporting Jobs

    California is no longer an incubator of high-wage jobs. The state lost 370,000 jobs paying 25 percent or more of the average wage between 2000 and 2008. This compares to a 770,000 increase in the previous 8 years. California is trailing Texas badly and the nation overall in creating criticial STEM jobs and middle skills jobs (Figures 2 & 3) Only two states have higher unemployment rates than California (Nevada and Rhode Island) . California has the second highest underemployment rate (20.8 percent), which includes the number of unemployed, plus those who have given up looking for work ("discouraged" workers) and those who are working only part time because they cannot find full time work. Only Nevada, with its economy that is overly-dependent on California, has a higher underemployment rate.


    Business relocation coach Joseph Vranich conducts an annual census of companies moving jobs out of California and found a quickening pace in 2012. Often these are the very kinds of companies capable of creating the high-wage jobs that used to be California’s forte. Vranich says that the actual number may be five times as high, which is not surprising, not least because there is no reliable compilation of off-shoring of jobs to places like Bangalore, Manila or Cordoba (Argentina).

    To make matters worse, California is becoming less educated. California’s share of younger people with college degrees is now about in the middle of the states, while older, now retiring Californians are among the most educated in the nation (Figure 4).

    Denying Housing Choice

    It is fantasy to believe, as Steinberg claims, that there are enough single family (detached) houses in the state to meet the demand for years to come. More than 80 percent of the new households in the state chose detached housing over the last decade. People’s actual choices define the market, not the theories or preferences of planners often contemptuous of the dominant suburban lifestyle.

    In contrast, however, the regional plans adopted or under consideration in the Bay Area, Los Angeles and San Diego would require nearly all new housing be multi-family, at five to 10 times normal California densities (20 or more units to the acre are being called for). New detached housing on the urban fringe would be virtually outlawed by these plans. And, when Sacramento does not find the regional plans dense enough, state officials (such as the last two state Attorneys General) are quick to sue. If the "enough detached housing" fantasy held any water, state officials and planners would not be seeking its legal prohibition. To call outlawing the revealed choice of the 80 percent (detached housing) would justify the equivalent of a Nobel Prize in Doublespeak.

    At the same time by limiting the amount of land on which the state preferred high density housing must be built, land and house prices can be expected to rise even further from their already elevated levels (already largely the result of California’s pre-SB 375 regulatory restrictions).

    Transit Rhetoric and Reality

    Transit is important in some markets. About one-half of commuters to downtown San Francisco use transit. The assumptions of SB 375 might make sense if all of California looked like downtown San Francisco. It doesn’t, nor does even most of the San Francisco metropolitan area. Only about 15 percent of employment is downtown, while the 85 percent (and nearly all jobs in the rest of the state) simply cannot be reached by transit in a time that competes with the car. Even in the wealthy San Jose area (Silicon Valley), with its light rail lines and commuter rail line, having a transit stop nearby provides 45 minute transit access to less than 10 percent of jobs in the metropolitan area.

    A recent Brookings Institution report showed that the average commuter in the four large coastal metropolitan areas can reach only 6.5 percent of the jobs in a 45 minute transit commute. This is despite the fact that more than 90 percent of residents can walk to transit stops. Even when transit is close, you can’t get there from here in most cases in any practical sense (Figure 5).

    SB 375 did little to change this. For example, San Diego plans to spend more than 50 percent of its transportation money on transit over the next 40 years. This is 25 times transit’s share of travel (which is less than 2 percent). Yet, planners forecast that all of this spending will still leave 7 out of 8 work and higher education trips inaccessible by transit in 30 minutes in 2050. Already 60 to 80 percent of work trips in California are completed by car in 45 minutes and the average travel time is about 25 minutes.

    For years, planners have embraced the ideal of balancing jobs and housing, so that people would live near where they work, while minimizing travel distances. This philosophy strongly drives the new SB 375 regional plans. What these plans miss is that people choose where to work from the great array of opportunities available throughout the metropolitan area. These varied employment opportunities that are the very reason that large metropolitan areas exist, according to former World Bank principal planner Alain Bertaud.

    People change jobs far more frequently than before and multiple earners in households are likely to work far apart. Similar intentions led to the development up to four decades ago of centers like Tensta in Stockholm, which ended up as concentrated low income areas (Photo). It California, such a concentration would do little to improve transit ridership, even low-income citizens are four to 10 times as likely use cars to get to work than to use transit.


    Tensta Transit Oriented Development: Stockholm

    All of this means more traffic congestion and more intense local air pollution, because higher population densities are associated with greater traffic congestion. Residents of the new denser housing would face negative health effects because there is more intense air pollution, especially along congested traffic corridors.

    Self-Inflicted Wounds

    Worst of all, California’s radical housing and transportation strategies are unnecessary. The unbalanced and one-dimensional pursuit of an idealized sustainability damages both quality of life and the economy. This is exacerbated by other issues, especially the state’s dysfunctional economic and tax policies. It is no wonder California is exporting so many people and jobs. California’s urban planning regime under SB 375 is poised to make it worse.

    Wendell Cox is a Visiting Professor, Conservatoire National des Arts et Metiers, Paris and the author of “War on the Dream: How Anti-Sprawl Policy Threatens the Quality of Life”.

    Net Domestic Migration: 2000-2009
    Rank Metropolitan Area Net Domestic Migration Compared to 2000 Population
    1 Raleigh, NC         194,361 24.2%
    2 Las Vegas, NV         311,463 22.4%
    3 Charlotte, NC-SC         248,379 18.5%
    4 Austin, TX         234,239 18.5%
    5 Phoenix, AZ         543,409 16.6%
    6 Riverside-San Bernardino, CA         469,093 14.3%
    7 Orlando, FL         225,259 13.6%
    8 Jacksonville, FL         126,766 11.3%
    9 Tampa-St. Petersburg, FL         260,333 10.8%
    10 San Antonio, TX         177,447 10.3%
    11 Atlanta, GA         428,620 10.0%
    12 Nashville, TN         123,199 9.4%
    13 Sacramento, CA         141,117 7.8%
    14 Richmond, VA           75,886 6.9%
    15 Portland, OR-WA         121,957 6.3%
    16 Dallas-Fort Worth, TX         317,062 6.1%
    17 Houston, TX         243,567 5.1%
    18 Indianapolis. IN           72,517 4.7%
    19 Oklahoma City, OK           41,082 3.7%
    20 Denver, CO           66,269 3.0%
    21 Louisville, KY-IN           34,381 3.0%
    22 Birmingham, AL           26,934 2.6%
    23 Columbus, OH           34,204 2.1%
    24 Kansas City, MO-KS           31,747 1.7%
    25 Seattle, WA           40,741 1.3%
    26 Minneapolis-St. Paul, MN-WI          (19,731) -0.7%
    27 Memphis, TN-MS-AR            (8,583) -0.7%
    28 Hartford, CT            (9,349) -0.8%
    29 Cincinnati, OH-KY-IN          (17,648) -0.9%
    30 Virginia Beach-Norfolk, VA-NC          (20,005) -1.3%
    31 Baltimore, MD          (36,407) -1.4%
    32 St. Louis, MO-IL          (43,750) -1.6%
    33 Philadelphia, PA-NJ-DE-MD        (115,890) -2.0%
    34 Pittsburgh, PA          (52,028) -2.1%
    35 Washington, DC-VA-MD-WV        (107,305) -2.2%
    36 Providence, RI-MA          (49,168) -3.1%
    37 Salt Lake City, UT          (34,428) -3.5%
    38 Rochester, NY          (40,219) -3.9%
    39 San Diego, CA        (126,860) -4.5%
    40 Buffalo, NY          (55,162) -4.7%
    41 Milwaukee,WI          (74,453) -5.0%
    42 Boston, MA-NH        (235,915) -5.4%
    43 Miami, FL        (287,135) -5.7%
    44 Chicago, IL-IN-WI        (561,670) -6.2%
    45 Cleveland, OH        (136,943) -6.4%
    46 Detroit,  MI        (366,790) -8.2%
    47 San Francisco-Oakland, CA        (347,375) -8.4%
    48 New York, NY-NJ-PA     (1,962,055) -10.7%
    49 Los Angeles, CA     (1,365,120) -11.0%
    50 San Jose, CA        (240,012) -13.8%
    51 New Orleans, LA        (301,731) -22.9%
    Data from US Census Bureau


    —–

    Note:  2000 to 2010 data not available

    Lead photo: Largely illegal to build housing under California Senate Bill 375 planning

  • World Urban Areas Population and Density: A 2012 Update

    The latest edition of Demographia World Urban Areas has just been released. The publication includes population estimates, urban land area estimates and urban densities for all nearly 850 identified urban areas in the world with a population of 500,000 or more. These urban areas account for approximately 48% of the world’s urban population. Overall, data is provided for approximately 1500 urban areas, comprising approximately 1.9 billion people, or 52% of the world’s urban population.

    Urban areas (or urban agglomerations) are areas of continuous urban development within a metropolitan area (labor market area), and are the physical form of that constitutes the essence a city. Generally, urban areas can be identified by the lights one would see from an airplane at night or in a satellite photograph. Urban areas are not metropolitan areas, which represent the economic or functional form of a city. Urban areas are a component of metropolitan areas, the other component of which is non-urban or rural territory. A metropolitan area is the combination of the urban area(s) and rural areas, which together comprise the economic region or labor market (commute shed).

    Over the last year, new census reports have become available in such nations as India, Indonesia, China, Canada, Bangladesh, the United States and South Korea. The new data has resulted in a number of ranking changes from before.

    The Megacities: In 2012, 26 urban areas qualify as megacities (Rental Car Tours for 24 of the megacities are available), with populations of greater than 10 million people (Table). As has been the case for nearly six decades, Tokyo remains the largest urban area in the world, with approximately 37 million. New York, which Tokyo displaced in 1955, has fallen to seventh largest and has the lowest population density of any megacity, at 4600 per square mile or 1800 per square kilometer (Note 2). London, which New York displaced in the 1920s never became a megacity due to the imposition of its greenbelt. Instead urbanization leapfrogged into the exurbs of southeast England, where all of the London area’s net population growth has occurred since World War II (London ranked third as late as 1960).  

    Table 1          
    LARGEST URBAN AREAS IN THE WORLD (MEGACITIES): Estimated 2012
    (Over 10,000,000 Population)          
             
    Rank Geography Urban Area Population Estimate Land Area: Square Miles Density Land Area: Km2 Density
    1 Japan Tokyo-Yokohama 37,126,000 3,300 11,300 8,547 4,300
    2 Indonesia Jakarta 26,063,000 1,075 24,200 2,784 9,400
    3 South Korea Seoul-Incheon 22,547,000 835 27,000 2,163 10,400
    4 India Delhi, DL-HR-UP 22,242,000 750 29,700 1,943 11,500
    5 Philippines Manila 21,951,000 550 39,900 1,425 15,400
    6 China Shanghai, SHG 20,860,000 1,350 15,500 3,497 6,000
    7 United States New York, NY-NJ-CT 20,464,000 4,495 4,600 11,642 1,800
    8 Brazil Sao Paulo 20,186,000 1,225 16,500 3,173 6,400
    9 Mexico Mexico City 19,463,000 790 24,600 2,046 9,500
    10 Egypt Cairo 17,816,000 660 27,000 1,709 10,400
    11 China Beijing, BJ 17,311,000 1,350 12,800 3,497 5,000
    12 Japan Osaka-Kobe-Kyoto 17,011,000 1,240 13,700 3,212 5,300
    13 India Mumbai, MAH 16,910,000 211 80,100 546 30,900
    14 China Guangzhou-Foshan, GD 16,827,000 1,225 13,700 3,173 5,300
    15 Russia Moscow 15,512,000 1,700 9,100 4,403 3,500
    16 Bangladesh Dhaka 15,414,000 134 115,000 347 44,400
    17 United States Los Angeles, CA 14,900,000 2,432 6,100 6,299 2,400
    18 India Kolkota, WB 14,374,000 465 30,900 1,204 11,900
    19 Pakistan Karachi 14,198,000 300 47,300 777 18,300
    20 Argentina Buenos Aires 13,639,000 1,020 13,400 2,642 5,200
    21 Turkey Istanbul 13,576,000 540 25,100 1,399 9,700
    22 Brazil Rio de Janeiro 12,043,000 780 15,400 2,020 6,000
    23 China Shenzhen, GD 11,885,000 675 17,600 1,748 6,800
    24 Nigeria Lagos 11,547,000 350 33,000 907 12,700
    25 France Paris 10,755,000 1,098 9,800 2,844 3,800
    26 Japan Nagoya 10,027,000 1,475 6,800 3,820 2,600


    Jakarta (Jabotabek) has emerged as the world’s second largest urban area, with a population of 26 million. This is a larger population than reported by the United Nations, since its estimates include little more than DKI Jakarta, the national capital district and beyond which urbanization stretches for a considerable distance. Continuing suburban growth in Seoul-Incheon secured that urban area a ranking of third, with approximately 22.5 million people. As was reported last year, new estimates indicate that Delhi has emerged as India’s largest urban area, with a population of 22.2 million and a growth rate that should result in its passing Seoul-Inchon in a matter of a few years. Mumbai, which like Mexico City in the 1980s has often been promoted as being destined to become the largest urban area in the world, was passed by Delhi over the past decade and has become the second largest urban area in India.

    Manila is ranked as the fifth largest urban area in the world, with 22.0 million people. In Manila, as in Jakarta, the population reported to the United Nations is far below that of the genuine urban area. The reported population is for the National Capital Region (popularly and misleadingly called "Metro Manila), which represents approximately one-half of the population of the urban area, which stretches into four additional provinces (Cavite, Laguna, Rizal and Batangas). If the population of the Washington urban area were reported in the same manner, it would be 600,000 – the population of the District of Columbia – rather than the 4.6 million indicated in the 2010 census for the entire urban area.

    Los Angeles, until recent years one of the fastest growing urban areas in the world, has dropped to 17th largest in the world and seems destined to drop out of the top 20 in the next decade or two. Fast growing Karachi, Istanbul, Lagos and others could become larger than Los Angeles. Los Angeles reached its peak ranking of 6th largest in the world from 1965 through 1980 and entered the top ten by 1950.

    Over the past decade, Paris became a megacity, reaching a population of 10.7 million. Paris has been Western Europe’s fastest growing large urban area since World War II. All of its growth since 1921 has been in the suburbs, which stretch over more than 1,000 miles (2,600 square kilometers).  This is more land area than Houston’s suburbs, but more densely populated. Since 1921, the historical core municipality (the ville de Paris) has dropped in population from 2.9 million to 2.2 million.

    By world standards, the Paris urban area has grown slowly, having fallen from being the world’s third largest in 1965 to its current ranking of 23rd. However, over the past census period, Paris added 600,000 residents, compared to less than 200,000 in the previous period, indicating a decline in out-migration and a higher natural population rate increase.

    Urban Area Densities: Dhaka, the capital of Bangladesh grew strongly between 2001 and 2011 and is by far the most densely populated urban area in the world. Dhaka’s density is estimated at 115,000 per square mile or 44,000 per square kilometer, with slum (informal dwelling) densities reported report up 4,210 per acre, or 2.7 million per square mile (1 million per square kilometer). At this density, all of the world’s 3.7 billion urban residents could be accommodated in an area approximately equal to that of the Washington (DC-MD-VA) urban area. All of Dhaka’s urban population of 15.4 million fits into a land area equal to that of the city (municipality) of Portland (population less than 600,000). Nonetheless, analysts have referred to this example of the ultimate of urban density to be "sprawling."

    Among the urban areas with more than 2.5 million population, the second-most dense is Mumbai, at 80,100 per square mile or 30,900 per square kilometer. The most dense high income world urban area is Hong Kong, at 67,000 persons per square mile or 25,900 per square kilometer. Of course, Hong Kong’s density is the result of an accident of history, which resulted in huge migration to the former British colony following World War II. Hong Kong is more than twice as dense as the second most dense high income world urban area, Busan, Korea. The smaller nearby, yet historically similar enclave of Macau (560,000) has an even higher density than Hong Kong, at 70,000 per square mile (27,000 per square kilometer).

    Seven of the densest urban areas with more than 2.5 million population are on the Asian subcontinent. These include Dhaka and Chittagong in Bangladesh, Mumbai, Ahmedabad, Surat and Jaipur in India and Karachi, in Pakistan. Colombia has two of the densest, Bogota and Medellin. Hong Kong is the only high income nation urban area among the 10 densest (Figures 1 & 2).


    The least dense urban areas with more than 2.5 million population are all in the United States. The least dense is Atlanta, with 1800 people per square mile or 700 per square kilometer. The second least dense is, perhaps surprisingly, Boston, despite its reputation for high density. Boston’s population density is 2200 per square mile or 800 per square kilometer. Also, perhaps surprisingly, Philadelphia is the least dense urban area in the world with more than 5 million population, while Chicago is the least dense urban area of more than 7.5 million. The lower density of US urban areas is illustrated by the fact that Portland, with its reputation for higher density and densification planning, would have ranked 11th least dense, if it had reached the 2.5 million threshold used in this ranking.

    Most Extensive Urban Areas: New York covers the most land area of any urban area at nearly 4500 square miles or 11,000 square kilometers. Tokyo covers 3300 square miles or 8500 kilometers. Chicago is the third most expansive urban area, at 2,600 square miles (6,900 square kilometers). Los Angeles, which has long been perceived as the most sprawling of world urban areas, ranks fifth, covering 2400 square miles or 6,300 square kilometers. Atlanta and Boston, the world’s least dense major urban areas, rank 4th and 6th, covering 2,600 and 2,100 square miles respectively (6,900 square kilometers and 5,400 square kilometers).

    The Continuing Exodus from Rural Areas: Around the world, people continue to seek the promise of better economic outcomes in urban areas. United Nations forecasts indicate that another 2.5 billion people will be added to urban areas by 2050, while rural areas (which contain all population not urban) will be reduced in population by 300 million. The world’s urban population is expected to rise from today’s nearly 53 percent to 67 percent. More than 90 percent of the urban growth is expected to be in less developed nations.

    Wendell Cox is a Visiting Professor, Conservatoire National des Arts et Metiers, Paris and the author of “War on the Dream: How Anti-Sprawl Policy Threatens the Quality of Life”.

    ——

    Note 1: Demographia World Urban Areas uses national census authority urban area population and land area data in the few nations designating urban areas on a basis generally consistent with that of the United States Census Bureau. Elsewhere, land area estimates are determined using satellite photography (Google Earth). Population estimates are also obtained from a variety of sources, such as United Nations data, where it is reflective of the urban area population (some data reported to the United Nations is for jurisdictions that are only a part of the urban area and in other cases, metropolitan area data is reported), estimates relying on a "build-up" of local authority data from national census authorities and other sources. Demographia combines some adjacent urban areas when they are contained within the same metropolitan area or consolidated area, such as in New York and Los Angeles (for a complete list see Demographia World Urban Areas). Also see: Urban Terms Defined.

    Note 2: Exceptions: In some cases, continuous urbanization does not constitute a single urban area because they are not within a single labor market (metropolitan area). This can be the case within a nation, such as in the Pearl River Delta of China, where Shenzhen, Dongguan, Zhongshan, Jiangmen, Huizhou, Zhuhai, Guangzhou-Foshan and Hong Kong, which are separate labor markets. International borders (and the Hong Kong-Shenzhen border) also define separate urban areas if free movement of labor is not permitted. Thus Detroit and Windsor or San Diego and Tijuana are separate urban areas because free movement of labor is not permitted. On the other hand, treaties permit virtual free movement of labor between the French and Belgian sides of the Lille urban area and between the Swiss and French components of the Geneva urban area.

    —-

    Photo: Recent migrants to Dhaka slum in NGO school (photo by author)

  • Homebuilding Recovery: How CAD Stifles Solutions

    The Recovery Blueprint is a multipart series on homebuilding. Part II addresses how a reliance on CAD software and a lack of collaboration stifle sustainable land development solutions.

    The front cover of Engineering News-Record on March 12th, 2012 was about a technology survey conducted a few weeks earlier. Of 18 issues surveyed, the need for better software was mentioned most frequently. Under the heading “Software Shortfall – Better, Simpler, Cheaper”, the editors noted that ‘dissatisfaction with current products cuts across all responses,’ and labeled the area, ‘Needs Improvement’.

    Better Software: Until a few decades ago the development of the world was represented by a hand drawn plan. Computer Aided Drafting (CAD) did not exist. There was an intimacy between the design of buildings and the land development task at hand. Since the introduction of CAD, the typical American city has seen few technology changes in the ways that housing is designed. There is virtually no advancement in the design of land development that can be associated with this new era of software-enabled design. If anything, it could be argued that CAD technology resulted in worse design of the cities in which we dwell.

    During a recent lunch with a prominent architect, he explained to me how easy it is to do multifamily design. Simply create one interior unit and one end unit, and then repeat with minor modifications for the first floor units. There was no mention on how to increase the views, or of perceived space (versus actual space), or of efficiencies that could help make everyday living better for the residents. Only that CAD made things so much faster and ‘easier’ for the architect.

    Several software solutions companies boast in their literature about how the development of hundreds of lots can be generated in a minute. The attitude that technology is a tool for speed, instead of for quality, feeds complacency and dumbs down design to series of ‘typicals’ or ‘blocks’ that can be instantly duplicated.

    CAD was intended as a drafting tool to serve hundreds of purposes within a multi-billion dollar software industry. To serve all industrial usages, CAD has become a ‘jack of all trades but master of none’. This is most apparent in land-based design, which requires calculations based upon coordinate geometry. CAD requires a separate data structure to perform these calculations. As an industry core technology, CAD compromises and limits land development design. To do land based calculations for environmental and economic reporting requires precision spatial analysis, and CAD technology fails to deliver. If CAD were a spatial platform there would be no need for a separate GIS technology (another industry problem) for analytical data.

    CAD Saturation: The hand drafting tools used just a few decades ago simply do not exist today. In a saturated market, CAD companies must generate fees through updates, support and training. If these systems were easy (see above complaints) and quick to learn the support and training income would plummet. Thus, intentional complexity assures CAD an income stream for companies at the expense of limiting progress and stifling design advancements.

    Pre-packaged software results in pre-packaged solutions. For example, imagine that an engineer schooled in the use of a particular software is given the task of designing a storm sewer on a 100-acre subdivision. To design and create the required drawings and reports for the multi-million dollar storm sewer system using add-on software to CAD, it might take only a day or so. A more natural alternative using surface flow is likely a viable option, potentially reducing infrastructure expense by tens of thousands, and in some cases millions, of dollars. However, there is no ‘button press’ for surface flow. If consulting fees are based upon a percentage of construction costs the situation becomes worse.

    Many Architects intelligently use technology that is not possible through CAD. Some of these more intelligent software solutions have even been acquired by leading CAD companies. GIS (Geographic Information System) technology is generally based upon polygons, that is, a series of straight lines forming a shape. Typically, it’s useless for precision engineering and surveying irregular, real-world sites.

    Technology Inhibited Collaboration: Architects, engineers, surveyors and planners — the group of consultants that are given responsibility to design and produce plans for our world’s growth — have been, historically, un-collaborative. Technology has done little to change this and foster collaboration.

    Only a few decades ago, it was a given that hand drawn sketches would need to be calculated for construction. Today, a planner using CAD could ‘sketch’ thousands of inaccurate lines and arcs that look like a finished plan, but would be useless for engineering and surveying. Data transferred to the CAD system of an engineer or surveyor does not magically become accurate, and therefore usable. The way CAD has been utilized destroys collaboration instead of building it.

    This isn’t the fault of CAD technology, which actually can create precise drawings. The blame falls on those that teach its use. One way to build collaboration would be for schools in engineering, architecture, planning, and surveying to work on common projects, teaching the needs of each other in a way that reduces time and workload, allowing more time for better decision making.
    Unsustainable Sustainability: It’s human nature to find comfort at a certain stage of equilibrium. What does this mean? We relent to the flow of everyday life. In the case of land development issues, methods and technology that go with the flow lead to an unsustainable path.

    Those involved in the development industry, whether working for private or for public entities, know our growth is not sustainable. Instead of seeking better methods, we have reduced planning to either mindlessly automating design, or to creating stricter design models that promise progress by providing a better architectural façade.

    Instead of being more efficient and reducing the physical elements required for development, we have added solutions that often increase installation and maintenance costs. An example is permeable paving, which is a wonderful idea: pavement that allows rainwater to pass into the ground, instead of running off the pavement’s end and flooding the surrounding area. The problem is not the pavement, but the fact that the under layer supporting the paving must also be permeable. To do this is often prohibitively expensive. If it’s not done properly, it traps water that can freeze (in colder climates) and then expand, and may not hold up to the weight of heavy loads.

    Despite the promise of permeable pavement, design innovations that can reduce the volume of street surface by 30% or more without reducing functionality make more sense. Eliminating an excessive amount of street surface is an efficient solution that costs less to install and maintain than permeable pavement.

    Funding Sources For Innovation: Would it be possible for someone to discover a way to create an affordable base for permeable pavement? Probably. There are hundreds of millions of dollars available from private foundations and government grants for solutions leading to sustainable growth. However, foundation grants fund only 501c non-profits. Should future solutions to development be tied only to non-profit or politically connected entities, or to private firms which may be more capable of innovation?

    There is no technology that can create a better design; we can only create better designers. Instead of educating CAD users on how to automate design, we need to create a generation of designers who use technology to create wonderful neighborhoods instead of quick subdivision plans.

    The consultant needs to concentrate on the best solution, not just the solution that is a mere button press away. Today, there is no excuse for creating designs that are not precise. Architects, engineers, planners, and surveyors need to learn to fulfill each other’s basic needs. This would go a long way towards creating a new era of collaborative design.

    Rick Harrison is President of Rick Harrison Site Design Studio and Neighborhood Innovations, LLC. He is author of Prefurbia: Reinventing The Suburbs From Disdainable To Sustainable and creator of Performance Planning System. His websites are rhsdplanning.com and pps-vr.com.

    Flickr Photo: Designing tools by evrenozbilen.

  • Staying the Same: Urbanization in America

    The recent release of the 2010 US census data on urban areas (Note 1) shows that Americans continue to prefer their lower density lifestyles, with both suburbs and exurbs (Note 2) growing more rapidly than the historic core municipalities.  This may appear to be at odds with the recent Census Bureau 2011 metropolitan area population estimates, which were widely mischaracterized as indicating exurban (and suburban) losses and historical core municipality gains. In fact, core counties lost domestic migrants, while suburban and exurban counties gained domestic migrants. The better performance of the core counties was caused by higher rates of international migration, more births in relation to deaths and an economic malaise that has people staying in (counties are the lowest level at which migration data is reported). Nonetheless, the improving environment of core cities in recent decades has been heartening.

    The urban area data permits analysis of metropolitan area population growth by sector at nearly the smallest census geography (census blocks, which are smaller than census tracts). Overall, the new data indicates that an average urban population density stands at 2,343 per square mile (904 per square kilometer). This is little different from urban density in 1980 and nearly 10 percent above the lowest urban density of 2,141 per square mile (827) recorded in the 1990 census. Thus, in recent decades, formerly falling US urban densities have stabilized .

    Urban density in 2010, however, remains approximately 27 percent below that of 1950, as many core municipalities lost population while suburban and suburban populations expanded. This resulted in the substantial expansion of urban land area reflecting the preference for low-density lifestyles among Americans and most people in other high-income areas of the world.   Between the 1960s and 2000, nearly all of the growth in the major metropolitan regions of Western Europe and Canada has taken place in suburban areas, as these nations’ urban areas have dispersed in a manner similar to that of the United States. The trend continued through 2011 in Canada and domestic migration data in Western Europe shows a continuing movement of people from the historical cores to the suburbs and exurbs.

    This dispersion, pejoratively called "urban sprawl" has been routinely linked with everything from obesity and global warming to "bowling alone." In fact, while population densities have fallen, households densities have remained steady, barely droppping at all. Average household size has fallen dramatically, as fewer children have been born and divorce rates have soared. New households have been formed at more than 1.5 times the rate of population growth. The result is that a 27 percent decline in urban density since 1950 translated into a much more modest 4 percent decline in household density. A more genuine target for anti-suburban crusaders would be household sprawl rather than urban sprawl (Figure 1).

    Smaller Urban Areas Growing Faster

    Even as urban densities have reached a floor, Americans still continue to move to areas of lower density and smaller populations. For example, the urban areas of more than 1 million population in 1990 attracted 48 percent of the nation’s urban growth between 1990 and 2000. Between 2000 and 2010, these areas attracted a smaller 38 percent of urban growth (Figure 2).

    The Exurbs: A Two-Way Exodus

    For much of the last decade (and even before), the media has been heralding an epochal “return” to core cities. This idea is fundamentally misleading since most suburbanites actually came not from core cities but smaller towns and rural areas. The census results have made it clear that the urban focus of population growth was largely anecdotal, although  small inner city areas of some core cities (such as small sections of  St. Louis, Chicago, Dallas, Seattle, San Diego and Portland)  have experienced uncharacteristic growth. But overall, most growth continued to be in the suburbs and exurbs.  Measured at the census block level, exurbs are constantly at risk of being converted into suburbs as they become a part of the continuously developed area. Even so, as of 2010, exurban areas accounted for 16.1 percent of the population in the 51 major metropolitan areas. The historical core municipalities accounted for 26.3 percent of the population, while suburban areas housed 57.6 percent of the population (Figure 3).

    It should be considered, however, that in many urban areas — such as Houston, Los Angeles, Phoenix, Portland, Seattle and Orlando — many historic city neighborhoods were developed as and remain suburban in their form, being dominated detached homes and automobiles. It is unlikely that exurban areas (measured at the census block level) will exceed the historical core cities in population, since they are at constant risk of being merged with suburbs (as the urban area expands).

    Smaller Urban Areas: Where the Sprawl Is

    The principal urban areas of the major metropolitan areas are nearly twice as dense as the rest of America’s urban areas. These urban areas have 53 percent of the urban population, but occupy only 39 percent of the urban land area. By contrast, the smaller urban areas have 47 percent of the urban population, while occupying 61 percent of the urban land area (Figure 4). It seems odd  that the fury of urban planners is directed at the larger, more dense urban areas rather than the smaller, much less dense urban areas, that sprawl to a far greater degree (Figure 5).

    Most and Least Dense Major Urban Areas

    Among the major metropolitan areas, the most dense urban area is Los Angeles, at a density of 6,999 per square mile (2,702 per square kilometer). This is a 32 percent denser than fourth ranked New York whose  hyper-dense core is offset by its low density suburbs. In fact, San Jose, which is virtually all suburban in its urban form and was a small urban area in 1950 (link to 1950-2010 data), ranks third and also is more dense than the New York urban area. Second ranked San Francisco is also more dense than New York (Figure 6). New Orleans ranked 10th most dense, however experienced a reduction in density of more approximately 30 percent due to the devastation of Hurricanes Katrina

    It may be surprising that Portland, with by far the most radical densification policies in the nation, does not even rank among the 10 most dense urban areas. Portland ranked 13th, behind urban areas like Las Vegas, Salt Lake City, San Diego, Sacramento, Denver and exclusively suburban Riverside-San Bernardino (and even the much smaller urban areas of Fresno, Bakersfield, Turlock and Los Banos in California’s San Joaquin Valley). However Portland did densify, reaching one-half the density of Los Angeles.  Portland will catch Los Angeles in density by 2120 at the current rate.   

    The least dense urban area is Birmingham, with a population density of 1,414 per square mile (546 per square kilometer). Atlanta, the least dense urban area of more than 3 million population in the world right is the third least dense at 1,707 per square mile (659 per square kilometer). The second least dense urban area, Charlotte, had a density of 1,685 per square mile (651 per square kilometer), while increasing its land area over the decade at twice the rate of Atlanta (Figure 7).

    Staying the Same

    Urbanization in the United States over the last decade can be characterized by the old French proverb that "the more things change the more they stay the same."

    As in Europe and elsewhere (see the Evolving Urban Form series), when they move, Americans go to less dense areas such as to suburban and exurban areas within the larger metropolitan areas as well as smaller, lower density urban regions. The extent to which they move, however, will depend more upon economic improvement than the lure of core areas that, in reality, continue to lose younger people in their thirties while continuing not attracting their boomer parents as they get older.

    Wendell Cox is a Visiting Professor, Conservatoire National des Arts et Metiers, Paris and the author of “War on the Dream: How Anti-Sprawl Policy Threatens the Quality of Life

    —-

    Note 1: Urban Areas and Metropolitan Areas: An urban area is the area of continuous development and as Sir Peter Hall put it, is thus the "physical" urban form. The urban area is a similar, but fundamentally different concept than a metropolitan area and analysts routinely confuse the terms. The United States Census Bureau calls urban areas over 50,000 population "urbanized areas." The metropolitan area is larger, and includes one or more urban areas as well as economically connected rural areas. . The metropolitan area is the "functional" urban form. There is no rural territory within urban areas, but there can be substantial rural territory in a metropolitan area (For example, the US defines metropolitan areas by counties. This can lead to artificially large metropolitan areas. For example, the Riverside San Bernardino metropolitan area, in the West where counties tend to be larger, covers 27,300 square miles (a land area larger than Ireland). The Cleveland metropolitan area, with a principal urban area similar in population to Riverside-San Bernardino, covers only 2,000 square miles, because it is located in Ohio, where counties are smaller. At the same, the far lower population density of the Riverside-San Bernardino metropolitan area is despite the fact that the urban area is approximately 50 percent more dense than the Cleveland urban area

    Note 2: Historical Core Municipalities, Suburbs and Exurbs: For the purposes of this article, an area outside a historical core municipality is considered a suburb if it is in the urban area and an exurb if it is in the corresponding metropolitan area, but outside the principal urban area. Urban areas are delineated at a small census geographical area (the census block), which makes more precise analysis possible than is available at the county level, the lowest level at which domestic migration data is available.

    Note 3: Principal Urban Areas: The principal urban area is the urban area within a metropolitan area that has the largest population. For example, in the Riverside-San Bernardino metropolitan area, the Riverside-San Bernardino urban area is the principal urban area. Other urban areas, such as Murrietta, Hemet and Indio (Palm Springs) would be secondary urban areas.

    —-

    Photograph: Exurban St. Louis (photo by author)