Category: Suburbs

  • Tilting at (Transit) Windmills in Nashville

    As in other major metropolitan areas in the United States, Nashville public officials are concerned about traffic congestion and the time it takes to get around. There is good reason for this, given the research that demonstrates the strong association between improved economic productivity and shorter travel times to work. As Prudhomme and Lee at the University of Paris and Hartgen and Fields at the University of North Carolina Charlotte have shown, metropolitan areas tend to produce more jobs where employees are able to access a larger share of the jobs in 30 minutes.

    Ahead in Identifying the Problem: Moreover, Nashville officials are somewhat "ahead of the curve," since traffic congestion is far less severe there than in many other metropolitan areas. Among the 100 largest metropolitan areas in the United States, Nashville ranks 39th in the intensity of its traffic congestion, according to data compiled by INRIX, a traffic information firm. Nashville’s traffic congestion is even better compared to large Western European metropolitan areas .

    This favorable traffic situation is despite the fact that Nashville has among the lowest overall transit market shares in the United States or Western Europe (less than 0.5 percent of travel in the metropolitan area). The key to this success, like that of other American metropolitan areas in relation to their international peers is low density and decentralization of employment and other commercial locations.

    Missing the Point on Solutions: Yet, it is clear from an editorial in the Nashville Ledger that officials are inclined to embark on an expensive program of transit expansion. Judging from past experience, this   offers virtually no hope for reducing traffic congestion or for improving economic productivity in the Nashville metropolitan area.

    There are significant misperceptions among local officials about the potential outcomes of proposed commuter rail and bus rapid transit lanes. Perhaps the most important is the assumption that commuter rail and bus rapid transit will reduce travel times. In fact, at the national level, commuting by transit takes approximately twice as long as commuting by single occupant automobile, according to the Census Bureau’s American Community Survey for 2008 to 2010. Rail systems, such as subways (metros) and light rail do little better than transit in general, taking 95% longer than driving alone and two thirds longer than travel by car pools. There is thus virtually no hope that building new transit lines will reduce travel times.

    As often happens when costly new transportation programs are proposed, boosters often resort to erroneous information. The Nashville Ledger cites sources that indicate, for example, that suburban Franklin (in Williamson County, to the south of the Nashville-Davidson County core) has one of the longest work trip travel times in the nation. The reality is quite different. Franklin has an average work trip travel time (23.2 minutes), which is less than national average (25.3 minutes) and little more than Nashville-Davidson County (23.0 minutes).

    Nashville officials need look no further than their own eastern suburbs for evidence of the inability of new rail systems to reduce work trip travel times. In 2006, Nashville began commuter rail service from Lebanon, in Wilson County to downtown Nashville (the Music City Star). Currently, the Music City Star is locked in an intensive (and successful, according to the latest data) competition for last place in the number of riders among the nation’s commuter rail systems, just edging out Austin’s new lightly used system. Despite being the only first ring county with commuter rail service, Wilson County work trip travel times are longer than in the other first ring counties. Door-to-door travel times, which are the only travel times that count, have not been reduced by the rail line.

    Transit is About Downtown: Transit cannot be a comprehensive metropolitan transportation solution remotely competitive with automobile travel times, except to downtown. This is because the quicker, direct transit services from throughout the metropolitan area that are necessary to attract automobile drivers must focus on the most dense and largest employment center, which is downtown. The radial routes that may be capable of serving downtown effectively simply cannot be afforded for other areas of employment. Our research has indicated, the annual cost to provide automobile competitive transit service throughout an urban area in the United States would consume a huge share of the gross domestic product of any such area.

    In Nashville, downtown represents little more than 10% of the metropolitan area employment. Moreover, downtown Nashville represents a declining share of private sector employment in the metropolitan area. According to the Census Bureau’s County Business Patterns, the core Nashville ZIP codes that are served by shuttle buses from the commuter rail station lost 11% of their private sector jobs between 2000 and 2009 (latest data available). At the same time, private sector employment grew 4% in the balance of the Nashville metropolitan area (Note 1).

    Transit to Suburban Destinations: A Non-Starter: There have been proposals to require new suburban office development to be near transit stops. This would accomplish little, because transit access in areas other than downtown is so sparse. Among major metropolitan areas, nearly 65% of major metropolitan area workers are within walking distance of a transit stop, according to research by the Brookings Institution. But being near a transit stop does not mean that transit provides practical mobility to anything like 65% of jobs. The reality, according to the Brookings Institution data,  is that only 6% of jobs in the average metropolitan area of more than 1 million population can be reached by transit  by the average resident  in 45 minutes, a travel time nearly double that of the average commuter in the Nashville metropolitan area (Note 2). It seems likely that 30 minute transit access for commuters would be as low as 3% at the national level. This demonstrates the so frequently repeated fallacy equating access to a transit stop with usable access to the metropolitan area.

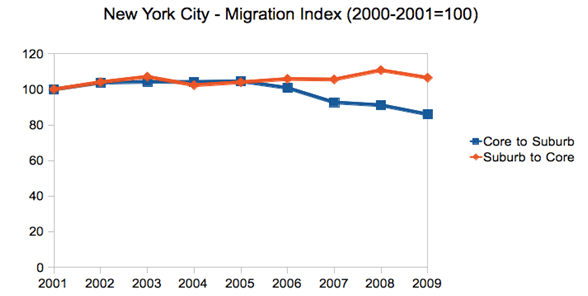
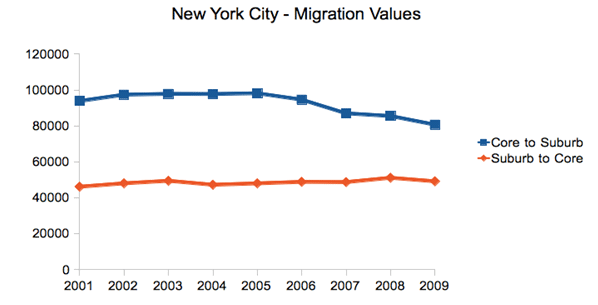
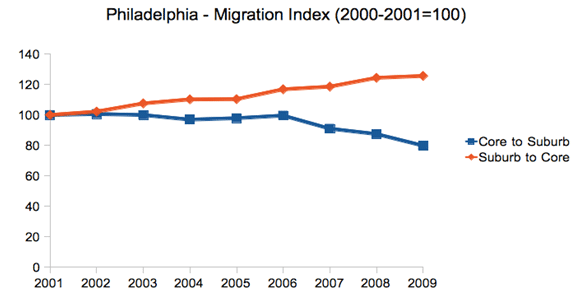
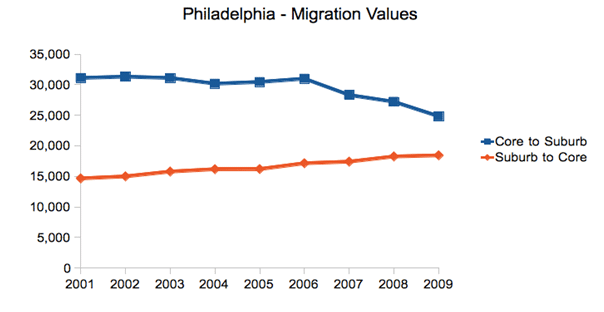
    Transit’s Large Downtown Niche Market: There is no question about the effectiveness (though not the cost efficiency) of transit in providing mobility along the most congested corridors to the nation’s largest downtown areas. This transit niche market accounts for nearly 75% of commuting to the Manhattan business core south of 59th Street, and more than 40% to the downtown areas of Brooklyn, Chicago, San Francisco, Boston and Philadelphia. Yet even in these metropolitan areas, where transit mobility is so important to downtown, transit work trip market shares to areas outside downtown are more akin to the national average of 5% (Figure), except in New York.

    Of course, Nashville’s downtown is not among these large transit-oriented cores. In 2000, census data indicated that 4% of employees commuted to downtown by transit. Even if all of the ridership on the Music City Star is made up of new downtown transit commuters, that figure would be little changed.

    The Need for Stewardship: Before Nashville commits hundreds of millions or billions of tax dollars to expensive transit projects transit in hopes of reducing traffic congestion or travel times, local officials should consider reality. Reducing traffic congestion and travel times are objectives generally beyond transit’s capability. Further, new lines can attract only a small share of commuters, because such a small share of jobs are downtown.

    —-

    Note 1: County Business Patterns provides employment information that largely excludes government employment. According to Bureau of Labor Statistics data, 53 percent of metropolitan Nashville’s increase in employment was government jobs between 2000 and 2009.

    Note 2: Calculated from Brookings Institution data.

    Photograph: Downtown Nashville from BigStockPhoto.com

    Wendell Cox is a Visiting Professor, Conservatoire National des Arts et Metiers, Paris and the author of “War on the Dream: How Anti-Sprawl Policy Threatens the Quality of Life

  • The Evolving Urban Form: Quanzhou

    Quanzhou? Quanzhou (pronounced "CHWEN-JOE"), despite its urban population that is approaching 5 million this urban area is so unfamiliar to Westerners and the rest of the world as to require an introduction. Quanzhou is a prefecture ("shi") in China’s Fujian province. Fujian is just to the north of Guangdong, home of Guangzhou, Shenzhen and Hong Kong’s former province (before the British) and just to the south of Zhejiang, the large rich province at the south flank of the Yangtze Delta (which abuts Shanghai). Quanzhou is also adjacent to Xiamen, one of the original special economic zones established by the legendary reformer Deng Xiao Ping.

    Quanzhou has more than 8 million people in an area similar in size to that of Los Angeles County (4,400 square miles or 11,200 square kilometers). Continuous urbanization spreads through 8 of Quanzhou’s 11 political subdivisions.  

    In Situ Urbanization: Quanzhou has experienced an unusual urban development pattern. Yu Zhu, Xinhua Qi, Huaiyou Shao and Kaijing He at Fujian Normal University have documented an "in situ" urbanization (or urbanization in place, rather than by expansion from a core) that involves conversion of rural areas in place to urban areas, with agricultural employment being replaced by non-agricultural employment. A similar process has been identified in the Indian state of Kerala and some other prefectures in south China. These could be the first natural examples that defy the expansion of urban areas from a core to the periphery that has been the rule since human kind gathered in settlements.

    Quanzhou: The Ultimate: Quanzhou appears to be the most extensive case of in situ urbanization in the world. The older multistoried and single family detached farm houses have become integrated into an urban fabric, though many are falling victim to demolition. Like the economic dynamos of Shenzhen, Dongguan and Guangzhou in Guangdong to the south, Quanzhou has become a major manufacturing center for exports and urbanization is intensifying.

    A Low Density Urban Area for China: The result of in situ urbanization has been a very low density urban area by Chinese standards- something more akin to what some Western planners decry as “sprawl”. Currently, the continuous urbanization of Quanzhou covers an area of more than 500 square miles (1,300 square kilometers) with an estimated population of more than 4.5 million people. At more than 9000 persons per square mile (3,500 per square kilometer), Quanzhou is a quarter more dense than Los Angeles, similar in density to Paris but slightly more than half as dense as Shanghai. Even at its   core, Quanzhou has comparatively low density compared to other Chinese urban areas. For example, the highest density local jurisdiction (Licheng) has a population density similar to that of the city of San Francisco (approximately 18,000 per square mile or 7000 per square kilometer). The three central jurisdictions of Shanghai are 8 times as dense.

    This low density pattern does not extend to nearby urban areas. For example, the core areas of Fuzhou, (Fujian’s capital), just 100 miles up the 8-lane freeway are four times as dense as the core of Quanzhou and the urban area more than double the density.

    Balanced Population Growth: Because it is urbanizing in place, Quanzhou’s population density is increasing throughout the large urban divisions. There is plenty of vacant land throughout the urban area for development, while redevelopment is also taking place at the usually hectic Chinese pace.

    The historic core jurisdictions of Licheng and Fengze grew approximately 30% between the 2000 and 2010 censuses. The largest nearby urban jurisdictions, Jin Jiang and Shi Shi combined for a population increase of approximately 34%, while the outer metropolitan jurisdictions grew only 3%. The outer jurisdictions have far more rural land and are less attractive to residents since low automobile ownership makes them less accessible (see table). There was a population loss of 6 percent in the rural jurisdictions, which is typical for China, as people move for better lives to the urban areas.

    Quanzhou (Fujian) Population Trend by Sector
    Sector 2000 2010 Change % Change
    Jurisdictions with Substantial Urbanization
    Historic Core: Licheng & Fengze      690,000      898,000    208,000 30%
    Near Urban (Jin Jiang & Shi Shi)   1,978,000   2,660,000    682,000 34%
    Outer Urban & Exurban   2,785,000   2,864,000      79,000 3%
    Balance of Prefecture (Principally Rural)   1,830,000   1,719,000  (111,000) -6%
    Total   7,283,000   8,141,000    858,000 12%
    Note: Urban extent estimated at over 4.5 million in 2010

    A Multi-Centric Urban Area: As would be expected in such a low density urban area, Quanzhou is multi-centered, following the pattern of urban areas like Los Angeles, Houston, and Mexico City. The largest center is the historic core, which is divided between Licheng and Fengze (Photograph: Historic core). This core is genuinely historic, with the Kaiyuan Temple (Buddhist) complex dating from 686 AD. Two similar towers (one shown above) were built during the Song Dynasty.


    Historic Core

    But the historic core has substantial modern development. There is extensive new residential high rise and mid-rise development on an island in the Jin river, which is the southern border of Fengze, just north of Jin Jiang. The new high speed rail station is located far from this core and more remote than the major airport, which is located in Jin Jiang.

    There is another strong center in Shi Shi, which is 12 miles (20 kilometers) southeast of the historic core. Shi Shi has a large stock of medium rise buildings and has a small, though dense core (Photograph: Shi Shi core). There are also a number of large residential developments under construction in Shi Shi and major parts of the old core are under redevelopment.


    Shi Shi Core

    Jin Jiang is the largest of the jurisdictions in the metropolitan area, with nearly one quarter of the population. It is located just across the Jin River from Fengze. Jin Jiang also has a commercial core (Photograph: Jin Jiang core), though it is less concentrated than the historic core and the core of Shi Shi. Jin Jiang is also home to the airport serving Quanzhou. New, large multi-building high-rise residential development are under construction in many areas of Jin Jiang.


    Jin Jiang Core

    Vanishing Old China: Quanzhou may be the best place to see remnants of China’s urbanization that preceded the rise of places like Shanghai, Beijing, Wuhan and Chengdu. All three of the largest urban jurisdictions are modern, but each has areas with the dusty roads one would expect to see in a lower income nation. At the same time, Quanzhou is on its way to becoming one of the large, prosperous urban areas of China. Already its gross domestic product and the population of its urban extent exceeds that of Fuzhou, the provincial capital. Most typical throughout urban Quanzhou are the multiple building high rise residential developments typical of all large Chinese urban areas. At the same time, there are wide expanses of demolition, where the remnants of the older buildings remain, as sites are readied for more modern projects.

    Replicability? The process of in situ urbanization requires very high rural densities that can equal or exceed the 1000 per square mile or 400 per square kilometer standard used to delineate urban areas by census authorities in Canada, France, the United Kingdom, the United States and some other nations. There would simply be too much space between villages and houses in the rural areas of places like Kansas, Saskatchewan or the Ukraine. As a result, it situ urbanization is likely to remain the rare exception. However, if the world, especially Europe, were to follow the integrative urban-rural model suggested by Thomas Sieverts at the University of Darmstadt (Cities without Cities), something like in situ urbanization would be the result.

    Lead Photo:
    Zenguo Tower at Kaiyuan Temple, Licheng district of Quanzhou (all photos by author)

    See the attached file for 100 more photos of the region.

    Wendell Cox is a Visiting Professor, Conservatoire National des Arts et Metiers, Paris and the author of “War on the Dream: How Anti-Sprawl Policy Threatens the Quality of Life

  • Is Suburbia Doomed? Not So Fast.

    This past weekend the New York Times devoted two big op-eds to the decline of the suburb. In one, new urban theorist Chris Leinberger said that Americans were increasingly abandoning “fringe suburbs” for dense, transit-oriented urban areas. In the other, UC Berkeley professor Louise Mozingo called for the demise of the “suburban office building” and the adoption of policies that will drive jobs away from the fringe and back to the urban core.

    Perhaps no theology more grips the nation’s mainstream media — and the planning community — more than the notion of inevitable suburban decline. The Obama administration’s housing secretary, Shaun Donavan, recently claimed, “We’ve reached the limits of suburban development: People are beginning to vote with their feet and come back to the central cities.”

    Yet repeating a mantra incessantly does not make it true. Indeed, any analysis of the 2010 U.S. Census would make perfectly clear that rather than heading for density, Americans are voting with their feet in the opposite direction: toward the outer sections of the metropolis and to smaller, less dense cities. During the 2000s, the Census shows, just 8.6% of the population growth in metropolitan areas with more than 1 million people took place in the core cities; the rest took place in the suburbs. That 8.6% represents a decline from the 1990s, when the figure was 15.4%.

    Nor are Americans abandoning their basic attraction for single-family dwellings or automobile commuting. Over the past decade, single-family houses grew far more than either multifamily or attached homes, accounting for nearly 80% of all the new households in the 51 largest cities. And — contrary to the image of suburban desolation — detached housing retains a significantly lower vacancy rate than the multi-unit sector, which has also suffered a higher growth in vacancies even the crash.

    Similarly, notes demographer Wendell Cox, despite a 45% boost in gas prices, the country gained almost 8 million lone auto commuters in the past 10 years. Transit ridership, while up slightly, is still stuck at the 1990 figure of 5%, while the number of home commuters grew roughly six times as quickly.

    In the past decade, suburbia extended its reach, even around the greatest, densest and most celebrated cities. New York grew faster than most older cities, with 29% of its growth taking place in five boroughs, but that’s still a lot lower than the 46% of growth they accounted for in the 1990s. In Chicago, the suburban trend was even greater. The outer suburbs and exurbs gained over a half million people while the inner suburbs stagnated and the urban core, the Windy City, lost some 200, 000 people.

    Rather than flee to density, the Census showed a population shift from more dense to less dense places. The top ten population gainers among metropolitan areas — growing by 20%, twice the national average, or more — are the low-density Las Vegas, Raleigh, Austin, Charlotte, Riverside–San Bernardino, Orlando, Phoenix, Houston, San Antonio and Atlanta. By contrast, many of the densest metropolitan areas — including San Francisco, Los Angeles, Philadelphia, Boston and New York — grew at rates half the national average or less.

    It turns out that while urban land owners, planners and pundits love density, people for the most part continue to prefer space, if they can afford it. No amount of spinmeistering can change that basic fact, at least according to trends of past decade.

    But what about the future? Some more reasoned new urbanists, like Leinberger, hope that the market will change the dynamic and spur the long-awaited shift into dense, more urban cores.

    Density fans point to the very real high foreclosure rates in some peripheral communities such as those that surround Los Angeles or Las Vegas. Yet these areas also have been hard-hit by recession — in large part they consist of aspiring, working class people who bought late in the cycle. Yet, after every recession in the past, often after being written off for dead, areas like Riverside-San Bernardino, Calif., have tended to recover with the economy.

    Less friendly to the meme of density’s manifest destiny has been a simultaneous meltdown in the urban condo market. Massive reductions in condo prices of as much as 50% or more have particularly hurt the areas around Miami, Portland, Chicago and Atlanta. There are open holes, empty storefronts, and abandoned projects in downtowns across the country that, if laid flat, would appear as desperate as the foreclosure ravaged fringe areas.

    In many other cases, the prices never dropped because the owners gave up selling condos and started renting them, often to a far lower demographic (such as students) than the much anticipated “down-shifting” boomers. Contrary to one of the most oft-cited urban legends by Leinberger and his cohorts, demographics do not necessarily favor density. Most empty-nesters and retirees, notes former Del Webb Vice President of Development Peter Verdoon, prefer not just outer suburbs but increasingly “small towns and rural areas” Dense cities, he notes, are a relatively rare choice for those seeking a new locale for their golden years.

    Verdoon’s assertion is borne out by our own analysis of the 2010 Census. Generally speaking, aging boomers tended to move out of dense urban cores, and to a lesser extent, even the suburbs. If they moved anywhere, they were headed further out in metropolis towards the more rural area. Among cities the biggest beneficiaries have been low-density cities in the Southwest and southern locales such as Charlotte, Raleigh and Austin.

    What about the other big demographic, the millennials? Like previous generations of urbanists, the current crop mistake a totally understandable interest in cities among post-adolescents. Yet when the research firm Frank Magid asked millennials what made up their “ideal” locale, a strong plurality opted for suburbs — far more than was the case in earlier generations.

    Generational analysts Morley Winograd and Mike Hais note that older millennials — those now entering their 30s — are as interested in homeownership as previous generations. This works strongly in favor of suburbs since they tend to be more affordable and, for the most part, offer safer streets, better parks and schools.

    In the short run, suburbia’s future, like that of much of real estate market, depends on the economy. But even here trends may be different than the density lobby suggests. As housing prices fall, the much ballyhooed trend toward a “rentership” society may weaken. Already in many markets such as Atlanta, Las Vegas and Minneapolis and Phoenix it is cheaper to own than rent, something that favors lower-density suburban neighborhoods.

    Longer term, of course, suburbs, even on the fringe, will change as growth restarts. Cities here and around the world tend to expand outward, and over time the definition of the fringe changes. To be sure, some fringe communities, particularly in highly regulated and economically regressive areas, could indeed disappear; but many others, particularly in the faster growing parts of the country, will reboot themselves.

    They will become, as the inner suburbs already have, more diverse with many working at home or taking shorter trips to their place of work They will become less bedrooms of the core city but more self-contained and “village like,” with shopping streets and cultural amenities near what will still be a landscape dominated primarily by single-family houses.

    In fact the media reports about the “death” of fringe suburbs seem to be more a matter of wishful thinking than fact. If the new urbanists want to do something useful, they might apply themselves by helping these peripheral places of aspiration evolve successfully. That’s far more constructive than endlessly insisting on — or trying to legislate — their inevitable demise.

    This piece first appeared at Forbes.com.

    Joel Kotkin is executive editor of NewGeography.com and is a distinguished presidential fellow in urban futures at Chapman University, and an adjunct fellow of the Legatum Institute in London. He is author of The City: A Global History. His newest book is The Next Hundred Million: America in 2050, released in February, 2010.

    Photo courtesy of BigStockPhoto.com.

  • Will You Still House Me When I’m 64?

    In the song by the Beatles, the worry was about being fed and needed at 64. Things have changed. If the Beatles wrote those lyrics today, the worry instead might be about housing.

    Australia’s aging population is an inevitability. As our replacement rate falls (we’re having fewer children per family) and life expectancy extends, the proportion of over 65s will double in 40 years. In raw numbers, there were 2.5 million over 65s in 2002, and this will rise by 6.2 million in 2042. That’s an extra 4 million in this demographic. Have we given enough thought to where they’re going to live, and what styles of housing they might prefer?

    There have been a number of developers who have understood the looming significance of Australia’s aging population, and who have sought to supply the ‘retirement living’ market with product that suits. At one end have been the glitzy apartment style residences in inner city locations, while at the other have been the aged care ‘homes’ provided for those in need of access to nursing care or medical assistance, or at least the reassurance of it being present.

    Running parallel with the provision of retirement living or seniors living projects has been an assumption that, once ready to abandon the family home of many years, seniors will be happy to move across town and relocate to the facilities that are available. Perhaps this is hangover from the days when retirement or aged care living was provided on Stalinist lines: our oldies were forcibly shuffled off to some retirement centre well away from the rest of the community they grew up in. A sort of gulag for grumpies?

    But what if seniors simply want a change of housing style within their community? What if they don’t want to move across town to the only available accommodation because they would prefer to continue to live in the neighbourhood and community they have spent a large part of their lives living in? They may want to continue to shop with ‘their’ local butcher, visit their local supermarket, newsagent, bank branch (if it still exists) and generally remain connected to the people and places that they’re familiar with – including (quite possibly) members of their family, children and grandchildren.

    Meeting that need in the future is going to be close to impossible unless planning schemes (old fashioned zoning laws) adopt a more flexible approach. Flexibility will be needed because most of the existing suburbs of our major population centres are largely built out and will require retrofits and redevelopment of existing stock to accommodate senior’s housing preferences. Generally, the only tracts of undeveloped land capable of meeting seniors housing needs tend to be on the outskirts and while there’s nothing wrong with fringe development, it seems unfair to expect seniors to relocate across town to regions they’re unfamiliar with and to alienate themselves from their community simply because supply side mechanisms (controlled by planning schemes) don’t permit choice.

    Further, the built out status of our ‘established’ suburbs – as they now stand – is something that much planning law seems to want to preserve for time immemorial. It’s a little bit like imagining that someone has declared the existing housing mix and styles a fixture of permanency: let’s put a giant glass dome over it all and call the city a museum – because we don’t (it seems) want anything to change.

    But if we are to allow Australia’s seniors to ‘age in place’ and to ensure our markets provide choice, it’s going to mean some things will need to change, given the likely levels of future demand. The fastest growth of aging populations will be around our ‘middle ring’ suburbs and given the overwhelming preference to ‘age in place’, it is these suburbs that are going to have to change if those needs are to be met.

    What will that change look like? The psychology of seniors in years to come – even today – is going to be different to those of previous generations. They’ll likely be more active rather than sedentary. The family home that’s served them to this point may now be simply too big for their needs, or contain too many stairs (the artificial hip or knee doesn’t like too many stairs). Their future housing needs will vary widely – some will be happy with apartments in high to medium density developments (elevators to their level of living means no stairs) while others (generally the majority) will prefer smaller, detached or semi-detached, single level dwellings. Many may want a small yard or garden (or at least a large balcony or terrace if in a unit), and perhaps want to keep a small pet dog or cat. They may want a spare bedroom for visitors or for babysitting grandchildren. They will probably prefer to be close to shops and near to public transport. And the majority will want to find something of that nature generally within the same community they’ve been living in. It is unlikely they’ll be searching for the ‘retirement home’ style of assisted care living until they’re well into their later years when their choices will be more limited.

    Their problem will be that developers will struggle under current planning schemes to get approval for semi-detached housing designed with seniors in mind, if it means amalgamating some detached residential dwellings near local shops, because that land use is highly protected. They will struggle to gain approval to convert a large single site into medium or high rise in areas near local shops or transport, because the community will likely object – particularly if it’s in a neighbourhood where low density prevails (typical of most of suburban Brisbane). Advocates of Transit Oriented Development (TOD) style development might now be shouting at this article that ‘TODs are the answer.’ That might be so, if only one single TOD had been delivered during the past 15 years we’ve been talking about them.

    Plus, the majority of proposed ‘TOD’ style development areas largely surround inner city transport nodes. Not much use if you’re in Aspley and want to stay there. And of course there’s the reality that multi level apartments are much more costly to develop and construct than the cottage building industry’s approach to single level, small detached housing.

    The changes needed need not be dramatic, and subtle changes to land use surrounding existing retail or service centres in middle ring suburbs ought to be able to be achieved with minimal planning fuss. It is still possible to imagine something being done with minimal planning fuss, but very difficult to point to any actual examples. Still, hope springs eternal.

    The changes could allow (for example) for some amalgamations of larger lot, detached post war homes into higher density cottage-style dwellings on a group title, still single level and with low construction costs. A 2000 square metre amalgamation could in theory provide 10 such cottages, with private garden space and minimal likelihood of community objection. The key would be to keep regulatory costs down, so punitive development levies would be out of order. After all, the infrastructure already exists and seniors tend to be much less demanding on utilities or services than young households. (Have a think about how little garbage they generate, or how little water they use as an illustration. It would surely be unfair to tax seniors in this type of housing for infrastructure upgrades under the circumstances?).

    The traditional ‘retirement home’ or ‘aged care’ model of seniors housing is still going to be needed, especially as people require more frequent or acute care in their later years, and become less and less independent. But there will be a good 10 to 15 year period for people for whom the family home no longer suits, and who aren’t yet ready for ‘God’s waiting room.’ How we accommodate this coming bubble of seniors who want to age in place and continue to live independently, and how planning schemes will allow markets to provide choice and diversity, is something that perhaps should be a policy focus now.

    Ross Elliott has more than 20 years experience in property and public policy. His past roles have included stints in urban economics, national and state roles with the Property Council, and in destination marketing. He has written extensively on a range of public policy issues centering around urban issues, and continues to maintain his recreational interest in public policy through ongoing contributions such as this or via his monthly blog The Pulse.

    Photo by BigStockPhoto.com

  • The Evolving Urban Form: Delhi

    It has been a time of ups and downs for Delhi, which has emerged as the largest urban area (area of continuous urban development) in India. By a quirk in the Census of India definitions, an urban area (urban agglomeration) may not cross a state or territorial boundary. As a result, Delhi continues to be the second largest urban area in India according to the Census of India.

    However, as a Population Reference Bureau reported, the population of the urban expanse of Delhi had exceeded that of Mumbai by 2007 to become the largest urban area. In 2007, the Population Reference Bureau noted that the continuous urbanization of Delhi extended into the adjacent states of Haryana and Uttar Pradesh (which has largest population of any sub-national jurisdiction in the world).

    In 2010, the United Nations placed the Delhi urban area population above that of all other urban areas in the world with the exception of Tokyo. This second ranking position was only temporary, since new census data showed stronger growth in Jakarta (Jabotabek) and Seoul. These developments, along with a smaller than anticipated population in the interstate Delhi urban area dropped Delhi to fourth position after the 2011 census. Even so, with its stronger growth, and given the plummeting birth rates in Korea, it can be expected that Delhi will exceed the population of Seoul within one or two years.

    Delhi has experienced some of the quickest and most substantial urban growth in the history of the world. Since the 1951 census, Delhi has grown from under 1.5 million people to a population of 22.6 million in 2011 (Figure 1). Delhi has been one of the fastest growing urban areas in history and (along with Jakarta, Seoul and Manila) has added approximately 20 million people over the past 60 years. Only Tokyo has added more new residents than these four urban areas, (25 million population).

    The national capital of India is the city of New Delhi (Note 1), which is a district of the National Capital Territory of Delhi. New Delhi is a fully planned national capital that is among the most impressive in the world, with broad expanses of green space not unlike that of Washington, DC. New Delhi became the capital in 1911, replacing Kolkata and much of the planned capital area was completed by the 1930s.

    An Interstate Urban Area

    This interstate urban area includes all of the urbanization of the National Capital Territory, which includes the urban core, as well as the adjacent Gahziabad and the Noida urban areas in the state of Uttar Pradesh and the Faridibad and Gurgaon urban areas in the state of Haryana.

    Between 2001 and 2011 (Figure 2):

    • The population of the inner area, which includes New Delhi and the Central, North, Northeast and East districts of the National Capital Territory grew 15 percent. This area accounted for 10 percent of the urban area growth.  Consistent with the experience of other inner areas (such as Mumbai, Shanghai, Chicago and Kolkata), inner core of this area (New Delhi and the Central District) lost population between 2001 and 2001 (14 percent).
    • The balance of the urban area inside the National Capital Territory grew by 2.8 million people, an increase of 33%. This area captured 47% of the interstate urban area population growth.
    • The urban areas outside the National Capital Territory grew slightly less, at 2.7 million and accounted for 44% of the interstate urban area population growth. These outer areas grew by far the fastest, from 2.6 million to 5.3 million, an increase of .


    Map of Dehli districts courtesy of wikipedia user Deeptrivia

    Between 2000 and 2011, the strongest growth was in the urbanization in Uttar Pradesh and to the southwest in Haryana.

    Gurgaon (photograph below), in Haryana, abuts Indira Gandhi International Airport on the south side, has emerged as an important corporate and information technology center. Gurgaon grew from 250,000 people in 2001 to 900,000 in 2011.

    Ghaziabad (photograph below), in Uttar Pradesh, is located adjacent to Delhi’s Northeast district and is the largest of the urban expanses beyond the National Capital Territory, having grown from approximately 975,000 people 2001 to more than 2,350,000 people in 2011.

    Noida (photograph below), in Uttar Pradesh, is another business center, is a special econonomic zone and includes a software technology park). Noida is located in Delhi and grew from approximately 300,000 in 2001 to nearly 650,000 in 2011.

    Faridabad (photograph below), in Haryana, is located directly to the south of the National Capital Territory and had the slowest percentage growth among the urban expanses beyond the National Capital Territory, growing from 1,050,000 people in 2001 two 1,400,000 people in 2011.

    The preponderance of growth in the suburban areas mirrors the trend in the previous census. Between 1991 and 200l, 26% of the growth was in the inner area and 74% of the growth in the outer areas of the National Capital Territory.

    Common Threads

    Even with its somewhat less than expected growth over the past decade, the Delhi continues to be among the fastest growing metropolitan regions in the world. Including adjacent rural areas, the Delhi metropolitan region (Note 2) added approximately 6.0 million people between 2001 and 2010 (growing from 20.4 million to 26.4 million). This compares to the 10 year gain of 7.4 million in Jakarta, 6.6 million in Manila and Shanghai and 6.1 million in Beijing.

    The Delhi urban area illustrates the same pervasive urban growth trend evident around the world. As urban areas become larger, they tend to grow most rapidly on their periphery as opposed in the core. As a result, contrary to popular misconception, they are overall becoming become less dense. In Delhi, as well as in all of the other urban areas or metropolitan regions examined in the Evolving Urban Form series, growth is concentrated in the suburbs and further out on the periphery.

    —-

    Note 1: The city of New Delhi is officially the capital of India. It is, however, only a small part of the National Capital Territory of Delhi. The city of New Delhi had a population of 134,000 in 2011, down one-quarter from 169,000 in 2001. While the term "New Delhi" has often been used to denote the urban agglomeration, both the government of India and the United Nations refer to the urban agglomeration as Delhi.

    Note 2: This metropolitan region definition includes the National Capital Territory and the Ghaziabad and Gatam Buddha Nagar (Noida) districts of Uttar Pradesh and the Gurgaon and Faridabad districts of Haryana (districts are analagous to counties in the United States).

    Top Photograph: India Gate in New Delhi. All photos by author

    Wendell Cox is a Visiting Professor, Conservatoire National des Arts et Metiers, Paris and the author of “War on the Dream: How Anti-Sprawl Policy Threatens the Quality of Life

  • Back to the City?

    The 2010 Census results were mostly bleak for cities, especially for those who believed the inflated hype about the resurgence of the city at the expense of the suburbs.  Despite claims of an urban renaissance, the 2000s actually turned out to be worse than the 1990s for central cities.  The one bright spot was downtowns, which showed strong gains, albeit from a low base.  The resurgence of the city story seemed largely fueled by intra-census estimates by the government that proved to be wildly inflated when the actual 2010 count was performed.

    But beyond the headline numbers, there is intriguing evidence of a shift in intra-regional population dynamics in the migration numbers. The Internal Revenue Service uses tax return data to track movements of people around the country on a county-to-county and state-to-state basis. These can be used to look at movements of people within a metro area.

    Because this data is at the county level, it does not map directly to what we might think of as the “urban core” as most counties that are home to central cities contain large suburban areas as well. There are also areas inside many central cities themselves that are suburban in their built form.

    However, there are a limited number of cities that have combined city-county definitions that approximate the urban core. Looking at a few of these – New York, Philadelphia, San Francisco, and Washington, DC – we see that over the 2000s out-migration from the core to the suburban counties was relatively flat or even declined late in the decade as general mobility declined in the Great Recession. In contrast, migration from the suburban counties to the core stayed flat or actually increased, even late in the decade when again overall migration declined nationally.

    It should be stressed that the overall trend is still that of net out-migration from the core to the suburbs. But in searching for any potential inflection point, changes in the dynamics are clearly of interest.

    New York City

    First let us look at New York City. The city proper consists of five boroughs, each of which is a separate county. Treating the city as a whole as the core reveals these migration trends during the 2000s:


    Note: Core defined as the five boroughs of New York City

    This chart renders migration as an index, to show changes in in- and out-migration on the same scale. This should not be confused with the total number of people moving, which still shows overall net out-migration, though the trend lines show the same dynamic as above:


    Note: Core defined as the five boroughs of New York City

    Philadelphia

    Perhaps the most dramatic shift in these four cities was in Philadelphia, where the central city actually gained population for the first time since 1950.

    Here are the raw migration numbers, which again show net out-migration, but a distinct shift over the decade.

    San Francisco

    The Bay Area has been divided into two metro areas by the government, San Francisco and San Jose. Therefore, an intra-regional migration analysis looking at San Francisco alone will miss certain migration within the broader Bay Area. With that caveat in mind, we see again the same trend, albeit somewhat less pronounced:

    And here are the total migrants:

    Washington, DC

    Due to its very nature as a government town, Washington’s migration patterns differ from the many other cities. However, it has still experienced the same suburbanization phenomenon as the rest of America, and the same changes in intra-regional migration dynamics as the other cities highlighted here, though we see the shift beginning only in mid-decade:

    And the raw values:

    Conclusion

    Given the overblown triumphalist rhetoric about the urban core that ultimately hasn’t been backed up by the data, we should be cautious about reading too much into this. Again, net migration remains outward towards the suburbs and away from denser cities to smaller, generally less dense ones (from Chicago to Indianapolis or New York to Raleigh). Overall city population figures were disappointing. And the housing crash and the Great Recession have clearly wreaked havoc with migration patterns on a national level.

    Still, these are clearly figures that should inspire some at least small-scale optimism in urban advocates.  There has clearly been a shift affecting the net migration in these cities. And the same pattern is visible, though less easily attributable to just the urban core, in a large number of other metros around the country.  In particular, the fact the in-migration from the suburbs to the core held steady or even increased is a sign of some urban health.

    Back to the city as a mass movement?  Not yet.  But it’s certainly an improvement. These intra-regional migration statistics are key figures to keep an eye on as we look for any sign of a true inflection point in the overall population trends for America’s urban centers. The whole pattern could also shift again — in one direction or the other — as the economy, albeit slowly, comes back to life and people once again get back into the housing market.

    Aaron M. Renn is an independent writer on urban affairs based in the Midwest. His writings appear at The Urbanophile, where this piece originally appeared. Telestrian was used to analyze data and to create charts for this piece.

    Chicago photo by Storm Crypt / Flickr

  • Brand Loyalty Dominates Trip to Work

    Many public sector mavens watch like the Dow Jones average the shares of workers using various modes of transportation on work trips to see how their favorite mode is doing.  One shouldn’t be surprised when a certain hyperbole creeps into the interpretation of the trends.   But in reality not a whole lot is changing, despite many assertions of ballooning growth from some sectors. 

     We should start in 1960 with the first census to cover the Journey to Work.  Back then about two-thirds of workers used a car or truck. More interestingly 13% were on transit, 10% walked and 7% worked at home (think farmers).   As Figure 1 indicates, effectively all of the growth in the last 50 years has occurred in the private vehicle mode.  The melding here of walking and working at home misleads a bit because walking has continually declined while, due to the internet, working at home – once the farm decline reached bottom – has been the “mode” with the greatest and most consistent share of growth in the period.


    Source: 1960-2000 decennial Census; 2010 ACS

    Meanwhile the transit and walk modes have declined in share since the last half century but seem more recently to have bottomed out and reached some base level. 1

    Table 1 shows the relatively stable pattern for the last 20 years in broad terms. 

    1990 decennial

    2000 decennial

    2010

    ACS

    WORKERS

    100%

    100%

    100%

    DRIVE ALONE

    73%

    76%

    77%

    CARPOOL

    13%

    11%

    10%

    TRANSIT

    5%

    5%

    5%

    TAXI 

    0%

    0%

    0%

    BICYCLE

    0%

    0%

    0%

    WALKED

    4%

    3%

    3%

    OTHER

    1%

    1%

    1%

    WORKED AT HOME

    3%

    3%

    4%


    For Figure 1 and Table 1, the 2000 and earlier data are from the decennial censuses. The 2010 data are from a new source, the American Community Survey, which seeks to replicate the census structure.   These data are therefore not strictly comparable.  It has been observed that the ACS has tended to understate carpooling and overstate transit despite best efforts to assure comparability.

    Given the breadth of coverage of the census, it has immense value but a better handle on the mode share question can be found in the National Household Travel Survey (NHTS) of the Federal Highway Administration.  It replicates the census question asking about the usual mode of commuting, but it asks it as part of a collection of a complete diary of a day’s travel for each member of the household. It gets the what did you do yesterday response as well for the same person.   That means we can compare the person’s responses to the two separate queries and learn a great deal about the relationships between the responses. 

    This comparison between census and NHTS products helps state and metro planners know how their surveys might map to the census and helps test the utility of the census products. Just as importantly, it provides a comparison between what people say they do and what they actually do and it tells more about what alternatives travelers shift to when they don’t do “the usual”.   

    When the NHTS asks the question in the “actually-did-yesterday” format things change, in some cases appreciably.

    ‘Usual’

    On  Travel  Day Commuted   by:

    Commute

     Mode:

    Drove Alone

    Carpool

    Transit

    Walk

    Bike

    Other

    Drove Alone

    93.5

    5.6

    0.1

    0.5

    0.1

    0.4

    Carpool

    42.9

    54.8

    0.5

    1

    0

    0.8

    Transit

    13.2

    9.2

    68.3

    6.6

    0.8

    1.9

    Walk

    6.1

    9.3

    3.4

    80.2

    0.2

    0.7

    Bike

    13.8

    3.3

    6

    2.6

    73

    1.4

    Other

    64.1

    19

    4.2

    4.3

    0.3

    8

    Source: NHTS 2009

    Quick Findings

    If we study the yellow boxes we see the “loyalty” relationship between what people say they do and what they actually do.   There are some interesting stories here.

    Drove alone:  According to the NHTS, 93.5% of the people who said they usually drive alone to work actually did.  When they didn’t they almost exclusively shifted to carpooling, with only about 1% shifting out of the auto mode.  This is basically identical to the responses in the 2001 NHTS.2

    Transit:  Only about 68.3% of usual transit users actually used it on a specific day.  The big shift is to the auto-based modes, solo driving or pooling, accounting for more than three quarters of the shift, with the remainder largely shifting to walking.  This is almost the identical loyalty share observed in 2001, but with greater shifts to the auto instead of walking.

    Walking:  Surprisingly about 80% of those who say they usually walk actually do.  Again, when these commuters don’t walk, about three/quarters of the shift is to the private vehicle, with the remainder largely shifting to transit. Also very similar in loyalty to 2001 measures, but showing some increase in transit shifts.  

    Bicycle:   biking exhibits a little less “loyalty” than walking and a little more than transit.   Biking showed a decrease in loyalty from the 77% observed in 2001, perhaps reflecting that the increases in biking we have seen among less inveterate bikers.  The shift to the auto-based modes is less pronounced than the other cases with about a 63% share of the shift.  Transit and walking each obtain appreciable shares of the remainder.   Use of the auto modes as an alternative increased substantially from 2001. 

    Carpooling:  Carpooling is the great surprise.  While transit exhibited the lowest level of loyalty of all modes in 2001 it was surpassed by carpooling in 2009.  Carpooling showed a dramatic decrease in loyalty from 75% in 2001 to 55%, in 2009.  The dominant shift is to driving alone with only about 2% shifting to non-auto modes.  So the auto-based share remains about the same as in 2001. 

    What to Make of All This

    In today’s world we have seen substantial increases in variability in trips to work  – variability  in time of departure, arrival, choice of route to work, even a choice as to whether or not one travels to work at all  with telecommuting becoming more significant every day.  We should not be surprised that there is variability in choice of mode of travel.  Some part of this may simply be that some workers see transit, biking, or walking as the socially preferred modes and will state so when asked – kind of the “good citizen” response – they know what they are supposed to want – “but yesterday was different!”    

    Clearly, auto users tend to remain auto users, with a 98-99% loyalty whether in a carpool or driving solo.  Shifting either way often means things like: the car is in the shop, my wife needs the car, or carpool buddy is on leave, lost a job, or busy doing something else.  This does tell us that carpooling is becoming less formal and more of an occasional and more flexible activity, abetted by cell phones and apps.  One could speculate that these workers often do not have a serious option to the auto.   

    Transit users’ swing is substantial, with significant implications.  Actual users come in at 3.7% of travel rather than the 5% shown for the “usually use” response.  About 3.5% are the usual transit riders who are actually using transit. In terms of survey response reliability we are dancing on the thin edge of trustworthy responses in terms of observation density.    But even with that caveat it would seem appropriate for transit providers to recognize that a significant portion of their riders are “in for the day” because their usual circumstance changed.  Also worth noting is that given that auto users are about 20 times the number of transit riders, an insignificant shift from auto to transit – unnoticeable on the roads – could swamp transit use.   If all the car users had their car in the repair shop once a month it could double transit use in most regions.

    Walkers and bikers, who are those most likely to be affected by weather, both do better than transit in terms of brand loyalty.  This may all be a product of trip length. It has been observed in the past that walkers have an average trip length that is typically so short (circa 15 minutes or about a mile)  that transit (given typical wait times of close to 15 minutes) is not a realistic option so on bad weather days the car may be the substitute. Bike trip lengths to work may be significantly longer than walking so that transit can become a viable option, depending on wait times and routing.    

    Alan E. Pisarski is the author of the long running Commuting in America series. A consultant in travel behavior issues and public policy, he frequently testifies before the Houses of the Congress and advises States on their investment and policy requirements.

    Photo by Nathan Harper, Bottleleaf

    —————–

    Wendell Cox covered this topic in greater detail in a recent New Geography posting Oct 17 2011

    Commuting in America III pg 63

  • More Americans Move to Detached Houses

    In defiance of the conventional wisdom in the national media and among most planning professionals, Americans continue not only to prefer, but to move into single family detached houses. Data from the 2010 American Community Survey indicates that such housing attracted 79.2% of the new households in the 51 major metropolitan areas (over 1,000,000 population) over the past decade.

    In contrast households in multi-unit buildings (apartments and condominiums) represented 11.8% of the new housing, while two-unit attached housing represented 11.3% of the increase. There was a 2.3% decline in the "other" category of new housing, which includes mobile homes and boats. A total of 4 million net new occupied detached houses were added in the largest metropolitan areas, while there were 590,000 additional apartments and condominiums and 570,000 attached houses (Figure 1).

    Detached Vacancy Rate Rises Less than Multi-Unit: Another conventional assumption is that single family homes have been disproportionately abandoned by their occupants, particularly since the collapse of the housing bubble. This is also not true. In 2010 detached housing enjoyed a 92.4% occupancy rate in 2010 which is higher than the 89.4% occupancy rate in attached housing and 84.2% occupancy rate in multi-unit buildings. Because a more of the multi-unit housing is rental, it is to be expected that the vacancies would be the highest in this category. However, at the national level, overall vacancy rates rose the most in multi-unit housing, with an increase of 61%, from 10.7% in 2000 to 17.1% in 2010. The vacancy rate in detached housing rose at a slower rate, from 7.3% in 2000 to 10.7% in 2010, an increase of 48%. Attached housing – such as townshouses – have the slowest rise in vacancy rate, from 8.4% in 2000 to 11.0% in 2010, an increase of 32% (Figure 2).

    Detached and Attached Up in Most Markets, Apartments and Condominiums Down in Most: The move to detached housing was pervasive at the major metropolitan area level. Among the 51 largest metropolitan areas, the share of detached housing rose in 44 and declined in seven. The share of attached housing rose in 32 of the metropolitan areas, while declining in 19. Multi-unit housing experienced an increase in its market share in only three markets, while declining in 48.

    Largest Metropolitan Areas: Detached housing also increased more than attached housing and multi-unit housing in each of the nation’s five largest metropolitan areas.

    • In the largest metropolitan area, New York, 51.9% of the new housing was detached. This is considerably more than the 36.9% detached market share in 2000. Multi-unit housing accounted for 24.1% of the increase in the market. This is a far smaller share than the 55.7% that multi-unit housing represented in 2000. Attached housing was 19.9% of the increase, nearly 3 times its 2000 share of 6.7%. This movement of New Yorkers to less dense housing forms is particularly significant, in view of the fact that New York has historically had the lowest share of lower density housing (detached and attached) and the highest share of multi-unit houses.
    • In the second largest metropolitan area, Los Angeles, 96.0% of the new housing was detached. This is nearly double the 49.7% that detached housing represented of the market in 2000. The balance of the new housing was split between a share of 18.6% for multi-unit housing and a loss of 11.8% in the attached housing. The share of new units represented by multi-unit houses was less one-half than its percentage of the market in 2000 (39.0%).
    • In the third largest metropolitan area, Chicago, 95.9% of the new housing was detached, well above the 52.5% share in 2000. There was a huge loss in apartment and condominium share, at 31% of the market, while attached housing captured 40.4% of the market.
    • In the fourth largest metropolitan area, Dallas Fort Worth, 84.3% of the new housing was detached, well above the 62.0% share in 2000. Multi-unit housing accounted for 13.5% of the increase, approximately one-half the 2000 market share. Attached housing represented 3.2% of the increase.
    • In the fifth largest metropolitan area, Philadelphia, 77.6% of new housing was detached, well above the 45.3% market share for detached housing in 2000. Apartments and condominiums accounted for 27.7% of the increase between 2000 and 2010, slightly more than the 2000 market share 23.7%. Attached housing represented a minus 4.3% of the new housing.

    Despite being only the fourth largest metropolitan area, Dallas-Fort Worth accounted for 46% of the new housing in the five largest metropolitan areas (Figure 3).

    The three largest metropolitan markets where there was an increase in multi-unit housing share were San Jose, New Orleans and Denver. In San Jose, 55.5% of new housing was multi-unit, while only 10.3 percent was detached. New Orleans had a similar 10.5% detached new housing share, while 65.8% of the new housing was multi unit. In Denver, 31.3% of the new housing was multi-unit, while 60.2% was detached.

    The share of detached housing also declined between 2000 and 2010 in Boston, Kansas City, Minneapolis-St. Paul and Portland. In each of these metropolitan areas, the share of attached housing increased, while the share of multi-unit housing decreased. Nonetheless, detached housing continued to attract a majority of new housing in Kansas City (70.8 percent) and Portland (56.6 percent). Despite Portland’s strong planning emphasis on high density housing, its share of multi-unit housing, and 26.8% between 2000 and 2010 was less than its 2000 market share of 27.5%, with a strong 20.6 percent share in attached housing. Attached housing also accounted for a comparatively large share of new housing in Boston (45.7 percent), Minneapolis-St. Paul (39.7 percent) and Kansas City (25.8 percent). The stronger densification policies that existed in Minneapolis-St. Paul until the middle of the decade may have artificially raised the share of attached new housing.

    Share by housing type data is provided for the major metropolitan areas in Tables 1 and 2.

    Table 1
    Occupied Housing by Major Metropolitan Area: 2000
    Metropolitan Area Detached Attached Multi-Unit Other
    Atlanta, GA 66.6% 3.5% 25.5% 4.4%
    Austin, TX 57.7% 3.7% 32.1% 6.6%
    Baltimore, MD 46.0% 28.5% 24.2% 1.3%
    Birmingham, AL 68.3% 2.6% 17.9% 11.2%
    Boston, MA-NH 48.9% 4.4% 45.4% 1.3%
    Buffalo, NY 60.0% 2.8% 35.1% 2.1%
    Charlotte, NC-SC 67.5% 3.4% 21.8% 7.3%
    Chicago, IL-IN-WI 52.5% 6.3% 40.1% 1.1%
    Cincinnati, OH-KY-IN 64.7% 3.6% 27.8% 3.9%
    Cleveland, OH 65.7% 5.5% 27.7% 1.2%
    Columbus, OH 62.8% 5.5% 29.1% 2.6%
    Dallas-Fort Worth, TX 62.0% 3.1% 30.3% 4.6%
    Denver, CO 60.9% 7.8% 29.0% 2.3%
    Detroit,  MI 70.5% 5.5% 20.7% 3.3%
    Hartford, CT 60.0% 5.2% 34.1% 0.8%
    Houston, TX 61.4% 3.6% 29.1% 6.0%
    Indianapolis. IN 68.4% 5.2% 23.2% 3.3%
    Jacksonville, FL 63.5% 3.9% 22.3% 10.3%
    Kansas City, MO-KS 71.3% 4.6% 21.4% 2.6%
    Las Vegas, NV 53.4% 6.0% 34.7% 5.9%
    Los Angeles, CA 49.7% 8.6% 39.6% 2.0%
    Louisville, KY-IN 70.7% 2.1% 22.2% 5.0%
    Memphis, TN-MS-AR 69.1% 3.8% 22.8% 4.2%
    Miami, FL 45.4% 9.9% 42.1% 2.6%
    Milwaukee,WI 55.7% 5.3% 38.3% 0.7%
    Minneapolis-St. Paul, MN-WI 62.8% 7.7% 27.4% 2.0%
    Nashville, TN 64.9% 4.4% 24.4% 6.2%
    New Orleans. LA 59.9% 7.7% 28.5% 3.9%
    New York, NY-NJ-PA 36.9% 6.5% 56.3% 0.4%
    Oklahoma City, OK 71.6% 3.1% 19.2% 6.0%
    Orlando, FL 61.5% 4.5% 25.1% 8.9%
    Philadelphia, PA-NJ-DE-MD 45.3% 29.8% 23.5% 1.4%
    Phoenix, AZ 61.6% 6.1% 24.9% 7.4%
    Pittsburgh, PA 68.8% 6.5% 20.4% 4.4%
    Portland, OR-WA 63.8% 3.3% 27.5% 5.5%
    Providence, RI-MA 54.3% 2.9% 41.6% 1.2%
    Raleigh, NC 63.6% 5.2% 21.5% 9.8%
    Richmond, VA 71.3% 4.9% 20.4% 3.4%
    Riverside-San Bernardino, CA 67.0% 5.1% 18.6% 9.3%
    Rochester, NY 65.7% 4.3% 26.5% 3.5%
    Sacramento, CA 66.1% 6.0% 24.0% 3.9%
    Salt Lake City, UT 67.0% 4.8% 25.4% 2.8%
    San Antonio, TX 67.4% 2.9% 22.2% 7.5%
    San Diego, CA 51.7% 9.4% 34.5% 4.4%
    San Francisco-Oakland, CA 50.3% 9.3% 39.1% 1.3%
    San Jose, CA 57.0% 9.1% 30.5% 3.4%
    Seattle, WA 60.2% 3.5% 31.6% 4.8%
    St. Louis,, MO-IL 70.2% 3.1% 21.9% 4.8%
    Tampa-St. Petersburg, FL 58.4% 4.6% 25.7% 11.4%
    Virginia Beach-Norfolk, VA-NC 61.4% 10.4% 25.2% 3.0%
    Washington, DC-VA-MD-WV 47.6% 19.4% 32.1% 0.8%
    Average (Weighted) 55.9% 7.5% 33.3% 3.3%
    Data from 2000 Census
    Metropolitan areas over 1,000,000 population as defined in 2010


    Table 2
    Occupied Housing by Major Metropolitan Area: 2010
    Metropolitan Area Detached Attached Multi-Unit Other
    Atlanta, GA 69.2% 5.3% 22.7% 2.7%
    Austin, TX 60.4% 2.6% 31.8% 5.1%
    Baltimore, MD 47.4% 27.3% 24.2% 1.1%
    Birmingham, AL 70.8% 2.4% 16.8% 10.0%
    Boston, MA-NH 48.7% 5.9% 44.2% 1.2%
    Buffalo, NY 62.3% 2.9% 33.0% 1.8%
    Charlotte, NC-SC 68.9% 5.1% 20.4% 5.6%
    Chicago, IL-IN-WI 54.2% 7.6% 37.1% 1.1%
    Cincinnati, OH-KY-IN 68.9% 4.8% 23.2% 3.1%
    Cleveland, OH 68.7% 5.1% 25.1% 1.1%
    Columbus, OH 64.1% 7.3% 26.6% 2.1%
    Dallas-Fort Worth, TX 65.9% 3.1% 27.4% 3.6%
    Denver, CO 60.8% 7.9% 29.4% 1.9%
    Detroit,  MI 71.6% 6.3% 19.1% 2.9%
    Hartford, CT 60.9% 5.3% 33.1% 0.7%
    Houston, TX 65.1% 3.5% 26.0% 5.3%
    Indianapolis. IN 71.3% 5.0% 21.1% 2.6%
    Jacksonville, FL 66.3% 4.8% 21.3% 7.6%
    Kansas City, MO-KS 71.3% 6.4% 20.1% 2.2%
    Las Vegas, NV 60.9% 5.4% 29.9% 3.8%
    Los Angeles, CA 51.0% 8.0% 39.0% 1.9%
    Louisville, KY-IN 71.6% 3.6% 20.9% 4.0%
    Memphis, TN-MS-AR 72.5% 3.3% 20.4% 3.7%
    Miami, FL 47.0% 10.8% 40.0% 2.1%
    Milwaukee,WI 56.2% 6.5% 36.5% 0.8%
    Minneapolis-St. Paul, MN-WI 61.5% 11.0% 25.9% 1.6%
    Nashville, TN 67.2% 5.6% 22.3% 4.9%
    New Orleans. LA 65.1% 6.1% 24.6% 4.2%
    New York, NY-NJ-PA 37.2% 6.7% 55.7% 0.4%
    Oklahoma City, OK 74.3% 3.0% 17.1% 5.6%
    Orlando, FL 64.1% 5.5% 23.4% 6.9%
    Philadelphia, PA-NJ-DE-MD 46.6% 28.5% 23.7% 1.3%
    Phoenix, AZ 67.2% 4.8% 22.2% 5.8%
    Pittsburgh, PA 69.4% 7.5% 19.1% 4.0%
    Portland, OR-WA 62.8% 5.5% 27.4% 4.3%
    Providence, RI-MA 55.7% 3.7% 39.6% 1.0%
    Raleigh, NC 65.4% 8.0% 20.5% 6.2%
    Richmond, VA 73.2% 4.9% 19.0% 3.0%
    Riverside-San Bernardino, CA 70.7% 4.3% 17.1% 7.9%
    Rochester, NY 66.9% 4.8% 25.3% 2.9%
    Sacramento, CA 68.8% 5.6% 22.6% 3.0%
    Salt Lake City, UT 67.8% 6.1% 23.9% 2.2%
    San Antonio, TX 70.8% 2.2% 21.1% 5.9%
    San Diego, CA 53.0% 9.0% 34.5% 3.5%
    San Francisco-Oakland, CA 50.7% 9.4% 38.8% 1.1%
    San Jose, CA 54.3% 10.7% 32.0% 3.0%
    Seattle, WA 60.5% 4.2% 31.5% 3.8%
    St. Louis,, MO-IL 70.8% 4.2% 21.1% 3.9%
    Tampa-St. Petersburg, FL 59.6% 5.6% 24.7% 10.1%
    Virginia Beach-Norfolk, VA-NC 62.5% 11.1% 24.0% 2.5%
    Washington, DC-VA-MD-WV 48.1% 19.6% 31.7% 0.7%
    Average (Weighted) 57.8% 7.9% 31.5% 2.8%
    Data from 2010 American Community Survey
    Metropolitan areas over 1,000,000 population as defined in 2010


    In Housing, Preference Trumps Policy: The trend of the last decade is evidence of a continued preference of American households for detached housing. The results are remarkable for at least two reasons:

    • The first is that there have been unprecedented policy initiatives to discourage, if not to prohibit the building of new detached houses. It seems likely that the miniscule new detached housing share in San Jose, for example, is a direct result of that metropolitan area’s virtual prohibition of new detached housing, rather than any evidence that households have begun to prefer higher density housing. A small detached housing share in the face of a strong public policy bias toward higher density housing says nothing about preferences.
    • Second; the media and wishful advocates of denser settlement patterns have continuously referred to detached housing as having been severely overbuilt during the housing bubble, while suggesting an imperative for households to move into multiunit, often rented housing. The new data, with the larger increase in multi-unit vacancy rates, indicates that there was at least as much overbuilding in more dense housing types as there was in detached housing.

    Despite the expressed preferences of planners, academics and even many builders, American households continue to make their own decisions about housing.

    Wendell Cox is a Visiting Professor, Conservatoire National des Arts et Metiers, Paris and the author of “War on the Dream: How Anti-Sprawl Policy Threatens the Quality of Life

    Lead photo: Houses in Los Angeles. Photograph by author.

  • Dense Urban Thinking Down Under

    Ku-ring-gai is a piece of suburban paradise in the inner rings of Sydney. A district of modest homes and quaint small-scale shopping districts, it sits near one of the last remaining stretches of blue-gum forest inside Australia’s largest city. You can still catch the occasional cockatoo luxuriating on a branch.

    First built around 1900, the neighborhood of 106,000 boasts all the charms of the classic “garden city,” balancing nature with modestly scaled development. Yet today the Ku-ring-gai community — including the remaining flora and fauna — is threatened with extinction by planners and developers seeking to pack the district with non-descript apartment tracks and ten-story commercial structures.

    “They’re doing everything they can to destroy this area,” says long-time community activist Kathy Cowley, a founding member of both Save Our Suburbs and Friends of Ku-ring-gai over lunch of meat pies and salad at her cottage. “They approach it as if it was a greenfield [or previously undeveloped] site for high-density housing. They are trying to destroy everything with bad planning.”

    Cowley speaks bitterly about how the state government of New South Wales, which controls development, cares little about disturbing a sensitive human as well as natural urban environment. Most of the new apartment dwellers, she notes, tend to be recently arrived residents. Many appear to be Chinese students, who ride on the surprisingly rickety trains largely to schools closer to Sydney’s center city.

    This assault on Cowley’s neighborhood reflects a peculiar density ideology that, although present in the United States, is far more powerful in New Zealand, Great Britain and Australia. Density advocates swear that everything from the necessities of economic competition to limited resources require “cramming” future populations in ever smaller spaces. It doesn’t matter that the population might object.

    In contrast, suburbs are constantly painted as on the verge of extinction. They are destined to become the dull victims of everything from demographics, “cool” migration, green ideology and the rise of “rentership” over home ownership to the ever-present, never-quite-happening “peak oil” that is destined to drive people out of their cars and into the inner cities.

    Economically, the density industry emphasizes the central city’s producer of high-end jobs tied particularly to financial services and its role as home to most universities, government institutions and media. But in the future, even elite industries seem more likely to disperse than concentrate. Look at high tech, where the vast majority of employment tends to be in suburban areas such as Silicon Valley, the counties surrounding Washington, D.C., and sprawling Durham, N.C.

    The same can be said in terms of demographics. Rather than becoming more dense, the vast majority of American cities have become more spread-out. The same has happened in many major metropolitan areas in advanced countries worldwide.

    The density obsession seems particularly ill-suited to Australia, a sparsely populated country where less than 0.2% of the land is urbanized, compared with less than 3% in the U.S. and around 6% for Great Britain.  But such thinking has taken root in this vast continent — to the detriment of many of its people.  ”The writing is on the wall for the Australian dream,” says Joe Flood, professor at the Flinders University Institute for Housing, Urban and Regional Research.

    Perhaps the biggest impact of pro-density policies has been rising land prices. State governments, which control most planning in Australia, along with their developer allies have discouraged development of new houses on greenfield sites, preferring to see the next generation of Australians living cheek to jowl close to the urban core.

    Because of this Australia, once a bastion of middle class aspiration, has suffered some of the world’s highest housing prices.  Sydney itself ranks second, behind Vancouver, in the English-speaking world’s unaffordability sweepstakes. In 1990 a Sydney household median income required five years wages; today it requires almost ten.

    Prices have been shaky recently, but current planning strictures will likely keep them artificially high. In America you can escape California or New York prices by heading south or inland. Even Australia’s second-tier, slow-growing  burgs like isolated Adelaide are more expensive than larger economically vibrant cities like Seattle and more than double as costly relative to incomes as Indianapolis, Dallas-Fort Worth or Houston.

    As a result, many younger Australians — and their parents — have reason to wonder if the next generation will ever be able to own a home. What they call the “Great Australian Dream” — with a backyard and shady streets — is being supplanted by the planner’s utopia of dense urban dwellers. Nothing wrong with having a dense option, but this is not about choice; it’s about coercion. The feisty New City Journal, edited by onetime Labour Party activists, described the process as “ruining our cities in order to save them.”

    Sadly much of the densification policy is based on faulty logic, increasingly justified by climate change. It’s ironic hearing pious greenhouse gas obsessions in a country dependent on exports of raw materials, most prominently coal, to China, the world’s biggest emitter. And a domestic reordering would have little to no impact on climate change since Australia generates barely 1% of the world’s greenhouse gases.

    But even if you agree Australia must do its part against climate change, many policy recommendations are based on a total misreading of modern urban form. Planners and media pundits assume, for example, that people can save energy by taking the train downtown; but even in Sydney, Australia’s largest and oldest big city, barely 12% of the labor force works in the central district, well below the levels decades ago.

    There’s also a presupposition that people living in downtown apartments are inherently less energy consumptive than their suburban counterpart. Yet a recent study done by researchers at the University of South Australia showed that overall urban dwellers — who travel, eat out more and consume more goods per capita — also consume more energy, once things like elevators and common areas are factored in, than the suburbanites living in townhouses or single-family homes.

    A similar finding was also made by the Australian Conservation Foundation. But in this particular battle, facts rarely intrude. Who needs to think after you have spent years in college being conditioned to believe that all density is good, the denser the better?   And for the big urban landowner, what could be better than stating a moral cause for limiting the suburban competition, thus spiking property  prices?

    What is happening to lovely Ku-ring-gai and the Great Australian Dream should stand as a warning of what happens if planners, and their big developer allies, gain total sway.  Let’s just hope America’s traditional decentralization of authority will prevent our middle class dream from following the sad trajectory of our hitherto lucky friends down under.

    This piece originally appeared at Forbes.com.

    Joel Kotkin is executive editor of NewGeography.com and is a distinguished presidential fellow in urban futures at Chapman University, and an adjunct fellow of the Legatum Institute in London. He is author of The City: A Global History. His newest book is The Next Hundred Million: America in 2050, released in February, 2010.

    Photo "Cockatoo in Sheldon Forest" by flickr user AussieGold

  • Surprise: Higher Gas Prices, Data Shows More Solo Auto Commuting

    Despite higher prices and huge media hype over shifts to public transit, the big surprise out of the 2010 American Community Survey has been the continued growth over the last decade in driving alone to work. Between 2000 and 2010, driving alone to work increased by 7.8 million out of a total of 8.7 million increase in total jobs. As a result, this use of this mode reached 76.5% of the nation’s workers, up from 75.6% in 2000. This is the largest decadal share of commuting ever achieved for this mode of transport.

    In view of the much higher gasoline prices that prevailed in 2010, it might have been expected that driving alone would lose market share from 2000 (Figure 1). But this did not — despite many media and academic claims that would or was already taking place — occur.

    The Census Bureau began compiling data on commuting in the 1960 census. In each census through 2000, commuting data was obtained through the census "long form" questionnaire. During the last decade, however, the Census Bureau has begun an annual survey, the American Community Survey, which includes commuting data and a considerable amount of additional data, and the decennial census survey was discontinued.

    Cars Dominate: There have been substantial changes in how the nation travels since the first survey in 1960. In 1960, 64% of the nation’s workers traveled by car. Separate data was not obtained for driving alone and carpools until 1980. The 2010 data indicates that 86.2% of employees used cars for the work trip in 2010. This was a slight reduction from 87.9% in 2000. But the anti-automobile crowd should not celebrate; all of the loss was due to a substantial decline in carpooling. In 2000, 12.2% of workers traveled by car pool. This figure dropped to 9.7% in 2010. With the higher gas prices, it might have been expected that carpooling would have become more popular, because of the lower costs from sharing experiences with other workers. This simply did not occur.

    Working at Home: The big winner among the nation’s commuting modes was working at home, a large share of which is telecommuting. Working at home increased from 3.3% of the workforce in 2000 to 4.3% of the workforce in 2010, for a market share increase of 33%, Overall 1.7 million more people work at home in 2010 than in 2000. It seems likely that the high gas prices encouraged a more working at home as did the move by companies to offload work to freelancers to reduce their costs or boost efficiency. Over the decade, gas prices increased 46%, adjusted for inflation, while the work at home market share increased 33% (Figure 2).

    Further, working at home, as indicated in a previous article, is poised to become the third most popular method of accessing work before 2020, passing transit and trailing only driving alone and carpooling (see Decade of the Telecommute). Working at home might have been much more popular in 1960, when it accounted for 7.2% of employment. But as many home-based industries lost share to chains and malls,   this figure fell by more than one-half by 1970 and then fell to 2.2% in 1980. The doubling of the work at home market share since that time, on the other hand, is attributable to the advances in information technology.

    Transit: Transit experienced by far its best decade since the Census Bureau began tracking commuting. Transit’s long market share slide came to an end, rising from 4.6% in 2000 to 4.9% in 2010. Even so, it might have been expected that a more substantial increase in transit commuting would have occurred as a result of the high gasoline prices. However, only an 8% increase in the transit market share occurred at the same time as gasoline prices increased a real 46%, less in percentage terms than the shift to working at home (Figure 2).

    Part of the problem was revealed in a Brookings Institution report. The percentage of metropolitan area jobs that can be reached by transit for the average worker is very low, which seriously limits transit’s potential for commuting use. Brookings data indicates that less than 10% of the jobs in major metropolitan areas can be reached within 45 minutes by transit by the average worker in major metropolitan areas (see Transit: The 4 Percent Solution). This is not only because transit service is infrequent in many parts of metropolitan areas, but also because it operates so much more slowly, on average, than cars. By comparison, the median work trip travel time by people driving alone is 21 minutes.

    Transit carried 12.1% of the nation’s commuters in 1960 and had fallen to 5.3% by 1990. The results of the last three decades indicate that transit commuting may have stopped declining but has reached a plateau, with only small increase.

    Recent decades have seen establishment and substantial expansion of urban rail systems. A principal rationale for these systems has been reducing traffic congestion, especially during peak hours. The majority of commuting takes place during peak hour and is principally responsible for peak hour traffic congestion. Between 2000 and 2010, Metros (subways and elevated) accounted for 48% of the increase in transit commuting, while buses and a trolley buses accounted for 43%. Light rail (trolleys and streetcars) accounted for less than 2% of the additional transit commuting, despite the fact that light rail has been the dominant form of rail transit expansion (Figure 3).

    Bicycling: It was also a good decade for bicycle commuting. Bicycling added nearly 250,000 new commuters and rose from 0.4% of the market in 200 to 0.5% in 2010. The increase in bicycle commuting was 15 times that of light rail. Bicycling was first surveyed by the Census Bureau in the 1980s census, when its market share was also 0.5%.

    Walking: There was little change in walking as a form of commuting. In 2000, 2.9% of commuters walked to work, a figure that dropped to 2.8% in 2010. However, walking has suffered even greater losses than transit over the last 50 years. In 1960, 9.9% of commuters walked to work.

    The Future? One thing is clear from the data of the last decade. There has been no sea-change in commuting, even with the huge gasoline price increases. Few analysts would have predicted that single-occupant commuting would have increased at a time of both high gasoline prices and high joblessness. Further, as the shift to personal mobility continues, the largest percentage increases will like take place in telecommuting, arguably the most energy-efficient form of transport.

    Data from 1960: The table below summarizes work trip access market shares over the 50 years of data collection by the US Census Bureau.

    US Work Access by Mode: 1960-2010
    COMMUTERS 1960 1970 1980 1990 2000 2010
    Car, Truck or Van 41,368,062 59,722,550 81,258,496 99,592,932 112,736,101 118,123,873
    Drove Alone     62,193,449 84,215,298 97,102,050 104,857,517
    Car Pool     19,065,047 15,377,634 15,634,051 13,266,356
    Transit 7,806,932 6,514,012 6,007,728 5,890,155 5,867,559 6,768,661
    Bicycle     468,348 466,856 488,497 731,286
    Walk only 6,416,343 5,689,819 5,413,248 4,488,886 3,758,982 3,797,048
    Other or Unspecified 4401718 2240864 1289613 1225420 1243866 1,595,942
    Work at Home 4,662,750 2,685,144 2,179,863 3,406,025 4,184,223 5,924,200
    Total 64,655,805 76,852,389 96,617,296 115,070,274 128,279,228 136,941,010
               
    MARKET SHARE 1960 1970 1980 1990 2000 2010
    Car, Truck or Van 64.0% 77.7% 84.1% 86.5% 87.9% 86.3%
    Drove Alone     64.4% 73.2% 75.7% 76.6%
    Car Pool     19.7% 13.4% 12.2% 9.7%
    Transit 12.1% 8.5% 6.2% 5.1% 4.6% 4.9%
    Bicycle     0.5% 0.4% 0.4% 0.5%
    Walk only 9.9% 7.4% 5.6% 3.9% 2.9% 2.8%
    Other or Unspecified 6.8% 2.9% 1.3% 1.1% 1.0% 1.2%
    Work at Home 7.2% 3.5% 2.3% 3.0% 3.3% 4.3%
               
    Notes          
    Other includes taxicabs, motorcycles and other
    Blank cells indicate no data
    Taxicab included in transit in 1960
    Workers 14 and over, 1960 & 1970. Workers 16 & over, subsequent censuses
    US Census Bureau data


    Wendell Cox is a Visiting Professor, Conservatoire National des Arts et Metiers, Paris and the author of “War on the Dream: How Anti-Sprawl Policy Threatens the Quality of Life

    Photo: Junction of Interstates 110 (Harbor Freeway) and 105 (Glenn Anderson Freeway) in Los Angeles, which carry four varieties of passenger transport, cars, busway, high-occupancy vehicles and light rail (by author).