Category: Suburbs

  • How Cities Grow: Dispersion, not Densification

    Analysts occasionally note that urban areas ("cities") are becoming larger and denser. This is only half right. It is true that most of the world’s urban areas are becoming larger, with megacities like Delhi, Jakarta, Shanghai, Beijing and Manila adding more than five million people in the last decade and most other urban areas are growing, but not as fast.

    Understanding Urban Areas: However almost without exception, urban areas are getting less dense. Because there is so much confusion about city "definitions," a clarification is required. The only geography for which overall urban density can be measured is the urban area, which is the area of continuous development. The urban area is not constrained by municipal or other jurisdictional boundaries and does not include rural (undeveloped) territory, even if it is in a "central city" (such as Rome, Ho Chi Minh or Marseille, with their expansive boundaries). An urban area is also different from a metropolitan area, because metropolitan areas (as labor markets) always include rural territory, which is by definition not urban.

    1960-1990 Data: Historical urban population density is not readily available. Kenworthy and Laube were pioneers in this area, publishing estimates from 1960 to 1990 for a number of urban areas. That data indicates density losses in the more than urban areas for which they were able to develop comparable data. The world average decline was 20 percent, ranging from 15 percent in the United States to 29 percent in Europe and 33 percent in Australia. While Tokyo was doubling in population, its population density was dropping 17 percent between 1960 and 1990. While Zurich was adding 21 percent to its population, it was becoming 13 percent less dense.

    Recent Data: The dispersion continues, which is indicated by these high-income world cases:

    Today, the ville de Paris has 700,000 fewer people than at its peak, and inner London (generally the former London County Council area) has lost more than 1,500,000 people since its peak. All growth has been in lower density suburban areas in both the London and Paris urban areas.

    In the United States, urban areas with more than 1,000,000 population more than doubled in population from 1950 to 2000 (2010 data not yet available), while the population density dropped by nearly one-third. Detailed analysis indicates that this trend has continued over the past decade in New York, Los Angeles, Chicago, Dallas-Fort Worth, Seattle, St. Louis and other major US urban areas.

    The dense core city of Seoul has been losing population and all growth has been in the suburbs, which are lower density.

    The dense urban core of Milan has experience substantial population losses, while the less dense suburbs have captured all the growth.

    Dispersion is not limited to high income urban areas, with declining densities in evidence across lower and middle income nations as well. For example:

    Nearly all of the growth in Jakarta has been in the suburbs for the last 20 years, while the core has gained little in population. The net effect is a less dense, but much larger urban area, because the suburbs are not as dense.

    Nearly all of the growth for 30 years in Manila has been in the suburbs, while the core city. Again, the urban area has become much larger, but much less dense because the suburbs are much less dense.

    The dense core of Shanghai has lost population and all growth has been in the suburbs, which are lower density.

    The population in the dense core of Beijing has nearly stopped growing, with nearly all population in the suburbs, which are lower density.

    The core of Mumbai has lost population in two of the last three census periods, while all growth has been in the suburbs, which are lower density.

    The urban core of Mexico City has been declining in population since 1960 and all of the growth has been in the suburbs, which are less dense.

    The dense core city of Buenos Aires has fewer people today than in 1947, while at least 8 million people have been added to nearly 1,000 square miles of lower density suburbs.

    Urban growth continues to be overwhelmingly in less dense suburban areas, rather than in the more dense urban cores, and as a result even as urban areas grow, they become less dense. This is how cities grow.

  • Are 20th Century Models Relevant to 21st Century Urbanization?

    Analysis of the state of the world’s cities 2010/2011 by UN-Habitat focused on the narrowing urban divide, with 227 million people moving out of slum conditions over the preceding decade.  While acknowledging uncertainty over cause and effect, the report notes that:

    urbanization … is associated in some places with numerous, positive outcomes such as technological innovation, forms of creativity, economic progress, higher standards of living, enhanced democratic accountability and women’s empowerment. … the report calls for policy-makers and planners to understand that urbanization can be a positive force for economic development, leading to desirable social and political outcomes.

    The North Atlantic solution

    The report acknowledges the diversity of urbanisation[1], making its authors’ somewhat singular approach to managing it (more density) incongruous.  Their prescription is based on resisting urban sprawl, reflecting the experience of North America.  They also suggest that sprawl is a sign of “divided cities”, translating into

    an increase in the cost of transport, public infrastructure and of residential and commercial development. Moreover, sprawling metropolitan areas require more energy, metal, concrete and asphalt than do compact cities because homes, offices and utilities are set farther apart.

    The report denounces sprawl in suburban zones of high and middle income groups and in extensive slums on the city edge.  On the latter, they invoke issues of governance, saying it occurs because

    authorities pay little attention to slums, land, services and transport. Authorities lack the ability to predict urban growth and, as a result, fail to provide land for the urbanizing poor.

    Can one size fit all?

    It is difficult to accept prescription predisposed to a particular view. Urbanisation is not a single condition. Differences in the stage of urbanisation, vastly different physical, cultural and economic settings of “urban” settlement, and different institutional arrangements belie the idea of a universal response or that any particular form is best for all cities. 

    Apart from anything else, “western” cities [2] don’t really feature in 21st century urbanism.  Consider the figures.  In 1950 western cities accounted for 43% of the world’s urban population.  This was down to 23% in 1990 and 18% in 2010. UN projections have the figure down to 15% in 2030, accounting for between just 3% and 4% of all urban growth between now and then.

    What Size City?

    This post looks at some more numbers that help illustrate the diversity of urbanisation – the size of urban settlements. 

    According to UN figures,  8% of the world’s population lives in 53 cities housing over 5 million people; 12% in 388 cities of between 1 and 5 million; and 31% in cities of under 1 million. Any prescriptions for urban governance and urban form need to reflect quite extreme divergence between the few megacities and the many smaller settlements where the majority of urbanites live.

    The Urban Growth Trajectory

    Urbanisation experiences vary, also.  The different national experiences of the past 60 years can be illustrated using ten quite different countries (Chart 1).  By 2010, Brazil, US, UK, Mexico, and Iran were all heavily urbanised.  But the level of urbanisation changed little for the US and the UK over thelate 20th century, while it grew rapidly in the others.

    In yet another trajectory, erstwhile rapid urbanisation in Russia stalled after the mid 1980s. 


    Chart 1: Urbanisation Trends, Selected Nations, 1950-2010

    Urbanisation is accelerating in China, but has flattened off in Indonesia.  It has been increasing steadily in Nigeria and slowly but still steadily in India.

    Most people moving into smaller cities

    Chart 2 shows shares of growth by city size groups over the last twenty years. (Russia is omitted because urbanisation actually declined by 5.5%.) 

    Cities of under 1 million residents dominate gains, strongly favouring developing countries.  They accounted for 90% of urban growth in Indonesia, 71% in Nigeria and 66% in Iran. 

    US experienced growth more or less across all size categories, although Chicago went from the 7m-8m to the 8m plus category, reducing down the former.

    Chart 2: Where Populations Grew – Cities by Size Category, 1990-2010

    Brazil, China, and Indonesia saw significant growth across the most size groups.  There appears to be a contrast within these countries between the centralising influence of few large cities and dispersed urbanisation in many much smaller settlements.

    (The picture for the UK reflects a gain of around 1 million people in London — to 8.6m — shifting it between categories.  Smaller cities actually accounted for 82% of the net UK gain in urban population, suggesting a duality between the growth of the capital and decentralisation through growth in smaller settlement). 

    So where are the big cities?

    The US has five urban agglomerations with a population of more than 5m, centred on New York, Los Angeles, Chicago, Philadelphia and Detroit (Chart 3).  Compare this with China, with twelve cities of over 5m, and five cities of more than 8 million people (Shanghai, Beijing, Chongqing, Shenzhen, and Guangzhou); or India, with eight over 5m and three over 8m (Mumbai, Kolkata, and Chennai).

    At the same time, China has 90 cities of between 750,000 and 2m, India 44 and the US 66.  Mexico has 15, Russia 14 and Brazil 13. 

    Chart 3: Number of Cities by Size Category, Ten Nations 2010

    Primacy – a mixed picture

    Single centres that dominate national populations are termed “primate”.  Their rise and fall may be symptomatic of national economic fortunes.  Excessive primacy may increase economic volatility because the contrast between a rich centre and poor periphery is politically destabilising. One centre dominating financial, human, and intellectual resources may also increase national vulnerability to structural decline.

    The picture is mixed across our sample (Chart 4).  Mexico City and London stand out.  High levels of primacy are also evident in Iran and Indonesia, but have been easing, contrasting with Nigeria where it is increasing.  It is least pronounced in the countries with the largest urban populations – China and India — suggesting a strong population pull from a number of state or provincial capitals, as well as a host of much smaller cities.

    Chart 4: Population Share of Largest City, Ten Nations, 1990 and 2010

    So what does all this mean?

    The data confirms huge diversity in the sizes of cities people live in across and within nations.  It generates more questions than answers, though, the main one being whether it is relevant simply to transfer urban governance, management, or planning models from one place to another.  Apart from contrasts within and between nations, it is clear that the west is no longer the focus of urbanisation and is unlikely to hold many of the answers to today’s urban growth challenges.

    The evidence also indicates a tendency for urbanisation to take place in small, dispersed settlements rather than mega-cities.  More modest scale makes different demands on infrastructure and institutions.  It may also help manage urbanisation and ensure that benefits can be better accessed by larger numbers of people.  Small cities, sub-centres in large cities, and districts of modest scale may be better suited to adaptable and innovative planning and management than large scale, extensive cities with their more centralised, remote, and inevitably bureaucratic political and administrative systems. 

    Very large agglomerations do exist, even if they are not as dominant in the wider urban picture as their size and profiles might suggest.  The question they raise is whether they should continue to dominate national and international agenda for urban growth and management.  Dispersed urbanisation may better reflect the resources and capacities needed to support an exploding urban population in the 21st century.

    Phil McDermott is a Director of CityScope Consultants in Auckland, New Zealand, and Adjunct Professor of Regional and Urban Development at Auckland University of Technology.  He works in urban, economic and transport development throughout New Zealand and in Australia, Asia, and the Pacific.  He was formerly Head of the School of Resource and Environmental Planning at Massey University and General Manager of the Centre for Asia Pacific Aviation in Sydney. This piece originally appeared at is blog: Cities Matter.


    [1]  The lowest level of urbanisation incorporated by the UN depends on the conventions of individual nations but may refer to settlements with as few as 2,000 people.

    [2] Treated here as North America, Northern Western and Southern Europe, and Australasia

    Photo by NASA’s Marshall Space Flight Center.

  • Being Dense About Dwellings: Check the Numbers!

    Recently I suggested that in New Zealand we are heading into the perfect housing storm. Now we have news that house prices and rentals are on the climb again, although stocks remain tight, as an annual inflation rate of 5.3% hits a 21 year high.  The economists are suggesting this is good news, although it means interest rates may have to be pushed up sooner than expected.

    Well the bad news is that the housing crisis might just have worsened. 

    Sure, its not an across-the-board crisis, but it is very real to large and important sections of our population.  Lack of housing affordability remains a threat to social sustainability and economic recovery.  So how are we responding to the threat — or perhaps now the reality — of a perfect housing storm?  What provisions are we making in our urban plans?

    Smaller boxes – bigger footprint
    Urban planners are still more preoccupied with fitting more dwellings into smaller areas than they are with responding to people’s needs for housing.  It might help shift this fixation to point out that the preferred compact city solution is not only socially destructive, because it doesn’t reflect need and does nothing for affordability, but it is also environmentally short-sighted.

    Think about the metrics.

    Take 100 people and house them at 1.5 residents per dwelling.  That’s arbitrary, but it reflects a widespread expectation that most new dwellings will house smaller households in central locations. 

    In the interests of sustainability, let’s assume the resulting 67 dwellings are small, so that we can fit more of them onto less land.  Say, 120 sq meters per dwelling.  That totals 8,000 sq metres or thereabouts (more if we count the common areas in apartment buildings), 80 sq metres per person.  It’s also 67 kitchens, 67 lounges, maybe 67 media centres, at least 67 bathrooms, maybe some additional lighting for common areas and even some lifts.

    Now take 100 people and fit them in at 3 people per dwelling, terraces, duplexes or fully detached houses.  Let’s make the dwellings bigger, say 200 sq metres.  We now need only 33 dwellings, 6,600 sq metres of dwelling, or 66 sq metres per person.  Less space per person, sure, but that’s okay because now we need just half the kitchens, bathrooms, lounges and media centres.  However we look at it, we’ve used a lot less resources and have a spare 1,400 sq metres for open space, extra gardens, courtyards, whatever.  And with the capacity for extra bedrooms, we have much more flexible housing stock.

    So which is the more sustainable?  Surely bigger dwellings with higher occupancies.  Surprised?

    Can we plan for higher occupancies?
    Now, we can’t engineer household size, can we?  Well, actually we already do.  With a housing shortfall we now require young adults to stay longer with their parents, force singles to move in with others,  require couples to take on boarders, or even promote multi-family living, all boosting occupancies.

    So let’s at least understand that building more, smaller dwellings, especially medium- or high-rise apartments, does not necessarily deliver sustainable urban settlement, nor does it provide the flexibility to make the higher occupancy "solutions" we force on people easy to live with.

    Larger dwellings do allow for diverse living arrangements, but its more multi-generational living, more non-family households, more sharing.  Like them or not, such arrangements are likely to increase, if only in response to the affordability issues we seem intent on entrenching.

    So what’s happening to demand?
    So why are planners trying to put more people into smaller dwellings anyway?  How relevant is the expectation that average household size will be smaller in the future than it has been in the past?

    Most forecasts of housing “demand” simply extrapolate diminishing occupancy across demographic projections.  Its all about the coefficients, and the assumption that household structures won’t change much in the medium to long-term. 
    Well, it’s not that simple.

    Things like an unexpected boom in the dissolution of relationships over the past three or four decades, the rapid growth in migration, and the recent stabilisation and even reversal in occupancy rates undermine the conceit that we can accurately forecast the structure, preferences, and behaviour of households 20 or 30 years hence.  If that’s the case, why are our prescriptions for housing increasingly rigid?

    Projecting household types
    To understand this let’s stay with the current ”best”  projections of what households might look like in the future, and think about the implications for housing.

    Statistics New Zealand (SNZ) medium projections to 2031 indicate that families with children will account for a minority of household growth in our main cities (see chart).  The figures may even shrink in Wellington and Christchurch.  According to this projection, they will make up 28% of new households in Auckland, though, so we could still need over 71,000 new dwellings for families there.  It’s reasonable to expect that detached housing will still work best for them.

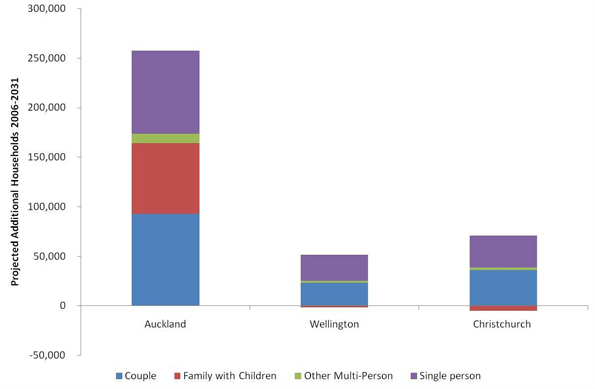
    Household Category Projections, Statistics New Zealand

    Couples will account for more growth, though, maybe 36% of new households in Auckland according to SNZ, and singles for 32%.  So let’s think about the preferences of the small household segment. 

    So what will the small household segment look  like?
    To get a feel for this, I divided the SNZ age projections into four (setting aside the main family age cohorts) : young adults (aged 20-29), empty nesters (the kids have left home, aged 50-64); early retirees (65-79), and later retirees (80+).  These are the groups most small households will come from.  But they have quite different housing preferences, so the nature of future demand for smaller dwellings depends on which ones grow the most.

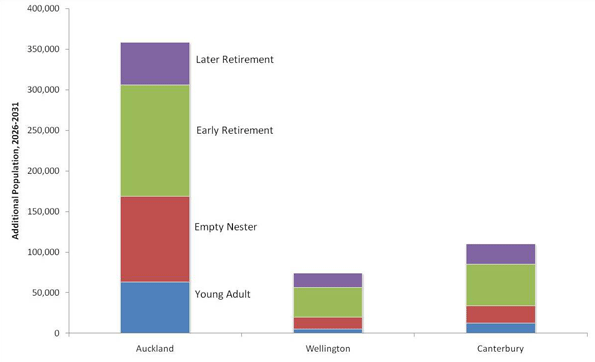
    Age-Based Housing Demand Segments (based on SNZ Projections)

    So who will dominate growth?
    Empty nesters and retirees will dominate the demand for new houses.  And these are not usually people who want to move into small, centralised apartments, at least not as a primary residence. 

    Many of them have significant financial equity in their existing homes and emotional equity in their neighbourhoods.  If they move into smaller dwellings, they won’t be that small!  They will expect them to be well appointed and well located, probably close to where they already live. 

    They won’t want high or even medium rise.  And they are  likely to seek three or four bedrooms.  They will need the space to maintain active  lives into their seventies and eighties, more so than past generations.  They will be accommodating visiting family and friends; they will need offices, hobby areas, workshops, and storage. 

    Here’s a model to take seriously if we are serious about sustainability
    And as the baby boomers eventually become less independent, we might expect them to head into retirement villages, already a booming – and highly sustainable – form of housing.

    In fact, we should look seriously at retirement villages if we want to understand the sorts of arrangements that could dominate new housing demand over the next 30 years.  Here, the market seems to have got it right. 

    They offer varied living arrangements – detached and semi detached housing, terraces, apartments, and even on-site nursing facilities.  They offer medium density living with plenty of green space and gardens; common areas and shared facilities for recreation and leisure; plenty of on-site activity to cut down transport needs but also on-site parking to reflect the realities of modern living.  They achieve density and sustainability with style.  And – there must be a lesson here – they do it overwhelmingly in suburban if not city edge localities. 

    So let’s not assume that rising house prices mean a return to business as usual.  Far from it – freeing up the housing market must remain a top priority if the economy is in recovery mode.  And let’s start looking to the suburbs and beyond for the housing solutions that might just help it stay that way.

    Phil McDermott is a Director of CityScope Consultants in Auckland, New Zealand, and Adjunct Professor of Regional and Urban Development at Auckland University of Technology.  He works in urban, economic and transport development throughout New Zealand and in Australia, Asia, and the Pacific.  He was formerly Head of the School of Resource and Environmental Planning at Massey University and General Manager of the Centre for Asia Pacific Aviation in Sydney. This piece originally appeared at is blog: Cities Matter.

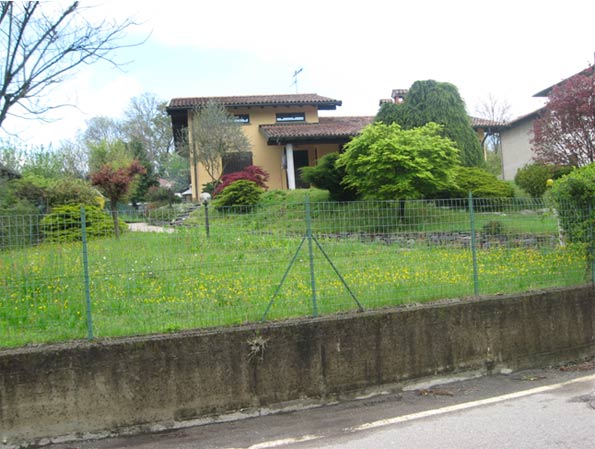
    Photo by flickr user: Adam Foster.

  • The Evolving Urban Form: Milan

    Italy’s population growth has been stagnating in recent decades, but has turned around during the last decade, with the annual growth rate increasing 16 times (from 0.04 percent to 0.69 percent). According to United Nations data, Italy added more international migrants in the 2000s (3.8.5 million) than it added people in any ten year period since 1960. Some of the strongest growth has been in the Milan metropolitan region, which has begun to grow again after years of stagnation. This is not due to any increase in Italian birth rates but principally because of surging international migration.

    Much of this has to do with the enlargement of the European Union (EU) from 15 to 27 member states, and the consequent removal of all legal barriers to internal migration. The Milan metropolitan region, occupies much of Lombardy, Italy’s most populated region. Milan added 634,000 foreign residents in just six years (2000 to 2008, the latest year for which data is available).  The largest share, 103,000, was from the EU’s Romania, with 50,000 from Albania, 47,000 from Morocco, 30,000 each from Ecuador and Egypt and 27,000 from Ukraine. Over the period, more than 80 percent of Lombardy’s growth has come as a result of international immigration.  The key to this lies with the region’s economy, which is the strongest in Italy and all of southern Europe.

    International migration has also fueled large population increases elsewhere, especially in both northern and central Italy, such as Rome and Turin. Further south, however, growth (such as in the Naples area) has continued to be comparatively slow (Figure 1).

    The Urban Area: The Milan urban area is the largest in Italy. The Milan urban area stretches from the core of Milan northward to the Alps and includes development in the provinces of Varese (photo), Como, and Lecco (Photo: Lecco) as well as Monza and Brianza. The province of Como is home to the picturesque Lake Como, while Varese sits at the foot of the Simplon Tunnel (of "Venice Simplon-Orient Express" fame) and the highway over Simplon Pass to Brig in Switzerland’s Rhone Valley and the Matterhorn.


    Varese


    Lecco: Northernmost suburbs


    There is also considerable development both to the east and the west in the province of Milan and more limited development to the south. Overall, the urban area has a population of approximately 5,400,000 (Note 1), covering approximately 800 square miles (2,100 square kilometers) for a population density of approximately 6,700 per square mile (2,500 per square kilometer).  This is similar to that of Los Angeles or Toronto.

    Growth in the Metropolitan Region: Until the recent increase in international migration, the Milan metropolitan region was growing slowly and more recently even losing population. Between 1991 and 2001, the metropolitan region lost one percent of its population. However, since 2001 the metropolitan region has gained 9.0 percent, an improvement from the minus 1.1 percent between 1991 and 2001. The last decade’s growth was at an average annual increase rate of 0.96 percent which is slightly more than the United States (0.94 percent) and slightly less than Canada (1.04 percent). 

    The Inner City: The commune of Milan is the central municipality of Milan metropolitan region. The population of Milan peaked in 1971 at just under 1,700,000 people. By 2001 the population had fallen to approximately 1,250,000 people, a loss of approximately 25 percent and its lowest population since before the 1951 census. The central municipality of Milan continued to lose population to 2001. From 1991 to 2001, Milan lost more than 100,000 people and nine percent of its population. Milan is not unusual in this decline. Declines have been characteristic for virtually all Western European central municipalities, except where there was substantial greenfield space to accommodate new suburban development (such as in Rome).

    However, the commune of Milan has begun to grow again. Milan’s population has increased by nearly 70,000 people or 5.4 percent. Milan now has a population density of 18,600 per square mile (7,200 per square kilometer), slightly higher than that the city of San Francisco (Photo: Milan). Even with the recent increase, however, all of the growth in the Milan metropolitan region since 1991 has been in the suburbs and exurbs (Figure 2) and 87 percent in the last decade (Figure 3).


    Milan

    Much of the commune’s population increase has been the result of international migration, since many Italians continue to migrate to the surrounding suburban and exurban areas, as is the case in a number of European metropolitan regions.  Domestic out-migration continued from the commune of Milan, while the suburbs and exurbs attracted domestic migrants (Note 2).

    Inner Suburbs: The inner suburbs of Milan include portions of the province of Milan outside the commune of Milan and the (single) province of Monza and Brianzia, which was separated from the province of Milan earlier in the decade. The inner suburbs also lost population between 1991 and 2001. This was reversed between 2000 and 2010, when the inner suburbs added approximately 230,000 people, and grew at an overall rate of 9.4 percent. The inner suburbs have a population density of approximately 5,000 per square mile (1,900 per square kilometer), somewhat less than the Sydney urban area and 1.5 times that of Portland.

    Outer Suburbs and Exurbs: The outer suburbs and exurbs stretch north to the foot of the Alps, as well as to the south of the province of Milan. The largest population is to the north, with a far smaller population to the south, in the exurban provinces of Pavia and Lodi. Unlike the commune of Milan and the inner suburbs, the outer suburbs and exurbs have grown in each of the last decades.  Between 1991 and 2001, the outer suburbs and exurbs accounted for all the growth, though at a modest rate of 2.5 percent. The growth has substantially increased since 2001 with the addition of more than 245,000 new residents and a growth rate of 10.4 percent. International migration accounted for 93 percent between 2002 and 2008, 93 percent were foreign (202,000).

    Where the Immigrants are Moving: As might be expected with strong international migration, most of the new entrants have moved to the inner city and inner suburbs. Between 2002 and 2006, 97 percent of the population growth was from international migration, with an addition of 202,000. The overall foreign population increased 119 percent from 2002 to 2008. Yet, the percentage growth was much stronger in the outer suburbs and the exurbs, where the foreign population grew 171 percent (125,000). However, this represented a smaller share of the overall growth (67 percent), which is likely to be an indication of strong outbound domestic migration from the inner city and the inner suburbs to the outer suburbs and exurbs. There was also strong foreign population growth in the balance of Lombardy, with an increase of 147 percent, which constituted a somewhat higher share of overall growth, at 84 percent (Figure 4).

    Decentralizing, Diversifying Milan: Like the other international urban areas (Note 3), Milan continues to suburbanize, though growth has also resumed in the historic core municipality. At the same time, international migration is changing Milan and Italy. United Nations (UN) data indicates that the number of international migrants to Italy was 10 times higher in the 2000s than in the 1990s. The UN projects that the inflow will drop by 50 percent between 2010 and 2015 and then to approximately one-third the 2000s influx to beyond 2050. Whatever the result, because of its strong economy, the Milan area will doubtless continue to attract a disproportionate share of the new arrivals.

    Wendell Cox is a Visiting Professor, Conservatoire National des Arts et Metiers, Paris and the author of “War on the Dream: How Anti-Sprawl Policy Threatens the Quality of Life

    —–

    Note 1: Milan is one of a small number of large urban areas that is often dismissed as being much smaller than it really is. This is because data for metropolitan regions is not routinely produced in Italy and Milan. As a result, analysts often referred to the population of the historical core municipality which has only 20 percent of the metropolitan population. Similar problems of national reporting occur in Germany’s Rhine – Ruhr (Essen-Dusseldorf) metropolitan region and Jakarta, Manila and Kuala Lumpur. The Rhine-Ruhr does not appear on the United Nations urban agglomeration list of all over 750,000, despite the fact that it has 7 million people in close proximity, at near average Western European large urban area densities (7,100 per square mile or 2,800 per square kilometer, compared to the Western European average of 8,000 per square mile or 3,100 per square kilometer)

    Note 2: More detailed data is not available on the internet from the Istituto Nazionale di Statistica Italia, Italy’s statistical bureau.

    Note 3: See additional reviews in the "Evolving Urban Form" series, at : Beijing, Chicago, Dallas-Fort Worth, Jakarta, Los Angeles, Manila, Mexico City, Mumbai, New York, SeattleSeoul and Shanghai .

    Photo: Duomo (Cathedral), Milan. Photographs by author.

  • The Ambiguous Triumph of the “Urban Age”

    In its State of the Population report in 2007, the United Nations Population Fund made this ringing declaration:  “In 2008, the world reaches an invisible but momentous milestone: For the first time in history, more than half its human population, 3.3 billion people, will be living in urban areas.”

    The agency’s voice was one of many trumpeting an epoch-making event.  For the last several years, newspaper and magazine articles, television shows and scholarly papers have explored the premise that  because most of the world now lives in urban rather than in rural areas things are going to be, or at least should be, different.  Often the conclusion is that cities may finally get the attention they deserve from policy makers and governments.  This optimism dovetails nicely with a sizeable literature of urban advocacy chronicling the rejuvenation of central cities and extolling the supposed virtues of high-density city living, even predicting the withering away of the suburbs.

    This supposed triumph of the urban is fraught with ironies, however.   The first is that, rather than a simple rush of people from the hinterlands into the centers of high density cities, there has also been, within almost every urban area in the world, a significant move of the population outward, from dense city centers into peripheral suburban areas and beyond them into very low-density exurban regions.   

    We can use Paris as a typical example.  The city of Paris reached its peak population of nearly 3 million in the 1920s.  It has lost nearly a third of its population since then.  What remains in the city is a smaller and wealthier population.  At the same time the suburbs, accommodating both families of modest income forced out of the city as well as a burgeoning middle class,  have grown enormously, from two million to over eight million.  And this does not count a great deal of essentially urban population that that lives in a vast ring of exurban or “peri-urban” settlement.  Certainly the majority of “urban” dwellers in the Paris region do not live in the elegant apartment blocks along the great boulevards familiar to the tourist.   They live in houses or small apartment buildings in the suburbs and use the automobile for their daily transportation needs.

    In fact, Paris is a good example of an even more fundamental irony.  At the very moment when urban population has been reported to surpass the rural, this distinction has lost most of its significance, at least in many parts of the affluent world.  Two hundred years ago, before automobiles, telephones, the internet and express package services,  cities were much more compact and rural life was indeed very different from urban life.  Most inhabitants of rural areas were tied to agriculture or industries devoted to the extraction of natural resources. Their lives were fundamentally different from those of urban dwellers. 

    Today the situation has changed radically.  Most people living in areas classified as rural don’t farm or have any direct connection with agriculture.  They hold jobs similar to those in urban areas.  And although they might not have opera houses, upscale boutiques or specialized hospitals nearby, the activities that take place in these venues are available to them in ways that they never were before.

    I can confirm the way the distinction between urban and rural has broken down by looking out the window of the house in Omro, WI where I am staying this weekend.  Omro, population about 3000, is located 8 miles west of Oshkosh and is  legally a city under Wisconsin law.  It is also an “urban” place according to the Census Bureau which, like those of other countries, defines urban largely by density standards.   In the case of the US, this means, in simplest terms, a density of at least 1000 people per square mile or just under two people per acre. 

    At one time this 1000-people-per-square-mile figure did provide a logical demarcation line.  Above those densities were places that could afford urban services like public water and sewers, sidewalks, streetlights, municipal fire departments and libraries.  Below that level were places that either didn’t have these services or had to depend on faraway county governments.  Unless you were closely associated with agricultural production or other rural economic activities or you were wealthy enough to provide your own services, it was quite inconvenient to live in rural areas. 

    Today, the automobile, rural electrification, the internet and the rise of alternate and privatized services has transformed what it means to live in rural areas.  “Country living” today has few of the drawbacks that made it inconvenient for middle class residents as recently as fifty years ago, and the migration of so many urbanites into the country has blurred the distinction between urban and rural.

    The view out my window bears this out.  When I look one direction what I see are city streets and houses on land that is technically urban.  Of course, Omro, with a single main street, two traffic lights and only a handful of stores, is not at all the kind of place that most people associate with the words “city” or “urban.”  Like the majority of small urban places in this country, its densities are lower than those found in the suburbs of larger cities.   When I look out the other direction I see mostly fields beyond the city limit.  But, unlike the case in the past,  there is no sharp divide.  There has been a significant increase in the number of houses out in the area that is technically “rural.”  Some of these used to be farmhouses, but there are few farmers anywhere for miles around.  Most farming is now done under contract or  as a large industrial-scale operation.   

    Most of the houses in the “rural” area around Omro have been built in the last decade or two and never housed anyone with any direct connection to farming.  They are suburban in appearance and mostly inhabited by people who work at home, are retired or commute some distance to jobs spread across a vast swath of urban territory that stretches from Fond du Lac south of Lake Winnebago to Green Bay where the Fox River meets Lake Michigan. 

    The result is that today, as you drive outward from the center of Fond du Lac, Oshkosh, Appleton or Green Bay, the number of houses per square mile diminishes, but there is no clear break between city and country.  It is a crazy quilt of agricultural, residential and other uses.  Commuting patterns, if charted on a map, would form a giant matrix of lines running in all directions.  Whether one is in the center of Oshkosh or 50 miles away, however, one can still live an essentially urban existence.   

    This same diffused urban condition holds true for very large swaths of the United States wherever there is enough underground water to allow wells. It is particularly conspicuous in the older and more densely settled eastern part of the country.  A state like New Jersey exhibits a pattern of dense older cities, radiating suburbs, vast exurban territories and farmland and open space, overlapping in ways that confound traditional notions about what is urban and rural. In places like New Jersey, the census distinction has lost almost all of its meaning.

    I don’t mean to suggest that that the news that the majority of the world’s population is now urban has no significance.  In fact this move from the countryside to urban areas has been one of the defining events of world history over the last several centuries.  Although this process was mostly finished in Western Europe and the United States decades ago, it still continues in most of Latin America, Africa and Asia and accounts for a great deal of the dramatic upward surge in income throughout the world.

    Nor am I suggesting the demise of the great cities of Europe or America.  Far from it.  Many rich families in particular will probably continue to choose high-density neighborhoods like those on the Upper East Side of New York or the 16th arrondissement in Paris, although often with a rural retreat as well  As the world gets wealthier, more people may make a choice to live in this way.

    However, current trends give no reason to believe that places like Manhattan or central Paris are going to increase in population and density as part of a “back-to-the-city” movement.    As cities gentrify, they undoubtedly become more attractive, but increased demand leads to higher prices keeping out many families who might choose to live in them.  Furthermore, the gentrifiers tend to have smaller families than those they replace, and they also tend to demand  more room, larger and better equipped housing units, more parks and open spaces.  Because of this, the gentrifiers, citing the need to preserve existing neighborhoods, frequently put up all kinds of barriers to new development and increased population and density, particularly by less affluent citizens.  For all these reasons,  existing city centers in the affluent world are unlikely to accommodate a significantly larger percentage of the population.

    Even in the developing countries, as urbanist Shlomo Angel has shown, most cities are spreading outward at ever lower overall densities just as cities have been doing for many years in the affluent West. For those who don’t have a lot of affluence, and even some who do, low density suburban- and increasingly, even lower density exurban- living, remains alluring for many in both the affluent and the developing world.   In fact, we might even be seeing the initial stages of a major reversal of the kind of urbanization that characterized industrializing cities in the West in the 19th and early 20th centuries. The sharp increase in houses outside Omro may presage at least a partial return to a pre-industrial condition seen, for example, in nineteenth century America when people were more evenly spread across the landscape. 

    This continuing urban sprawl is, of course, deplored by many of those who celebrate the supposed triumph of the “urban age. “ Yet  as I have argued in my book Sprawl:  A Compact History, this phenomenon is by no means as bad as most anti-sprawl crusaders imagine it to be.  Continuing to spread the population could conceivably result in a more equitable, more sustainable pattern of living, particularly as renewable energy and other resources are harvested close to home with less need of the giant systems necessary to maintain our dense industrial-age cities.  In any case, despite all of the planning regulations put in place in cities throughout the affluent world to control growth at the edge, the periphery continues, inexorably, to expand almost everywhere. 

    Nowhere does the evidence suggest that we are witnessing the final triumph of the traditional high-density city.  In fact, the much-ballyhooed urban majority might be in great part a statistical artifact, a way of counting the population that over-emphasizes the move from country to city and fails to account for the powerful counter-movement from the city back toward the countryside.  Indeed the emerging reality of overlapping patterns of high density centers, lower-density peripheries and vast areas of very low density urban settlement, all of them interspersed with agricultural lands and protected open spaces, threatens to upend altogether the traditional notion of what it means to be urban.   

    Robert Bruegmann is professor emeritus of Art history, Architecture and Urban Planning at the University of Illinois at Chicago.

    Photo by urbanfeel.

  • Waging a Green Jihad on Suburban Homes

    It seems rarely a month passes without some new assault on the lifestyle and housing choice preferred by the overwhelming majority of Australians: the detached suburban home. Denigrated by a careless media as ”McMansions” or attacked as some archaic form of reckless housing choice which is suddenly “no longer appropriate” (according to some planning or environmental fatwa), the detached home is under a constant assault of falsely laid allegation and intellectual derision.

    The latest of these assaults is the form of a proposed ”green star” rating scheme for ”McMansions” which critics claim cost could cost homeowners thousands of dollars in devalued prices.  While the critics’ suggestions of financial hardship might be taking the possible impacts a bit too far, it is reasonable to challenge this obsession of regulators and green crusaders which view the detached home as some form of modern environmental vandalism.

    The very first (and what should be obvious) fact that escapes our planning cabal’s attention is that houses, or home units, or even office buildings for that matter, don’t use energy. Only the occupants in them and their behaviour consume energy. The dwelling itself can be designed for more efficient energy use by the occupants, for sure, but remember always that it is people who consume power, not buildings.

    That point was brought home, embarrassingly for our rampaging environmental and social crusaders, by no less than the Australian Conservation Foundation in 2007. Their “Consumption Atlas” revealed what came as a surprise to many, but which should have been widely understood from the start: that wealthy people who can afford to live in the expensive home units and townhouses of trendy inner city areas use much more energy, and have bigger carbon footprints per capita than their suburban counterparts.  More than that, it also revealed that inner city areas are “consumption hotspots” and smaller household sizes have greater environmental impacts than larger (chiefly suburban) households.

    The significance of those findings has been studiously ignored by the advocates of environmental engineering who claim that a leading virtue of wholesale change in housing type from detached suburban to high density inner urban  will be good for the environment. The facts, however, show that it ain’t necessarily so. If a large family of five, for example, (mum, dad and three kids) living in a four bedroom house with two cars in the suburbs produce a smaller carbon footprint than the DINKs and yuppies living in their city apartment, why aren’t the media, environmental and planning advocates asking more questions?

    At the time the ACF report was released, I was running the Residential Development Council, and  can still recall hearing the ACF’s key findings mentioned in some very early radio news bulletins on the ABC.  For some reason, the story quietly petered out but the ACF kindly had a version on-line and once I sent a copy to Demographia’s Wendell Cox, it went on to infamy. Wendell prepared a report analysing its “Housing Form in Australian and its Impact on Greenhouse Gas Emissions” online findings.  

    There have been other reports too, which have either been ignored (where their evidence doesn’t suit the cause) or attacked (if the evidence is clearly getting too close to the truth). If you’re remotely interested in some of the facts (as opposed to the parade of rhetoric in the mainstream media) have a look at the evidence in this study called ”The Relationship Between Housing Density and Built Form Energy Use”’ which you can find online here.  There’s a graph on page six which shows the dwelling operational energy (blue part of the bar) for apartments is roughly three times that of detached homes.  The suggestion that occupants of high density apartments will be less likely to use private transport is yet to be borne out by evidence, with the ACF report admitting that higher incomes allowed inner city residents more opportunity to drive despite the presence of convenient public transport and also (heaven forbid) to fly to places, than households with lower incomes.

    Common sense also comes into play. Consider the basic design of apartment buildings as opposed to the detached house. Cross flow ventilation in apartments is harder to achieve (unless it’s a penthouse occupying an entire floor) than in the detached home with windows on all sides. Then there are the energy uses that the apartment more or less makes essential. There is no room for a solar powered clothes dryer (a washing line) in the backyard. Instead, energy guzzling clothes dryers are practically essential, as are air conditioners, not just for individual apartments but also for common areas throughout the building (foyers and corridors). Lighting in common areas is also almost always permanently on. Lifts to move people up and down also consume energy – taking two people from ground to level 25 in an air conditioned lift produces a lot more carbon than walking up a flight of front stairs into the detached home, after all.

    I’m not proposing that the leftist green agenda which is waging war on the detached home turn the blow torch of blame to the wealthy, nor am I suggesting that there’s anything wrong with apartment and townhouse developments. But what’s wrong with letting market forces play more of a hand without the overt moralising and environmental hand wringing that seems to accompany decisions on urban planning policy? Is it really necessary to malign the detached suburban home, in order to make the alternative more attractive?

    We are talking about middle Australia – and their counterparts in the USA, UK and elsewhere – which is under the barrage of assault for having the temerity to choose a form of dwelling that actually suits them. The fact is that people prefer, in the main, to raise children in houses rather than apartments. They often like to keep pets and have a garden around them. The children tend to like backyards to play in. The cars these families drive aren’t a ”love affair” but a necessity – getting from suburban home to suburban workplace and picking up or dropping off children on the way isn’t very practical with public transport. But you get the strong impression, reading the constant digest of anti-suburban living parading through mainstream media, that mainstream Australians are a reckless bunch of self-interested misfits whose behaviour and choices need to be controlled by people wiser than them.

    And there’s one of the great ironies in all this: those who advocate denying housing choice and enforcing apartments over detached homes, public transport over private, and inner city density over suburban expansion, invariably seem to do the opposite of what they preach.  Next time you come across one of these green jihadists waging war on the suburban home (and the people who live in them), ask them if they live in a house or a unit, how many children they have, ask how many cars (or homes) they own, and ask what their power bill is like.

    In my experience, all too frequently the answer reveals itself as a case of “do as I say, not do as I do,”  which is just plain hypocrisy.

    Ross Elliott has more than 20 years experience in property and public policy. His past roles have included stints in urban economics, national and state roles with the Property Council, and in destination marketing. He has written extensively on a range of public policy issues centering around urban issues, and continues to maintain his recreational interest in public policy through ongoing contributions such as this or via his monthly blog The Pulse.

    Photo by yewenyi.

  • A Fly in the Econometrics? Exaggerating Urbanization

    I was surprised to read in Science Digest that the increase in the urban land from 2000 to 2030 could be as much as 590,000 square miles (1.53 million square kilometers), which Science Digest went on to say would house an increase in the urban population of 1.47 billion people. The shock was because the researchers are suggesting that the substantial urbanization that will occur over the first three decades of this century will be at American urban densities, 2500 per square kilometer or 1000 per square mile. 

    Urbanizing on 1 to 3 Acre Lots? But that was just the beginning. The econometric research, A Meta-Analysis of Global Urban Land Expansion by Karen C. Seto, Michail Fragkias, Burak Güneralp, and Michael K. Reilly, partially funded by the National Science Foundation, indicates that the increase in urban land area between 2000 and 2030 could be as much as 4,900,000 square miles, or 12,600,000 square kilometers. This is more than the area of Australia, Argentina and Mexico combined. It does, however, seem unlikely that developers and home builders will provide for the expanding urbanization in China, India, Indonesia, the Congo, South Sudan and Bangladesh with ranch houses on one to three acre lots.

    The 4.9 million square mile or 12.6 million square kilometer urban land increase figure is based upon the GRUMP database, which we reviewed a year ago. GRUMP found the world to have more than 1.3 million square miles of urban development or 3.5 million square kilometers. The GRUMP database is purported to use United States Census Bureau criteria for designating urban land, yet counts three times as much land in the United States as being developed as the Census Bureau. We also showed that the GRUMP urban area for Cairo was at least six times the actual urbanization based upon examination of Google Earth maps (Figure 1: map).

    ng-grump2


    At 4.9 million square miles or 12.6 million square kilometers the average new urbanization would be under 500 per square mile or 200 per square kilometer. These densities fall well short of the urban density thresholds of 1000 per square mile or 400 per square kilometer that are used by census authorities in Canada, France, the United Kingdom and the United States. These nations and others consider densities this low to be rural rather than urban. Indeed, parts of rural China have higher densities than the GRUMP density estimates.

    Estimating Gross World Urban Area: Other estimates of world urbanization are more modest than the GRUMP estimate, which indicated an urban land area of 3,532,000 in 2000. The US Geological Survey MODIS mapping system estimated world urban land area at 650,000 square kilometers in 2000. In A Planet of Cities, Shlomo Angel, Jason Parent, Daniel Civco, Alexander Blei, and David Potere (Angel) use USGS MODIS mapping and further modeling to estimate the 2000 world urban land area at 605,000 square kilometers. Another source, the European Union’s Global Land Cover system put the number at 308,000. The wide variation in estimates indicates the complexity of the task of estimating the world’s urban land area.

    The estimates can be evaluated by comparing their implied population densities.

    • The EU Global Land Cover estimate would have required an average urban population density of more than 9,000 per square kilometer (23,800 per square mile) in 2000, based upon the 2000 United Nations estimate of urban population. This is nearly as dense as the city of New York (not the urban area) and a quarter more dense than Singapore. Anyone who has traveled to urban areas around the world, large and small, would quickly observe that average densities approach neither New York City nor Singapore. The Global Land Cover estimate thus appears to be too low.
    • The GRUMP world land area estimate would mean that the average urban population was 800 per square kilometer in 2000 (2,000 per square mile). This would place the world urban population density at least 15 percent below that of the United States  (900 per square kilometer or 2,400 per square mile) or Canada in 2001 (1,000 per square kilometer or 2,500 per square mile). As every urban planner knows, the United States has the least dense urban areas of any major nation. GRUMP thus appears to substantially over-estimate the amount of urban land.
    • The MODIS and Angel estimates are similar. The MODIS estimate would require an average world urban density of 4,300 per square kilometer (11,100 per square mile), while the Angel estimate would indicate a world urban density of 4,700 per square kilometer (12,200 per square mile). These two estimates would appear the most accurate, because they are well above the US and Canadian densities and any visitor to Manila, Shanghai, Cairo or a myriad of other urban areas in the developing world cannot help but note the much higher densities. At the same time the MODIS and Angel are well below the EU Global Land Cover estimates, which appear to be very high (Figure 2). The MODIS and Angel estimates would indicate that approximately 0.5 percent of the world’s land area is urbanized.

    Demographia World Urban Areas also provides population, land area and urban density estimates, though its detailed data is limited to approximately the approximately 800 urban areas with more than 500,000 population. Applying the Angel, et al urban area size density ratios and projections for urban expansion to 2010 (Angel middle scenario), the Demographia world density estimate would be approximately 20 percent lower, while the urban land area would be 25 percent higher). Demographia World Urban Areas bases its estimates on national census bureau data for urban areas (Note) where it is available and for others estimates urban land area from Google Earth (these are the overwhelming majority of cases), using urban perimeters. More than 50 percent of the difference between the Demographia and Angel estimates results from the use of Census Bureau urbanization data in the United States.

    Believable and Unbelievable Projections: Angel also provides projections for the increase in urban land area. Between 2000 and 2030 Angel projects that new urbanization could be from a middle case of 700,000 square kilometers (270,000 square miles) to a high estimate of 1,160,000 square kilometers (445,000 square miles), with a low case of 360,000 square kilometers (140,000 square kilometers). These are believable figures that are only a small fraction of the high-end 12,600,000 square kilometer (4,900,000 million square miles) projections by Seto, et al.

    The circumstances that might lead to urbanization equaling the land area of Australia, Argentina and Mexico are not believable. A sufficient reasonableness test does not appear to have been conducted.

    Wendell Cox is a Visiting Professor, Conservatoire National des Arts et Metiers, Paris and the author of “War on the Dream: How Anti-Sprawl Policy Threatens the Quality of Life

    ——

    Note: Most of the world’s national census authorities provide geographical data for only legal jurisdictions, such as states, provinces, regions, counties, etc. In some nations, urban area is developed to indicate the population and land area of continuous urbanization. This occurs in the United States, Canada, the United Kingdom, France, Sweden, Denmark and other nations.

    Photo: Developing world urbanization trend to 2030 according to high-end proectiong based upon GRUMP. Houses on two acre lots in Morris County, New Jersey (suburban New York). From Google Earth Pro.

  • The Evolving Urban Form: Beijing

    China’s capital, Beijing, has long been one of the world’s largest urban areas. Some reports placed its population at over 1 million in 1800, which would have made Beijing the largest urban area  in the world at that time. Later in the nineteenth century, Beijing dropped below 1 million population, as London, Paris and later New York rose to prominence. As late as 1953, Beijing had a population of fewer than 3 million. Since then the city’s population has  increased more than six times (Figure 1).

    Beijing is one of China’s four "directly administered municipalities" or "provincial level municipalities," along with Shanghai, Chongqing and Tianjin (Note 1). Moreover, like Shanghai and Tianjin, Beijing is essentially a metropolitan area, composed of an urban area and exurbs approximating a labor market. This is unlike Chongqing, which has extensive rural areas and extends far beyond any plausible definition of a metropolitan area (having the land area approximately the size of Indiana or Austria).

    The Growing Beijing Urban Area: In the 1990s, Beijing added 2,700,000 people and had a population of 13.6 million in 2000. Between 2000 and 2010, Beijing population increased by more than double the previous increase, or an increase of 6 million people.

    The Expanding Beijing Urban Area: Based upon the most recent census, the next edition of Demographia World Urban Areas will estimate an urban area (urban footprint) population of 17 million, with an urban land area of 1,350 square miles (3,500 square kilometers) and an urban density of 12,600 per square mile (4,900 per square kilometer) in 2011. Beijing ranks as the world’s 12th largest urban area and is larger than any urban area in the United States or Europe with the exception of New York. As in other urban areas of China, there is considerable undeveloped land in enclaves within the suburban areas, which could develop further, raising both the population and the density.

    Falling Urban Densities: Even so, Beijing is far less dense than before. Deng and Huang at the State University of New York, Albany, place the 1949 urban land area at less than 25 square miles (63 square kilometers. Based upon its early 1950s population of less than 3,000,000, the population density of the entire urban area could have been more than 100,000 per square mile or 40,000 per square kilometer (precise urban population is not available). This is greater than the highest density major urban area today, Dhaka (Bangladesh) at 90,000 per square mile or 35,000 per square kilometer. Today’s urban Beijing may have an overall population density one-eighth that of the 1950s.

    This illustrates a reality often missed by urban analysts, who confuse population growth with increases in population density. In fact, as the Evolving Urban Form series (Note 2) indicates, dispersion is at least as important in the expansion of megacities as population growth itself. Population densities generally decline as urban areas add residents.

    Suburbanizing Beijing: Consistent with the international urban trends, most growth over took place outside the core (see table at bottom and Figure 2). As Beijing has suburbanized, it has added "ring roads," (beltways or loops) which except for the 1st ring road (around the Forbidden City) are freeways, often with Texas-style frontage roads (See "2nd Ring Road" photo). Now there are six ring roads and there has been some discussion of a seventh, which would extend to the adjacent Hebei province to the south. Real-time traffic conditions on the first five ring roads can be seen at the Beijing Traffic Management Bureau site (the 6th ring road is outside the map)


    2nd Ring Road with frontage roads

    At the same time, Beijing’s expansive suburbs do not resemble the low-density suburbanization of Phoenix, Portland, Perth or Paris. Much of the development is in high rise condominiums and a substantial part is lower quality, lower rise development that houses Beijing’s large and growing migrant population (referred to as the "floating population"), most of whom do not have Beijing resident (hukou) status. Even so, there is no shortage of detached luxury housing (called "villas") in western style developments. such as "Orange County." More recently there is increasing demand for a more modern version of the "siheyuan" (courtyard) housing makes up the renown "hutong" areas of Beijing and other Chinese cities. One website refers to the "siheyuan" as the Chinese version of the "American Dream" and a recent China Daily commentary even suggested that this type of housing should constitute the future expansion of Beijing.  However, a quick review of real estate offerings for the new siheyuans, makes it clear that they are simply unaffordable for a growing middle class that finds it difficult to afford new flats in high rises outside the 4th ring road.  

    Hutong neighborhood (Dongcheng qu)

    A map of Beijing’s districts can be seen here, with color coding that corresponds to the geographical divisions in the table.

    The Inner City: During the last census period, less than one percent of the population growth has been in the inner city, which consists of the districts of Xicheng and Dongcheng, largely inside the 2nd ring road and contains the Forbidden City, Tiananmen Square, the Drum Tower (see photo below) and Bell Tower, and the Yonghegong Lama Temple (Buddhist). These districts, which contain nearly all of the remaining hutong (see photo above) residences grew only 2.2 percent. At 61,000 people per square mile (23,500 people per square kilometer), inner Beijing approaches the population density of Manhattan or the Ville de Paris.


    Toward the Drum Tower, from Jingshan Park

    Outside the Inner City: More than 99 percent of Beijing’s growth was outside the inner city. The first and second ring suburbs accounted for 96 percent of the growth, while the outer areas accounted for three percent of the growth.

    First Ring Suburbs: The four inner suburban districts of Beijing captured 52 percent of the provincial growth between 2000 and 2000. Overall, the four suburban districts added 3.2 million people, a nearly 50 percent increase in population. The population density in the inner suburbs was 19,400 per square mile in 2010 (7,500 per square kilometer). This is a higher density than the city of San Francisco. The inner suburban districts are generally located within the 5th ring road. The first ring suburbs include the district of Chaoyang, which has the largest population and where at least one-half of the population    generally lack Beijing residency (hukou). Chaoyang is also home to the new Beijing "central business district," (CBD) which is the largest concentration of high rise towers in the urban area includes  the controversial architectural icon, the CCTV Headquarters (photo at the top). The development of the CBD in the inner ring suburbs and other major commercial development are indicative of a dispersion of employment that, if permitted to continue, could ease Beijing’s legendary traffic congestion.

    Second Ring Suburbs: The outer suburban districts accounted for 44 percent of the provincial population increase between 2000 and 2000 and 2010. However, the outer suburban districts had the highest growth rate, at 72 percent, The outer suburban districts are generally located outside the 5th ring road and include considerable rural territory. The population density is 2100 per square mile (800 per square kilometer). Beijing Capital International Airport is located in this area, though it is under the jurisdiction of the inner ring district of Chaoyang. This airport is now the world’s second busiest in passenger volume, following Atlanta and having passed perennial runner-up O’Hare International in Chicago. At current growth rates Beijing Capital International could become the world’s busiest airport within five years.

    Outer Areas: The outer areas are largely rural and well outside the urban area. Nonetheless, the growth rate in the outer areas was well above the national rate and six times the rate of the inner city. The outer areas gained 186,000 people, approximately four times the inner city gain.

    Future Challenges: The floating population Beijing (and Shanghai) represented most of the population growth from 2000 to 2010. More than 7 million of Beijing’s nearly 20,000,000 population are migrant workers.   Government officials have expressed concern at the rate of population growth and have indicated an interest in severely limiting future population growth. Among Beijing’s considerable challenges is providing sufficient water for its large population. Beijing lacks the plentiful supply of water that is available to many urban areas of central and southern China (example, Shanghai, Nanjing, Wuhan and Chongqing) and the government is building a system to divert water especially from the Yangtze River. The 2020 census results could reveal a significant slowdown in growth, if these problems are not sufficiently addressed. 


    Beihei Park

    Wendell Cox is a Visiting Professor, Conservatoire National des Arts et Metiers, Paris and the author of “War on the Dream: How Anti-Sprawl Policy Threatens the Quality of Life

    ——–

    Note 1: What are translated as "cities" in China are not cities as understood in the West. A "shi" in China (translated as "city") is actually a region that may approximate a metropolitan area or labor market area in the West (with an urban core and a much larger surrounding rural territory). Some "shis" are much larger, however, such as Chongqing, which covers a land area similar to that that of Austria and nearly as large as Indiana. Chongqing and many other "cities" are far larger than any plausible metropolitan area definition.

    "Shi" may exist either at the provincial level (as in the case of Beijing, Chongqing, Shanghai and Tianjin) or it may exist within a provincial level jurisdiction, such as Nanjing in Jiangsu. Guangzhou in Guangdong or Wuhan in Hubei. Every square mile of a province (excepting the provincial level jurisdictions) is divided into shis, prefectures or comparable units, in the same way that US states are divided into county level jurisdictions or the regions of France are divided into departments. To complicate matters more, shis themselves may have county (xian) level shis within their borders, such as Cixi, a county level shi with approximately 1,000,000 people within the Ningbo shi in Zhejiang province.

    Note 2: Other megacities reviewed in this series have been: Jakarta, Los Angeles, Manila, Mexico City, Mumbai, New York ,Seoul and Shanghai .

    Photo: CCTV Headquarters in new Beijing CBD, Chaoyang district. Photo by Iamdavidtheking.

    All other photos by author.

  • Suburbanized Core Cities

    The suburbs of major metropolitan areas captured the overwhelming majority of population growth between 2000 and 2010, actually increasing their share of growth, as has been previously reported. However, it is often not understood that much of the recent central city (Note 1) growth has actually been suburban in nature, rather than core densification. In fact, historical core cities (Note 2) vary substantially. In some cases, core cities are largely pre-war and transit oriented, such as New York, Chicago and San Francisco. In other cases, much of historical core city is automobile oriented suburban in character. This article provides a classification of historical core cities based upon the extent of their pre-automobile cores as well as population and land area data.

    Central Cities before World War II: Auto-oriented suburbanization began before the Great Depression.  In 1940, transit’s urban market share in the United States appears to have been higher than that of Western Europe today (Note 3). Each of the nation’s largest metropolitan areas (then called "metropolitan districts") boasted a strong, dense core, and could be generally delineated by the city limits of the largest municipality.

    In the years after the Second World War, many cities annexed considerable territory. At the same time, a number of new major metropolitan areas emerged which effectively lacked a dense core. For the purposes of analysis, the historical core cities of the 51 major metropolitan areas (those with more than 1,000,000 population) have been divided into three categories, based upon the extent of the suburban development within their borders. The categories are defined in Table 1 and data is provided in Tables 2 and 3 in the attached PDF document.

    Table 1
    Classification of Historical Core Municipalities

    Nature of Historical Core Municipality:
    Classification based upon 2010 City Limits

    Large Urban Core in 1940?

    2010
    City Limits

      Pre-War & Non-Suburban

    Yes

     Is pre-war core; nearly all included land area was developed by 1940. Little development that is post-war suburban in character. Little or no change in boundaries since 1940.

      Pre-War  & Suburban

    Yes

    Includes pre-war core, however contains substantial development that is post-war suburban in character (2010 boundaries contain substantial areas that were greenfield in 1940)

      Post War & Suburban

    No

    Has smaller pre-war core: less than 100,000 population in 1940 and nearly all development is post-war suburban in character.

    The historical core municipality is the municipality with the largest 1940 population in the present metropolitan area (metropolitan statistical area).
    There can be more than one historical core municipality in a metropolitan area, with the exception below.
    There can be a second historical core municipality if (1) it is adjacent to a historical core municipality classified as "Pre-War  & Non-Suburban," (2) had a 1940 population at least 25 percent of the first historical core municipality and (3) a population density of at least 5,000 per square mile.
    Multiple municipality names listed in some other metropolitan areas for reference purposes.

    Pre-War & Non Suburban: The first category is the "Pre-War & Non Suburban" historical core cities. Each of these 19 cities is itself a pre-automobile core. City boundaries have changed little since before World War II and nearly all land was developed at that time (Note 3).

    Overall, these cities had a population density of 11,900 per square mile in 2010 (Figure 1). However, 16 of the cities have lost population since 1940, with only New York, San Francisco and Oakland having gained population, albeit very modestly. (Oakland lost population over the past decade.) Between 2000 and 2010 the "Pre-War & Non Suburban" historical core cities lost 424,000 people, or 2.2 percent of their population (Figures 2 and 3). Seven gained population, though in five of these cases (Boston, Hartford, Philadelphia, Providence and Washington) the 2010 population remained well below mid-century levels.

    Pre-War & Suburban: The second category is the "Pre-War & Suburban" historical core cities. These 27 cities had pre-automobile cores, usually quite small, in 1940, but also include (in their 2010 borders) substantial land that was undeveloped in 1940. Substantial automobile-oriented suburban development has occurred in these areas. The strong automobile oriented suburban influence is indicated by the average population density of 2900 people per square mile of land area, approximately one-fourth the density in the "Pre-War & Non Suburban" category.

    On average, the 2010 land area of the "Pre-War & Suburban" historical core cities is 3.2 times the land area of the corresponding urban areas in 1950 (areas of continuous development or the "urban footprint"). These urban areas included both the historical core city and the suburbs (Note 4).   The city of Jacksonville covers the most land area relative to its 1950 urban area, at 14.7 times. The city of Portland, the recipient of frequent praise by advocates of densification, covered more area in 2010 than its entire urban area in 1950 and its population density today is less than that of the entire urban area in 1950.

    The "Pre-War & Suburban" historical core cities added 1,520,000 people between 2000 and 2010. This translates into an average growth of 7.8 percent relative to the 2000 population. Three cities grew more than 100,000. Louisville added 341,000 people principally through a city – county merger, after its previous annexations had failed to stop its population decline. Between 1950 and 2000, Louisville has lost nearly one-third of its population while adding more than 50 percent to its land area.

    Charlotte added 191,000 people, principally due to a continuing annexation program. San Antonio and Houston took advantage of considerable undeveloped land within their city limits to add 183,000 and 146,000 people respectively.

    Post-War & Suburban:  The third category is the "Post-War & Suburban" historical core cities. None of these seven cities had more than 100,000 population in 1940 or a large pre-automobile core; these are essentially suburbanized cities.  In each case, the cities have undertaken huge annexations. On average, the 2010 city limits include nearly 6 times as much land as the corresponding urban areas in 1950. The city of San Jose, known for its densification policies, covers nearly 3 times as much land as its entire urban area in 1950, which included the city and all of the suburbs (Figure 4).

    The "Post-War & Suburban" historical core cities added 619,000 people between 2000 and 2010, for an increase rate of 15.5 percent, the largest percentage growth of the three categories.

    Perhaps surprisingly the population density of the "Post-War & Suburban" historical core cities was one-quarter above that of the "Pre-War & Suburban" category, at 3700 per square mile. This may be at least partially driven cities like San Jose, Las Vegas and Riverside-San Bernardino, which have generally avoided planning that required larger lots and below market densities.

    The cities of Philadelphia and Phoenix reflect these differing patterns.   In 2010 Philadelphia had a population density of more than 11,300 people per square mile and covered an area of 135 square miles. The city of Phoenix had a population density of under 3000 people per square mile and covered more than 500 square miles. Not even one square mile of the 2010 city of Phoenix equals the average density of Philadelphia. In 1940, Philadelphia had a population of 1.9 million, 30 times that of the 65,000 in Phoenix.

    As would be expected in a dense historic core city, Philadelphia has a substantial transit work trip market share, at 25 percent. This is five times that of the surrounding suburbs (5 percent). In contrast, the city of Phoenix has s a transit work trip market share of only three percent, below that of the Philadelphia suburbs. 

    Suburban Development Makes Cities Grow: As the data above indicates, virtually all net core city population growth over the past decade has been suburban in nature. Core cities characterized by substantial automobile-oriented suburbanization added more than 2.1 million residents, while the cities with little   automobile-oriented suburbanization lost more than 400,000. It turns out that even most “core” cites are more suburban than many imagine.

    ——————–

    Note 1: "City" has multiple meanings and analysts have not always provided  sufficient clarity when using the term. For example, "city" can mean a metropolitan area, and urban area, a municipality (incorporated jurisdiction) or as in China, a region either at the provincial or sub-provincial level. As used in this article, the term "city" means a municipality unless otherwise indicated.

    Note 2: The historical core city is the city in the present metropolitan area that had the largest population in 1940. Usually, this is the first named city in the official Census Bureau title. However, in two cases (Virginia Beach-Norfolk and Riverside-San Bernardino), the second named city is the historical core city because it was the largest in 1940.

    Note 3: There are no comparable data on overall transit market shares between Europe and the United States. However, Eurostat data for nearly 150 European metropolitan areas indicates that transit’s work trip market share averages approximately 17 percent. The same population range (over 100,000) of US metropolitan areas has a transit work trip market share of six percent. In 1940, the overall US transit market share was approximately 14 percent. Because transit work trip market shares are generally substantially higher than overall shares, it is suggested that the 1940 US transit market share was greater than the current share in Europe.

    Note 4: The city of Chicago made a substantial annexation largely to incorporate the land for O’Hare International Airport. This annexation did not materially increase post-war suburban development in Chicago and the city is thus classified as "Pre-War & Non-Suburban."

    Note 5: 1950 used because urban areas were not designated before that time.

    Wendell Cox is a Visiting Professor, Conservatoire National des Arts et Metiers, Paris and the author of “War on the Dream: How Anti-Sprawl Policy Threatens the Quality of Life

    Photo: City of San Antonio annexation map from the San Antonio Planning and Development Department. The red rectangle is the land area of the city in 1940. 

  • Biggest Boomer Towns

    The boomer generation, spawned (literally) in the aftermath of the Second World War, will continue to shape the American landscape well into the 21st Century. They may be getting older, but these folks are still maintaining their power. Those born in the first ten years of the boomer generation  — between 1945 and 1955 — number 36 million, and they will continue to influence communities and real estate markets across the country, especially as they contemplate life after kids and retirement.

    Much has been written about where “empty nesters” might move as their children move off on their own. One longstanding favorite is the notion that, having jettisoned their children, the boomers will also desert their suburban communities for the bright city lights.

    Unfortunately for developers — some of whom have invested heavily in high-end housing for urbanizing “empty nesters” — the actual data do not support this thesis. Indeed, our analysis of migration by this cohort in the past 10 years shows a 10.3% decline among core city dwellers, a loss of some 1.3 million people over the past decade. For this analysis, Forbes, with the help of demographer Wendell Cox, looked at population numbers from the Census for boomers aged 45 to 54 in 2000 and compared them with the numbers for those ages 55 to 64 in 2010.

    These population changes include reductions due principally to deaths. Census data do not include mortality information. This cohort lost 3.2% of its population over the 10 years. This would only marginally reduce the changes between 2000 and 2010, while the scale of differences between the metropolitan areas would be identical.

    So where are these surviving boomers settling as they enter their likely extended golden years?  The results may surprise urban boosters who have confidently expected them to flock downtown.

    To be sure, a few of the highly affluent — the ones mentioned in the mainstream media — may purchase homes, or pied-à-terres, in places like Manhattan, Chicago’s Gold Coast or San Francisco. But these areas actually have suffered an exodus of boomers over the past decade. In our ranking of the 51 largest metros in the U.S., the urban cores of San Jose, San Francisco, Los Angeles and Chicago scored near the bottom, suffering double-digit percentage losses of boomers. According to the last Census, New York’s urban core, which the Daily News suggested is packed with aspiring seniors, lost 12% of boomers in their mid-50s to mid-60s  — or about 274,000 people.

    Over the past three years  you could blame this loss on the economy, which has postponed retirements brought home many of the boomers’ young, largely unemployed or underemployed children back to the suburban homestead. Or you can credit it to more active lifestyles among boomers who appear to working later than ever. According to a Careerbuilder.com survey, over 60% of workers over 60 indicated they are postponing retirement.

    Yet perhaps something more profound is at work here. An analysis of those who were 55 to 65 in 2000 and 65 to 75 in 2010 reveals an even stronger anti-urban bias, with an over 12% drop in city dwellers. Since these folks are far less likely to have kids at home and more properly retired, this cohort’s behavior suggests that aging boomers are if anything less likely to move to the cities in the next decade.

    Indeed, if boomers do move, notes Sandi Rosenbloom, a noted expert on retirement trends and professor of Planning and Civil Engineering at the University of Arizona, they tend to move to less dense and more affordable regions. The top cities for aging boomers largely parallel those that appealed to the “young and restless” in our earlier survey. The top ten on our list are all affordable, generally low-density Sun Belt metros:

    1. Las Vegas, Nev.
    2. Phoenix, Ariz.
    3. Tampa-St. Petersburg, Fla.
    4. Orlando, Fla.
    5. Riverside-San Bernardino, Calif.
    6. Raleigh, N.C.
    7. Austin, Texas
    8. San Antonio, Texas
    9. Jacksonville, Fla.
    10. Charlotte, N.C.-S.C.

    But according Sandi Rosenbloom, a noted expert on retirement trends and a professor of planning and civil engineering at the University of Arizona, most boomers are staying put, largely in the suburbs they settled in decades ago.  The propensity to move, she points out, starts to drop precipitously as people leave their early 30s. Roughly 1 in 3 people in their 20s move in a given year; by the time they enter their 40s, that figure slides to about 1 in 10. As people age into their 50s and beyond, the percentage drops to roughly 5%, or 1 in 20.

    “The boomers are staying put more than anyone thought,” Rosenbloom says. “People of that generation tend to own their own homes and stay there. The idea that they are moving to the city really comes from the wishful thinking school of planning.”

    The recession has exacerbated this stay-at-home trend. The number of people moving is at its lowest level since the early 1960s. When boomers do decide to move, Rosenbloom notes, they do so largely for prosaic reasons, such as being closer to children or, more important, grandchildren.

    Others succumb to the temptation to cash out expensive housing in metros like New York, Los Angeles, the Bay Area or Boston for less costly residences in Sun Belt locales. Housing in and around these core cities, particularly in attractive neighborhoods, Rosenbloom adds, are simply too expensive for the vast majority of budget-conscious seniors.

    Much of this also has to do with the lifestyle preferences of both boomers and seniors, which appear far different than those put forth by urban pundits. People over 55 that Rosenbloom has interviewed usually express a preference to stay or relocate in places that are less crowded and congested. Furthermore, most are reluctant to give up their cars, and many are less able to walk than drive. This may explain why most retirement communities end up on the urban fringe or farther.

    This trend — which Rosenbloom has also encountered in the U.K., Australia, Canada and New Zealand — is also reflected by the growing shift to smaller towns and cities among both aging boomers and seniors. The “young and restless” may head to suburbs, particularly in the lower-cost Sun Belt cities, but some older Americans appear headed to even less densely populated regions. Over the past decade over 1 million aging boomers and seniors moved to more smaller cities and rural locations from suburban or urban locations.

    What do these trends suggest for the future of our communities and real estate? For one, the big opportunities for selling to aging boomers will remain primarily in the suburbs and some select more rural locations. We also can expect the new senior citizens to move to more affordable places close to their children.

    These findings do provide some long-term hope for the housing market, particularly in suburbs. Leading demographers have been busy predicting a massive drop-off in single-family homes as boomers retire and their children leave. Yet our analysis on the Census reveals that most boomers — as well as those older than them — are staying in the suburbs a lot longer than expected. Many will likely to stay in their homes and old neighborhoods well into their 70s or even 80s, leaving either their home either in an ambulance or to an assisted living facility.

    Developers and planners anxious to service aging boomers should, instead of building downtown towers, address the needs of this generation precisely where they now live and are likely to stay. This could include adding to new residential options in the suburbs to enlivening local shopping districts while boosting senior services in everything from recreation and public safety to health care. As the rock and roll generation heads toward its dotage, both business and communities need to adjust their strategies based not on fantasies but on the realities so clearly evidenced by the Census.

    This piece originally appeared at Forbes.com.

    Joel Kotkin is executive editor of NewGeography.com and is a distinguished presidential fellow in urban futures at Chapman University, and an adjunct fellow of the Legatum Institute in London. He is author of The City: A Global History. His newest book is The Next Hundred Million: America in 2050, released in February, 2010.