Category: Suburbs

  • The Protean Future Of American Cities

    The ongoing Census reveals the continuing evolution of America’s cities from small urban cores to dispersed, multi-polar regions that includes the city’s surrounding areas and suburbs. This is not exactly what most urban pundits, and journalists covering cities, would like to see, but the reality is there for anyone who reads the numbers.

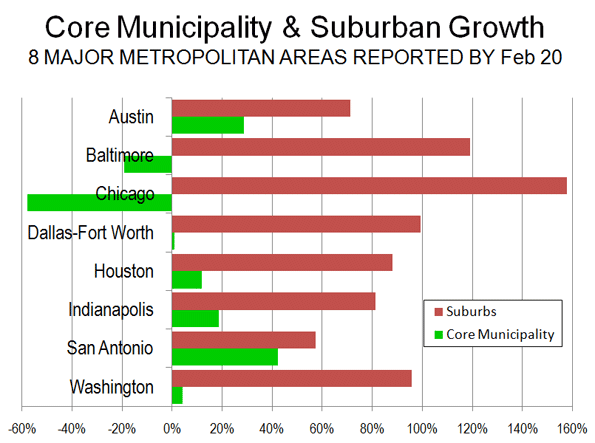
    To date the Census shows that  growth in America’s large core cities has slowed, and in some cases even reversed. This has happened both in great urban centers such as Chicago and in the long-distressed inner cities of St. Louis, Baltimore, Wilmington, Del., and Birmingham, Ala.

    This would surely come as a surprise to many reporters infatuated with growth in downtown districts, notably in Chicago, Los Angeles, Denver and elsewhere. For them, good restaurants, bars and clubs trump everything. A recent Newsweek article, for example, recently acknowledged Chicago’s demographic and fiscal decline but then lavishly praised the city, and its inner city for becoming “finally hip.”

    Sure, being cool is nice, but the obsession with hipness often means missing a bigger story: the gradual diminution of the urban core as engines for job creation. For example, while Chicago’s Loop has doubled its population to 20,000, it has also experienced a large drop in private-sector employment, which now constitutes a considerably smaller share of regional employment than a decade ago. The same goes for the new urbanist mecca of Portland as well as the heavily hyped Los Angeles downtown area.

    None of this suggests, however, that the American urban core is in a state of permanent decline. The urban option will continue to appeal to small but growing segment of the population, and certain highly paid professionals, notably in finance, will continue to cluster there.

    But the bigger story — all but ignored by the mainstream media — is the continued evolution of urban regions toward a more dispersed, multi-centered form. Brookings’ Robert Lang has gone even further, using the term “edgeless cities” to describe what he calls an increasingly “elusive metropolis” with highly dispersed employment.

    Rather than a cause for alarm, this form of  development  simply reflects  the protean vitality of American urban forms.  Two regions, whose results were released last week, reveal these changing patterns. One is the Raleigh region, which has experienced a growth rate of 42%, likely the highest of the nation’s regions with a population over 1 million. This metropolitan area, anchored by universities and technology-oriented industries, is among the lowest-density regions in the country, with under 1,700 persons per square mile, slightly less than Charlotte, Nashville and Atlanta.

    Unlike the geographically constrained older urban areas, Raleigh’s historical core municipality experienced strong growth, from 288,000 to 404,000, a gain of 40%. This gain was aided by annexations that added nearly 30% to the area of the municipality (from 113 to 143 square miles). The annexations of recent decades have left the city of Raleigh with an overwhelmingly suburban urban form. In 1950, at the beginning of the post-World War II suburban boom, the city of Raleigh had a population of 66,000, living in a land area of only 11 square miles.

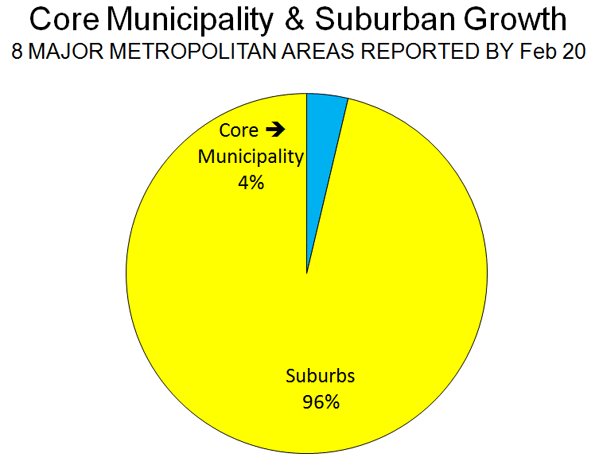
    Even here, however, the suburbs (the area outside the city of Raleigh) gained nearly two-thirds of the metropolitan area growth (65%) and now have 64% of the region’s population. Over the last ten years, the suburbs have grown 43%. It is here that much of the economic growth of the Research Triangle has taken place, as companies concentrate in predominately suburban communities such as Cary.

    Yet in most demographically healthy urban regions, the growth continues to be primarily in the suburban centers. One particularly relevant example is the Kansas City area, a dynamic region anchoring what we have identified as “the zone of sanity.” Like most American regions, the Kansas City area is growing, but in ways that often do not resemble the fantasies of urban density boosters.

    KC’s growth pattern is important and could be a harbinger of what’s to come in this decade. Along with Indianapolis, this resurgent Heartland region is expanding faster than the national average. It is also attracting many talented people, ranking in our top ten list of the country’s “brain magnets,” a performance better than such long-standing talent attractors as Seattle, Portland, San Francisco, and Boston. Between 2007 and 2009, the Kansas City region’s growth in college-educated residents was more than twice the rate of our putative intellectual meccas of New York, Chicago or Los Angeles.

    But despite the wishes of some  in Kansas City’s traditional establishment, this cannot be interpreted as meaning that  the “hip and cool” are being lured en masse to the city’s inner core. Over the past decade, as in most American regions, Kansas City has expanded far more outward than inward. Despite a modest increase in the city’s population of some 18,000 — much of it in the city’s furthest urban boundaries — the city’s population remains below its 1950 high. On the other hand, some 91% of its 200,000 population increase occurred in the suburban periphery.

    Critically, it is important to note that this expansion reflects not so much the growth of “bedroom” communities, but a dramatic shift of employment to the periphery. By far the most important center for this new suburban growth in jobs and people lies across the river in Johnson County, Kan.. Over the past decade, Johnson County has accounted for roughly half of the region’s total growth.

    Johnson County  – which boasts among the highest levels of educated people in the country — also has become the primary locale for many technology and business service firms, with more people commuting into the area than out. This reflects an increasingly suburbanized economic base. Over the past decade the urban core of Jackson County has lost 42,000 jobs, while the surrounding suburbs have grown by 20,000, with the biggest growth in largely exurban Platte County.

    So what does this tell us about the future of the American urban region?  Certainly the expansion of relatively low-density peripheral areas negates the notion of a  ”triumphant” urban core. Dispersion is continuing virtually everywhere, and with it, a movement of the economic center of gravity away from the city centers in most regions.

    But in another way these patterns augur a bright future for an expansive American metropolis that, while not hostile to the urban center, recognizes that most businesses and families continue to prefer lower-density, decentralized settings.  The sooner urbanists and planners can accommodate themselves to this fact, the sooner we can work on making these new dynamic patterns of residence and employment more sustainable and livable for the people and companies who will continue to gravitate there.

    This piece originally appeared at Forbes.com

    Joel Kotkin is executive editor of NewGeography.com and is a distinguished presidential fellow in urban futures at Chapman University, and an adjunct fellow of the Legatum Institute in London. He is author of The City: A Global History. His newest book is The Next Hundred Million: America in 2050, released in February, 2010.

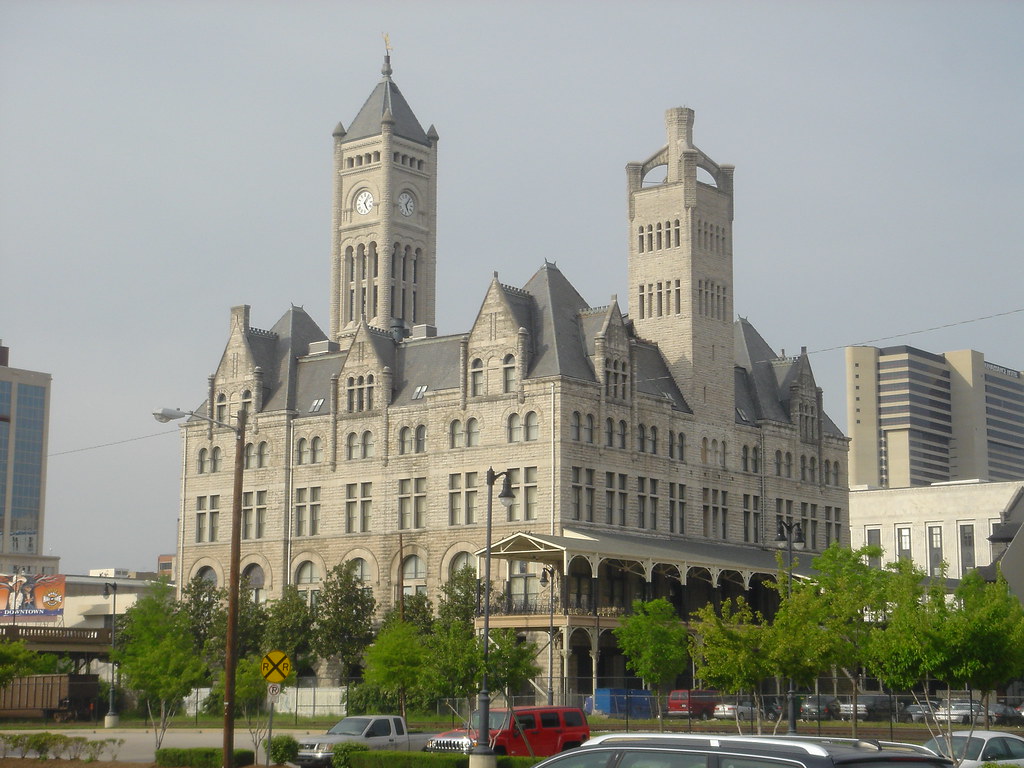
    Kansas City skyline photo by Tim Samoff

  • Major Metropolitan Areas: Summary of the First 20

    Data is now available for 20 of the nation’s 52 metropolitan areas with more than 1,000,000 population. The early results indicate a pattern of accelerating dispersion of the population to the suburbs as is indicated in the table below. Thus far, historic core municipality growth has been approximately one-half the 1990s rate. During the 2000s, the historic cores have accounted for 8.8 percent of metropolitan growth, down nearly one-half from the 1990s rate.

    Summary of 2010 Census Results
    Major Metropolitan Areas (Over 1,000,000 Population)
    Historical Core Municipalities
    Suburbs
    Metropolitan Areas
    2000-2010
    Population Gain 682,000 7,047,000 7,729,000
    Percentage Increase 6.7% 23.7% 17.7%
    Share of Growth 8.8% 91.2% 100.0%
    1990-2000
    Population Gain 1,229,000 6,718,000 7,948,000
    Percentage Increase 10.8% 30.5% 23.7%
    Share of Growth 15.5% 84.5% 100.0%
    Includes 20 of 52 metropolitan areas released by 3-3-2010

  • Is Nashville the Next Boomtown of the New South?

    I traveled to Nashville for the first time in 2007, spending most of my time in the downtown area. I posted my impressions here, noting the high growth and high ambition level as well as the fantastic freeways, but also the generally unimpressive development and built environment.

    I did another fly-by in April 2008. I made a conscious effort to try to get out and see different areas this time around. My tour guide was an Indy native who had spent the last decade or so in the northeast. He’d moved to the city about a year previously, so was seeing some of this for the first time himself. But it worked well, I thought.

    I believe Nashville is an extremely important case study for metros in the Midwest to examine. Here is a city that was a sleepy state capital for many years while other southern towns such as Atlanta and Charlotte took off. Then it began heading on an upwards trajectory. It is not yet at such a high growth rate that it appears to be a completely different sort of place than the Midwest. Its population growth is only 1.9% per year, for example, not much higher than Midwest growth champion Indianapolis at 1.5%. But all the trend lines are accelerating. Corporate headquarters are flocking, in city development is booming, transplants from the north are arriving. It would not surprise me to see this city pop into a higher gear when the economy turns upwards again.

    Nashville is a great case study because we can observe the inflection point in growth more or less as it happens. And also try to make sense of what is driving it. And to understand why Midwestern cities aren’t seeing it. I look at Nashville and ask myself: what does this place have on the Midwest? Compare it to Columbus, Cincinnati, Indianapolis, Louisville, Kansas City, and Milwaukee and see if anything jumps out that would explain it. Some unique factor of Nashville. Consider:

    • Nashville is smaller than most of those places today, so it isn’t size
    • It can’t be just because Nashville is in the south or a no income tax right to work state. Memphis in the exact same state and is hurting. Birmingham and Montgomery haven’t done much in right to work Alabama.
    • Its college degree attainment of 31% is below many comparable Midwest cities, though it should be noted that Nashville is moving up the league tables fast. It was recently ranked the 4th biggest “brain magnet” in the United States.
    • It has no particular unique industry or assets. It can cite its Music City USA image, which certainly drives tourism and money. But Midwestern cities have other equivalent things they can counter with. Plus, it was Music City USA all the time it was a sleepy state capital as well.
    • Just being the state capital doesn’t explain it. Indy and Columbus are both in that role and are getting out paced by Nashville.
    • Having a consolidated city-county government is not unique. Indy and Louisville are both consolidated, and Columbus is quasi-consolidated because of the ability of that city to annex most of Franklin County and even parts of several adjacent counties.
    • There are mountains, but the geography does not appear to be particularly compelling.
    • There are not fabulous historic districts in every region. In fact, while there are some nicer neighborhoods, much of the city is built out exactly like most Midwestern burgs of equivalent size. A lot of it is outright dumpy.
    • Its cultural institutions are not as advanced as Midwestern ones. The Nashville Symphony isn’t going to take on the Cincinnati Symphony any time soon, that’s for sure.
    • It doesn’t have some fortress home grown companies that are driving it.
    • It has Vanderbilt University, but most Midwestern cities have a good school in them too.

    I compare Nashville to the top performing Midwest metros and just scratch my head. Nashville’s arguably got nothing on the Midwest and in many ways is playing from an inferior position. So what is going on?

    I’ll take a shot at explaining a few things I’ve noticed. I’m not saying these are necessarily the answers. But they are things to consider. If I were head of strategy for a Midwestern metro, I’d be conducting an extensive peer city comparison of Nashville to try to figure it out in more detail. But here are some thoughts:

    • First, as I previously noted, is the extremely high ambition level. These guys are clearly looking at places like Atlanta, Dallas, Charlotte, etc. and saying “Why not us?” Their mission is to become one of America’s great cities. There’s no “era of limits” in Nashville. You see this come through, for example, in their convention center plans, which call for 1.2 million square feet. It comes through in their highways, which are being built 8-10 lanes with HOV lanes, as if getting ready to become the much bigger city they plan to be. It shows in the numerous residential high rise and midrise projects. It shows in how Nashville, unlike every comparable Midwest metro, already has a commuter rail line in service. Midwesterners recoil from change, and would view becoming the next Charlotte or Atlanta with horror. But Nashville is eager to move up to the premier league, so to speak.
    • Second is the unabashedly pro-growth and pro-business stance. Every development in the Midwest is opposed by some group of NIMBY’s. Densification, even in downtown areas, is often anathema to influential neighbors. Not in Nashville. Huge tracts of inner city are being rebuilt from vacant lots or single family homes into multi-story town houses or condos. There are midrises all over the place. It does not appear that development has any problem getting approved there.
    • Third is low taxes and costs. Tennessee does not have a state income tax. Electricity from the TVA is dirt cheap. Property taxes cannot be increased without a public vote. It remains to be seen if this environment can be sustained, but for right now, cost appears to be an advantage.
    • Fourth is that they’ve embraced instead of rejecting their heritage. Rather than saying that country music is for hillbillies and an embarrassment to their new ambitions as a big league city, they’ve proudly embraced it. They updated the image with a glitzy, “Nashvegas” spin and made it the core of what Nashville is all about. Most Midwestern elites seem to view their existing heritage negatively. But great cities have to spring from the native soil in which they are born. Their character has to be organic. Import all the fancy stores, restaurants, sports teams, transit lines, etc. you want, but it won’t distinguish your city. Nashville learned this lesson well, probably from Atlanta. The southern boomtowns took their existing Southern heritage, dropped the negative items that needed to be changed, updated the core positive elements, and created the vision of the “New South”. This is something that can be embraced by the masses, unlike the elitist transformations that are often promulgated.
    • Fifth is that, again, they appear to have studied the lessons of places like Dallas, Atlanta, Charlotte, etc. They’ve seen the need for freeways. They’ve looked at the style of development and the neo-traditional urban form. I was very impressed to see that there while most condo developments and such were fairly undistinctive, I did not note any that exhibited poor urban design form. When I consider the poorly designed projects that are frequently implemented in, say, downtown Indianapolis, it is easy to see who gets out more. Nashville has done its homework.
    • Sixth, Nashville is realistic and open to self-criticism without being self-flagellating. I posted my previous take on the city on a discussion forum dedicated to that city. Given the modestly negative tone contained in much of it, I expected to get crucified. Surprisingly, most of them basically agreed with it. Too many cities in the Midwest either engage in naive boosterism or wallow in woe-is-us. Perhaps because of the large number of newcomers, there’s a more realistic assessment of where Nashville stands. And this enables rational decisions about where it needs to go.

    If anyone else has observations to share, I would love to hear them.

    Here are some photographs I took while there. First, a view of the Tennessee capitol building across a green space I believe is called the Bicentennial Mall.


    A street scape in Hillsboro Village, a small commercial district near Vanderbilt University.


    The Pancake Pantry in Hillsboro Village, a breakfast place of high local repute. I was initially skeptical but the food was actually pretty darn good. This place is huge and there was still a line out the door at 10am on a Friday morning. Pretty crazy.


    The storefronts are a nice urban touch, but if you look behind this building you see a gigantic parking lot. This is perhaps an example of faux-urbanism. Putting the parking lot in the back doesn’t make it any less a strip mall. It is a difference in form, not function.


    One of the many vacant lots with a “condos coming soon” sign.


    The main road heading west of out downtown, West End Avenue, is developed at very high densities. I haven’t seen much in the way of this in most Midwestern cities. Midrises line both sides of the road basically from downtown to the interstate loop. It’s a six lane mega-street that moves tons of cars, but appears to have great bus service as well.


    Here is another one under construction.


    A proposed, but I believe not yet funded, high rise development. Indianapolis readers will no doubt recognize one of the towers as a clone of the proposed Intercontinental hotel for Pan Am Plaza that lost out as the convention center anchor hotel.


    If you continue out to the west from here, you run into neighborhoods like Green Hills, which is where the most premier shopping in the area is found, and the suburb of Belle Meade, which serves as Nashville’s mansion district. Unlike traditional Midwestern mansion districts, this one is more rural in nature, with large estates that wouldn’t be out of place in a plantation. I did not take pictures of these areas, however.

    Back closer to downtown is a nearby area known as the “Gulch”. It is not too far from Nashville’s Union Station.


    This appears to be some seedy industrial district that is being transformed all at once by a series of large developments. It also has several clubs and restaurants. I ate at a seafood place called Watermark that was surprisingly good. I believe most of the places are upscale chains, though I’m not sure if Watermark is or not. Here’s a picture of some of the development.


    More development


    North of downtown is a small historic district called Germantown. This was rather unimpressive if you ask me. I didn’t see much that was German about it. It sure isn’t Columbus’ German Village, that’s for sure. There were some restaurants there. I had lunch at one of them which, fortunately for them, I can’t remember the name of because it was terrible. This area is mostly older single family homes.


    The amazing thing about this area is that almost every vacant or industrial parcel was being redeveloped as condos. This really brought home to me the difference between Nashville and the Midwest. Were this, say, the Cottage Home area in Indianapolis, the local neighborhood association would use their historic district status to keep developments like these out. In Nashville, they are seen as a positive. Here are some examples.


    More condos


    More condos with retail space. Sorry for the very blurry pic but it was raining as you can see.


    More condos being built, and still more proposed.


    You get the picture. Also, note from all these photos the lack of design disasters. These are all workmanlike structures. The challenge for Nashville is that while there is a ton of new development, all of it is in a relatively generic, undistinguished style that could be in the downtown of almost any city. I did not get a strong sense of any type of vernacular style emerging. That is something I’d be looking for if I were them.

    Lastly, here’s one suburban example that shows something I pointed out last time. Namely that even in brand new, upscale subdivisions they aren’t putting in sidewalks on both sides of the street. I find this very odd. While I noticed some bike lanes this time around, Nashville’s definitely got a long ways to go when it comes to pedestrian and bicycle friendliness.


    Nashville is definitely a city that is on an upward trajectory. The volume of urban development and the business attraction success are impressive. It is exceeding even the best performing Midwest metros in that regard. However, it still lags the top southern and western metros. The current rate is very healthy, but probably isn’t sufficient to realize the civic ambitions. It remains to be seen whether Nashville can put it in another gear and take its place among the boomtowns, or whether it will merely stay on its current growth path. Either path is possible or a valid civic choice. While always possible, the likelihood that Nashville is going to take a major downtown does not appear high in the short term.


    Aaron M. Renn is an independent writer on urban affairs based in the Midwest. His writings appear at The Urbanophile, where this piece originally appeared.

  • The Evolving Urban Form: The Valley of Mexico

    The last 60 years of urban growth in the Mexico City area should dispel any belief that suburban dispersion is principally an American phenomenon or even limited to the high income world. Over the last 60 years, all of the population growth in what is now called the Valley of Mexico metropolitan area and urban area has occurred outside the urban core (See Map). In this regard, the declining population in Mexico City urban core mirrors that of other urban cores, such as the city of Chicago, the city of Copenhagen, the city of Paris and nearly all other urban cores in the high income world.


    Map: Valley of Mexico Urban Area: Northernmost Urbanization Excluded

    A New Name: the Mexico City metropolitan area is one of only two out of the world’s more than 25 megacities (10 million or more population) that has adopted a name more reflective of geographical reality, shedding reference to the urban core, which is declining in influence virtually everywhere. The other name-changing metropolitan area is Jakarta where the name Jabotabek is an acronym composed of the beginning of four large municipality names.  Mexico’s national statistics bureau, the Instituto Nacional de Estadística y Geografía (INEGI) has designated the Mexico City metropolitan area as the "Zona Metropolitana del Valle de México," which translates to the Valley of Mexico metropolitan area.

    According to the broadest definition, the Valley of Mexico metropolitan area had a population of 21.4 million according to the 2010 census. The Valley of Mexico joins a lengthening list of metropolitan areas with more than 20 million people. No reliable world ranking of metropolitan areas is feasible, because of varying definitions by nations and other population estimating sources (Note: Metropolitan Ranking). It can be said with assurance that the world’s largest metropolitan area is Tokyo – Yokohama, with approximately 40 million people and perhaps even that Jabotabek ranks second at nearly 30 million people. Other metropolitan areas making legitimate claims to having more than 20 million people include Seoul, Sao Paulo, Mumbai, Delhi, Manila and New York (Note: New York).

    The Valley of Mexico Urban Area

    In the early 1980s, the Valley of Mexico was expected to become the world’s largest urban area. A number of factors worked to keep that from happening, such as a falling birthrate and the devastating earthquake of 1985, which slowed growth and the simple problems created by the unmanageable scale of the region. This led to greater decentralization both to peripheral parts of the Valley of Mexico as well to other Mexican states.   

    In 2010, the Valley of Mexico urban area had a population of 19.4 million people. The urban area is estimated to cover 780 square miles (2,020 square kilometers), for a population density of 25,000 per square mile (9,700 per square kilometer). This makes the Valley of Mexico urban area approximately one-fourth the density of Dhaka (Bangladesh), the densest urban area in the world and similar in density to the Cairo urban area. The Valley of Mexico is less than three times as dense as the Paris urban area and less than four times the density of North America’s most dense urban areas, Los Angeles and Toronto. The next edition of Demographia World Urban Areas: Population & Projections (current edition) will show the Valley of Mexico to be the world’s ninth largest urban area.  

    The key issue here is a population growth rate that has plummeted since 1950. In the 1950s and the 1960s, the Valley’s population growth exceeded 5.5% annually. The rate fell to 4.0% during the 1970s, and dropped to 1.6% in the 1980s and 1990s. By the 2000s, the annual population growth rate had fallen to 0.8% (Figure 1).

    Urban Core: Former Mexico City:  In 1950, the core “delegations” constituted Mexico City – Cuahtemoc, Miguel Higalgo, Venustiano Carranza and Benito Juarez had 2.23 million people out of the urban area’s 2.88 million. Mexico City covered a land area of 54 square miles (139 square kilometers). In 1970 the population rose to a peak of 2.85 million with a peak population density of 53,000 persons per square mile (20,500 per square kilometer). At this point a severe population decline began, with a drop of more than 1.1 million people to 1.68 million by 2005. This represented a 41 percent drop in population density, two 31,000 persons per square mile (12,000 persons per square kilometer). A modest increase to 1.73 million people occurred between 2005 and 2000 in the urban core.

    In 1950, the urban core accounted for 78 percent of the urban area population. By 2010 this figure had fallen to under nine percent (Figure 2).


    The Suburbs: As of the 2010 census, more than 90 percent of the urban area population lives in what has historically been the suburbs.  Since 1950, the urban core has lost 500,000 residents; while suburban areas have added more than 17 million. Thus, the suburbs have accounted for more than 100 percent of the growth in the urban area over the past 60 years (Figure 1). During the 1950s, the suburbs accounted for more than 80 percent of the growth and in each decade since that time the suburbs have been 95 percent or more of the growth.

    In the earlier decades, the suburbs inside the Distrito Federal (but still outside the urban core) accounted for most of the growth, 93 percent during the 1950s and 53 percent during the 1960s. However from the 1970s to the present the growth has shifted to the more distant suburbs outside the Distrito Federal. These suburbs have captured at least 70 percent of the growth, including between 80 percent to 90 percent over the past two decades.

    Valley of Mexico Metropolitan Area

    The trend of continuing dispersion is evident in the metropolitan area trends. As defined in 2005, the Valley of Mexico metropolitan area included the 16 "delegations" (boroughs) of Mexico City (the Distrito Federal), and 60 municipalities (municipios), 59 of which are in the adjacent state of Mexico and the last of which is in the more northerly state of Hidalgo. In the late 2000s, another 28 municipalities in the state of Hidalgo were proposed for addition to the metropolitan area (and are included in this analysis).

    The metropolitan area is divided into five parts, the urban core (pre-1994 Mexico City), the urban balance of the Distrito Federal, inner ring municipalities, which are adjacent to the Distrito Federal, the outer municipalities before the proposed expansion and the 28 municipalities in the state of Hidalgo.

    Between 2000 and 2010, the urban core of the former Mexico City added 38,000 people or two percent to its population but accounted for only two percent of total metropolitan area population growth. Thus, during the 2000s, suburbs (areas in the urban area outside the urban core) gained 98 percent of the population growth (Figure 3).

    The vast majority of the growth took place either in the outer delegations – some 12 percent of growth –while the inner suburbs of the state of Mexico captured 9 percent of the growth. The "lion’s share" of the growth was in the outer suburbs of the states of Mexico and Hidalgo, at more than 75 percent.

    Clearly, the Valley of Mexico metropolitan area is prime example of the suburbanization and reduced urban densities that have occurred virtually around the world.

    Valley del Mexico Population: 2000 to 2010
    Geographical Sector 2000 2010 Increase Rate Share
    Urban Core (Former Mexico City) 1.692 1.730 0.038 2% 2%
    Balance of Distrito Federal 6.913 7.143 0.230 3% 13%
    Distrito Federal 8.605 8.873 0.268 3% 15%
    Inner Muncipalities 6.061 6.232 0.171 3% 10%
    Outer Municipalities 3.730 5.032 1.302 35% 75%
    Hidalgo Expansion 0.993 1.240 0.248 25% 14%
    Total 19.390 21.378 1.740 9% 100%
    In millions

    ——

    Note: New York: according to US Census Bureau estimates from 2009, the New York metropolitan area had slightly less than 20 million people. However the Combined Statistical area (which includes the Connecticut suburbs) had a population of 22 million people. Because metropolitan areas are labor market areas, the extent of their transport systems is an important factor in delineation. In the case of New York, the extent of the highway and transit systems is sufficient to suggest the combined statistical area as more appropriate for international comparisons.

    Note: Metropolitan Area Ranking: There is only one known research effort to consistently define and rank the world’s metropolitan areas. Richard L. Forstall (who ran the Rand McNally "Ranally" international metropolitan area program), Richard P. Green and James B. Pick, produced that list, which was limited to the top 15 in the world. This small number, in relation to more than 750 metropolitan areas in the world with more than 500,000 people illustrates both the difficulty of obtaining sufficient data and the complexity of the research.

    Note: Pachuca de Sota: the entire urban area is within the Valley of Mexico metropolitan area.

    Photo:  Cathedral, Mexico City (by author)

    Wendell Cox is a Visiting Professor, Conservatoire National des Arts et Metiers, Paris and the author of “War on the Dream: How Anti-Sprawl Policy Threatens the Quality of Life

  • The State of Silicon Valley

    Every year, the top officials, policy wonks, and business managers convene at the annual State of the Valley conference to discuss and debate the health of the region. Over a thousand attendees trekked to San Jose, Calif., on Feb. 18 for the release of this year’s report. Published since 1995 by Joint Venture Silicon Valley Network and distributed for free, the new 2011 Index of Silicon Valley reported bleak indicators and a gloomy outlook.

    The event provided Valley insiders a moment to reflect on the economic storm, and the mood was darkly optimistic. A persistent phrase tossed out was the “new normal,” old Wall Street jargon describing a repressed economic environment. Growth is too slow to bring down the unemployment rate, and government intervenes to save a struggling private sector.

    Tally of the Valley

    Certainly Silicon Valley has had its share of troubles suffering from poor state finances and severe global competition. Unemployment has hit nearly 10 percent, higher than when the recession started. The region’s population of three million, comprised of Santa Clara and San Mateo Counties, has continued to drop as talent leaves for opportunity in cheaper pastures. Foreign immigration, considered a critical factor in the region’s entrepreneurship, dropped by 40 percent to its lowest level in the last decade since 2009 and stayed flat through 2010.

    Adding to the woe, Silicon Valley towns are facing budget shortfalls and downsizing their public services. San Jose faces a 10th straight year of red ink, adding up to a gap of $110 million in the next fiscal year. Caltrain plans to close up to 16 stations to survive a record $30.3 million deficit – about one-third of the commuter rail’s operating budget.

    Education has also taken a big hit. The California college system is wheezing from tremendous budget cuts, calculated at $1.4 billion across the state, which hit all three levels of tertiary education. Foothill-De Anza Community College, one of the largest community college districts in the U.S., confronts roughly $10.9 million in cuts on top of drastic budget slashes from previous years.

    Further, the local housing market remains stagnant, and 2010 marked, due in part to a tough regulatory environment, the third consecutive year that Silicon Valley was the least affordable California region for first-time home buyers.

    In the Eye of the Beholder

    It’s a dismal state of affairs if you ask the local old guard. Judy Estrin, former chief technology officer of Cisco Systems, grumbled that one problem was outsourcing. Too many startups were adopting the practice in her view, and she told the audience, “Don’t automatically go to China.”

    Others were concerned that jobs were being shipped simply to towns east across the bay. Much ballyhooed and well-subsidized sectors, such as cleantech, would not produce enough jobs to be economically meaningful in the recovery. Attendees were fearful that the Valley has lost its edge.

    If those who know Silicon Valley best are somewhat pessimistic, the Valley looks golden for many looking from the outside. The day before the conference, President Obama sought money and advice from the Valley’s tech elite, including Steve Jobs of Apple and Mark Zuckerberg of Facebook. Obama’s agenda was to push innovation, and aside from escaping the U.S. capital now and then, it is tellingly that he turned first to Silicon Valley.

    The Valley has also inspired other city governments. New York City – which once boasted its own “Silicon Alley” was winning over the Valley’s decidedly suburban model – recently asked Stanford University to help train its urban talent. As one local reporter put it gleefully, New York is “hoping to replicate our Apple in The Big Apple”.

    Although financial analysts once considered Apple washed up as a stock less than 10 years ago, the technology company is now lauded for transforming the mobile and entertainment industry and turning Silicon Valley into a mobile mecca. Goaded by Apple, mobile manufacturing giant Sony Ericsson is shifting all its product development from Sweden to Silicon Valley. Nokia, the world’s largest mobile phone maker, is also reportedly considering plans to relocate its executives to the Valley.

    Growing Regional Value, Not Growth

    The prevailing question remains: how will Silicon Valley sustain its lead in innovation. For some the response is to either raise taxes or cut public services as a matter of survival. At the State of the Valley conference, the overriding call to action was to unite 110 local governments through centralized regional leadership. However, the notion of a regional governing body had been introduced before in the 1990s and failed instantly in California state legislation.

    So what might the future hold? Last year’s report card aside, financial analysts are cheery about the Valley’s prospects. Silicon Valley Bank’s Financial Group reports that technology spending is expected to grow by more than five percent in 2011. The majority of their clients finished 2010 in better financial shape than the prior year, and median revenues for all early and growth stage technology clients grew 50 percent from the year before.

    The IPO market has woken from its slumber. Seven tech IPOs have already occurred this year, raising $700 million in total, with an average return of 26.5%, according to research firm Renaissance Capital. Even the international press is writing about the next boom being led by Silicon Valley.

    For all the money being generated, Silicon Valley is not producing more jobs in the local economy. Many startups look to Facebook as a leader in the social media space. Its user base of 600 million has generated a massive population that dwarfs that of the U.S. Yet the company has only about 2000 employees. Facebook presents a conundrum. Is it an innovative global leader that has mastered the art of efficient scaling that is the beginning of a new era in Silicon Valley, or has Facebook become the antithesis of economic growth for the U.S. administration?

    Similar to Facebook, Apple is also spurning growth – at least as defined by the conventional measure of new jobs. The company has redefined the tech industry by creating new technologies and new solutions, but not necessarily creating new growth for the region directly. While Apple employs just 30,000 people, the subcontractor that actually assembles its products employs over a million workers, all in China. Developers for Apple’s software applications and hardware accessories are scattered around the world. Instead, Apple has fostered an ecosystem whose heart resides in Silicon Valley.

    Silicon Valley is changing perceptions and practices once again. Like the proverbial cat with nine lives, Silicon Valley has at least several more transformations ahead.

    Tamara Carleton, Ph.D., is a Fellow at the Foundation for Enterprise Development. Her research studies the organizational processes and structures that enable radical technological innovation.

  • What The Census Tells Us About America’s Future

    With the release of results for over 20 states, the 2010 Census has provided some strong indicators as to the real evolution of the country’s demography. In short, they reveal that Americans are continuing to disperse, becoming more ethnically diverse and leaning toward to what might be called “opportunity” regions.

    Below is a summary of the most significant findings to date, followed by an assessment of what this all might mean for the coming decade.

    Point One: America is becoming more suburban.

    For much of the past decade, there has been a constant media drumbeat about the “return to the cities.” Urban real estate interests, environmentalists and planners have widely promoted this idea, and it has been central to the ideology of the Obama administration, the most big-city dominated in at least a half century. “We’ve reached the limits of suburban development,” Housing Secretary Shaun Donovan opined last February, “People are beginning to vote with their feet and come back to the central cities.”

    Donavan and others cite such things as the energy price spike in the mid-aughts as well as the mortgage crisis as contributing to the “back to the city” trend. Yet in reality the actual numbers suggest that Donavan and his cronies may need a serious reality check. The Census reveals that, contrary to the “back to the city” rhetoric, suburban growth continues to dominate in most regions of the country, constituting between 80% and 100% of all growth in all but three of the 16 metropolitan areas reporting.

    This includes sprawling regions like Houston, “smart growth areas like Seattle and Portland  (where suburbs accounted for more than 80% of all growth over the decade) and Midwestern regions like St. Louis, which like Chicago saw a sharp decline in the urban population. The only exceptions have been Oklahoma City, Austin or San Antonio, with vast expanses still allowing for much of new development to take place within the city limits.

    To be sure, no one should pretend that urban fortunes have sunk to their 1970s nadir. Yet overall, central cities, which accounted for a 11% of metropolitan growth in the 1990s, constituted barely 4% of the growth in the last decade.  Some core cities, notably Chicago, have shrunk after making gains in the ’90s. Indeed Chicago — the president’s adopted hometown and the poster child of the urban “comeback” — took what analyst Aaron Renn humorously dubbed “a Census shellacking,” losing some 200,000 people, while the outer suburban ring continued to grow and diversify their populations. The Windy City’s population is now down to the lowest level since the 1910 Census.

    Point Two: America is becoming more diverse, and the diversity is spreading.

    The racial reordering of America is proceeding apace. Nowhere is this more clear than in Texas, where Hispanic and Asian populations have driven much of the state’s demographic growth. Latinos alone now account for roughly 38% of all Texans. Immigration rates in Dallas and Houston  are now higher than for Chicago, Washington, Seattle and Atlanta. Texas, notes long-time observer Candace Evans, is becoming the country’s premier laboratory for promoting a successful diversity.

    There are other major shifts in ethnic demographics. For one thing, minorities continue to head to the suburban rings around most major cities. African-Americans and even Latinos may be fleeing places like Chicago, but they continue to move in large numbers to suburban locales in surrounding Illinois counties. , especially south of the city.  Others appear to  have headed to places like the traditional black-opportunity magnet of Atlanta and or other southern hubs, such as Nashville.

    Another trend appears to be the migration of ethnic minorities to areas that, in the past, have been primarily white. This is clear in the thriving Indianapolis area, where the African-American population grew by 28% and the Hispanic population by 161%, or some 56,000 souls.   Look for more minority growth in such areas which have the advantage of affordable housing, robust economies and better than average job growth.

    3. The Shift to “Opportunity Regions”

    As the economy slid in the last years of the decade, population growth slowed, particularly in some Sun Belt states, such as Florida and Nevada, that thrived during the bubble. In contrast newcomers flocked to places, notably in the Texas cities, that offered better prospects. Austin, San Antonio, Houston and Dallas-Ft. Worth regions all grew by 20% or more over the decade.

    The key here seems to be affordability and jobs. As economist Mark Sharpe has illustrated, Texas private sector job growth last year was 2.7%, compared with 1% nationally. Unfortunately, unemployment remains over 8%, since of this growth was absorbed by newcomers. In contrast, places with the slowest, or negative growth, tend also to be losing jobs. For example, although the residential population of Chicago’s loop tripled in the past decade to 20,000,the famed business district lost almost 65,000 jobs.

    But it’s not just Sun Belt cities that are gaining on places like Chicago.  Indianapolis has emerged as a different kind of “opportunity region.” It lacks the dynamism and diversity of the Texas cities, but it has continued to attract people from all over the country, including the surrounding rural or old Rust Belt parts of the state. Overall the Indianapolis region grew nearly 15% over the decade, roughly 50% higher than the national average, as much as Portland and more than Seattle.

    In contrast, growth seems to be slowing in some formerly hot areas. Population increases for Seattle, Portland and Denver were around 14%,  about half the rate of the previous decade. Part of this may have to do with high unemployment, particularly in Oregon, and high housing prices. Still, these three areas continue to grow much faster than regions such as Chicago, St. Louis or Baltimore where growth struggled in the single digits

    Possible Long-term Implications

    These shifts suggest that the Obama administration might want to rethink its high-density and urban-oriented strategy. Despite all the media focus on an imagined “back to the city” movement, Americans continue to disperse to “opportunity regions” and toward the suburbs. As a result, expect generally conservative-leaning suburbs and exurbs to gain more power after reapportionment and core city influence to decline further.

    Yet the Census numbers also have some unsettling aspects for Republicans. The increasing minority population even in heartland states such as Indiana, not to mention Texas, could undermine GOP gains, particularly if the party listens to its strong nativist wing. Diversification in the suburbs could ultimately turn some of these areas to the center or even left.

    The new American generation arising in the census will be increasingly diverse. A growing portion will consist of the children of immigrants, and they will be predominately English-speaking.  This suggests a more active and engaged minority population, perhaps susceptible to a pro-growth GOP message and the economy of “opportunity regions” but likely hostile to overtly anti-immigrants posturing.

    Whatever your politics or economic interests, the Census suggests that the country is changing in dramatic way– if not always in the ways often predicted by pundits, planners or the media. It usually makes more sense  to study  the actual numbers, than follow the wishful thinking of largely urban-centric, big-city-based and often quite biased analysts.

    This piece originally appeared at Forbes.com

    Joel Kotkin is executive editor of NewGeography.com and is a distinguished presidential fellow in urban futures at Chapman University, and an adjunct fellow of the Legatum Institute in London. He is author of The City: A Global History. His newest book is The Next Hundred Million: America in 2050, released in February, 2010.

    Indianapolis Photo by IndySawmill

  • The Still Elusive “Return to the City”

    Metropolitan area results are beginning to trickle in from the 2010 census. They reveal that, at least for the major metropolitan areas so far, there is little evidence to support the often repeated claim by think tanks and the media that people are moving from suburbs to the historical core municipalities. This was effectively brought to light in a detailed analysis of Chicago metropolitan area results by New Geography’s Aaron Renn. This article analyzes data available for the eight metropolitan areas with more than 1 million population for which data had been released by February 20.

    Summary: Summarized, the results are as follows. A detailed analysis of the individual metropolitan areas follows (Table 1).

    • In each of the eight metropolitan areas, the preponderance of growth between 2000 and 2010 was in the suburbs, as has been the case for decades. This has occurred even though two events – the energy price spike in mid-decade and the mortgage meltdown – were widely held to have changed this trajectory. On average, 4 percent of the growth was in the historical core municipalities, and 96 percent of the growth was in the suburbs (Figure 1).
    • In each of the eight metropolitan areas, the suburbs grew at a rate substantially greater than that of the core municipality. The core municipalities had an average growth from 2000 to 2010 of 3.2 percent. Suburban growth was 21.7 percent, nearly 7 times as great.  Overall, the number of people added to the suburbs was 14 times that added to the core municipalities.
    Table 1:
    Metropolitan Area Population: 2000-2010
    2000 Population
    Historical Core Municipality Suburbs Metropolitan Area
    Austin              656,562            593,201         1,249,763
    Baltimore              651,154         1,901,840         2,552,994
    Chicago           2,895,671         6,053,068         8,948,739
    Dallas-Fort Worth           1,188,580         3,972,964         5,161,544
    Houston           1,953,631         2,761,776         4,715,407
    Indianapolis              860,454            664,650         1,525,104
    San Antonio           1,144,646            567,057         1,711,703
    Washington              572,059         4,181,934         4,753,993
    Total           9,922,757       20,696,490       30,619,247
    2010 Population
    Austin              790,390            925,899         1,716,289
    Baltimore              620,961         2,089,528         2,710,489
    Chicago           2,695,598         6,599,081         9,294,679
    Dallas-Fort Worth           1,197,816         5,173,957         6,371,773
    Houston           2,099,451         3,846,449         5,945,900
    Indianapolis              903,393            852,848         1,756,241
    San Antonio           1,327,407            815,101         2,142,508
    Washington              601,723         4,883,034         5,484,757
    Total         10,236,739       25,185,897       35,422,636
    Change: 2000-2010
    Austin              133,828            332,698           466,526
    Baltimore              (30,193)            187,688           157,495
    Chicago             (200,073)            546,013           345,940
    Dallas-Fort Worth                 9,236         1,200,993         1,210,229
    Houston              145,820         1,084,673         1,230,493
    Indianapolis               42,939            188,198           231,137
    San Antonio              182,761            248,044           430,805
    Washington               29,664            701,100           730,764
    Total              313,982         4,489,407         4,803,389
    Percentage Change: 2000-2010
    Austin 20.4% 56.1% 37.3%
    Baltimore -4.6% 9.9% 6.2%
    Chicago -6.9% 9.0% 3.9%
    Dallas-Fort Worth 0.8% 30.2% 23.4%
    Houston 7.5% 39.3% 26.1%
    Indianapolis 5.0% 28.3% 15.2%
    San Antonio 16.0% 43.7% 25.2%
    Washington 5.2% 16.8% 15.4%
    Total 3.2% 21.7% 15.7%
    Chicago excludes Kenosha County, WI
    Washington excludes Jefferson County, WV
    Indianapolis core municipality: Indianapolis & Marion County

    Analysis of Individual Metropolitan Areas: The major metropolitan areas for which data is available are described below in order of their population size (Figure 2 and Table 1).

    Chicago:The core municipality of Chicago lost 200,000 residents between 2000 and 2010. Suburban growth was 546,000, adding up to total metropolitan area growth of 346,000 people. The suburbs accounted for 158 percent of the metropolitan area growth. The core municipality decline was stunning in the face of the much ballyhooed urban renaissance in that great city. Yet this renaissance was limited enough as to not lead to an expanding population.

    The decline in the core municipality population represents a major departure from the 2009 Bureau of the Census estimates, which would have implied a 2010 population at least 170,000 higher (assumes the growth rate of 2008 two 2009).

    Instead all of the growth was in the outer suburbs, beyond the inner suburbs of Cook County.

    Dallas-Fort Worth: The historical core municipality of Dallas had a modest population increase of 9000, or less than 1 percent between 2000 and 2010. In contrast, the suburbs experienced an increase of 1.2 million, or 30 percent. Thus, approximately 1 percent of the metropolitan area growth was in the core municipality, while 99 percent was in the suburbs, most of it in the outer suburbs. The inner suburbs added 14 percent to their 2000 population, while the outer suburbs added 36 percent.

    The population figure for the core municipality of Dallas – consistently among the strong core areas –  was surprisingly low, at 9 percent below (117,000) the expected level. The suburban population was 1 percent (71,000) below expectations.

    Houston: The historical core municipality of Houston had comparatively strong population growth, adding 146,000 and 8 percent to its 2000 population. However this figure was 8 percent, or 174,000 below the expected figure. By contrast, the suburban growth was 39 percent, more than five times that of the central jurisdiction. The suburban population growth was 1,085,000, more than six times that of the core jurisdiction. The suburban population was 4 percent or 144,000 higher than expected.

    The core jurisdiction of Houston accounted for 12 percent of the metropolitan area growth while the suburbs s accounted for 88 percent. This was evenly distributed between the inner suburbs of Harris County and the outer suburbs. The inner suburbs added 38 percent to their population while the outer suburbs added 41 percent.

    Washington:Reversing a decade’s long trend, the historical core jurisdiction of Washington (DC) had a small population gain between 2000 and 2010. But the Washington, DC gain of 30,000 pales by comparison to the suburban gain, which was more than 20 times greater, at 700,000. The core jurisdiction accounted for 4 percent of the population gain, while the suburbs accounted for 96 percent.

    More than 60 percent of the growth in the metropolitan area was outside the inner suburban jurisdictions that border Washington, DC (Arlington County and Alexandria in Virginia, together with Montgomery County and Prince George’s County in Maryland), while the inner suburbs accounted for 36 percent of the growth. The population increase in the inner suburbs was 9 percent, compared to 37 percent in the outer suburbs.

    Jefferson County in West Virginia was not included in the analysis because data is not yet available.

    Baltimore: The historical core municipality of Baltimore, the site of another ballyhooed urban comeback, lost 30,000 people, or 5 percent of its 2000 population. Baltimore’s 2010 population was 4 percent or 16,000 below the expected level. The suburbs experienced a 10 percent or 188,000 person increase.  The region’s population increase was roughly equal in numbers between the inner suburbs and the outer suburbs, although the exurban percentage increase was nearly twice as large.

    San Antonio:The historical core municipality of San Antonio experienced the largest population increase among the eight metropolitan areas, at 183,000, a roughly 16 percent population jump. The city of San Antonio accounted 43 percent of the growth while suburbs in Bexar County and further out accounted for a larger 57 percent. However, the suburban population increase was 248,000 or 44 percent. This is something of a turnaround in trends that favored the city of San Antonio in the past because of its vast sprawl and predominant share of the metropolitan population.

    The city of San Antonio population was 5 percent or 65,000 people short of the expected 2010 level. The suburban population was 15 percent more or 104,000 more than the expected level.

    Indianapolis:The historical core area of Indianapolis and Marion County (including enclaves within Indianapolis) grew 5 percent and accounted for 19 percent of the metropolitan area growth. In contrast, the surrounding suburbs grew 28 percent, representing r 81 percent of the metropolitan area growth. Overall, the core municipality added 44,000 people, while the suburbs added more than four times as many, at 188,000.

    Austin:The historical core municipality of Austin experienced the greatest growth of any core jurisdiction in the eight metropolitan areas, at 20 percent. Even so, growth in the suburban areas was nearly 3 times as high at 56 percent. The city of Austin accounted for 29 percent of the metropolitan area population growth, while the suburbs accounted for 71 percent. Overall, the central municipality grew 134,000, while the suburbs grew 2.5 times as much, at 333,000.

    Generally it is fair to say that, so far, suburban areas are growing far faster than urban cores. In addition, most of the fastest growing core municipalities are those areas that are themselves largely suburban, particularly in relatively young cities like San Antonio, Houston and Austin.
     
    Among the eight metropolitan areas analyzed, the older core jurisdictions (with median house construction dates preceding 1960) tended to either lose population or grow modestly. This is illustrated by the city of Chicago, with a median house construction date of 1945, Baltimore with a median house construction date of 1946 and Washington with a median house construction date of 1949 (Table 2). Generally, the central jurisdictions with greater suburbanization (with median house construction dates of 1960 or later) grew more quickly. For example, highly suburban central jurisdictions like Austin with a median house construction date of 1983 and San Antonio, with a median house construction date of 1970, grew fastest. So much for the long forecast, and apparently still elusive, “return to the city”.

    Table 2:
    Historical Core Municipalities: Growth & Median House Age
    Historical Core Municipality
    Growth: 2000-2010 Share of Metropolitan Growth Median House Construction Year
    Austin 20.4% 28.7% 1983
    Baltimore -4.6% -19.2% 1946
    Chicago -6.9% -57.8% 1945
    Dallas-Fort Worth 0.8% 0.8% 1974
    Houston 7.5% 11.9% 1975
    Indianapolis 5.0% 18.6% 1967
    San Antonio 16.0% 42.4% 1979
    Washington 5.2% 4.1% 1949
    Average 3.2% 3.7%

    Wendell Cox is a Visiting Professor, Conservatoire National des Arts et Metiers, Paris and the author of “War on the Dream: How Anti-Sprawl Policy Threatens the Quality of Life

  • The Evolving Urban Form: Seoul

    Based upon the preliminary results of the South Korea 2010 census, Seoul has become the world’s third largest metropolitan area. The jurisdictions making out the metropolitan area, the provincial level municipality of Seoul (which is the national capital), the province of Gyeonggi and the provincial level municipality of Incheon now have a population of approximately 23.6 million people. This is third only to Tokyo – Yokohama, which has a population of approximately 40 million and Jabotabek (Jakarta), which is approaching 30 million. While international metropolitan area population estimates should be taken with a "grain of salt," (Note 1: Metropolitan Areas) the rise of Seoul is nearly unprecedented in the high-income world. Further, many more people are projected to move to the Seoul metropolitan area as the trend of rural and smaller area migration to larger urban areas continues.

    A Difficult History: However, any analysis of Seoul and its progress must begin in the context of the overall economic progress of South Korea and its difficult history.

    Seoul was a major battleground in the Korean War of 1950 to 1953. During 1950 alone, military control of the municipality of Seoul changed hands four times. Today, despite the precariousness of the political situation on the Korean Peninsula, the northern suburbs of Seoul are as close as four miles (seven kilometers) from the demilitarized zone, which forms the border with North Korea. 

    Strong Economic Growth: A very poor country even before the war, South Korea has been an economic success story. Based upon data produced for the Organization for Economic Cooperation and Development by the late economist Angus Maddison, South Korea had a gross domestic product per capita (purchasing power parity) of less than $1300 (2010$) in 1950. It had peaked, as a Japanese colony, somewhat above that level before World War II, but never approached one quarter of the GDP per capita of the United States and averaged less than one third of then high income Argentina.

    After the Korean War, initial economic progress was slow. As late as 1965, South Korea’s GDP per capita was less than that of Mozambique. Since that time, South Korea’s GDP per capita has risen from approximately $2000 to $30,200 in 2010 It exceeded Argentina in the 1980s.  

    South Korea today has a higher GDP per capita than Spain and New Zealand and less than 10 percent behind the European Union, on which it is gaining quickly. As the capital, the Seoul is a prosperous metropolitan area in a prosperous country.

    South Korea’s prosperity is also considerable contrast to that of North Korea’s. South Korea’s GDP per capita is more than 15 times that of North Korea (Figure 1). This would make any future reunification far more expensive for South Korea then Germany’s unification was for West Germany, because the economic disparity, though substantial, was much less.

    The Urban Area: Growing and Dense: The Seoul urban area (area of continuous development) includes the municipality of Seoul and also includes the urbanization of Incheon, to the west and substantial suburban development in the province of Gyeonggi on the other three sides (Note 2: Urban Areas). Based upon an analysis of data from the 2010 census, we have estimated the Seoul urban area population at 22.5 million. The next edition of Demographia World Urban Areas: Population & Projections (current edition) will show Seoul to be the world’s third largest urban area, trailing only Tokyo-Yokohama and Delhi (which recently passed Mumbai to become India’s largest urban area). Jakarta, the second largest metropolitan area, ranks as the fourth largest urban area, though will soon pass Seoul, because of much stronger growth. Among high income world urban areas, Seoul’s population growth has been greater than that of any other since 1950 except for Tokyo-Yokohama. Seoul added more than 20 million people, while Tokyo-Yokohama added more than 25 million people. By comparison, New York added less than 10 million people and Paris added 4 million people.

    Seoul’s population density is among the highest of the world’s affluent urban areas. With population density of 27,000 people per square mile (10,400 per square kilometer), Seoul ranks second in the high income world among urban areas of more than 5 million people, trailing only Hong Kong, which is more than twice as dense. Thus, Seoul is more than twice as dense as Tokyo-Yokohama, three times as dense as Paris and four times as dense as Los Angeles or Toronto, the densest urban regions in North America.

    With the exception of Hong Kong, no first world urban area has the density of high rise condominium developments as are found in Seoul. While virtually all of the recent urban expansion in both population and geography has been in the suburbs, nearly all of the new residences are in high rise buildings.

    Seoul is also the home to massive city real estate developments. For example, Ilsan, in Gyeonggi is a very large planned high-rise community to the north of the Han River (which bisects the urban area), west of Seoul and north of Icheon. Most of Ilsan was developed by the early 2000s. The high rise development of Songdo, four miles (seven kilometers) south of the core of Incheon is intended to be home to 75,000 people and 50 million square feet of office space.

    Seoul’s Han River is crossed by multiple bridges, including architectural icons. A new international airport (Seoul-Incheon) was opened in 2005, 43 miles (70 kilometers) away from the Seoul central business district. This airport, on an island west of Incheon is most remote international Airport among the world’s megacities (urban areas over 10 million population), 8 miles further even than Narita International Airport from central Tokyo. Domestic flights continue to operate out of Gimpo Airport, which is halfway between the cores of Seoul and Incheon.

    Distribution of Population Growth: The municipality of Seoul – the capital district – is one of the largest municipalities in the world, with nearly 10 million people (Note 3: Municipalities). However, like many core municipalities that have not expanded their boundaries, Seoul is losing population. The 2000 census shows the population to have declined 900,000, or nearly 10 percent, from 1990. The population loss during the 2000s was a somewhat more modest 200,000.

    Since 1990, all the population growth in the Seoul metropolitan area since has been in the suburbs. The province of Gyeonggi has gained more than 5 million residents, while the municipality of Incheon has added more than 800,000 residents.  During the 2000s, the province of Gyeonggi added enough population to exceed the municipality of Seoul as the largest provincial level jurisdiction in the metropolitan area (Table).

    Seoul Metropolitan Area Population: 1960-2010
    Year Metropolitan Area Provincial Level Jurisdiction
    Seoul Gyeonggi Incheon
    1960 5.1 2.4 2.7  
    1970 8.6 5.3 3.3  
    1980 14.9 8.3 6.6  
    1990 18.6 10.6 6.2 1.8
    2000 21.4 9.9 9.0 2.5
    2010 23.6 9.7 11.3 2.6
    In Millions
    Incheon created from Gyeonggi in 1981


    The Future? There is also some question about whether Seoul will remain the national capital. In 2004, the national government decided to move the capital to Gongju, 90 miles (150 kilometers) south of Seoul. The decision was both preceded and followed by considerable political jockeying and it appears that the government is backtracking on the capital move (though construction has begun).

    Regardless of the eventual fate of the new capital, Statistics Korea projections indicated that the Seoul metropolitan area will continue to expand. The population of the municipality of Seoul is expected to decline through 2030 while the suburban jurisdictions of Incheon and Gyeonggi are expected to continue their growth. Further, more rapid growth is anticipated in North Chungcheon and South Chungcheon provinces as the metropolitan area, and perhaps even the urban area spreads further to the south. This larger metropolitan area is projected to grow to more than 31 million people by 2030.

    —-

    Note 1: Metropolitan Areas: Metropolitan areas are the economic dimension of the urban form. They represent the labor markets (area from which people commute to the urban area) and thus include both the urban area and surrounding economically attached rural and exurban areas. There are no international standards for delineating metropolitan areas and most national statistical agencies have no such delineation. The nations that do giving me metropolitan areas have differing standards and even within nations there are substantial difficulties. The only serious attempt to define metropolitan areas based upon consistent standards was by urban expert Richard L. Forstall (who ran the Rand McNally "Ranally" international metropolitan area program), Richard P. Green and James B. Pick. The complexity of the research is indicated by the fact that their list is limited to the top 15 in the world. Other attempts to delineate metropolitan areas generally rely on complete second or third level jurisdictional boundaries, such as counties, states or provinces. This can lead to specious comparisons of densities, because the jurisdictions that are used vary so much in size. This is perhaps best illustrated by comparing Portland and Riverside – San Bernardino. In 2000 (latest available data), the Riverside – San Bernardino urban area had a densities slightly higher than that of Portland. Yet the metropolitan areas vary greatly in size, due simply to the size of the counties that comprise them. The two counties of the Riverside – San Bernardino metropolitan area cover four times as much land area as the seven county Portland metropolitan area.

    Note 2: Urban Areas: urban areas are the structural dimension of the urban form (the "urban footprint"). Urban areas are the area of continuous urban development. They may also be called urbanized areas (such as United States, United Kingdom, France, India and Canada); urban centers (Australia) or urban agglomerations (United Nations). Canada will switch its terminology for urban areas to "population centres" in the 2011 census. The distinction between urban areas and metropolitan areas can be confusing and has led some internet – based lists to somewhat indiscriminately mix the two. Moreover, the term "urban area" has even been used to denote an area well beyond the continuous urbanization (more akin to a metropolitan area), such as in its definition by statistics New Zealand.

    Note 3: Municipalities: international comparisons of municipalities (often called "cities," which is a term that can also be used for two substantially different concepts, metropolitan areas and urban areas) are generally invalid, because there is no geographic or population criteria between or even within nations by which municipalities are defined. This is illustrated by the fact that the world’s largest municipality, Chongqing is largely rural, not urban, and covers an area approximately the size of Austria or Indiana. While the municipality of Chongqing (and virtually all other Chinese "cities") is larger than its metropolitan area, municipalities may be far smaller than their metropolitan areas. For example, the municipality of Melbourne ("city of Melbourne") has less than 2 percent of the metropolitan area population, while the municipality of Atlanta has less than 10 percent of the metropolitan area.

    Note 4: The United Nations population estimates show the Seoul urban area to be limited to the municipality of Seoul which produces a far smaller estimate of less than 10 million people.

    —–

    Photo: Suburban Seoul (by author)

    Wendell Cox is a Visiting Professor, Conservatoire National des Arts et Metiers, Paris and the author of “War on the Dream: How Anti-Sprawl Policy Threatens the Quality of Life

  • Chicago Takes a Census Shellacking

    The Census results are out for Illinois, and it’s bad news for the city of Chicago, whose population plunged by over 200,000 people to 2,695,598, its lowest population since before 1920.  This fell far short of what would have been predicted given the 2009 estimate of 2,851,268. It’s a huge negative surprise of over 150,000, though perhaps one that should have been anticipated given the unexpectedly weak numbers for the state as a whole that were released in December.

    The American Community Survey data from last year show a clear improvement in items like college degree attainment (up 7.6 percentage points since the 2000 Census) and median household income (up 18%, which trailed the nation slightly, but beat Cook County and the state).  These data points show the very real improvements that have swept over a portion of the city, the visible gentrification that envelops the greater core area has now been shown to have been unable to power overall population growth, or to restrain the rampant exurbanization in the region.

    White and Black Flight

    The non-Hispanic White Only population of the city actually declined by 52,449, or 5.78%.  The “minority” population declined even further, -147,969 or 7.44%, meaning the city actually grew its white population share by 0.38 percentage points, perhaps indicating the early stages of the “Europeanization” of Chicago as the core gentrifies and disadvantaged groups and the white working class are pushed further to the fringe.

    Indeed, the Black Only population plunged by 177,401 as blacks increasingly moved to suburbs, especially southern ones  like Matteson, Lansing, Calumet City, Park Forest, and Richton Park, each of which added thousands of new black residents.  Some indications are that a significant number of black residents left the region altogether.  The traditional black magnet of Atlanta – which struggled through much of the decade – was a top five destination for people leaving Chicagoland over the past decade, and Chicago was the #2 source of in-migrants to Memphis, another black hub, according to IRS data.

    Hispanic population was the bright spot for Chicago, as the city added Hispanic residents to the tune of 25,218, or 3.35%.  Hispanics boosted their population share in the city by nearly 3 percentage points.  But even this growth isn’t that impressive.  The city of Indianapolis, at less than a third Chicago’s population, added over 45,000 Hispanics on a much smaller base.

    Demographic Reality: Massive Exurbanization

    Much has been made of Chicago’s legitimate and real urban core renaissance, but the cold reality remains that this is one of America’s most sprawling regions. Regional growth continued to be heavily focused not in the city or established inner suburbs, but the exurbs.  Kendall County more than doubled in population, and counties like Grundy, Boone, and Kane also made the top five in the state. Cook County, which is about half made up of the city of Chicago, as a whole actually lost population. And traditional suburban powerhouse DuPage has flattened, while Lake County, Illinois fell just short of the national average in growth. During the last decade, a net of over 25,000 people moved from metro Chicago to metro Rockford, making that city the #2 destination for those leaving Chicagoland. Given that Rockford is hardly an economic mecca, clearly exurbanization is spreading far beyond traditional metro boundaries. Sprawl of the most intense kind is alive and well in Chicagoland.

    The following map illustrates this, with a five bucket sort of 2000-2010 population percentage change, growing counties in black, shrinking in red:


    The raw data on regional growth speaks for itself:

    Core+Suburb vs. Exurb

    2000

    2010

    Total Change

    Pct Change

    Core + Established Suburb (Cook, DuPage, Lake Counties)

    6,925,258

    6,815,061

    -110,197

    -1.6%

    Exurb (Other IL Metro Chicago Counties)

    1,347,510

    1,771,548

    424,038

    31.5%

    This sprawl might be more understandable in rapidly growing cities like Atlanta and Houston that can both densify the core and grow outwards simultaneously.  But the Chicago-Joliet-Naperville-IL Metropolitan Division (the full MSA is not yet available since Wisconsin hasn’t been released yet) grew at less than half the national average. This means that the exurbanization trend in Chicagoland is almost entirely loss of population share by the core to the fringe.

    To put an even starker view on the concentration of growth in Illinois as a whole, this map highlights only those counties that grew faster than the already anemic statewide average:


    Other than a handful of counties, the group of fastest growing counties in the state is dominated by suburban and especially exurban Chicago and St. Louis counties.

    For those of us who’ve chosen to plant our flag in the city, these results are most unwelcome news, no two ways about it. This is especially true as underfunded pensions and city budget gaps loom large, and where the per capita load only goes up as the population goes down.  This report should be a call to arms to the next mayor and the city as a whole to make the promise of revitalization a reality, and bring growth and prosperity to the city as a whole, not just a the upscale core. Cities like Chicago have to become more aspirational; places of upward mobility to broad sections of the middle and working classes. The city and Cook County can’t afford another decade like this one.

    Aaron M. Renn is an independent writer on urban affairs based in the Midwest. His writings appear at The Urbanophile.

    Photo by Gravitywave

  • A More Objective Attitude Toward the Suburbs (Almost)

    It is always encouraging to see greater objectivity in the treatment of the suburbs. In fact, the urban form includes not only the urban core, but also the suburbs and economically connected rural areas and exurban areas that are beyond the urban footprint. This fact has often been missed by some urbanologists who imagine no city extends beyond the view on the foggiest day from a central city office tower.

    William Upski Wimsatt, author of Bomb the Suburbs, has now published an update called Please Don’t Bomb the Suburbs. The title of Wimsatt’s original book, focusing on grafitti and hip-hop culture, has a ring reflective of the irrational and ideological condemnation that has been far too typical of some of the urban planning community.

    Wimsatt cites five myths about suburbs in a Washington Post opinion piece. To be charitable, he gets as many as four of them right. These include his discovery that suburbs are not white middle-class enclaves, that they can be "cool," that they are not necessarily politically conservative, and that suburbanites care about the environment.

    However, Wimsatt still has some distance to go. His last myth suggests that suburbs are not the result of the free market. This general proposition is tenable, for example, given large lot zoning requirements, which have caused many urban areas to consume far more land than they would have if the market had been allowed to operate. The problem with Wimsatt’s free-market analysis is his acceptance of three additional myths.

    Myth 1: Smart Growth Reduced Property Taxes in Portland: Wimsatt cites an analysis indicating that property taxes in Portland dropped between the mid-1980s and the mid-1990s while property taxes in Atlanta increased. He uses this "factoid" to imply that Portland’s more restrictive land use planning regime ("compact development" or "smart growth") is superior to the more liberal Atlanta approach. Wimsatt does not note that during this period the voters of Oregon implemented their own Proposition 13 type property tax reduction (Measure 5), which lowered property taxes even as per capita revenue rose at a greater rate in Oregon than in Georgia. To be fair, Wimsatt cannot be blamed for this oversight, since the Sierra Club source he cited omitted this detail. We refuted a larger analysis by Arthur C. (Chris) Nelson that included this claim 10 years ago, in a paper for the Georgia Public Policy Foundation entitled American Dream Boundaries: Urban Containment and its Consequences.

    Myth 2: Suburban Infrastructure is More Costly: Wimsatt claims that the cost of infrastructure and public services is higher in suburbs than in the urban core. Joshua Utt and I put this myth to rest in research covering all of the reporting municipalities in the US government database, which indicated no such higher costs (The Costs of Sprawl: What the Data Really Show). The claims of higher infrastructure and service costs in the suburbs are largely based on theoretical studies, which invariably suffer from the "length of pipe" fallacy, which fails to take into consideration the substantial differences in the costs of infrastructure construction in already developed areas versus greenfield areas. In fact, labor costs tend to be less in suburban areas. Moreover, much of the cost of suburban development is paid for by home owners, who reimburse developers who have already paid much of the sewer, water and street construction costs. These are not costs to the public or to society, they are costs that buyers voluntarily pay for what they consider to be a better lifestyle. Finally, Core city infrastructure is often obsolete and not able to adequately serve the higher demand that would occur from substantial population increases.

    Myth 3: Consolidating Local Government Saves Money: Wimsatt presumes that consolidation of local governments is a way to reduce public expenditures. He cites the case of towns in New Jersey, which he would prefer to see combined. Despite the fact that ivory tower before-the-fact analysis routinely concludes that larger, consolidated local governments are spend less per capita than smaller governments, the record says exactly the opposite. Our research, using US government, New York, Pennsylvania and Illinois state databases shows a consistent relationship between larger local governments and higher expenditures per capita and higher debt per capita.

    This should not really be so surprising, since larger governments tend to be further from the people and by definition more remote from their control. Where voters are less important, as is the case with larger local governments, special interests fill the vacuum, generally to the detriment of taxpayers.

    With this diluted control by voters, larger governments tend to get into financial difficulty, and a vicious cycle of excessive spending and debt can follow. Often unable to say no to spending interests, they raise taxes. When the electorate loses tolerance for higher taxes, larger governments tend to borrow, which increases expenditures even more. Finally, when they reach high debt levels, it is not unusual for there to be proposals to consolidate these governments with their smaller neighbors, which have been more fiscally prudent. If consolidation is implemented, the new larger local government is granted a new lease on fiscal irresponsibility, and per capita expenditures and debt is likely to rise even higher.

    As if that were not enough, labor contracts and service levels are routinely "harmonized" at the highest cost, since employees will not be forced to take pay or benefit cuts and service levels will generally not be reduced for residents. This was cited by the Toronto Business Alliance after a theoretical $300 million in promised cost savings were transformed into substantially higher spending in the newly consolidated city.

    Welcome: Wimsatt graciously ends his commentary by saying "Everyone with a prejudice against the suburbs will have to get over it. Even me." Welcome, Mr. Wimsatt.