Category: Suburbs

  • Shrinking City, Flourishing Region: St. Louis Region

    Throughout the high income world, in this age of cities, many urban centers continue to shrink. This is particularly true in municipalities that have been unable either to expand their boundaries or to combine with another jurisdiction, subsequently running out of new developable land.

    For example, the city of Paris (as opposed to the metropolitan area or urban area, see Note) lost a quarter of its population between 1954 and 1999, while the loss in some core districts (arrondissements) was 75 percent. Copenhagen, which is often considered one of Europe’s most vibrant municipalities lost more than one-third of its population between 1950 and 2000. Other core municipalities have lost more than one-half million people, such as, London, Seoul, Glasgow, Berlin, Osaka, Chicago, Detroit, Philadelphia and St. Louis.

    City of St. Louis Population Loss: Yet no city which achieved the scale of a half million residents has lost a larger percentage of its population in peacetime than St. Louis. To some extent, this is a very old problem for a city that was once the largest in the Midwest but was passed in 1880 by Chicago.

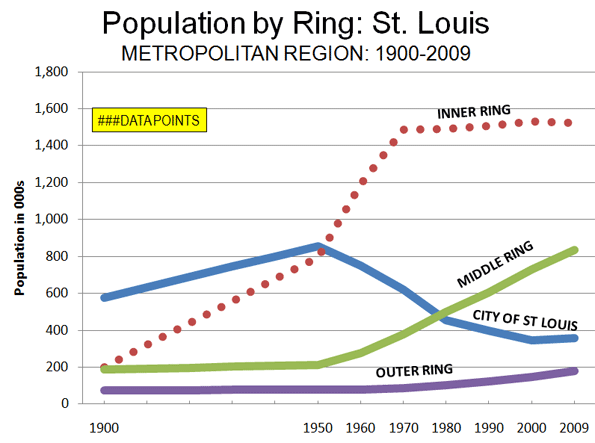
    In 1950 the city population peak at 857,000 people and ranked 8th among the nation’s municipalities. By 2009, the latest estimates, the population was 357,000 (ranked 48th in the nation), a decline of nearly 60 percent from the peak.

    Metropolitan Population Gain: But as is the case for many “shrinking cities,” the region outside the municipal boundaries has continued to grow. In1950, the population of the metropolitan region (as currently defined) was 1,940,000. By 2009, the metropolitan region had grown to 2,890,000, for a population increase of nearly 1,000,000 (more than a 50 percent increase). St. Louis is a bi-state metropolitan area, with three quarters of the population living in Missouri and the balance in Illinois, a ratio than has been largely unchanged since 1900.

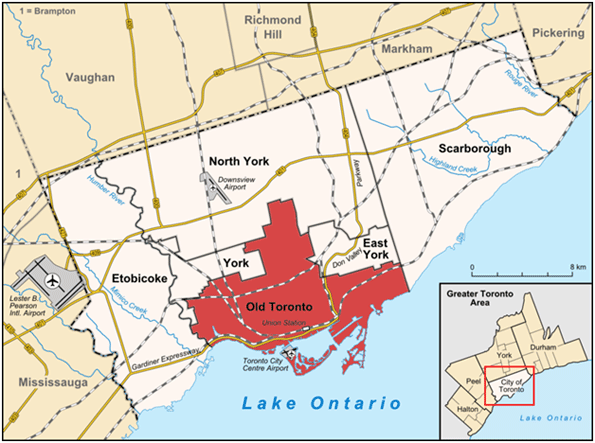
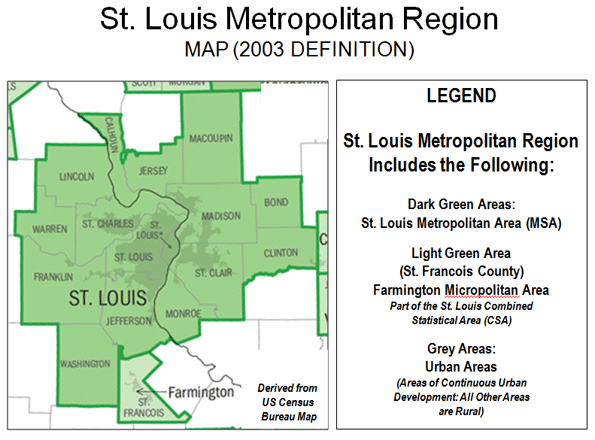
    The metropolitan region (or combined statistical area) includes the city of St. Louis, (a county equivalent jurisdiction), 8 counties in Missouri and 8 counties in Illinois. The St. Louis metropolitan region covers approximately 9,100 square miles (Figure 1), of which the principal urban area (area of continuous urbanization) covered 829 square miles (9 percent of the metropolitan region).

    As in the case of virtually all large high-income world metropolitan areas, population growth has principally occurred on the suburban fringe. For example, from 1965 to 2000, 110 percent of the growth in major metropolitan areas of Western Europe was in the suburbs, more than in the United States (90 percent since 1950).

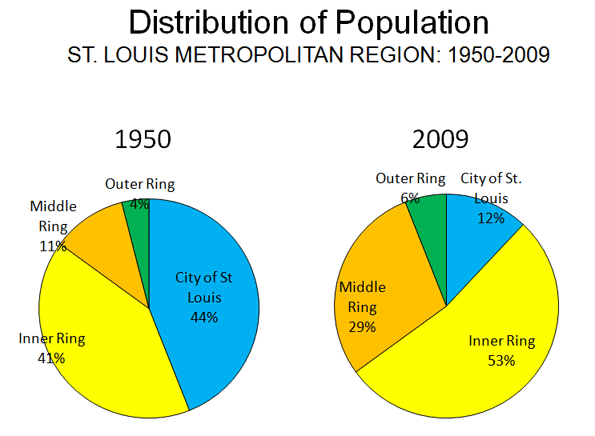
    Distribution of Population: Even by these standards, St. Louis may be an extreme case. In 1950, 44% of the region’s population was in the city of St. Louis. The inner ring the counties of St. Louis, St. Clair (Illinois) and Madison (Illinois), accounted for another 41% of the population. Thus 85% of the metropolitan region’s population lived in the city or the inner ring counties. The other 15% lived in middle ring and outer ring counties.

    By 2009 the population of the city and the inner ring counties had fallen to 65% of the region. The city and county of St. Louis (which were combined until 1876), reached a combined population peak in 1970 and has lost 225,000 people since that time, falling below the 1960 census total.

    The middle ring counties represented 29% of the population while the outer ring counties had 6% of the population (Figure 2) in 2009. During the 2000s, the middle ring counties added more than 130,000 residents, while the city added 10,000.

    Consistent with the trend since the late 1950s, nearly all of the metropolitan region growth occurred outside the city and the inner ring between 2000 and 2009. The city is estimated to have accounted for 7% of the region’s growth. The inner ring counties actually shrank while the middle ring counties accounted for 76% and the outer ring counties 22% of the growth (Table 1 and Figure 3) for the region.

    Table 1
    St. Louis Metropolitan Region: Population Trend
    1900-2009
    Sector
    1900
    1950
    2000
    2009
     METROPOLITAN REGION (CA) 
    1,039,543
    1,942,848
    2,757,377
    2,892,874
     HISTORIC CORE 
    575,238
    856,796
    346,904
    356,587
     City of St. Louis 
    575,238
    856,796
    346,904
    356,587
     INNER RING 
    201,419
    794,651
    1,531,692
    1,524,482
     St. Louis Co. 
    50,040
    406,349
    1,016,364
    992,408
     Madison Co. (IL) 
    64,694
    182,307
    259,120
    268,457
     St. Clair Co. (IL) 
    86,685
    205,995
    256,208
    263,617
     MIDDLE RING 
    187,384
    213,394
    730,563
    833,706
     Franklin Co. (MO) 
    30,581
    36,046
    94,059
    101,263
     Jefferson Co. (MO) 
    25,712
    38,007
    198,740
    219,046
     St. Charles Co. (MO) 
    24,474
    29,834
    286,171
    355,367
     Bond Co. (IL) 
    16,078
    14,157
    17,650
    18,103
     Clinton Co. (IL) 
    19,824
    22,594
    35,536
    36,368
     Jersey Co. (IL) 
    14,612
    15,264
    21,655
    22,549
     Macoupin Co. (IL) 
    42,256
    44,210
    48,989
    47,774
     Monroe Co. (IL) 
    13,847
    13,282
    27,763
    33,236
     OUTER RING 
    75,502
    78,007
    148,218
    178,099
     Lincoln Co. (MO) 
    18,352
    13,478
    39,254
    53,311
     St. Francois Co. (MO) 
    24,051
    35,276
    55,743
    63,884
     Warren Co. (MO) 
    9,919
    7,666
    24,721
    31,485
     Washington Co. (MO) 
    14,263
    14,689
    23,410
    24,400
     Calhoun Co. (IL) 
    8,917
    6,898
    5,090
    5,019
     Metropolitan Region: Combined Statistical Area (2009 Definition) 

    Despite often well-orchestrated impressions to the contrary, the continuing dominance of suburban population growth in the St. Louis metropolitan region mirrors the experience in other major metropolitan areas across the nation.. This growth has not been, as is often supposed, at the expense of the city. Over the past sixty years suburban growth was actually three times the total net loss suffered by the city. Increasingly when people move to St. Louis, they actually mean that they are coming to the suburban periphery.

    Domestic Migration: Overall in the past decade, the St. Louis metropolitan region experienced only a modest domestic migration loss – far less than many other regions . Approximately 1.3 percent of the 2000 population, or 35,000 people moved from St. Louis to other parts of the nation. By comparison, in similar sized and sunny San Diego, the domestic migration loss was 127,000, with a percentage loss more than three times that of St. Louis. Who could have imagined that in a decade, Los Angeles would lose 1.3 million more domestic migrants than St. Louis and New York 2 million more (granted, from much larger bases).

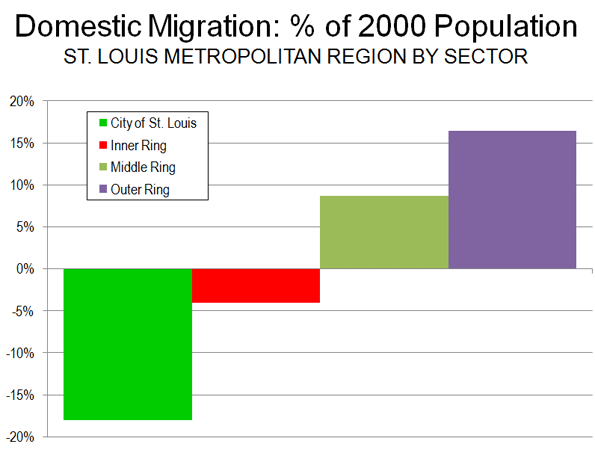
    During the 2000s, the domestic migration trends within the St. Louis metropolitan region reflected the national trend of migration from core areas to the suburbs. According to US Census Bureau estimates, the 2000 to 2009 in domestic migration loss in the St. Louis metropolitan region was distributed as follows (Figure 4):

    • The city of St. Louis has lost a net 63,000 domestic migrants (18.0 percent of its 2000 population)
    • The inner ring counties have lost a net 59,000 domestic migrants(4.0 percent of the 2000 population), 57,000 of which were lost in St. Louis County
    • The middle ring counties gained a net 64,000 domestic migrants with a gain of 45,000 in St. Charles County (8.7 percent of the 2000 population).
    • The outer ring counties gained a net 24,000 domestic migrants (16.4 percent of the 2000 population) with nearly one half of the gain (11,000) in Lincoln County.

    Net international in-migration was the one bright spot for the city and inner suburbs, which gained the bulk of the 30,000 immigrants who came to region over the past decade (Table 2). But this was not nearly enough to balance the losses from domestic migration.

    Ultimately the St. Louis story reflects the deeper reality seen across the high-income (and even in some low and lower income world metropolitan areas, as future installments will indicate), albeit somewhat more exaggerated. Many core cities continue to stagnate or even shrink, but their regions remain vibrant, expressing a form of urbanism that, while often unappreciated, remains vital and expansive.

    ——–

    Note: Metropolitan areas are composed (outside New England) of complete counties or county equivalent jurisdictions. They include substantial rural expanses, which are economically tied to the principal urban area (the largest urban area in the metropolitan area). An urban area is an expanse of continuous urbanization, and contains no rural territory.

    Photo: St. Louis skyline (by author)

    Wendell Cox is a Visiting Professor, Conservatoire National des Arts et Metiers, Paris and the author of “War on the Dream: How Anti-Sprawl Policy Threatens the Quality of Life

  • The Next Urban Challenge — And Opportunity

    In the next two years, America’s large cities will face the greatest existential crisis in a generation. Municipal bonds are in the tank, having just suffered the worst quarterly performance in more than 16 years, a sign of flagging interest in urban debt.

    Things may get worse. The website Business Insider calculates that as many as 16 major cities — including New York, Los Angeles, Chicago and San Francisco — could face bankruptcy in the next year without major revenue increases or drastic budget cuts. JPMorgan Chase’s Jamie Dimon notes that there have already been six municipal bankruptcies and predicts that we “will see more.”

    Big cities face particularly steep challenges. Many, notes the Manhattan Institute’s Steve Malanga, have extraordinarily generous compensation systems for their public employees. New York City, for example, owes nearly $65 billion in municipal debt, as well as a remarkable $122 billion for unfunded pension obligations.  President Barack Obama’s hometown of Chicago has it even worse: Its total public pension liability adds up to roughly $42,000 per household.

    This all should give some pause to the relentless hoopla about the country’s supposed “urban renaissance.” The roots of the current economic crisis lie deep in urban economies, where employment growth that has lagged even in good times.  During the last economic expansion, urban job growth was roughly one-sixth that of suburbs and one-third that of smaller communities.

    Population flows are also less favorable than commonly perceived.  Even since the onset of the Great Recession, the vast majority of urban regions have seen population continue to grow more robustly in the suburbs than in the urban core. Similarly, the largest increases in the much-coveted educated population continue to be in smaller, less dense urban areas such as Raleigh-Durham, Austin and Nashville and away from the largest, densest regions such as New York or Los Angeles.

    True, many cities now boast more residential complexes, often built from abandoned office and industrial space, but there are few new office towers outside the public sector. Stadiums, convention centers, luxury hotels and other ephemera may gain public notoriety, but they have done little to boost the private sector economic base  as can be seen in the lack of growth in places like downtown Cleveland, Detroit and Baltimore. In contrast, job growth has flourished  in low-density regions in suburban rings, particularly in fast-growing metropolitan regions of the South , particularly in Texas and Intermountain West locales such as Salt Lake City.

    Initially, the Great Recession was widely held to have reversed this pattern. As private sector growth retrenched, companies pulled out of newer offices in suburbia, sometimes consolidating in downtown office. The Bush-Obama stimulus also bailed out the two sectors — finance and government — that drive employment in most inner cities. Meanwhile, suburbs, with their collections of small companies that have little political heft and depend more on home construction, suffered greater drops in occupancies.

    This urban tilt was, until recently, reinforced by political trends. After the 2008 election urban interests had secured a degree of political power unprecedented in recent history. The White House was occupied by a confirmed urbanite who found suburbs “boring” and had little connection with small town residents. The president stocked his EPA, Housing, Transportation and Education bureaucracies with pro-urban advocates who shared his vision to re-densify a country that has been steadily dispersing for half a century.

    At the start of the Obama presidency virtually every critical committee post in the House was controlled by urban Democrats led by Speaker Nancy Pelosi — such old lions as Henry Waxman, Barney Frank and Charles Rangel. In concert with an urban-focused White House, they constructed a stimulus tilted toward key urban interests: public employees, large universities, mass transit and high-speed rail systems.

    Now the cities’ political ascendency has come to an end. Suburban and small town voters, who represented a large majority of the electorate, shifted heavily the November toward the GOP. Unlike the city-focused old Congress, the new GOP dominated House’s primary loyalty is to the metropolitan periphery as well as smaller cities and towns.

    This shift will affect big cities across the country. Urban land speculators counting on a national  high-speed rail speed  and expanded rail transit networks to boost central cores now face a Congress more concerned with roads than ultra-expensive new trains. You can also forget the hundreds of millions ascribed for “smart growth” plans, which, in essence, seek to direct development and housing towards high-density urban areas.

    Even more serious for cities will be the fiscal fallout from the new order in Washington. Pushed by the Tea Party base, the GOP-led Congress will unlikely provide bailouts to fiscally challenged states and cities. This will hit those big cities — New York, Los Angeles, San Francisco and Chicago, –  located in heavily indebted states — New York, California and, arguably the worst of the pack, Illinois — the hardest.

    There is widespread concern, bordering on panic, about how potential cutbacks in state spending could further savage already strapped city budgets. In California, for example, Governor Jerry Brown’s proposed scaling back of state redevelopment funds was described in the Los Angeles Downtown News as a “budget bomb” for the city’s widely hyped but already tottering downtown renaissance.

    Yet these challenges also present an opportunity for cities. As one prominent urban booster, Brookings’ Chris Leinberger, has pointed out in a recent radio interview (KPCC-FM-NPR), many of the nation’s cities no longer require the assistance deemed necessary back in the ’60s and ’70s. As they have developed somewhat stronger downtown cores, lowered crime rates and reduced “white flight,” the stronger urban cores are better positioned now, though perhaps less so than the boosters believe,  to succeed on a market-oriented basis.

    Even setbacks, like the largely failed condo boom, can turn into an advantage. No longer commanding high prices from the never-quite-materialized hordes of affluent “empty nesters,” the new units could provide a stock of lower-cost housing for the younger, educated and childless demographic attracted to urban core. Although most millennials consider suburbs their ultimate destination, a sizable number, roughly one in five, rank an urban center as their “ideal” location.

    Cities need to break their reliance on outside help from a country that is, for the most part, not dense or urban. Future urban progress cannot rely on Washington’s largesse or diktats. Instead cities need to focus on how to create a greater competitive advantage in the demographic and employment marketplace. Rather than obsessing over government-driven employment, they have to create conditions that will lead to job creation in the private sector, particularly from the oft-neglected and usually politically impotent small business sector.  These include such things as relaxing some regulations, including taxes on home-based businesses, incubator centers and more consistent standards on building construction.

    City governments will need to shift their priorities away from ephemera and concentrate on such basics as improving schools, promoting entrepreneurial growth and nurturing sustainable middle class neighborhoods. The current shift in political power away from cities may be painful at first, but it could prove the elixir that will turn the urban renaissance fantasy into something closer to reality.

    This piece originally appeared in Forbes.

    Joel Kotkin is executive editor of NewGeography.com and is a distinguished presidential fellow in urban futures at Chapman University, and an adjunct fellow of the Legatum Institute in London. He is author of The City: A Global History. His newest book is The Next Hundred Million: America in 2050, released in February, 2010.

    Photo by asterix611

  • GIS and Online Mapping: Stretching the Truth Scale

    When I began my land planning career in 1968, one of the first things I learned about was the use of the Rubber Scale. What is it? Rubber Scale was a term used by civil engineers and land surveyors to describe an inaccurate plan that ignored the physical limitations of the existing terrain. To say that the planner or architect had used a Rubber Scale to create a beautifully rendered plan with pastel colors and soft shadows cast from tree stamps was a negative comment, since these plans were pretty much worthless to the engineer and surveyor that had to make the plans conform to regulations. Because the lines were hand drawn back then (and in many cases still are today), accuracy was, and remains, an issue.

    I was guilty of “stretching the scale” to maximize density, thus the term. The rubber scale was beloved by designers who wanted to look good to their developer clients. The developer expected a plan that maximized yield, and a plan that was of a higher density than they expected would surely be pleasing. Of course, these plans had no basis in reality. Ultimately, the land surveyors and civil engineers would lose the units we falsely claimed, and they would also get blamed for the density loss!

    Fast forward two decades to 1988, when GIS (Geographic Information Systems) began gaining market share. Government agencies (typically cities and counties) embarked on spending sprees with the promise of a new era in planning technology brought on by the advent and proliferation of the GIS technology, which blended graphic mapping information with a data base. You wanted to know property information, demographics, soil types? Just query the map. The sales teams of GIS mapping systems convinced those in charge of purchasing that “parcels” shown on the map could be traced quickly from a variety of sources, then later “rubber sheeted” into accurate surveyed section corners. As if by magic, inaccurate parcels would be made precise.

    So— early, existing hand drawn maps were traced into a computer, and the imprecise data was made even more imprecise. Even when the data came from aerial maps, created by flights several thousand feet above the surface, the accuracy was at best within three to five feet of actual location. What happens to curved boundary lines if the map is stretched to meet tens of thousands (or more) of lot corners, with all four section corners set accurately? The answer is, of course, a map that would be impractical to correct at a later date. Very few GIS maps exist today that were done using accurate land survey from the beginning.

    Fast forward another two decades and more to today, when Google Earth and its rivals, MapQuest and BingMaps, have unfortunately become the basis for site information. Call the data of these suppliers “on-line graphics”. There are a variety of software systems that boast that site layout can easily be done using on-line-graphics, or simply using the available on-line GIS mapping data.

    Here lies today’s problem: None of this information is likely to be accurate enough to be useful to an engineer or surveyor who ultimately must put their license on the drawing, guaranteeing its accuracy.

    GIS salesman make their sales commissions by convincing the world’s governments that data can be “adjusted” later to a more accurate data structure. This is true, but not economically feasible or practical. Since curved property lines are represented in a GIS system by a series of miniscule lines, it could be possible for the data to be corrected. This is like saying that it could be possible to temporarily build an approximate building and later on move walls to the locations shown on the plan. It would be possible, yes, but hardy cost (and time) effective.

    A lack of correct information is a huge problem when using GIS or on-line-graphics information. For example, it’s not possible to see contour lines that are accurate enough to determine flood plain, wetlands, or other information critical to the initial site design. Even when this information is shown on the city or county on-line map, what is the source of that data? Most of these maps are sourced to the lowest bidder. Was that wetland shown on the site just something that looked wet on an aerial map traced by a low-bidding draftsman, or was the wetland defined by an environmental expert who accurately surveyed it and somehow placed it precisely on the GIS map? This is the modern day version of using a rubber scale to measure the very data used to make decisions. Entire cities are stretched beyond practical use by surveyors and engineers.

    Many think that the on-line-graphics are taken from a satellite in space with some military camera that spy agencies use. Wrong! The images are derived from aerial mapping firms. These photographs might be several years old, which is why you might look at a newly developed suburban area, while the map still shows a farm field. You could be looking at a site to build residential units, not realizing a sewage treatment plant was recently built next door.

    Building Information Modeling (BIM) is a way for architects, engineers, contractors and owners to communicate and collaborate while designing a structure they are all involved in creating. The various parties can be instantly communicating worldwide on a single project located anywhere. Recently, I was participating in an on-line conference from one of the suppliers of BIM technology, who wanted to sell me on the idea of using BIM as an additional tool to use with our precision site design software. I require a developer to furnish us with an accurately surveyed boundary, topography, and any wetlands delineated precisely on the site before I begin my work. The BIM supplier took an office building from Florida (created accurately), and placed it on a site in South Dakota shown by Google Maps as if somehow that’s all there is to planning. Nowhere in the conversation did the salesman mention local regulations, site restrictions, where any easements might be (most often easements are not easily seen in photographs), etc. As soon as I was shown how a building from Florida could be placed on a site in a northern state using an on-line-graphics data base as the planning solution, the demonstration was over. Could BIM be used for site design? Absolutely, but only by using precision data from qualified engineers and surveyors, not on-line-graphics.

    The tax payers have financed billions of dollars worth of GIS systems with map data of questionable accuracy, with the understanding that the rough mapping data could be rectified accurately later. While true, the cost of converting existing maps would be prohibitive. The general public might think that these public data structures replace the need for land surveys and accurate civil engineering. But these vague images actually make it even more important to consult with a licensed professional to provide precision data before any design or development decisions are made.

    Over four decades ago I was guilty of using the rubber scale. New technology has promoted us into a new problem, and moved us from a rubber scale to a rubber sheeted world.

    Photo by edibleoffice: GIS of Hayes Valley, San Francisco.

    Rick Harrison is President of Rick Harrison Site Design Studio and Neighborhood Innovations, LLC. He is author of Prefurbia: Reinventing The Suburbs From Disdainable To Sustainable and creator of Performance Planning System. His websites are rhsdplanning.com and performanceplanningsystem.com.

  • The Dispersing of Urbanism

    For more than a century, people have been moving by the millions to larger urban areas from smaller urban areas and rural areas. Within the last five years, the share of the world population living in rural areas has dropped below one-half for the first time. The migration to the larger urban areas has spread to lower income nations as the countryside seemingly empties into places like Chongqing, Jakarta and Delhi. In the United States, the rural population has declined from slightly more than 60% in 1900 to approximately 18% in 2010. In Australia, the rural population is expected to decline to below 10% later in this decade.

    Of course, the driving factor in this urban migration is the quest for opportunity. People have flocked to urban areas because opportunities are greater.

    Yet if the opportunities are in metropolitan areas, indications are that this is taking place over a wider area than in the past. A review of income growth between 2001 and 2006 in four nations shows that incomes rose more in some surrounding regions than within the metropolitan areas, at least during the first half of the decade. It will be interesting to see if these patterns have changed in the second half of the decade, something we will be able to discern once the 2010/2011 round of census data is available.

    Australia

    This dispersion of opportunity is particularly evident in Australia, where data from the last two national censuses indicates that incomes overall have risen more quickly outside some major metropolitan areas. In three of five cases (the three largest) incomes rose higher outside rather than inside the major metropolitan areas (Figure 1).

    • In Sydney, the largest metropolitan area in Australia, median household incomes declined 6.6% relative to those of the state of New South Wales.
    • Melbourne median household incomes declined 3.5% relative to those of the state of Victoria.
    • Brisbane median household incomes declined 4.4% relative to those of the state of Queensland.
    • Median household incomes in Perth rose marginally more than those in the state of Western Australia (0.2%), while Adelaide incomes rose the strongest against state (South Australia) incomes at 4.4%.

    New Zealand

    Mimicking the largest metropolitan areas in Australia, Auckland, New Zealand’s largest metropolitan area, experienced a median personal income loss of 4.4% relative to that of the nation between 2001 and 2006 (Figure 1).

    Canada

    A similar story has unfolded in Canada. Major metropolitan area median household incomes declined relative to provincial incomes in one half of the cases (Figure 2). The largest relative losses occurred in arguably two most dynamic metropolitan areas :

    • Toronto, which accounts for nearly one fifth of Canada’s population experienced a median household income decrease of 4.4% relative to that of the province of Ontario. Steve LeFluer’s recent article shows that within the Greater Toronto area, the core city, with its amalgamated inner suburbs, has the lowest median household income.
    • Calgary, Canada’s energy capital, also experienced a median household income decrease of 4.4% relative to its province, Alberta.

    Vancouver’s median household income also fell, 3.3% relative to that of British Columbia’s.

    Three metropolitan areas experienced faster economic growth:

    • By far the strongest growth income growth occurred in Montréal, where median household incomes increased 8.4% relative to incomes in Québec.
    • The nation’s capital, Ottawa (a metropolitan area that straddles the borders of Ontario and Québec) experienced a median household income increase of 2.6% relative to the weighted median of the two provinces.
    • Edmonton, Alberta’s capital, experienced income growth marginally above that of the province (0.2%).

    United States

    A review of data in the United States indicates similar results. The same time span (2001 to 2006) was analyzed for the 34 metropolitan areas with more than 1 million population that are in a single state. State personal incomes per capita rose at a greater rate than the metropolitan area rates in 18 of the 34 cases (Figure 3).

    Two California metropolitan areas performed the best. In Los Angeles personal income per capita rose 3.6% relative to that of California in San Diego, per capita income rose at 6% relative to that of the state.

    Other metropolitan areas, including Las Vegas, Salt Lake City, Seattle, Oklahoma City, Cleveland, Pittsburgh and Jacksonville experienced income per capita increases of between 1% and 2% relative to those of their respective states.

    The largest loss occurred in information technology intensive San Jose, where incomes dropped 7.4% relative to those of California. Austin, capital of the nation’s second-largest state, experienced the second largest drop at 5.7% relative to incomes in the state of Texas, which as one of the leading information technology centers in the nation, generally mirrors the San Jose performance.

    Other losses between 2% and 5% relative to their states occurred in Rochester, Dallas-Fort Worth, Atlanta, Tampa-St. Petersburg, Riverside-San Bernardino, Orlando and Buffalo.

    Among the 15 multi-state metropolitan areas, eight experienced income increases relative to the states in the largest share of the population lives (this state with the historical core municipality) and seven declined. Perhaps the most surprising finding is that two metropolitan areas (New York and Washington), which have been among the most consistent in providing economic opportunities experienced only modestly greater income growth than their states.

    • New York, one of the two or three principal financial centers of the world, experienced income growth only 0.6% relative the weighted average of the states of New York and New Jersey, where nearly all of the area is located (Pike County, Pennsylvania is also in the metropolitan area).
    • Washington, where federal government and related in one can be counted upon to produce income growth, experienced only a modest rise of 0.3% relative to the weighted average of the two states (Virginia and Maryland) that comprise nearly all of the metropolitan area (Jefferson County, West Virginia is also in the metropolitan area).

    Metropolitanizing the World?

    These trends suggest a shift in metropolitan fortunes, at least in advanced countries. Historically incomes have grown much more strongly in metropolitan areas than in other areas. Now incomes are rising more quickly or at least nearly as quickly outside some major metropolitan areas as they are inside. It can no longer be blithely assumed that large metropolitan areas experience greater economic growth than their less urban hinterlands. The differences may be fading away, shaped not so much by proximity to the core but by other regional factors.

    We currently can only speculate as to the reasons for this development. The expansion of personal mobility and the ability of people to commute from outside major metropolitan areas may be one reason. Perhaps the most important factor is the rise of the information economy, which has freed some people from more intense urban living by permitting working at home part or all of the time. The proliferation of shopping opportunities, through franchised chains, the outward movement of immigrants, and online ordering may have made formerly remote areas more able to fulfill the needs and desires of people who previously would have inclined to live in more urban surroundings.

    These developments are consistent with the net migration of more than 2 million people away from metropolitan areas of more than 1 million population between 2000 and 2009 in the United States. Further, the phenomenon may be spreading beyond the high income world. As recently noted, in China, economic opportunities may be expanding in rural areas.

    ——

    Note

    This analysis compares metropolitan incomes to incomes in larger political jurisdictions (such as the metropolitan area of San Diego and California). An analysis that compared the area within the larger jurisdiction, but outside the metropolitan area, would yield a somewhat a difference (whether higher or lower), because the larger jurisdiction data available includes the metropolitan areas.

    Photo: “Outback” New South Wales: Faster Income Growth than Sydney (by author)

    Wendell Cox is a Visiting Professor, Conservatoire National des Arts et Metiers, Paris and the author of “War on the Dream: How Anti-Sprawl Policy Threatens the Quality of Life

  • Yes, We Do Need to Build More Roads

    Road are clearly out of fashion in urban planning circles. Conventional wisdom now decries roads in favor of public transit, walking or biking in developments designed to mimic traditional 19th century urbanism. Common refrains are “we can’t build our way out of congestion” or “widening roads to cure congestion is like loosening your belt to cure obesity.” Also frequently noted is the vehicle miles traveled has – at least until recently – outpaced population growth.

    But this piece of conventional wisdom is also deeply flawed. It obscures the bigger point that in a growing country we need to expand infrastructure to keep pace. The recent 2010 Census results put this in stark relief. The rate of growth from 2000 to 2010 slowed considerably from the previous decade, but still at a robust 9.7%, or 27.3 million new Americans. It would have been physically impossible to house all those people in traditional urban communities well-served by transit. The 27.3 million number is more than the combined 2009 population of the cities of New York, Los Angeles, Chicago, Philadelphia, Washington, Boston, San Francisco, Portland, and Seattle.

    In fact, this national growth is greater than the combined population of the 12 largest municipalities in the country.

    That’s just one decade’s worth of growth. America’s traditional urban areas couldn’t contain this, even if they were emptied of all their current residents. And the United States is projected to add an additional 90 million people by 2050. Where are all those people going to go? And how would they get to work even if they could live in these cities, given that much of America’s job growth has been suburban?

    Keep in mind also that much of this urban and transit infrastructure must be seen as more legacy than a reflection of modern choices. It was largely compete 50 or more years ago. Only Portland and Washington, DC have really managed to build new transit friendly urban core cities in the modern era. And despite their growing populations, these two places can only absorb a relatively small amount of new population every year. In Washington, it’s less population growth than gentrification – the replacement of largely poor African Americans with more affluent whites – that is the most outstanding demographic trend.

    That’s not to say America can’t invest more in transit or build more transit friendly cities. It can and it should. In particular, large, already dense urban areas like New York, Chicago, and Washington with large core area employment require major investment to upgrade their systems.

    Even smaller cities need better transit options and more urban neighborhoods. They are simply not well positioned to compete head on with newer suburban areas built from the ground up to support an auto-oriented lifestyle. But this will be difficult since they will have to build transit largely from scratch, and given anticipated cutbacks in new federal transit funding. this suggests they would be well-advised to avoid costly boondoggle mega-projects in favor of unglamorous but basic activities like running a quality urban bus system.

    But even if we achieve our potential in transit, America still needs to build more roads. We’ve got an interstate system originally designed for a 1960 population of 180 million and we are now well over 300 million and going up. By 2050 we’ll have more than double the 1960 population. This will require a major expansion of infrastructure, and that includes highway infrastructure.

    Just as one example, consider a moderate growth area like the Indianapolis-Carmel MSA. Its interstate system was mostly designed and completed circa 1970. The region had a population of a bit over 1.1 million then. Today it is over 1.7 million, an increase of 52%, or 596,000 people. A county the size of that increase would be the second largest county in the state of Indiana, well exceeding that of today’s #2, Lake County, a heavily urbanized county in Northwest Indiana.

    Yet until recently there had been almost no expansion of the Indianapolis freeway system. Fortunately, it was over-designed when built, but that is no longer the case. Thanks to a fortuitous lease of the Indiana Toll Road however, over 50 miles of freeway in the region are now being widened. Without this, the region would have faced decades of commuting misery.

    Unfortunately, that’s the bind where most cities now find themselves: managing growth with funding for roadway expansion and even maintenance running dry nationally.

    Keep in mind that tomorrow’s roads need not resemble yesterday’s monstrosities. The days of simplistically adding lanes while neglecting basics like enclosed drainage, sidewalks and paths, bus shelters, and aesthetics are likely over in many parts of the country. We need to provide room for the traffic we need to accommodate without excessive over-designs for a 15 minute peak of the peak, or dehumanizing roadway design approaches. Reform of our civil engineering educational system is eminently doable as plenty of great examples of suburban roadway design already exist. Federal standards need a revamp as well. We need to build not just more, but also better roads.

    With a botched stimulus, huge deficits at the federal and state level, and a public that has decisively turned against those deficits, a major construction program seems unlikely at this time. But in a couple years the economy should be back and a plan for fiscal recovery put in place and under execution. If not, we’ll have much bigger problems than roads.

    But assuming we get past this moment, we need to be laying the groundwork for a major continuation of the long history of American investment in infrastructure, from the Erie Canal to the interstate highway system. This includes not only a significant boost in urban transit spending where appropriate, but also a major program of both roadway repair and quality expansion, particularly in our growing metro regions. And as the Indiana example of a Toll Road lease shows, this doesn’t all have to come from tax dollars. Without this investment, our critical transport networks will ultimately seize up and America cannot hope to be competitive globally over the long haul.

    Aaron M. Renn is an independent writer on urban affairs based in the Midwest. His writings appear at The Urbanophile.

    Photo of a suburban road in Carmel, IN by author.

  • Faith-Based City Planning: Exorcising the Suburban Dream

    We’re coming to the end of the season when we focus a great deal of attention on faith. What is faith? The Biblical definition calls it the substance of things hoped for; the evidence of things not seen (Hebrews 11:1, KJV). Humans have the capacity to firmly believe in something that cannot be explained by reason and is not visibly evident. Faith is the basis of the world’s major religions, and often is a cause for war, and today, terrorism. But though the season of faith may be winding down, there is still a place where faith remains strong year round: It is often the basis of the way we plan our communities.

    Over the past two decades, our city planning has become faith based. A new preacher has evolved in the form of the Architect or Planner who evangelizes to the congregation that they can all live in serenity if they have faith in the teachings. Their sermons of architectural commandments introduce dimensional ratios that can deliver a utopian existence, promising a wonderland for families.

    To enforce faith, you of course need an evil entity to oppose. The evil entity in the faith of land planning is The Suburbs. Those that believe in the suburbs are inherently evil and must be converted or they may spend eternity dammed to a cul-de-sac. The automobile is sacrificed on this altar, with the chant “Space – Space – Space”.

    Converts to this faith include many if not most, politicians (not just liberals), architects, planners, environmentalists, movie stars, and many in the press. Those that have not converted yet include land developers, builders, city council and planning commission members, and the majority of the home buying market.

    Some of the principles this faith are as follows:

    • Thou shalt build upon thy dwelling a porch of such magnitude that it can serve as a gathering place.
    • Thou shalt construct a path of 2 cubits (approximately 4 feet) wide near thy porch for followers to meet and pray that a cul-de-sac shall not influence thy offspring.
    • A place for chariots shall be placed upon the buttocks of thy dwelling. Thy chariot must not be nearer to the dwelling than 4 cubits or thee will be smitten.
    • Thou shall plant a tree half a cubit from thy curb and in front of thy porch.
    • Create a place for gathering no farther than 600 cubits from thy dwelling.
    • Thy dwelling shall have Craftsman trim.
    • The path to heaven is taken by bicycle, light rail, or walking, not by powered chariot.
    • A congregant must dwell in extreme closeness to thy neighbor.

    Myself? I’m a disbeliever; a heretic who thinks there is no place in the design of our cities and neighborhoods for this belief system to be regulated or enforced. If development companies are believers, then by all means let them develop their land in such a manner, as they will have the faith that homes will sell to those that also believe.

    The danger arises when Federal funding is tied to the faith, on the basis that developments of extreme density will surely result in less vehicular miles traveled and a more healthy environment for human creatures. Do not follow this faith, and good luck getting funded. Is this the American way?

    I do not believe the automobile is evil, and I’m thankful that I live in an era where I can think nothing of traveling 20, 30, 40 miles or even 400 miles. A hundred years ago my ancestors had no such luxury.

    I am thankful that I live in a place that offers a sense of space, yet is not too distant from neighbors and services. I am especially thankful for choice. Yes, there is a coffee shop about a 10 minute walk away, but a three minute drive will get me to a coffee shop that offers more tasty drinks at lower costs.

    Looking outside, I see two feet of new snow. I’m especially thankful that I do not have to use our icy walks in the sub-zero temperatures, and wait for the bus that connects downtown to the bus that would take me to within a ¼ mile of my office. Yes I’m thrilled to have a 5 minute drive to work instead of an hour bus ride (buses connect downtown, not in the burbs). Of course, those with faith believe that exposure to sub-zero weather and walking along icy surfaces is somehow healthier.

    I lack the faith that extreme density without car ownership is a better way. As a disbeliever, I cannot find the faith to believe children being brought up in high-density, high-rise projects have the same quality of life as those brought up in homes with a secure and safe yard to play in. I cannot find the faith that living in high rise rentals is an American Dream.

    I do believe the consumer will not flock to this new life of high density living. Yes, New York today is a somewhat exciting place to visit, but just a few decades ago it was a truly awful place. What will it be like two decades from now? Will it be a great place to live for those on the lower side of “middle income”?

    I believe there is no magic architectural solution to create a better society – none. There is no special setback, density, or building-to- street ratio that can somehow provide a better life. There is no software button one can press to analyze land use and, bingo, spit out a solution. To believe that any of formula of that sort could be workable takes faith, a faith that is apparently held by many.

    I also believe that it’s simply untrue that the suburbs are not walkable. In the southern states, most cities demand walks to be constructed on both sides of the street. Because of snow, as one ventures north, walkways become less mandated. I have visited (and not on a press tour) the developments of the faith of land planning: I’On, Kentlands, Celebration, SeaSide, WaterColor, etc. What I’ve observed is that there seem to be no more or less people walking than what I have seen in conventional suburbs. On these visits I have never seen a single person sitting on his or her front porch – not one.

    Yet I do believe that a full front porch is important for two reasons. The first is that it connects the living spaces to the street, and it can be used to congregate. But secondly, there is a warmth to a neighborhood of homes that have full porches. It adds character, compared to the coldness of a development lacking porches. So— how the porch is used is not the only measure of its success.

    The sooner we can get faith out of the design of our cities, the sooner we can implement sustainable solutions that have a positive effect on our living standards and help get our housing market (and our economy) back on track. And yes, I hope I’m dammed to a cul-de-sac for eternity!

    Photo by Will Hart of College Hill, Rhode Island – Looking North-East with The First Baptist Church in America (1775), 75 North Main Street in the foreground.

    Rick Harrison is President of Rick Harrison Site Design Studio and Neighborhood Innovations, LLC. He is author of Prefurbia: Reinventing The Suburbs From Disdainable To Sustainable and creator of Performance Planning System. His websites are rhsdplanning.com and performanceplanningsystem.com.

  • Toronto: Three Cities in More than One Way

    The issue of income disparity in Toronto has once again been brought into the public eye by a December 15th report by University of Toronto Professor David Hulchanski. The report, “The Three Cities Within Toronto,” points to a growing disparity in incomes between Downtown Toronto, the inner suburbs, and the outer suburbs of the city. The report demonstrates that between 1970 and 2005 the residents of the once prosperous outer suburbs have been losing ground compared to the now wealthy downtown core. The results for the inner suburbs have been mixed.

    In 1970, 66% of city neighbourhoods were considered middle income. Only 15% were considered high or very high, and 19% were low or very low. In 2005, only 29% of neighbourhoods were considered middle income. The number of high or very high income neighbourhoods rose to 19%, while low and very low income neighbourhoods made up a staggering 54% of neighbourhoods.


    The news isn’t all bad. After all, the downtown core is now one of the most desirable places to live in North America, and many of the formerly low income neighbourhoods have gentrified, or are in the process of doing so. However, many of the city’s traditional suburbs have been decimated. The former cities of Etobicoke and Scarborough used to be middle class. Not so much anymore.

    In real dollar terms, even the majority of the very low income areas have become wealthier. The trouble with poverty statistics is that they focus on relative poverty, rather than absolute poverty. This means that if Etobicoke’s average income doubled tomorrow, the downtown core would all of a sudden be considered poor. This is a major limitation. Toronto isn’t exactly turning into a Canadian Detroit.

    The report rightly points to the need for greater mobility in the outer suburbs. Given that the most lucrative jobs are typically downtown, many young professionals and recent graduates living outside of the core need to be able to get downtown cheaply and quickly in order to build their careers. Where the report goes wrong is that it recommends stricter land use regulations, stronger rent controls, and the revival of the flawed Transit City plan that Mayor Ford vigorously campaigned against in the recent election.

    It is easy for academics to blame a lack of social welfare spending, or suburbanization for the problem. The real problem is the loss of local policy making power resulting from amalgamation. For the most part, the areas losing ground the fastest are the formerly middle class suburbs amalgamated into the city. In contrast the “exurbs” just outside of city boundaries have thrived. This is no coincidence. The real takeaway from this study is that the suburbs have different needs than the central core. By attempting to accommodate the needs of both, the megacity has benefitted neither. Short of de-amalgamation, the only hope for the city is to substantially decentralize policy making. No amount of spending can make up for the loss of local autonomy.

    Policies have different effects in different types of cities. Take the treatment of automobiles. It might make sense to discourage automobile usage in downtown Toronto, but the benefits of doing so in Vaughan or Pickering would be questionable at best. Similarly, mandating that every commercial establishment have a public washroom probably makes sense as a public health measure in downtown, where public urination is an issue, but not so much in suburban Markham, or Richmond Hill.

    Making sensible regulations for a small, relatively homogenous area isn’t all that difficult. Applying these regulations to a large, demographically diverse area can help some areas and hurt others. It’s not that regulations need to be a zero sum game. People in Etobicoke wouldn’t be affected if, say, maximum parking allotments were tightened in the downtown core. They would be affected if they were tightened throughout the entire megacity. Similarly, increasing maximum parking allotments might hurt the core and help the suburbs. The current one size fits all approach sometimes benefits the core and sometimes benefits the suburbs, but ever both.

    Perhaps more important than city wide regulations is the centralization of taxing power. Since the merger, the city now sets tax rates across the entire megacity. This also allows the city to control the ratio of residential to non-residential taxes. The city of Toronto has the highest ratio of non-residential to residential taxes in Ontario. This means that businesses carry a higher share of the tax load in the city than anywhere else in the province. The combination of tax and regulatory policies in the city have lead the Canadian Federation of Independent Businesses to rank Toronto as the second least business friendly city in Canada. On a scale of 1-100, Toronto came in at 33, slightly ahead of Vancouver’s 31. Meanwhile, the rest of the (Greater Toronto Area) GTA is near the top, at 61. Neighbouring Oshawa took the top spot in Ontario with 69.

    GTA Area Cities by CFIB Entrepreneurial Cities Policy Score

    Rank (Ontario)

    City

    Score

    Driving Distance to Yonge and Bloor

    1

    Oshawa

    69

    0:45

    6

    GTA (Excluding Toronto)

    61


        Mississauga

    61

    0:27


        Brampton

    61

    0:41


        Richmond Hill

    61

    0:32


        Markham

    61

    0:32


        Vaughan

    61

    0:32

    16

    Hamilton

    55

    0:58

    19

    Guelph

    54

    1:15

    24

    Barrie

    52

    1:16

    27

    Brantford

    51

    1:20

    30

    Kitchener

    48

    1:23

    33

    Toronto

    33


        Etobicoke

    33

    0:20


        Scarborough

    33

    0:21

    Now the share of non-residential to residential taxes in Toronto may actually make sense downtown. The core is home to the third biggest financial sector in North America. These jobs are heavily concentrated in the downtown core.

    Downtown Toronto isn’t competing with low tax Vaughan or Barrie for these jobs. They are competing with high tax cities like New York and Chicago. This means that employment in the core is not as easily chased off by taxes and regulations than in the suburbs. But in industries like wholesale and manufacturing, which are far more important outside of the core, employment can easily relocate to Barrie, Mississauga, Oshawa, and so forth. Indeed, jobs have been leaving the city since before the recession hit.

    Since 2004 Downtown and North York have prospered but the rest of the city has lost jobs. This should make the results of the Professor Hulchanski’s report unsurprising. The financial sector isn’t enough to keep the entire city employed or lift wages in the city-controlled suburban rings. As a a result despite the thriving financial sector, Toronto was dead last in the GTA in terms of median incomes.

    To turn this around, the city must decentralize decision making power so the suburban communities can come up with their own economic development strategies. No matter how much the city improves transit to the outer suburbs, they will not be able to significantly increase median incomes without creating more jobs. The financial sector will continue to grow, but many of jobs created in this sector require specialized training, and thus go to people from outside of the city. This doesn’t do much for former manufacturing workers in Scarborough and Etobicoke. Growth of the financial sector combined with the dispearance of blue collar jobs together guarantee continuing income disparities in the city.

    Below is previously published data from Professor Hulchanski that highlights how badly blue collar sections of the city have been hit.


    Fundamentally, a strong focus on financial and other so-called “creative class” jobs will do little for these areas. The above map was created by Richard Florida’s Martin Prosperity Institute. It shows that most creative class jobs are clustered around the subway, but this doesn’t mean that expanding rail transit will expand creative class employment. Building a light rail line through a neighbourhood doesn’t suddenly transform the residents into artists and physicians. It may attract more artists and physicians, but this could actually hurt local residents by driving up rent and property values without creating jobs for them. Below is a map of educational attainment by ward. The darker the colour, the higher the number of residents with a bachelor’s degree or higher.

    The real problem is that a focus on elite jobs creates exactly the kind of bifurcation that progressive complain about. Given that city wide business policies are tailored towards creative class type occupations, it is unlikely that price sensitive manufacturers will find any reason to locate within city boundaries, rather than setting up shop in Mississauga or Barrie.

    Indeed, for all the temptation by urbanists to point to Toronto’s suburban ring as an example of the decline of suburbia, the peripheral suburban areas outside of city limits have been booming. Here is a map of growth in the GTA between 2001-2006. While Toronto grew modestly, suburban cities Milton, Brampton, Vaughan, Richmond Hill, Markham, Ajax, and Whitby all grew by at least 20%. Even Oshawa, which was hit hard by the decline of the auto sector, has managed to survive, and indeed maintained a higher median income than Toronto during this period. Regional rival Mississauga eclipsed Toronto’s growth rate, and emerging regional player Barrie grew by over 20%.

    In short, despite its strong financial core, Toronto is losing its standing as the go-to destination in the GTA. And it could get worse. Mississauga is working hard to lure financial services and advanced manufacturing jobs from Toronto. Several other cities, such as Guelph and Waterloo are actually competing for the very creative types that Toronto’s policies are tailored to attract. Other cities, such as Barrie are working hard to cannibalize what is left of Toronto’s manufacturing and distribution sectors. Were it not for amalgamation, Etobicoke or Scarborough could just as easily have undertaken a similar strategy to attract blue collar jobs.

    The Three Cities report identifies serious regional disparities in Toronto. Unfortunately, it doesn’t provide much insight into how to fix the problem. Expanding transit options will only go so far towards this. Building more light rail may raise median incomes by attracting wealthier people to these neighbourhoods. Ironically, this will only widen the income gap. The real challenge is finding out how to create opportunities for blue collar jobs in suburban Toronto. Unfortunately, amalgamation has imposed one size fits all policies that may work downtown, but utterly fail in the suburbs and continue to drive people to the periphery outside the city limits. Ironically, the very policies that seek to halt “sprawl” may well end up exacerbating it.

    Toronto Skyline photo by Smaku

    Steve Lafleur is a public policy analyst and political consultant based out of Calgary, Alberta. For more detail, see his blog.

  • Belly-Up In The Burbs: Bank-Owned Developments

    In 2009, the number of repossessed autos increased to 1.9 million. The number of homes under foreclosure varies from month to month, but the 2009 total was about 2.8 million. For 2010, it seems that a million new foreclosed homes would be conservative, with a large percentage in California. Miss a few payments on an auto loan and you may wake up to an empty driveway. On the other hand, repossession of your home is a long drawn out process.

    What kinds of communities have been hardest hit with foreclosures? Tom Cusack, a retired federal housing manager in Portland, tracks the issue via his Oregon Housing Blog. This summer, he was quoted in the Portland Tribune, saying “The foreclosure activity that is occurring in suburban markets in Oregon is unprecedented. It’s affecting not just rural areas, not just inner-city neighborhoods, but suburban neighborhoods, probably more substantially than any time in the past.”

    Daniel Ommergluck of Georgia Tech also studied this situation. His findings, he says, contradict “…some suggestions that the crises was primarily centered in suburban or exurban communities.” It concluded, “The intrametropolitan location of a zip code appears to have been a less important factor in REO (real estate owned) growth than the fact that a large amount of development in newer communities was financed during the subprime boom.”

    Decades ago, a young couple would have had to save for many years to accumulate the considerable down-payment to buy their first home, and the prospect of losing that home to foreclosure would have been devastating. With the more recent “easy financing,” though, there has been little to risk. The low effort to move into that new housing development has meant less “emotional” investment. When home prices escalated beyond reason in the years prior to the crash, it left many home buyers over-exposed, specifically because of the easy mortgages.

    The local economy also determines which suburbs suffer the most. Certainly homes in prosperous Houston or San Antonio that did not ride the absurd price increases fared much better than Detroit, with its bleak employment picture, where homes are imploding in value.

    Historically, the U.S. suburban home buying market is somewhere between 70% and 80% higher volume than the urban market. In other words, for every ten homes sold, seven or eight of them are likely to be suburban. So, it would stand to reason that the foreclosure crisis would be focused in the suburbs. Yet suburban vs. urban data on the subject is scarce.

    It’s probably more reasonable to assume that the local employment situation would have a larger effect than whether a community is urban or suburban. For example, when the Ford Plant in urban St. Paul closes, there will be 750 employees out of work and at risk of eventual foreclosure if the job market remains depressed. The residential area abutting the Ford plant is actually very nice, suggesting that many of the workers might live in the nearby city, not in the suburbs. Several miles from the Ford Plant is the suburb of Eagan where Lockeed Martin will close down their operation and put some 400 highly paid people out of work. These newly unemployed workers also may ultimately end up with their homes in foreclosure if they cannot gain highly paid employment elsewhere. Thus suburban vs. urban foreclosures are related to a very localized economy.

    There is, however, a greater menace to the suburbs than home foreclosures. It is when an entire development is foreclosed and becomes bank owned. Since the urban foreclosure is likely on a home that has been sold many times since the development — let’s call it ‘Jones Addition’ — was first built in 1925, the developer going broke is meaningless to the urban dweller.

    However, when ‘Jones Acres’ in Pleasantville was opened just five years ago, and phase one sold out with the beginning of phase two of 12 phases just started at the time of the crash, a very different and dangerous scenario arises. You see, Jones Acres is comprised of 500 lots. Of those, perhaps 40 were purchased by new suburban home buyers trusting that the amenities would be built as planned and promised.

    When President Bush announced that we had a 700 billion dollar problem and needed to bail out the banks, those same financial institutions essentially called the loans, which closed down much (probably most) of the nation’s developers. Land was no longer secure, and the development repossessions began. Without the banks funding, developers could not afford to properly maintain the grounds, associations failed, and eventually the banks were the new owners.

    Here in Minnesota, I know of few suburban developments that have not been foreclosed on. This would seem to be a greater threat to the future of the suburbs than individual homes being lost. Yet very little attention has been paid to the volume of bank owned developments. Much of the suburban land was purchased under contracts to farmers that took the land in phases. If a major builder committed to taking down the 500 lots in Jones Acres, and placed a million dollars in initial money ($2,000 a lot for the land), and after 40 lots decided to walk away, it left the farmer holding the land now likely taxed much higher and in danger of foreclosure. It made sense in many scenarios for the major builder to walk away and lose its lot deposits. Later on, if the development failed and the bank needed to unload the property, another major builder might be able to pick up the lots at 10 cents on the dollar, and just sit on the property for years until the housing market starts to recover.

    Since the recession began, a group of us approached banks with an offer to review the approved plans and re-plan some idle developments more efficiently and sustainably. This state of limbo would have been an excellent time to redesign the land into a much more sustainable (and profitable) product with little outlay from the financial institution. We could not find a single bank that was interested in adding value.

    Often the initial developer imagines the details of a neighborhood: the amenities, the architecture, the landscaping, and the marketing. What happens when a bank takes over? The banker most likely lacks this forward vision, and sells the development later to a buyer who offered 1/10th of the initial land cost for an approved platted development. Bah humbug, this buyer says, who needs a front porch, parks are for drug dealers, and if streets were meant to have trees, then the lord would have planted them there! The result is a highly visible, low value community.

    Cities approve developments based upon relationships. The recession eradicated so many promises that may now never be realized. Foreclosed homes in the cities or in the suburbs are less of a problem than foreclosed developments… and in this case, the suburbs lose – big time!

    Photo by Sean Dreilinger: One of two adjacent bank owned homes.

    Rick Harrison is President of Rick Harrison Site Design Studio and Neighborhood Innovations, LLC. He is author of Prefurbia: Reinventing The Suburbs From Disdainable To Sustainable and creator of Performance Planning System. His websites are rhsdplanning.com and performanceplanningsystem.com.

  • A New Word in Development

    In the old days a “blurb” was a positive promotional recommendation statement on a book jacket. I have done a few myself. Now we are informed by the developer of Civita, an urban infill project in San Diego, that “blurb” really means a cross between suburban and urban.

    Are they going to put a picture of it on a book jacket?

    As for villages, I live in one myself. Fine and dandy, Very nice to have shops, bars, and restaurants you can walk to. But most people are not going to want to be limited to the retail and recreational opportunities of their “village,” nor even to those one can reach by good public transport from said “village.” Most particularly, most people are not going to be able to be limited to the job opportunities reachable on foot or by public transit from one’s “village.”

  • Could the Dallas Way be the Right Way?

    Dallas was George W. Bush’s first choice for a retirement destination but it gets low approval ratings elsewhere. A recent poll of readers of American Style magazine rated Dallas only 24th out of 25 large American cities as an arts destination. It came in immediately behind those well-known cultural magnets Milwaukee and Las Vegas, and ahead of only Jacksonville FL, even though it dwarfs all three places in terms of population, arts institutions and urban amenities. An apparently typical assessment residing in the blogosphere states flatly “God I hate Dallas. Everything about it. Especially the airport. Which is the only part of Dallas I’ve ever been in.”

    There has always been urban rivalry, going back at least to the days of the Greek city-states. When Phoenix overtook Philadelphia in the census rankings some years ago, the local newspapers delighted in printing unflattering pieces about the other and extolling their own virtues.

    Increasingly, this rivalry goes beyond traditional boosterism. Cities used to be places where one lived, but they have become metaphors about lifestyle and identity, and the personal has become increasingly highly political.

    In the last presidential election, the former mayor of Wasilla, Alaska seemed to argue that small towns were the keepers of the true American flame, which upset quite a few urbanites. But not all cities are created equal. The creative class thesis suggests that, like high school, there is cool and there is un-cool. This gets complicated when the nerds decide the cool places are. Cities that are designated as cool, like Portland, also tend to be among the least ethnically diverse.

    In short, we are now quarrelling about which cities are the coolest, based upon the extent to which they serve as extensions of our personalities and manifestations of our identities. This has always existed in terms of local rivalries—New York and New Jersey, Minneapolis and St. Paul—but now it is taking on the characteristics of cultural civil war.

    In this scheme of things, Dallas ranks among the totally uncool, which is probably one of the reasons George Bush chose it. But reputation is not necessarily its reality, as visitors to the city can find out for themselves. On a recent Friday afternoon downtown, I saw a line of school buses jostling to drop off and pick up their passengers ranging from young children to strapping adolescents. Every ethnicity seemed to be represented. They were not going to a sports event represented but regular traffic to the Dallas Arts District, a contiguous area amid the high rises that covers 68 acres and contains a broad array of theatres, museums and the city’s Arts Magnet school.

    Texas is hardly short of arts destinations: San Antonio ranked high in the American Style poll, as did Austin, which is known for its South by Southwest and Austin City Limits music festivals. Although Dallas does not automatically come to mind when thinking about highbrow culture, its Arts District is not just a vanity project, but is part of a restructuring of the city’s image taking shape for over three decades. The Arts District was anchored by the opening of the Dallas Museum of Art in 1984; this was followed by the Myerson Symphony Center [designed by I.M. Pei], the Crow Collection of Asian Art, the Nasher Sculpture Center, and the renovation of the Booker T. Washington High School for the Performing and Visual Arts [Norah Jones is an alumna]. Most recent to open is the AT&T Performing Arts Center, the fourth of the cultural buildings to be designed by a prize-winning architect.

    Most metro areas would delight in this kind of enhancement. Yet Harvey Graff, in his book “The Dallas Myth” suggests the city has grown by “brash boosterism”. He argues the ‘Dallas Way’ of getting things done involves an existential denial of the past [especially negative events, notably the Kennedy Assassination] and an equally strong denial of any limits to the future.

    Graff believes that the Dallas Way fails its residents. He argues little, if anything, has been done for poorer neighborhoods. There is substance to this of course: all American cities reflect the inequalities of our society

    Yet what Dallas is doing is still remarkable. In addition to the Arts District, it is pursuing costly projects such as the DART light rail network, which is connecting formerly neglected neighborhoods [now reviving to create a new Uptown] and reaching out to middle suburbia, where whole plazas are sprouting Asian stores and restaurants. No-one is going to be confusing it with New York any time soon, but it does seem that the Dallas Way also has things to recommend it. House prices have not cratered; the Metroplex is not in the fifth circuit of foreclosure hell like Phoenix or Las Vegas.

    Of course, this comes at a literal price, and a figurative one. Reviving some neighborhoods means gentrification. Spending on light rail tends to support young adults rather than children needing kindergartens. Stable house prices in some Dallas neighborhoods can mean modest homes costing more than a half million dollars, the antithesis of affordability.

    Yet the growth machine worked in the past and helped Dallas become a leading producer of higher end jobs and a high degree of home ownership. In many ways Dallas works better for its diverse residents than many urban aesthetes might suggest.

    This leaves unanswered the question of the aspirations of a city like Dallas to be taken seriously by the urban tastemakers. In the current climate, that seems unlikely. Cool is going to beat out the rest—except in the contexts of jobs and incomes, which is the world in which most people operate. Economic growth in Dallas and Houston gets little attention in the chat rooms where the defenders of Portland and its counterparts congregate. But as for me, I’m thinking that for the very first time, George Bush might actually be right.

    Andrew Kirby has been associated with the journal *Cities* for nearly thirty years. He is based in Arizona.

    Photo by purpletwinkie