Estimates of the United states population at the middle of the 21st century vary, from the U.N.’s 404 million to the U.S. Census Bureau’s 422 to 458 million. To develop a snapshot of the nation at 2050, particularly its astonishing diversity and youthfulness, I use the nice round number of 400 million people, or roughly 100 million more than we have today.
The United States is also expected to grow somewhat older. The portion of the population that is currently at least 65 years old—13 percent—is expected to reach about 20 percent by 2050. This “graying of America” has helped convince some commentators of the nation’s declining eminence. For example, an essay by international relations expert Parag Khanna envisions a “shrunken America” lucky to eke out a meager existence between a “triumphant China” and a “retooled Europe.” Morris Berman, a cultural historian, says America “is running on empty.”
But even as the baby boomers age, the population of working and young people is also expected to keep rising, in contrast to most other advanced nations. America’s relatively high fertility rate—the number of children a woman is expected to have in her lifetime—hit 2.1 in 2006, with 4.3 million total births, the highest levels in 45 years, thanks largely to recent immigrants, who tend to have more children than residents whose families have been in the United States for several generations. Moreover, the nation is on the verge of a baby boomlet, when the children of the original boomers have children of their own.
Between 2000 and 2050, census data suggest, the U.S. 15-to-64 age group is expected to grow 42 percent. In contrast, because of falling fertility rates, the number of young and working-age people is expected to decline elsewhere: by 10 percent in China, 25 percent in Europe, 30 percent in South Korea and more than 40 percent in Japan.
Within the next four decades most of the developed countries in Europe and East Asia will become veritable old-age homes: a third or more of their populations will be over 65. By then, the United States is likely to have more than 350 million people under 65.
The prospect of an additional 100 million Americans by 2050 worries some environmentalists. A few have joined traditionally conservative xenophobes and anti-immigration activists in calling for a national policy to slow population growth by severely limiting immigration. The U.S. fertility rate—50 percent higher than that of Russia, Germany and Japan and well above that of China, Italy, Singapore, South Korea and virtually all the rest of Europe—has also prompted criticism.
Colleen Heenan, a feminist author and environmental activist, says Americans who favor larger families are not taking responsibility for “their detrimental contribution” to population growth and “resource shortages.” Similarly, Peter Kareiva, the chief scientist at the Nature Conservancy, compared different conservation measures and concluded that not having a child is the most effective way of reducing carbon emissions and becoming an “eco hero.”
Such critiques don’t seem to take into account that a falling population and a dearth of young people may pose a greater threat to the nation’s well-being than population growth. A rapidly declining population could create a society that doesn’t have the work force to support the elderly and, overall, is less concerned with the nation’s long-term future.
The next surge in growth may be delayed if tough economic times continue, but over time the rise in births, producing a generation slightly larger than the boomers, will add to the work force, boost consumer spending and generate new entrepreneurial businesses. And even with 100 million more people, the United States will be only one-sixth as crowded as Germany is today.
Immigration will continue to be a major force in U.S. life. The United Nations estimates that two million people a year will move from poorer to developed nations over the next 40 years, and more than half of those will come to the United States, the world’s preferred destination for educated, skilled migrants. In 2000, according to the Organisation for Economic Co-operation and Development, an association of 30 democratic, free-market countries, the United States was home to 12.5 million skilled immigrants, equaling the combined total for Germany, France, the United Kingdom, Australia, Canada and Japan.
If recent trends continue, immigrants will play a leading role in our future economy. Between 1990 and 2005, immigrants started one out of four venture-backed public companies. Large American firms are also increasingly led by people with roots in foreign countries, including 15 of the Fortune 100 CEOs in 2007.
For all these reasons, the United States of 2050 will look different from that of today: whites will no longer be in the majority. The U.S. minority population, currently 30 percent, is expected to exceed 50 percent before 2050. No other advanced, populous country will see such diversity.
In fact, most of America’s net population growth will be among its minorities, as well as in a growing mixed-race population. Latino and Asian populations are expected to nearly triple, and the children of immigrants will become more prominent. Today in the United States, 25 percent of children under age 5 are Hispanic; by 2050, that percentage will be almost 40 percent.
Growth places the United States in a radically different position from that of Russia, Japan and Europe. Russia’s low birth and high mortality rates suggest its overall population will drop by 30 percent by 2050, to less than a third of the United States’. No wonder Prime Minister Vladimir Putin has spoken of “the serious threat of turning into a decaying nation.” While China’s population will continue to grow for a while, it may begin to experience decline as early as 2035, first in work force and then in actual population, mostly because of the government’s one-child mandate, instituted in 1979 and still in effect. By 2050, 31 percent of China’s population will be older than 60. More than 41 percent of Japanese will be that old.
Political prognosticators say China and India pose the greatest challenges to American predominance. But China, like Russia, lacks the basic environmental protections, reliable legal structures, favorable demographics and social resilience of the United States. India, for its part, still has an overwhelmingly impoverished population and suffers from ethnic, religious and regional divisions. The vast majority of the Indian population remains semiliterate and lives in poor rural villages. The United States still produces far more engineers per capita than India or China.
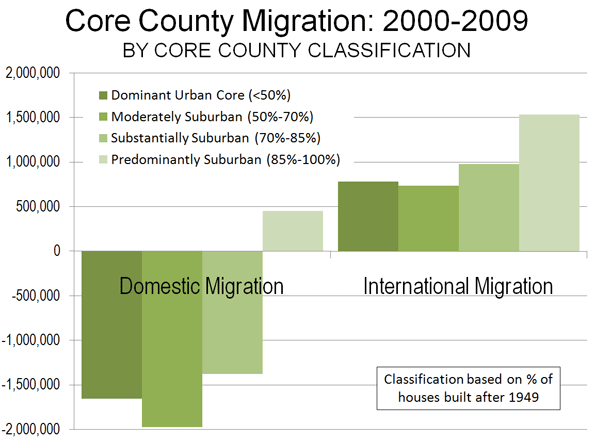
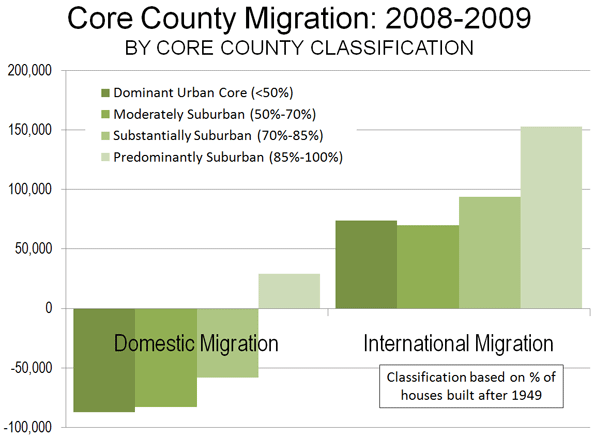
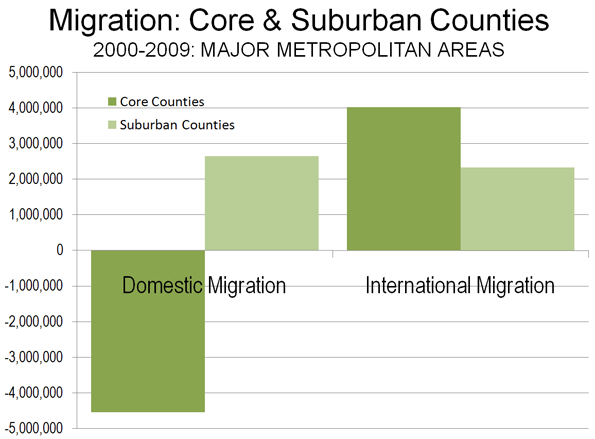
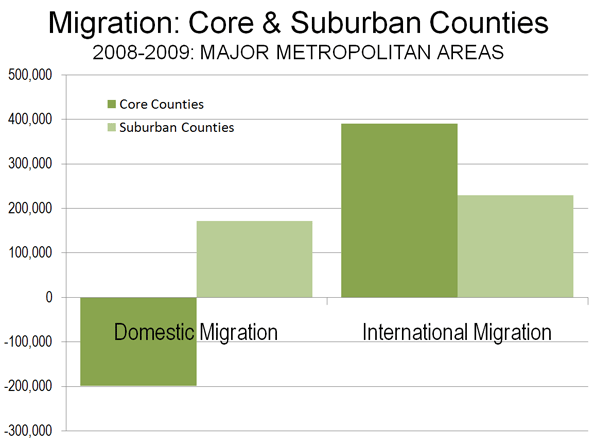
Suburbia will continue to be a mainstay of American life. Despite criticisms that suburbs are culturally barren and energy-inefficient, most U.S. metropolitan population growth has taken place in suburbia, confounding oft-repeated predictions of its decline.
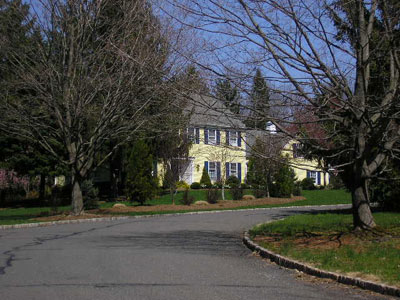
Some aspects of suburban life—notably long-distance commuting and heavy reliance on fossil fuels—will have to change. The new suburbia will be far more environmentally friendly—what I call “greenurbia.” The Internet, wireless phones, video conferencing and other communication technologies will allow more people to work from home: at least one in four or five will do so full time or part time, up from roughly one in six or seven today. Also, the greater use of trees for cooling, more sustainable architecture and less wasteful appliances will make the suburban home of the future far less of a danger to ecological health than in the past. Houses may be smaller—lot sizes are already shrinking as a result of land prices—but they will remain, for the most part, single-family dwellings.
A new landscape may emerge, one that resembles the network of smaller towns characteristic of 19th-century America. The nation’s landmass is large enough—about 3 percent is currently urbanized—to accommodate this growth, while still husbanding critical farmland and open space.
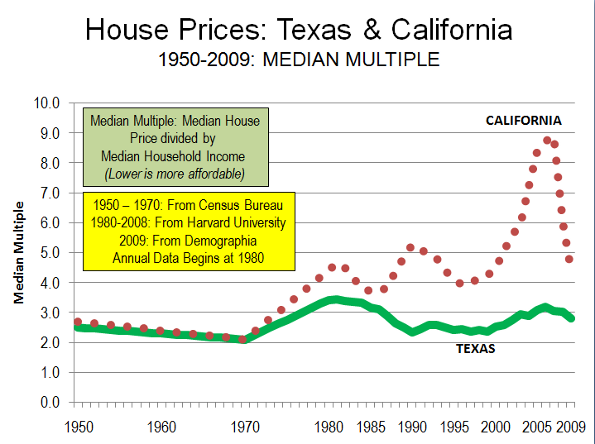
In other advanced nations where housing has become both expensive and dense—Japan, Germany, South Korea and Singapore—birthrates have fallen, partly because of the high cost of living, particularly for homes large enough to comfortably raise children. Preserving suburbs may therefore be critical for U.S. demographic vitality.
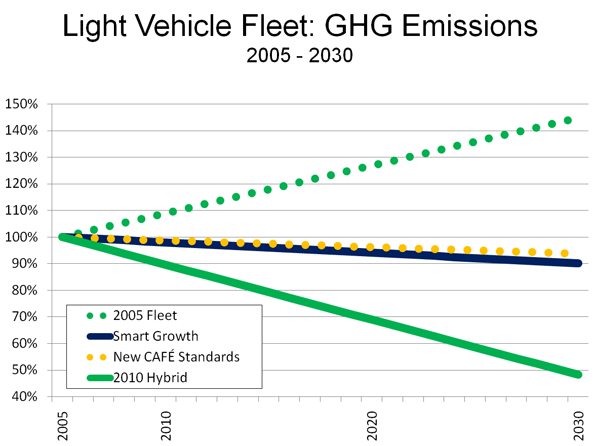
A 2009 study by the Brookings Institution found that between 1998 and 2006, jobs shifted away from the center and to the periphery in 95 out of 98 leading metropolitan regions—from Dallas and Los Angeles to Chicago and Seattle. Walter Siembab, a planning consultant, calls the process of creating sustainable work environments on the urban periphery “smart sprawl.” Super-fuel-efficient cars of the future are likely to spur smart sprawl. They may be a more reasonable way to meet environmental needs than shifting back to the mass-transit-based models of the industrial age; just 5 percent of the U.S. population uses mass transit on a daily basis.
One of the urban legends of the 20th century—espoused by city planners and pundits (and a staple of Hollywood)—is that suburbanites are alienated, autonomous individuals, while city dwellers have a deep connection to their neighborhoods. As the 2001 book Suburban Nation puts it, once suburbanites leave the “refuge” of their homes they are reduced to “motorist[s] competing for asphalt.”
But suburban residents express a stronger sense of identity and civic involvement than city dwellers. A recent study by Jan Brueckner, a University of California at Irvine economist, found that density does not, as is often assumed, increase social contact between neighbors or raise overall social involvement; compared with residents of high-density urban cores, people in low-density suburbs were 7 percent more likely to talk to their neighbors and 24 percent more likely to belong to a local club.
Suburbs epitomize much of what constitutes the American dream for many people. Minorities, once largely associated with cities, tend to live in the suburbs; in 2008 they were a majority of residents in Texas, New Mexico, California and Hawaii. Nationwide, about 25 percent of suburbanites are minorities; by 2050 immigrants, their children and native-born minorities will become an even more dominant force in shaping suburbia.
The baby boom generation is poised for a large-scale “back to the city” movement, according to many news reports. But Sandra Rosenbloom, a University of Arizona gerontology professor, says roughly three-quarters of retirees in the first bloc of boomers appear to be sticking close to the suburbs, where the vast majority reside. “Everybody in this business wants to talk about the odd person who moves downtown,” Rosenbloom observes. “[But] most people retire in place. When they move, they don’t move downtown, they move to the fringes.”
To be sure, there will be 15 million to 20 million new urban dwellers by 2050. Many will live in what Wharton business professor Joseph Gyourko calls “superstar cities,” such as San Francisco, Boston, Manhattan and western Los Angeles—places adapted to business and recreation for the elite and those who work for them. By 2050, Seattle, Portland and Austin could join their ranks.
But because these elite cities are becoming too expensive for the middle class, the focus of urban life will shift to cities that are more spread out and, by some standards, less attractive. They’re what I call “cities of aspiration,” such as Phoenix, Houston, Dallas, Atlanta and Charlotte. They’ll facilitate upward mobility, as New York and other great industrial cities once did, and begin to compete with the superstar cities for finance, culture and media industries, and the amenities that typically go along with them. The Wall Street Journal noted that commercial success has already turned Houston, once considered a backwater, into “an art mecca.”
One of the least anticipated developments in the nation’s 21st-century geography will be the resurgence of the region often dismissed by coastal dwellers as “flyover country.” For the better part of the 20th century, rural and small-town communities declined in percentage of population and in economic importance. In 1940, 43 percent of Americans lived in rural areas; today it’s less than 20 percent. But population and cost pressures are destined to resurrect the hinterlands. The Internet has broken the traditional isolation of rural communities, and as mass communication improves, the migration of technology companies, business services and manufacturing firms to the heartland is likely to accelerate.
Small Midwestern cities such as Fargo, North Dakota, have experienced higher than average population and job growth over the past decade. These communities, once depopulating, now boast complex economies based on energy, technology and agriculture. (You can even find good restaurants, boutique hotels and coffeehouses in some towns.) Gary Warren heads Hamilton Telecommunications, a call center and telecommunications-services firm that employs 250 people in Aurora, Nebraska. “There is no sense of dying here,” Warren says. “Aurora is all about the future.”
Concerns about energy sources and hydrocarbon emissions will also bolster America’s interior. The region will be pivotal to the century’s most important environmental challenge: the shift to renewable fuels. Recent estimates suggest the United States has the capacity to produce annually more than 1.3 billion dry tons of biomass, or fuels derived from plant materials—enough to displace 30 percent of the current national demand for petroleum fuels. That amount could be produced with only modest changes in land use, agricultural and forest-management practices.
Not since the 19th century, when the heartland was a major source of America’s economic, social and cultural supremacy, has the vast continental expanse been set to play so powerful a role in shaping the nation’s future.
What the United States does with its demographic dividend—its relatively young working-age population—is critical. Simply to keep pace with the growing U.S. population, the nation needs to add 125,000 jobs a month, the New America Foundation estimates. Without robust economic growth but with an expanding population, the country will face a massive decline in living standards.
Entrepreneurs, small businesses and self-employed workers will become more common. Between 1980 and 2000 the number of self-employed individuals expanded, to about 15 percent of the work force. More workers will live in an economic environment like that of Hollywood or Silicon Valley, with constant job hopping and changes in alliances among companies.
For much of American history, race has been the greatest barrier to a common vision of community. Race still remains all too synonymous with poverty: considerably higher poverty rates for blacks and Hispanics persist. But the future will most likely see a dimming of economic distinctions based on ethnic origins.
Since 1960, the proportion of African-American households at or below the poverty line ($22,000 annually for a family of four in 2008 dollars) has dropped from 55 to 25 percent, while the black middle class has grown from 15 to 39 percent. From 1980 to 2008, the proportion who are considered prosperous—households making more than $100,000 a year in 2008 dollars—grew by half, to 10.3 percent. Roughly 50 percent more African-Americans live in suburbs now than in 1980; most of those households are middle class, and some are affluent.
The most pressing social problem facing mid-21st-century America will be fulfilling the historic promise of upward mobility. In recent decades certain high-end occupation incomes grew rapidly, while wages for lower-income and middle-class workers stagnated. Even after the 2008 economic downturn, largely brought on by Wall Street, it was primarily middle-class homeowners and jobholders who bore the brunt, sometimes losing their residences. Most disturbingly, the rate of upward mobility has stagnated overall, as wages have largely failed to keep up with the cost of living. It is no easier for poor and working-class people to move up the socio-economic ladder today than it was in the 1970s; in some ways, it’s more difficult. The income of college-educated younger people, adjusted for inflation, has been in decline since 2000.
To reverse these trends, I think Americans will need to attend to the nation’s basic investments and industries, including manufacturing, energy and agriculture. This runs counter to the fashionable assertion that the American future can be built around a handful of high-end creative jobs and will not require reviving the old industrial economy.
A more competitive and environmentally sustainable America will rely on technology. Fortunately, no nation has been more prodigious in its ability to apply new methods and techniques to solve fundamental problems; the term “technology” was invented in America in 1829. New energy finds, unconventional fuel sources and advanced technology are likely to ameliorate the long-prophesied energy catastrophe. And technology can ease or even reverse the environmental costs of growth. With a population of 300 million, the United States has cleaner air and water now than 40 years ago, when the population was 200 million.
The America of 2050 will most likely remain the one truly transcendent superpower in terms of society, technology and culture. It will rely on what has been called America’s “civil religion”—its ability to forge a unique common national culture amid great diversity of people and place. We have no reason to lose faith in the possibilities of the future.
This article originally appeared in Smithsonian Magazine
Joel Kotkin is executive editor of NewGeography.com and is a distinguished presidential fellow in urban futures at Chapman University. He is author of The City: A Global History . His newest book is The Next Hundred Million: America in 2050
 , released in Febuary, 2010.
Photo by clevercupcakes
 “High Rise or House with Yard” stands alone in claiming that New York City is less costly than its suburbs. The most recent (and authoritative) ACCRA cost of living index for Brooklyn is a
 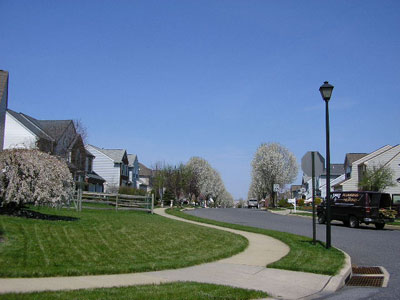 Combined, the fastest growing suburbs and exurbs with more than 25,000 population grew more than 3.5 million, while the municipalities outside the major metropolitan areas grew 1.5 million, for a combined growth of more than 5.0 million. The smaller high growth municipalities (under 25,000), nearly 1,200 of them, both major metropolitan and outside, grew another 2.5 million.