Category: Suburbs

  • Mobility on the Decline

    Faced with an economic downturn and a bursting real estate bubble, Americans look to be staying put in greater numbers. According to Ball State demographer Michael Hicks, interviewed in an article examining the trend in the San Francisco Chronicle, “Property values have dropped so much, people can’t pick up and move the way they used to.”

    In April, the Census Bureau reported that in 2008, the “national mover rate,” declined to 11.9 percent, down from 13.2 percent in 2007. This marks the “lowest rate since the bureau began tracking these data in 1948.” As William Frey, a demographer at the Brookings Institute, puts it, “the most footloose nation in the world is now staying put.”

    According to Frey, the middle of the decade was marked by a “mobility bubble,” spurred on “by easy credit and superheated housing growth in newer parts of the Sun Belt and exurbs throughout the country”. As the recession took hold through 2008, migration to suburbs and exurbs fell “flat in a hurry,” showing “just how rapidly changing housing market conditions can affect population shifts.”

    While, as Frey suggests, people may be moving into suburbs and exurbs at a slower rate, central cities within metro areas continue to lose population. The Census Bureau reports that during 2008 “principal cities within metropolitan areas experienced a net loss of 2 million movers, while the suburbs had a net gain of 2.2 million movers.” While the downturn in migration may help central cities hold onto some of their population, Frey contends that “it remains to be seen whether the migration-fueled engines of the early 2000s—especially the Sun Belt and outer metropolitan suburbs—will regain their former status.”

  • Exurban Growth Greater than Central Growth: Census Bureau

    The US Bureau of the Census has just released an analysis of suburbanization showing that the nation continues to suburbanize, despite the consistent media “spin” that people are leaving the suburbs to move to core cities.

    The report, Population Change in Central and Outlying Counties of Metropolitan Statistical Areas: 2000 to 2007, goes further than our previous 2000 to 2008 analysis that showed strong domestic outmigration from central counties to suburban counties and beyond.

    Our report compared trends between the core county (such as the 5 county New York City core) of each major metropolitan area. The new report compares population trends between what it terms “central counties” and outlying counties. The Bureau of the Census considers any county in the metropolitan area that is generally beyond the urban area (urban footprint) to be outlying. Thus, in Chicago, the report considers not only the core county of Cook, but also 9 additional counties as around it as central (Figure 1). Not surprisingly this means the bulk of the metropolitan area population is in the central counties (92%), however there is rapid movement even further out to the outlying counties.

    This Bureau of the Census report tells us more about exurbanization than suburbanization. Exurbanization might be thought of growth that occurs outside the urban area, including its historic suburban periphery. It represents, if you will, “sprawl beyond sprawl”. You usually can tell when you are in an exurb because you have to drive through countryside to get to the “city” (For definition of urban terms, such as metropolitan area, urban area and city, see this document).

    Between 2000 and 2007, these outlying counties grew 13.1 percent, nearly double that of the central counties, which includes the suburbs, at 7.8 percent (Figure 2). The report goes on to compare detailed results for the 12 metropolitan areas with more than 2,500,000 population that have outlying counties. In every case, the outlying counties grew faster than the central counties. On average, the outlying counties grew at 2.3 times the rate of the central counties (Figure 3).

    • In San Francisco, the outlying county growth was 25 times that of the central counties.
    • In New York, the outlying county growth was 10 times that of the central counties.
    • In Boston and Minneapolis-St. Paul, the outlying country growth was between four and five times the growth in the central counties.
    • In Baltimore, the outlying county growth was 3.5 times the growth in the central counties.
    • In St. Louis, Washington (DC) and Chicago, the country growth was between two and three times the growth in the central counties.

    The strongest central county performance occurred not in the much ballyhooed “cool” dense urban areas of the Northeast or Pacific Coast but in the largest metropolitan areas of the south, Atlanta, Houston and Dallas-Fort Worth.

    • In Dallas-Fort Worth the outlying county growth was 1.9 times the growth in the central counties.
    • In Houston the outlying county growth was 1.3 times the growth in the central counties.
    • In Atlanta, the outlying county growth was 1.1 times the growth in the central counties.

    The worst central county performance occurred in Detroit, where there was a net population loss. The outlying counties grew nearly 9 percent.

    It may seem surprising that the Bureau of the Census analyzed only 12 metropolitan areas. Regrettably, Census metropolitan area definitions makes a broader analysis virtually impossible. Many metropolitan areas do not have outlying counties. That does not mean they do not have outlying or exurban areas. Riverside-San Bernardino is a good example. At the eastern end of this metropolitan area, a recluse might live less than 40 miles from the Las Vegas strip, yet be separated by 175 miles of desert and mountains from the edge of the Riverside-San Bernardino metropolitan area. The problem is that most metropolitan areas are defined by counties, and some counties contain much more area than can reasonably be considered as part of the labor market.

    This fixation with county boundaries is unnecessary. Decades ago Statistics Canada figured out how to define metropolitan areas below the county level. The Bureau of the Census approach tends to obscure the growth of outlying areas, particularly in the largest counties. This is illustrated by our analysis of the Riverside-San Bernardino area from 2000 to 2006, which showed outlying areas to be growing at 2.5 times the rate of the core urban area.

    Nonetheless, the conclusion of the new report is clear. The nation’s most remote suburbs – its exurbs – are growing much faster than the central counties. Whether this trend will now reverse, of course, is up to debate. Perhaps demographic changes and higher energy costs will slow expansion on the outer fringes. More likely, the current recession may well lead to less exurban growth, but history suggests this may prove only a short-lived trend.

    Wendell Cox is a Visiting Professor, Conservatoire National des Arts et Metiers, Paris. He was born in Los Angeles and was appointed to three terms on the Los Angeles County Transportation Commission by Mayor Tom Bradley. He is the author of “War on the Dream: How Anti-Sprawl Policy Threatens the Quality of Life.

  • How Phoenix Will Come Back

    I have heard Paul Krugman say that ‘the end is nigh’ so many times that it seemed like the only sensible way to think about the housing market. It was identified as a bubble, and that could only mean that it would eventually burst. A steady diet of NYT editorials and Economist charts leave you with one conclusion — this is not going to end well.

    This certainly seems to be true in Phoenix. Even though I’ve lectured for years about ‘the growth machine’, how the economy in a city like Phoenix depends on building more homes, I did not expect the whole thing to collapse quite so precipitately, and with so many repercussions. The number of passengers going through the airport here is down 10% from last year; numerous restaurants, stores and other services have gone out of business, the State is trying to stare down a $3 billion deficit, the universities have fired hundreds of people—so the cycle keeps spreading like a slow motion disaster.

    Also predictable is the response. Local politicians are planning to slash the State budget and get government off people’s backs, once and for all. If we used foreign phrases such as ‘chutzpah’ around here, that would have to qualify. After all, it takes balls to watch the market behave like a bunch of drunks kicking Humpty Dumpty about, and then blame government for trying to put him back together again.

    Yet, at least here in Phoenix, it turns out that Professor Krugman hadn’t really got it figured out after all. As a rational man, he was distracted by the irrational exuberance of the market, the unsupportable ramping up of property prices, the NINJA loans, and the cynical exploitation of those arriving late to the party, those doomed to buy at the top of the market and be left holding fake mortgages on homes with phony values. The solutions seem simple. More oversight from Big Brother and everything can be fixed. Or, if you prefer to listen to the bizarro-world script over on AM radio, the black helicopters are about to start landing on Wall Street as the UN takes over to install European-style socialism.

    Yet much of this commentary is laughably wrong. The housing market debacle was not just predictable but actually utterly unavoidable. Some of this is simply a matter of money circulating around, which as Niall Ferguson’s book The Ascent of Money makes clear, this is as old as capitalism itself. The difference now is that digital technologies have made the speed of trading and transfer shift. The same rules apply, except that everyone must work harder to keep that cash flowing.

    What I now realize is that the entire economic system is based upon finding more risk. Without more risk in which to invest, the economy can’t keep moving. In other words, this wasn’t a series of calamities or errors or criminal mistakes — it is the market at work, no more, no less. And that is not going to change.

    What I thought I knew is not really so. I thought a bigger banking sector was not just more mysterious but was somehow more efficient and therefore safer; after all, health insurance works best if the risks are spread across larger and larger groups. Yet in reality finance is more like a vast Ponzi scheme. We should, in fact, let Mr. Madoff out of jail, as he was doing nothing particularly wrong — his only crime was that he wasn’t being clever enough in hiding his scheme in sufficiently obscure mathematics.

    What happens to the cities, towns and suburbs left devasted by the financial schemers? As James Surowiecki recently observed in the New Yorker, “banking grew bigger and more profitable but all we got in exchange was acres of empty houses in Phoenix.” So? Isn’t that a small price to pay? Given a choice, what would we rather have: a buoyant capital market and a few distant suburbs and downtown condos without any residents, or what we have today in some cities — double digit unemployment?

    There are real policy issues at work here. We were taught years ago, by the Marxists no less, that the purpose of a capitalist economy is to reproduce itself and the purpose of governments is to make sure that happens. So we make credit available to people; first to buy Model Ts, then to live in Levittown, then to play golf in Cancun, and so forth. And for this to work there has to be more risk in which to invest, an endless supply of new things. Housing has served us well in this regard; people live in condos and McMansions, people sell them, people build them, people manufacture the fixtures and fittings. This is how the growth machine, particularly in places like Phoenix, works.

    An economy like Phoenix is like a shark – it can’t stop, it can’t even run slow. We have to find more buyers — or perhaps we just build the homes now and fill them in the future when the population increases. Or, in line with a previous posting, we should have solved the immigration problem, and the need to sell more homes, by legalizing the Latino population and making them creditworthy.

    In this sense, maybe all this focus on the Valley’s 65,000 foreclosures is a mistake. As I argued last year, perhaps they should just be turned over to rentals and let the market sort it all out; predictably, rents are now coming down in apartment complexes as more families find affordable homes to rent.

    What we need is not to stop the market from repairing itself but we need to do it in a more creative way. Some of those suburbs are looking a bit down at heel, and the homes weren’t that sturdy to begin with — so let’s bulldoze them and do some serious brownfield redevelopment. Perhaps build them right, more sustainably, and less dependent on distant employment centers

    We can all get back to work, we can all feel virtuous as no new desert is being bladed, the infrastructure is already paid for, the journey to work costs will be less, the density perhaps a little higher with more jobs, offices and retail located closer to the houses.

    This approach will let us build more homes and get some more risk back into that market. Let’s repurpose the land. Then we can go back to business as usual, and if I was a betting man, that’s exactly what we are going to do.

    Andrew Kirby is the editor of the interdisciplinary Elsevier journal “Cities.”This is his 20th year as a resident of Arizona.

  • Sustaining Localism in the English Suburban Context

    Localism, a longstanding agenda of the Green Party in the context of the UK economy, is gaining ground in the current economic crisis. In a recent edition of the London-based Daily Telegraph, a striking contrast is made between Chester in north-west England – which is suffering from the decline of its relatively narrow economic base and Totnes in south-west England, which with its longstanding interest in alternative living, and more localised economy, seems to be weathering the situation much better. The underlying message from the article is that small is good – particularly for businesses not overextended in their borrowing, and familiar enough with their immediate context to be able to adapt to a changing economy.

    The New Economics Foundation think-tank, has been for several years campaigning against Clone Town Britain (namely, the over preponderance of chain stores at the expense of small chains and independent stores). Past criticism of the foundation for having an overly romantic notion of what constitutes a successful town centre may still continue, but there may also be some economic logic to a more locally oriented town centre strategy.

    Perhaps the best approach is to avoid either free-market efficiency ideology, on the one hand, or a strict local-only approach. It seems clear from other recent research into successful suburban town centres that a combination of national chains and good quality independents makes for the best mix to ensure long-term economic sustainability.

    This issue, like perhaps too much else in Britain, is currently subject to government action. The new Sustainable Communities Act now makes it mandatory for the UK government to assist local councils and community ‘stakeholders’ in drawing up local sustainability strategies for enabling independent businesses to survive in the increasingly cut-throat high street (the equivalent of the US ‘main street’).

    Yet as usual the government seems to overlook where most people live: the word suburb or suburban is nowhere in the Act. Possibly this is not surprising as the main focus is on large scale, infrastructure projects, but the continuing lack of attention in policy terms to the suburbs should be a matter of concern to those who believe a diffuse network of connections is essential to the continuing sustainability of the economy.

    It is equally worrying to see that the influential group set up by London’s Mayor Boris Johnson to focus on the outer London suburbs (which are cited as being his main source of political support in the mayoral elections) continues the pattern of focusing on the larger metropolitan centres at the expense of the smaller suburban centres in the capital. At an ‘Outer London Summit’ held on 11th June, Mayor Johnson made it clear that the policy focus continues to be on strengthening a constellation of “growth hubs” of economic activity, such as the metropolitan centre of Croydon in south London, despite the clear evidence demonstrating how smaller centres have an important role in making suburbs more sustainable.

    Within the next 20 years, most housing growth in England and Wales is predicted to occur in suburban settlements. This development is expected to be sustainable economically and environmentally, which means that suburbs will increasingly be required to provide local economic activities in order to minimise travel and to support cohesive and vibrant communities.

    The Towards Successful Suburban Town Centres research project at University College London has investigated the strategic contribution of Greater London’s smaller and district centres to the sustainability of the metropolitan region. ‘Sustainability’ in interpreted by the project team as referring to conditions favourable to local concentrations of long-lasting socio-economic and cultural activity.

    The research also has found that the widespread perception of suburbia as synonymous with social and architectural homogeneity belies its spatial, social, ethnic and economic diversity. With pressure to build large numbers of new homes increasing, there is a real danger that such perceptions become self-fulfilling.

    Initial findings suggest the success of local centres depends on the ability of their built environments to adapt to social and economic change by allowing pedestrian movement around an extended central area, balanced with accessibility to vehicular and public transport at larger scales of movement. Centres that support a wide range of locally generated activity are likely to be more resilient in the face of change than retail or purely residential monocultures. The results show that spatial variety and economic adaptability are both crucial to economic sustainability.

    This adaptability inherent to the suburban built environment needs to be more widely understood and promoted. The Towards Successful Suburban Town Centres project has found that where the town centre supports a diverse range of activities it benefits from increased by-product movement, where people do more than what they deliberately came to do during their visit to the centre. People visiting local town centres such as Surbiton (made famous by the 1970s BBC sitcom The Good Life), are not like shoppers at a ‘power centre’ dominated by a Wal-Mart. They don’t just shop for a specific item; they linger, eat lunch, drink coffee, research local cultural activities and indeed might be there for a business meeting. Surbiton, like many of London’s smaller town centres, has close links to larger centres such as Kingston, which alongside retail, offices and a university, boasts the new Rose Theatre led by Sir Peter Hall.

    The benefits here go well beyond the strictly economic. More time spent locally leads to a more vibrant mix of people on the streets and helps enliven the town centre throughout the day. This street network potential provides a critical element for sustaining the vitality of suburban and small town centres. The extensive and varied activity in lively areas enables complex routine daily and weekly movement patterns to emerge, thereby furthering the engagement of individuals with their locality.

    With the closure of chains such as Woolworths, however tragic for long-time customers and employers, the economic downturn also opens up opportunities for alternative high street activities. In one example, Art Space + Nature, an avant-garde Scottish art collective, have produced plans to bring new activities to empty shop fronts by putting on art exhibitions. The Institute of Community Cohesion is working on plans to create new indoor markets for local communities in closed business units.

    These and many other grassroots initiatives are localist at heart. The key may be in making sure that these attempts remain grassroots, and not too impacted by either large governmental units or major non-profits. To succeed, localism must be properly bedded in the community. Economic trends, as well as history, demonstrate that a bottom-up approach to creating lasting viable communities works not only in cities, but in suburbs as well.

    Laura Vaughan is a Senior Lecturer in Urban and Suburban Settlement Patterns and the Director of the MSc in Advanced Architectural Studies at the Bartlett, University College London and a member of UCL’s Space research group.

  • The Geography of Class in Greater Seattle

    Most readers may not be initially very interested in the detailed geography of “class” in Seattle, but it actually matters not only for our area but for the whole debate over the shape of the urban future. Academics, perhaps Americans in general, are loath to admit to class differences, yet they remain very crucial to the understanding of how cities and regions evolve.

    Seattle is a great example of the transformation of a 20th century model of the American metropolis to a 21st century-cum-19th century “old World” model of metropolis. It is often held up as one of the role models for other cities, so its experiences should be considered seriously not only for American cities but for regions throughout the advanced world.

    Many readers, including those afflicted with political correctness, probably many upper and lower class folk uncomfortable with their home areas being labeled as of a particular class, or others, might feel that class is an obsolete Marxist term. They may prefer I use the safer term “socio-economic status” rather than “class.” Let’s admit it: “class” is used widely, as in “the middle class is getting squeezed” or the “tax burden on the lower classes.” As it has been for hundreds of years, class remains a meaningful descriptor of areas of obviously differing well-being.

    We should understand by identifying upper or middle or lower classes this does not imply “better than.” Class simply reflects the mix of inheritance, education, biology, experience, discrimination, and life events that lead to variability in economic well-being. Class is real. But there is certainly a legitimate concern with the identification of heterogeneous areas like census tracts as of a particular class, based on average or median values for the in fact diverse households in a tract. This method is far from perfect but nevertheless we and others find such generalization common, meaningful and useful.

    This map plots “factor scores,” a statistically constructed variable or index divided into six levels of “class:” two upper, two middle and two lower. It is timely to do this, since it was 50 years ago when Calvin Schmid, demographer in Sociology at the University of Washington, and my early mentor, performed a pioneering factor analysis of crime in Seattle – and this was before modern computers! The derived scores most reflect high weighting of the variables: percent of adults with a BA or more, percent in professional versus laboring occupations, median house value and median household income.

    As you look at the map, it’s clear how Seattle reflects very strongly what is generally described as gentrification. This means the reclaiming of the central core by the highly educated and professional, eschewing the suburban metaphorical desert. In the case of Seattle, this process occurring between 1985-2005 resulted in the displacement of over 50,000 less affluent and often minority households to south King county. The city begins to resemble the historic pattern of the rich and important occupying the vibrant core of the city, relegating the working poor to the suburbs, with poor access and inadequate services. Indeed, even now I am involved in a project to assess the lack of access of poor children, often minority or foreign born, to health care in south King county.

    The dominant “upper class” area is the Eastside, east of Lake Washington, and location of the affluent “edge city” of Bellevue, home of the Microsoft campus. A second set of upper class areas are waterfront and view neighborhoods, taking advantage of the Seattle area’s broken topography. The third is simply the University of Washington immediate hinterland. I suspect the location of a large research university with 42,000 students and 22,000 staff increasingly propels Seattle’s unusually high status, income and popularity. I think this is increasingly more important a factor than the presence of an increasingly less important downtown Seattle business center.

    Conversely, lower class areas include traditional zones of mixed housing, industry and transport, such as south Seattle, the older satellite cities of Everett (north), Bremerton (west), and especially Tacoma (south). The largest area of lower class neighborhoods extends from south Seattle through south King county to Tacoma, marked by historical development, displacement from Seattle and high minority population. The second large zone of lower class settlement is the rural fringe, especially in Pierce (south) and Snohomish (north) counties, and may surprise those who think all rural areas are the home of rich estates.

    Then there is the middle class. This is where the suburbs matter most. On the map, middle class areas (yellow and green) are intermediate in location as well and dominate the outer suburban areas as well as some older inner neighborhoods of Seattle and Tacoma. It is unfortunately true that race, ethnicity and class remain highly correlated especially within the core cities of Seattle and Tacoma, reflecting the continuing history of unequal education and job preparation and prospects.

    This analysis suggests one possible future of urban development following something of a European model, with most middle class people in the suburbs, while the rich and poor concentrate either in the urban core or in selected locales in the periphery. As for the city itself, it’s clear that the total landscape is not simply becoming wealthier but increasingly bifurcated between the affluent and the long-term poverty population. And suburbia, home to the vast majority of the region’s population remains the predominant home of the middle and working classes, with pockets of both wealth and poverty.

    Richard Morrill is Professor Emeritus of Geography and Environmental Studies, University of Washington. His research interests include: political geography (voting behavior, redistricting, local governance), population/demography/settlement/migration, urban geography and planning, urban transportation (i.e., old fashioned generalist)

  • Farmland Prices: The Cost of Growing A Suburb

    Summer in Minnesota – land of 10,000 lakes — is, for many families, about boating, with the Harley the preferred mode of ground transportation. In winter, snow mobiles are popular. Hunting and fishing replace the corner coffee shops as hangouts. Three car garages are considered a minimum – four even better!

    So how did it come to pass that out-of-control land prices would destroy the economics of housing in this small-town region? And why was the pattern repeated in markets like Las Vegas and Phoenix?

    In the 1980’s the Metropolitan Council in Minneapolis became concerned with sprawl. The MET Council thought Portland, Oregon’s policies to control sprawl by creating an Urban Boundary would be beneficial to the Twin City area, a seven county region. This area is topographically simple: no ocean boundary, and, unlike Portland’s region, no mountain ranges. The MET Council did not anticipate that their attempt to control growth would end up contributing to it.

    Farmers who owned land with sewer capacity outside the boundary knew that its value had just skyrocketed. When a supply — land — is limited, those that control it can name their own price. Within the boundary land was too expensive to develop affordable housing. So cities outside the MET Council’s control began to attract developers. Places that nobody had heard of much: Otsego, Albertville, Elk River, and Hugo are all a very long drive from the Twin City core. These towns had two important components for builders: city sewer and cheap land.

    As the tiny towns outside the Urban Boundary attracted more development, they also attracted the national developers. All of the nation’s Top Ten Home Builders discovered this region. Each year 25,000 or so new homes were built and quickly sold to suburbanites who preferred a 30 to 40 mile commute over living near the city core. (Keep in mind that Minneapolis / St Paul has one of the nicest core areas of a major US city. Even downtrodden sections look pretty nice. And Minneapolis stays alive in the evenings and becomes a social Mecca that is also relatively safe.)

    Much of the escalation in home pricing was due to a bidding war over developable farmland. National builders, using their Wall Street dollars, competed for desirable acreage. If Farmer Fred was able to sell his property for $50,000 an acre, when Roy next door put his farm up, the starting price was $50,000 and the final fee was likely to be $60,000, the starting point of the next site for sale. By 2005 the outer small town land that could have been bought for $12,000 an acre a decade earlier was worth more than 10 times that amount.

    In the past, builders would look at the price of a finished lot, and assume that the house they built on it would cost a maximum of four times the finished lot price; a sort of “one-quarter” rule for land costs. If the lot cost $30,000, they would not build a home that ultimately cost more than $120,000.

    By 2005, if outer suburban land sold for $150,000 an acre and the density (after required park areas, wetlands, buffers, and shoreline zones) was two homes per acre, that meant that $75,000 of a new suburban home was in raw land costs. Add to that $25,000 in construction of roads, utilities, fees, etc, and the lot price skyrocketed to $100,000. Using the one-quarter rule, this meant the builder would need to get $400,000 for the finished home.

    At the 2006 Land Development Today Breakthroughs conference I spoke about our research into the impending market crash and its basis. The market had just begun to show signs of slowdown, and nobody was predicting a big fall.

    Our “study” was based on a comparison of our local housing market in the Minneapolis region with markets where we were working in about 40 States. It involved a simple search of major builders in the top markets. We looked at areas where land prices were escalating much faster than inflation in order to see the common elements. The National Association of Home Builders average national price for a 2,400 square foot average home was $264,000. It should be no surprise that impromptu results indicated the average price of a 2,400 square foot home in Phoenix was $331,000 (20% above average), in Las Vegas $442,000 (40% high), and in the Minneapolis suburbs $349,000 (25% high).

    Weather was not one of the common elements. But all three areas — Las Vegas, Phoenix, and the Twin Cities — had explosive growth for two decades until 2007 (2006 for the Twin Cities), and all three had most, if not all, of the nation’s Top Ten Home Builders selling and building.

    In March of 2005 one of my clients made me an offer. If I convinced a certain farmer to sell, I would receive not just the planning fees, but also 5% of the profits. The land in question was about an hour’s drive from the urban core during rush hour traffic. I looked at the site and took out the slope restriction, the Department of Natural Resources tiers, the wetlands, the buffers, and the land that was otherwise not buildable, including the rolling surface areas that resembled more Moto-Cross course than residential developable land.

    The cost for the remaining buildable area would have been about $300,000 an acre. The numbers simply did not work out. Land prices had reached the breaking point. Since there was no possible way to profit, my 5% of zero would still be zero. I suggested that my client not do the deal, and saved him from financial ruin.

    It’s easy to make Government the scapegoat. Even though the MET Council set in motion policies that likely caused sprawl by trying to curb it, it was not the cause of land prices going out of control. All the major developers with their deep pockets outbidding each other for over a decade was what did the economics in. Today, housing prices in the Twin City market have plummeted to a more realistic point that is about what the national average was in 2005.

    Five years before the crash many actually believed that high land prices were a sign of a great economy. Well guess what? They were wrong.

    Rick Harrison is President of Rick Harrison Site Design Studio and author of Prefurbia: Reinventing The Suburbs From Disdainable To Sustainable. His websites are rhsdplanning and prefurbia.com.

  • The Fate of America’s Homebuilders: The Changing Landscape of America

    During the first ten days of October 2008, the Dow Jones dropped 2,399.47 points, losing 22.11% of its value and trillions of investor equity. The Federal Government pushed a $700 billion bail-out through Congress to rescue the beleaguered financial institutions. The collapse of the financial system in the fall of 2008 was likened to an earthquake. In reality, what happened was more like a shift of tectonic plates.

    History will record that the tectonic plates of our financial world began to drift apart in the fall of 2008. The scale of this change may be most evident in housing.

    PART TWO – THE HOME BUILDERS

    For decades, home ownership epitomized the American dream. For years, Americans saved their money for the required 20% down payment to purchase their dream home and become part of the great American Middle Class. They saved their money in a special account at the local savings & loan that paid a little more interest than the banks. Interest rates were fixed by law. A typical mortgage was written at a fixed rate for 30 years. Most American home owners stayed in their homes and celebrated the pay-off with a mortgage burning party.

    In this arrangement, it was understood that the savings & loans were allowed to pay more interest because they provided long term home mortgages. They paid depositors 4 – 5% and lent money at 6% making a little profit on the arbitrage for their risk. With a 20% down payment, there was little risk. Mortgage bankers knew the homes they lent money on and more importantly, they knew their clients. The mortgage stayed on the books at the local savings & loan until paid.

    In this time, home builders were mostly small local shops known by their customers and the lenders. For decades the industry was quite stable. Homes averaged 1,400 square feet in 1970 according to the National Association of Homebuilders. A quality home could be purchased for under $20,000. Not everyone could afford to buy a home but almost everyone aspired to this. Savings & loans provided 60% of all home mortgages.

    The first crack in the dam appeared in the late 1970s. Under President Jimmy Carter, America suffered double-digit inflation. As the value of the dollar eroded, Americans sought investments that could protect their dollars from the ravages of inflation. Regulation D prohibited banks from paying interest on checking accounts. A tiny bank in Massachusetts, the Consumers Savings Bank of Worcester, Massachusetts introduced the NOW Account (Negotiable Order of Withdrawal) and began paying a higher rate of interest than the savings & loans. Money flooded into the bank.

    The Depository Institutions Deregulation and Monetary Control Act of 1980 began the six-year process of phasing out limits on interest rate. Money flowed out of savings & loans and into NOW accounts and MMDA accounts (Money Market Depository Accounts). The S&Ls, with long term fixed loans on their books and short term money leaving for higher rates at the banks, never fully recovered. The primary source of funding for America’s home building industry was changed forever.

    In the late 1980s the S&L industry attempt to recapture market share by entering the equity side of real estate development with disastrous consequences. The government was forced to seize most of the S&Ls and sell off their assets through the Resolution Trust Company (RTC). In 1989, Congress passed TEFRA, the Tax Equity and Fiscal Responsibility Act that effectively outlawed direct ownership of property by S&Ls. It was a death blow to the industry and the end of the 30-year home mortgage as we knew it.

    This is where the seeds of the current housing disaster and financial meltdown were sown. Wall Street and politics entered the financial vacuum left by the demise of the savings & loan industry. The Garn-St Germain Depository Institutions Act of 1982 introduced the ARM (adjustable rate mortgage) which allowed rates paid to depositors to balance rates charged to borrowers. Our politicians, filled with good intentions, began down an irreversible path of using the home mortgage for social engineering.

    Seeking to increase homeownership, Congress began to unwind the financial safety net that protected the American dream for nearly 100 years. An ugly brew was concocted with the marriage of too much money and too much power. Congress began to consider housing as a right instead of a privilege.

    Over the ensuing quarter century, Wall Street and Congress conspired to turn the traditional 20% down, fixed 30 year mortgage on its ear. In 1977, they passed the Community Reinvestment Act that outlawed red-lining and forced lenders to make loans to poor neighborhoods. In 1982, they passed the Alternative Mortgage Transactions Parity Act (AMTPA) that expanded the funding and powers of Fannie Mae and Freddie Mac by lifting the restrictions on adjustable rate mortgages (ARM), balloon payment mortgages and the Option ARM (negative amortization loan). When a savings & loan made a mortgage in the past, they held it for 30 years or until paid. Freddie and Fannie became the new absentee owner of the majority of mortgages by purchasing them from the originators in the secondary market.

    Thus the die was cast. Mortgage bankers and brokers became salesman and paper pushers packaging applications for the secondary market and financial investors who never saw the asset they lent money against or met the borrowers for whom they made the loan. But this was not enough to satisfy the greed of Wall Street which invented the CMBS (commercial mortgage backed security) in 1991. This was nothing more than a private label pool of mortgages that they sold off to equally unconnected financial investors in their own secondary market. Home mortgage lending by commercial banks went from nothing to 40% of the market in a matter of years.

    The market could have possibly tolerated this bastardization of the conventional mortgage but neither Congress nor Wall Street could control themselves. There was simply too much money to be made. Congress determined that the credit score was discriminatory and violated the rights of the poor and minorities. In 1994, Congress approved the formation of the Home Loan Secondary Market Program by a group called the Self-Help Credit Union. They asked for and received the right to offer loans to first time homebuyers who did not have credit or assets to qualify for conventional loans. Conventional 80% financing was replaced with 90% loans and then 95% and finally 100% financing that allowed a home buyer to purchase a home with no down payment. The frenzy climaxed with negative amortization loans that actually allowed homes to be purchased with 105% financing.

    In June of 1995, President Clinton, Vice President Gore, and Secretary Cisneros announced a new strategy to raise home-ownership to an all-time high. Clinton stated: “Our homeownership strategy will not cost the taxpayers one extra cent. It will not require legislation.” Clinton intended to use an informal partnership between Fannie and Freddie and community activist groups like ACORN to make mortgages available to those “who have historically been excluded from homeownership.”

    Historically, a good credit score was essential to receive a conventional mortgage. Under pressure from the politicians, lenders created a new class of lending called “sub-prime” and as these new borrowers flooded the market, housing prices rose. Lenders used “teaser rates”, a form of loss leader, to help the least credit worthy to qualify for loans.

    Congress instructed Fannie and Freddie to purchase mortgages even though there was no down payment and no proof of earnings by the applicant. An applicant could “state” his or her income and provide no proof of employment. Stated income loans eventually became known as “liar loans”. Sub-prime loans grew from 41% to 76% of the market between 2003 and 2005.

    This devilish brew caused a record 7,000,000 home sales in 2005, including more than 2,000,000 new homes and condominiums. Mortgage lending jumped from $150 billion in 2000 to $650 billion in 2005. Prices rose relentlessly, pushed by more and more buyers entering the market. The top 10 builders in the United States in 2005 were:

    1. D.R. Horton – 51,383 Homes Built
    2. Pulte Homes – 45,630 Homes Built
    3. Lennar Corp. – 42,359 Homes Built
    4. Centex Corp. – 37,022 Homes Built
    5. KB Homes – 31,009 Homes Built
    6. Beazer Homes – 18,401 Homes Built
    7. Hovnanian Enterprises –17,783 Homes Built
    8. Ryland Group – 16,673 Homes Built
    9. M.D.C. Holdings – 15,307 Homes Built
    10. NVR – 13,787 Homes Built

    Economists and pundits eventually began to identify the phenomenon as the housing bubble. And, bubbles burst. But Congress was not ready to confront reality. Rep. Barney Frank testified he “saw nothing that questioned the safety and soundness of Fannie and Freddie”. Fannie Mae Chairman Franklin Raines was paid $91.1 million in salary and bonuses between 1998 and 2004. In 1998 Fannie’s stock was $75/share. Today it is 67 cents.

    In 2007 as prices stopped rising, the flood of buyers entering the market ceased putting market values into a free-fall. Home building is not a nimble industry. It takes years of planning and development to bring a project to market. America’s homebuilders had hundreds of thousands of homes and condos under construction when the housing market came to a crashing halt in the fall of 2008. New home sales, which topped 2,000,000 units per year in 2005, fell to an annual level of under 400,000 units in early 2009. Prices have retreated to 2003 levels and in some markets even lower.


    What happens to America’s home builders? Do they follow General Motors and Chrysler into bankruptcy? Can they survive? New home sales are down 80% since 2005 – doing worse even than automobile sales. The tectonic plates of the housing industry are shifting rapidly and have not settled into any discernible pattern.

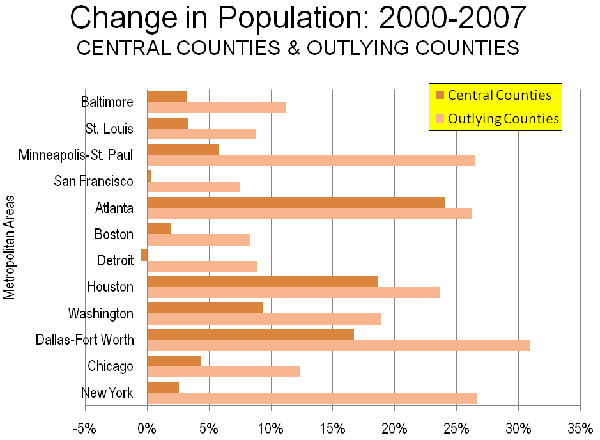
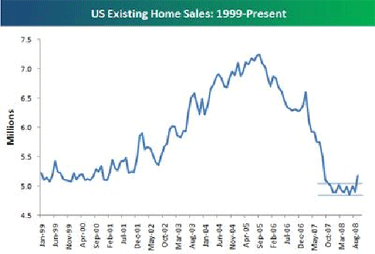
    Residential land has dropped precipitously in value but a case can be made that raw residential land now has a “negative residual value”. There are hundreds of thousands of completed but unsold, foreclosed, and vacant, homes littering the countryside. The chart above demonstrates how dramatically sales have fallen since their peak in 2005. This “overhand” inventory must be cleared out before any recovery can ensue. The prices of these units must be cut by draconian margins to attract the bottom fishers and speculators who will take the risk from the home builders and purchase the outstanding inventory. This will not happen quickly. This is not a market that can generate an early rebound.

    Has Congress learned from its mistakes? Apparently not. In March 2009, Democratic Representatives Green, Wexler and Waters introduced HR600 entitled “Seller Assisted Down Payments” that instructs FHA to accept 100% financing from those who cannot fund the required 3.5% down payment.

    A year from now the landscape of America will be forever changed. Five years from now, will American ingenuity have revolutionized the home building industry? The imperative is to find homebuilders who can speed production and lower costs. And government needs to learn from its own mistakes and realize that a successful housing sector depends on solid market fundamentals as opposed to pursuing an agenda of social engineering.

    ***********************************

    This is the second in a series on The Changing Landscape of America. Future articles will discuss real estate, politics, healthcare and other aspects of our economy and our society. Robert J. Cristiano PhD is a successful real estate developer and the Real Estate Professional in Residence at Chapman University in Orange, CA.
    PART ONE – THE AUTOMOBILE INDUSTRY (May 2009)

  • San Jose, California: Bustling Metropolis or Bedroom Community?

    Dionne Warwick posed the question more than 40 years ago, yet most Americans still don’t know ‘The way to San Jose’. Possessing neither the international cachet of San Francisco nor the notoriety of Oakland, San Jose continues to fly under the national radar in comparison to its Bay Area compatriots. Even with its self-proclaimed status as the ‘Heart of Silicon Valley’, many would be hard pressed to locate San Jose on a map of California.

    More well-known American cities may try to gain population by branding themselves as interesting places, but San Jose does not struggle to attract newcomers. Sprawling over 178 square miles, San Jose sits at the southern end of the San Francisco Bay. This year the city exceeded the 1 million population mark for the first time.

    So what makes this city, the 10th-largest in the United States, appealing? Unlike its precious neighbor 50 miles to the north, San Francisco, people move to San Jose primarily for jobs – especially those related to the coveted technology sector. Whereas San Francisco balances its role as playground for the independently wealthy and welfare state for the lumpenproletariat, San Jose remains favored among families and those looking for a safe environment in which to raise children – not to mention, the weather is better.

    San Jose does not stimulate a sense of urban exaltation. Aside from a commercial downtown core with a collection of mediocre high-rises (limited in height due to do downtown’s adjacency to the San Jose Airport), the city is unapologetically suburban in a character.

    San Jose’s pattern of development can be traced back to its origins as an agricultural community supporting early Spanish settlers who chose to settle in the fertile Santa Clara Valley. It remained a modest-size agrarian community until the end of World War II when it underwent a period of rapid expansion-not unlike that of Los Angeles to the south. During the 1950s, with the emergence of semiconductor technology derived from silicon, San Jose and the greater Santa Clara Valley exploded into a center for the evolution of computer technology.

    Today, San Jose can best be understood by its ambivalent relationship with neighboring Silicon Valley cities. Mid-size suburbs such as Cupertino, Sunnyvale, Mountain View and Palo Alto, all located west/northwest of San Jose as one travels up the peninsula towards San Francisco, are very distinct and separate entities. Home to some of Silicon Valley’s heaviest hitters (Cupertino has Apple, Sunnyvale has Yahoo!, Mountain View has Google, Palo Alto has Hewlett-Packard, Facebook and Stanford University), these cities largely define the technology-focused region. To be sure, San Jose’s has its share of big players, including eBay and Adobe as well as the ‘Innovation Triangle’, an industrial area of north San Jose, home to the headquarters of large companies like Cisco Systems and Cypress Semiconductor.

    Yet, despite the presence of these firms, San Jose has become ever more a residential community, with among the worst jobs to housing balances in the region. Furthermore, a whopping 59% of the city’s developed land constitutes residential use – 78% of that being single-family detached housing. In this sense, despite being the largest city, San Jose essentially serves as a ‘bedroom community’ for the rest of Silicon Valley.

    This has been a burden for the city, which, unlike its neighbors, lacks enough large information technology companies to help fill their tax coffers. In contrast job rich ‘green’ cities like Palo Alto have remained staunchly ‘anti-growth’ regarding residential development and consequently have very high housing prices.

    This pattern poses fiscal problems for San Jose. City officials have long been aware of the need to stimulate economic development instead of continuing to lose out to its neighbors but the city seems determined to increase further its role as dormitory for its neighbors. Indeed, amazingly the city’s development agenda has in recent years shifted to a relentless focus on high-density, multi-family residential in the downtown core and along transit corridors. In 2007, 79% of all new housing built in San Jose was multi-family – a staggering deviation from its history of low density development.

    Though well-intentioned, the slant towards densification has yielded a glut of empty condo units throughout the city. Those that have purchased units in new developments often find themselves with underwater mortgages. During a recent visit to one the flashy new downtown condo buildings, The 88, I entered a desolate sales office and was greeted by a skittish sales agent. When asked how sales were, my question was deferred without a direct answer in an act of not-so-quiet desperation.

    Although it’s clear most people in San Jose prefer lower density living, the city government continues hedging tax dollars against a future in which newcomers will want to live in a high-density setting. Outside of downtown, low to mid-rise multi-family housing has been built along the city’s light-rail lines in what are conceived to be ‘transit villages’. The popularity for such a lifestyle is questionable given the high price point and unreasonable HOA dues of these condo units, particularly when single-family detached houses can be purchased at comparable prices.

    Despite these issues, San Jose seems hell-bent on its path towards densification. The city has major plans to develop the area around its Diridon Train Station, just west of downtown, as California High-Speed Rail and BART are projected to make their way to San Jose. Furthermore, the city government is counting on the Oakland A’s baseball team making a move to San Jose.

    From the Champs-Élysées to Tiananmen Square, grand urban visions are what have defined cities historically. As a product of the Silicon Valley ethos as well as an observer of planning trends, I would argue that this is no longer valid – especially for any city with the hopes of a prosperous future. Rather, in democratic societies, it will be the idiosyncrasies of individual actors and the prospect of upward mobility that will define a sense of place.

    Obsessed with density and urban form, planners don’t seem to grasp the chicken and egg conundrum – the notion that lifestyle amenities follow on the heels of economic opportunity. San Jose needs to cast its future on nurturing its entrepreneurs instead of trying to become something it is not yet ready to become.

    Adam Nathaniel Mayer is a native of the San Francisco Bay Area. Raised in the town of Los Gatos, on the edge of Silicon Valley, Adam developed a keen interest in the importance of place within the framework of a highly globalized economy. He currently lives in San Francisco where he works in the architecture profession.

  • City & Suburban Trends: Sometimes it Helps to Look at the Data

    Jonathan Weber writes that “Most demographic and market indicators suggest that growth and development across the country are moving away from the suburban and exurban fringe and toward center-cities and close-in suburbs,” in an article for MSNBC entitled Demographic trends now favor downtown: Growth across the country moves away from suburban and exurban fringe.

    One might wonder what country Weber is writing about. In the United States, growth and development continues to be concentrated in suburban and exurban areas. Moreover, strong domestic migration continues away from the center cities and close-in suburbs, as evidenced by the fact that between 2000 and 2008, 4.6 million domestic migrants left the core counties of the metropolitan areas over 1,000,000 population, while 2.0 million moved into the suburban counties.

    The case is apparently furthered by the obligatory reference and photograph of The Model, Portland, Oregon. However, even in Portland, the suburbs are doing far better than the core. Since 2000, the suburbs have gained 106,000 domestic migrants, while the core county (Multnomah) has lost 4,000 domestic migrants. The IRS micro-data further indicates that the core continues to lose net domestic migration to the suburban counties.

    It appears that the only trend indicating that the suburbs are losing out to central cities is the exponential increase in articles blindly parroting “death of the suburbs” dogma.

  • Moving Away from the City: The Reality Missed by the Fairfax County Survey

    Political “spin” descended to a new low today with the publication of survey results purporting to suggest that suburban residents and workers are pining for city life. The Washington Business Journal dutifully reported that Today’s suburban workers and residents miss the amenities of cities. The survey sponsor, the Fairfax County (Virginia) Economic Development Authority noted that “almost half of workers who work in the suburbs, say they want more public transportation, more housing options, greater access to useable green space or a better variety of job opportunities – typical features of cities.”

    All of this may sound impressive until you realize that no one urban “amenity” was mentioned by more than 25 percent of respondents. That means, for example, that 77 percent of responding suburban residents did not consider “access to convenient public transportation” important enough to mention, while 23 percent did.

    According to the Economic Development Authority, the survey indicates that 52 percent of residents “say they would move to a community that offered more of these” urban amenities.

    The survey got the moving part right, but missed by a mile on where they are moving. From 2000 to 2008, more than 100,000 domestic migrants left Fairfax County, 11 percent of its 2000 population. But they didn’t move to the city (Washington) or to more urban Alexandria or Arlington, because all of these lost domestic migrants as well. Indeed, the only counties in the Washington, DC area that gained domestic migrants are further from the city than Fairfax County.